Article

Impact of Tectonic, Glacial and Contour Current Processes on the Late Cenozoic Sedimentary Development of the Southeast Greenland Margin

Geophysical Department; Geological Survey of Denmark and Greenland (GEUS), 1350 Copenhagen, Denmark
*
Author to whom correspondence should be addressed.
Geosciences 2019, 9(4), 157; https://doi.org/10.3390/geosciences9040157
Submission received: 1 February 2019 / Revised: 19 March 2019 / Accepted: 21 March 2019 / Published: 3 April 2019
(This article belongs to the Special Issue Interacting Alongslope and Downslope Sedimentary Processes)

Abstract

:
To understand the geomorphological contrast between the northern and southern parts of the Southeast Greenland margin with its marked differences in sedimentary regime, bathymetric and seismic reflection, data have been compiled and analysed. While previous studies focused on selected parts of this margin, the present study provides an intergraded overview of the entire margin from Cap Farewell to Denmark Strait. The prominent north–south contrast shows a wide northern shelf and a narrow southern shelf. The origin of this width disparity can be traced back to the initial formation stage of the Irminger Sea due to regional differences in uplift versus oceanic subsidence. This regional tectonic discrepancy also created a difference in sediment accommodation space that, in combination with a weak ocean circulation regime, favoured formation of Oligocene–Miocene turbidite fan complexes along the lower southern slope. These fan complexes became the core of sediment drift ridges that strike perpendicular to the slope. Strong bottom currents, which gradually increase in strength towards the south, were mainly prevalent during warmer climate stages. During glacial periods, downslope transport of glacigenic sediments and hyperpycnal meltwater flow further shaped the large drift ridges and formed several relatively narrow, V-shaped turbidite channels extending towards the deep Irminger Sea basin. These V-shaped channels are still active today when cascading dense winter water from the shelf flows downwards along the shelf to the Irminger Sea basin.

1. Introduction

The Southeast Greenland continental margin is marked by a northern shelf which is almost ten times wider than the shelf further south, while the steepness of the slope increases from gentle in the north to very steep in the south. The margin represents a classic example of a rifted volcanic margin with its early development being characterised by the eruption of voluminous basaltic lavas [1,2,3,4]. The evolution of the Southeast Greenland margin was also strongly affected by glaciations. The Greenland Ice Sheet has contributed to the build out of the shelf [5], transferred glaciogenic sediments to the slope and led to the formation of canyons and levees at the lower slope [6,7,8,9]. Additionally, deep-water currents, which vary in strength through time, transport sediment along-slope leading to the development of drift deposits, the largest of which is located off Cap Farewell and known as the Eirik Drift (Figure 1). This drift accumulated on top of a basement ridge [10], under the influence of deep-water currents originating from the North Atlantic deep-water formation regions [11,12]. The sediment itself originates mostly from the Southeast Greenland margin [13], although there is also a substantial contribution of material from East Greenland sources more to the north [14].
Sediment drift deposition is not just confined to the Eirik Drift, but drift complexes can also be found more north-east [15]. Two previous studies [8,9,16] confirmed that current-induced sedimentation is actually going on northeast of Eirik Drift. Thus, most authors consider the Eirik Drift as the southernmost portion of a larger drift complex extending north-east along the Southeast Greenland margin [17]. The Erik Drift deposition was likely initiated in early Miocene [12], it has an older basement core [10] and can be ascribed to have been the result of northward deflection in contour current flow around the southern tip of Greenland. In contrast, the drift ridges found further north along the Southeast Greenland margin notably have a different pre-drift setting and depositional development. The high complexity of slope morphology, as well as the active slope and glacial processes here have resulted in a more atypical slope-perpendicular drift ridge shape where complex downslope-alongslope process’ interactions have played an important role.
Earlier papers [8,9,16] focused on the shelfal embayment area off central Southeast Greenland, and studied five drift ridges found between 61°30’–64° N (Figure 1) using seismic data, age information from Ocean Drilling Program (ODP) Leg 152 boreholes and local bathymetry maps made from seismic data combined with older bathymetric data. These studies found that the complex setting of downslope channels and slope-perpendicular drift ridge deposition at the lower slope were established in early Pliocene and developed by interaction between glacially derived, downslope mass-flows and variable alongslope bottom current actions. It was also found that during glacial stages downslope turbidity sediment input dominated and created channels and levees, while alongslope bottom current dominated the sedimentation pattern during interglacial stages by re-working of the levee deposits into the slope-parallel drift ridges [8,9,16]. It was concluded that the steep slope setting in the studied area resulted from erosion by strong contour current activity. It has been a matter of some debate what may have initiated the initial drift development [9].
The present study aims to supplement the work presented in these previous studies [8,9,16] by considering a much larger region spanning from 60° N to 68° N, and by adding new bathymetric information. In addition to further enhancing the knowledge of early margin development, we investigated (1) to what extent the pre-drift margin setting was a prerequisite for the north-south difference in the margin morphology, and (2) how this, in combination with the prevailing bottom current processes may have influenced variations in sediment supply and accommodation space. The overall purpose of our study has thus been to develop an evolution model suitable for the entire Southeast Greenland margin between 60–68° N, covering evolution stages from Eocene to Holocene.
Within this context, it should be noted that the amount of information available for the Southeast Greenland margin is not very extensive, and that most of the data and publications are several decades old. Our reassessment of the available datasets in combination with other, more recent geological information and the updated bathymetric map, will show how the early Cenozoic margin architecture has greatly influenced the later, overall development of the margin and the sedimentary processes involved, whether glacial, oceanographically-controlled, or gravity-driven.

2. Regional Setting

The Southeast Greenland shelf is bounded landwards by a variable geological scenario changing with latitude. The onshore area is made up by Precambrian basement rocks of old Proterozoic and Archaean age [1,19,20,21].
The East Greenland continental margin was separated by rifting and sea-floor spreading from the NW European margin during the Early Tertiary [22]. Extrusion of large plateau basalt deposits during the Late Palaeocene to Early Eocene [1,23] was associated with the early stages of the rifting process. In Southeast Greenland the first glacial conditions with tide-water glaciers reaching the coast are considered established in the middle Late Miocene around 7 Ma [24], or even 11 Ma ago [25]. Since the Early Pliocene, it has been concluded that the depositional environment of the Southeast Greenland margin is controlled by a combination of glacial processes, turbidity flow activity and contour-current action [9]. In the late Neogene the ice masses played an important role in the delivery of sediment to the shelf, slope, and basin [8,9,16,26]. Varying stages of progradation and aggradation most likely reflect successive phases in glacial evolution of the East Greenland shelf [27,28,29]. Thus, an expanding Greenland Ice Sheet resulted in the formation of large shelf-prograding wedges [5,9], and associated transfer of glacigenic sediments to the shelf edge and down the slope created canyons and ridges [6,8,9,30]. The main glacigenic sediment transport pathways across the shelf are represented by cross-shelf troughs that have been intermittently occupied by marine-terminating ice streams [31].
Another important sediment transport agent, which most strongly operates during warmer climate [26], is the boundary current system of southern Greenland. The currents adjacent to the Southeast Greenland margin are formed by Polar Water (PW) masses transported south by the East Greenland Coastal Current (EGCC) and the East Greenland Current (EGC), overlying south-flowing Labrador Sea Water (LSW), Iceland-Scotland Overflow Water (ISOW), and the Denmark Strait Overflow Water (DSOW) [32]. Each of these four main water masses (i.e., Polar Water, LSW, ISOW, and DSOW) is found along the Southeast Greenland margin at different depths, i.e., 0–500 m, 500–1500 m, 1500–2500 m and 2500–3000 m, respectively [32] (Figure 2C). Significant water-mass interaction and strong current activity here leads to a highly complex current pattern, which for the outer shelf and the uppermost slope has been referred to as the ‘East Greenland Spill Jet’ [33]. Through turbulent mixing [34,35] the mean flow speed of the different water masses increases along its path from Denmark Strait to Cape Farewell, and the main core of the current, known as the Deep Western Boundary Current (DWBC) [32], moves slowly deeper. Bottom currents, although with varying intensity, must have been active along this margin throughout the Neogene, as the Eirik Drift south off southern Greenland started to form already in the early Miocene, ca. 19 Ma ago [12,36]. However, it has been suggested that until the late Oligocene/early Miocene deep-water circulation may preferably have been present only in the eastern North Atlantic, indicating little contour current activity in the central and northern Irminger Basin [37].

3. Material and Methods

In addition to the bathymetric information (see below), this study is based on the compilation of seismic data collected during various surveys on the Southeast Greenland margin since the late 1960s until the late 1990s (Figure 1). The data set originates from very diverse seismic surveys with a variety of acquisition parameters, including both high-resolution single channel and conventional 2D multi-channel data available as files in segy-format or as scanned profile prints. Details about the acquisition parameters for the data acquired during the 1990s can be found in earlier publications [8,9,16]. Most of the data were in-house data at the Geological Survey of Denmark and Greenland (GEUS) (Figure 1). Complementary data were obtained from scanned microfilm of single channel seismic data from the National Oceanographic and Atmospheric Administration (NOAA) website [38] (Figure 1). Recognizable reflections were correlated between individual profiles. The stratigraphic information from ODP Leg 152 Site 918 [3,8,9] was used for seismic-to-core calibration (Figure 3) to determine the sedimentology and age range of the deposits. The bathymetric information for the study area was derived from the data set of the International Bathymetric Chart of the Arctic Ocean (IBCAO) [18] (Figure 1 and Figure 2 and Supplementary Materials Figure S1). The IBCAO version 3 with a 500 × 500 m grid spacing was used. This regional map is based on OLEX (seafloor mapping, navigation, and fishery acquisition system) as well as single beam sources [38]. The bathymetric data were analysed by creating bathymetric slope profiles and slope gradient classification. A north-south set of shelf-slope perpendicular profiles can be found in the supplementary information (Supplementary Materials Figure S2).

4. Results

Four main Seismic Boundaries (SB) were recognized on all profiles, defining a total of five seismic units (Units I–V), with Unit I being the oldest and Unit V the youngest (Figure 3). The base of the entire sediment package is marked by the Acoustic Basement Boundary (ABB) and the top by the seabed reflector. The intermediate Seismic Boundaries are named SB 1 to 4 from bottom to top (Figure 3). An intra-unit Seismic Boundary, SB 5, is locally recognized within the youngest seismic unit, Unit V, in the slope area.

4.1. Shelf

In general, the Southeast Greenland shelf dips landwards (Figure 4B and Supplementary Materials Figures S3–S8). It is up to 500 km wide in the northern part but narrows remarkably to 45–55 km width south of 63°30’ N (Figure 1 and Figure 2 and Supplementary Materials Figure S1). On the northern, wider shelf, there are two large shelf-crossing troughs with large plateaus in between (Figure 1 and Figure 2 and Supplementary Materials Figure S1). The plateaus have a rugged hummocky topography and a water depth of ca. 300 m, and the two troughs are up to 1000 m deep. Further to the south, shelf-crossing troughs are more common, but they are smaller and narrower and have irregular shapes (Figure 1 and Figure 2 and Supplementary Materials Figure S1). Some of these troughs are more channel-like and often follow a much more sinuous path than classic shelf-transverse troughs [5,31] (Figure 1 and Figure 2 and Supplementary Materials Figure S1).
Over the entire study area, the seismically determined thickness of the sedimentary package is generally thinnest on the inner shelf where outcrops of the ABB are common (Supplementary Materials Figures S3–S10). In the northern area with the wide shelf (Supplementary Materials Figures S3 and S4), the ABB outcrops at a distance of ca. 90 km from the shelf edge, while in the narrow shelf area to the south, the ABB outcrops already at ca. 20 to 50 km from the shelf edge (Figure 4B and Supplementary Materials Figures S5–S10). Throughout the shelf areas, the seismic reflection pattern is generally chaotic and non-continuous, and seismic boundaries are hard to distinguish. However, in some places a seismic boundary (SB 1) can be determined which is largely erosional and cuts into the sediments of the underlying unit(s) (Figure 4B).

4.2. Slope

The slope steepness changes drastically from a gentle 2 to 4° north of 64°50’ N to an extremely steep 8 to 16° south hereof (Figure 2B,D). The morphological characteristics of the slope change around 64°N. North of 64°N the slope is rather smooth, while south of 64° N several ridges protrude from the lower slope, perpendicular to the margin, with the largest ridges occurring between 63°30’ N and 61° N (Figure 1 and Figure 2 and Supplementary Materials Figure S1). These ridges are typically found downslope of the larger cross-shelf troughs (Figure 1 and Figure 2 and Supplementary Materials Figure S1) and are separated from each other by canyon-like incisions. The canyon heads start mid-slope between 1200 and 1500 m (Figure 1 and Figure 2 and Supplementary Materials Figure S1). On average, the ridges rise to about 800 m above the canyon floor.
The bathymetric profiles from along the ridge structures (Figure 2D: Profiles C, E, and F) display a marked mounded feature on the lower slope, seaward of a larger trough which can be traced further southwards representing a typical moat (Figure 2D: Profiles C–F). The profiles collected along the canyons between the ridges, do not show clear mounded features (Figure 2D: Profiles B and D).
The internal structure of the slope displays four main seismic boundaries (SB 1 to 4) (Figure 4 and Figure 5 and Supplementary Materials Figures S3–S10). The oldest seismic boundary, SB 1, cannot be distinguished in the northernmost seismic profiles closest to the Denmark Strait (Figure 4A and Supplementary Materials Figure S3), but is present everywhere else. In the deeper canyons (i.e., the canyons along the narrow shelf section) SB 1 is often erosional (Figure 4A and Figure 5A and Supplementary Materials Figures S4–S7). The sediments below SB 1, Unit I, display a mix of seaward dipping reflections and chaotic packages. Figure 4B (Seismic Profile B) illustrates a transition from a chaotic internal reflection pattern landward to dipping reflections in direction to the Irminger Sea basin. Unit I package is generally thickest in and around the ridges (Figure 5B and Supplementary Materials Figures S8 and S9). The southward extending moat structure upslope of the ridges is illustrated in Figure 5A,B (see also Supplementary Materials Figures S8 and S9). Similarly as the erosional lower boundary of SB 1, SB 2 is often erosional in the deeper canyons (Figure 4B and Supplementary Materials Figures S6 and S7). The unit between SB 1 and SB 2, Unit II, pinches out towards the shelf while thickening towards the Irminger Sea basin, a pattern that is well illustrated in the seismic profiles from the narrow part of the shelf (Figure 5 and Supplementary Materials Figures S4–S9). In the deeper canyons seismic boundary 3 (SB 3) has likewise an erosional appearance (Figure 5A and Supplementary Materials Figures S4, S6 and S7). This erosional appearance is especially evident in seismic profile B (Figure 4B and Supplementary Materials Figure S7), which further shows that SB3 is absent in more landward direction. The unit between SB 2 and SB 3 (Unit III) is generally very thin, except for in the areas below the ridges (Figure 5B and Supplementary Materials Figures S8 and S9). Seismic boundary 4 (SB4) is also erosional, which is evident in all the canyons (Figure 4B and Figure 5 and Supplementary Materials Figures S4–S7), but especially in the deeper ones (Figure 4B and Figure 5A and Supplementary Materials Figures S5–S7). Except for the northernmost profile (profile A), the seismic unit between SB 3 and SB 4, Unit IV, increases in thickness on the downslope profiles towards the south (Figure 5 and Supplementary Materials Figures S3–S10). In analogue to Unit III, Unit IV is thickest under the ridge crests (Figure 4B and Supplementary Materials Figures S8 and S9). The youngest seismic unit (between SB 4 and the seafloor, Unit V, is generally a thin veneer covering the underlying units (Figure 4 and Figure 5 and Supplementary Materials Figures S3–S10). The unit is locally incised, especially in the canyons (Figure 4B and Figure 5A and Supplementary Materials Figures S4–S7). The unit is thickest below the ridge crest (Figure 5B and Supplementary Materials Figures S8 and S9).
There are no canyons present north of 64° N, but the slope is not entirely smooth, small V-shaped channels can be distinguished (Figure 6A). These channels are young and present only after the formation of SB 4. They are asymmetric having a gentler slope on the northern shoulder and a steeper slope and bulge on the southern shoulder (Figure 6A). Further south, V-shaped channels are also found inside the canyons (Figure 6B). The channels appear here to represent the youngest development of the canyon systems. While the older canyon-forming channels have a more U-shaped form with equal shoulders for SB 1–4, it is only after the formation of the intra-Unit V Seismic Boundary, SB 5, that the channels change from a U-shape to a V-shape (Figure 6B). These V-shaped channels also display a steeper southern wall, but in contrast to the channel’s more to the north, their northern slope appears erosional rather than depositional (Figure 6).

5. Interpretation and Discussion

5.1. Shelf Architecture

South of 63°30’ N, the shelf break coincides with the continent-to-ocean transition (COT) [20] (Figure 2A). The shelf becomes markedly broader where the shelf break no longer coincides with the COT [20] (Figure 2A), and where an eastward shift of the COT is observed. The broader shelf can further be linked to a larger and thicker cover of Palaeocene plateau basalts extruded during a prolonged period of volcanism which occurred after the continental break-up between Greenland and Europe, about 56 Ma ago [23]. It is thought that the wide shelf south of Ammassilik (Figure 1) is linked to the presence of a failed rift system, and thus the margin here may be underlain by rifted continental crust [4,39].
A general feature is the near-seabed presence or outcropping of the ABB in the inner part of the shelf, with its presence closest to the shelf edge in the elevated intra-trough areas on the southern shelf. The important role of glacial erosion through time can explain this pattern having been most active on the inner shelf during the glacial expansion stages of the Greenland Ice sheet. Moreover, the greater distance of the ABB from the shelf edge in the northern area may reflect the transition from sedimentation to erosion. Sedimentation during most glacial stages occurred further away from the shelf edge in the northern part compared to the narrow southern shelf where erosion by grounded ice dominated. Sediment supply was lower in the elevated intra-trough areas where the ABB is found closest to the shelf edge, suggesting a possible role of the pre-glacial morphology in the development of the glacial cross-shelf trough pattern. On the shelf, relics of the pre-glacial sedimentary system having fed into slope canyons are present under the actual glacial cross-shelf troughs. These non-glacial sediments probably represent remains of fluvial shelf fan complexes [25], which to a large extent were eroded due to Neogene uplift and glacial activity. During the Late Eocene, the area had been subjected to a substantial tectonic uplift [40] creating a high-relief hinterland to the Irminger Sea basin, a setting which favoured deposition of fluvial fans on the shelf.
The prograding sedimentary units observed on the shelf are interpreted as having been deposited by ice streams [5] (Figure 4 and Supplementary Materials Figures S4–S6, S8 and S9). The cross-shelf troughs are over-deepened glacial troughs carved by fast-flowing ice streams [31,41], while the elevated areas in between the troughs were covered by slower moving ice. The difference in the size of the sediment packages between the broad shelf (Figure 4A and Supplementary Materials Figures S3 and S4) and the narrow shelf (Figure 4B and Figure 5 and Supplementary Materials Figures S5–S10) may well have been preconditioned by the pre-glacial geology, which provided a larger sediment accommodation space in the north than available on the narrow shelf to the south. However, this difference may have been further accentuated by the fact of a strong positive correlation found between trough length and width over the wider shelf [31] indicating here a larger ice drainage basin and greater sediment volume transferred from the ice-sheet interior to the margin than further south. The trough mouth dimensions found here at the northern shelf edge are much larger than observed almost everywhere else on the southern Greenland margin. During extreme shelf-edge glaciations, the glacial troughs in this area may have been the pathway of one of the larger iceberg producing ice streams of Greenland south of Denmark Strait and Davis Strait. This part of the southern Greenland margin therefore may have been one of the few possible source areas of extremely deep-draft icebergs thought having been responsible for iceberg scouring on the Iceland-Faroe Ridge at almost 1000 m water depth [42].

5.2. Geomorphology and Internal Structure of the Slope

When assessing the difference in slope steepness between the northern and southern slopes of the Southeast Greenland continental margin, tectonic processes must be considered. The Southeast Greenland margin experienced several local and regional tectonic events during the Cenozoic. Major uplift events occurred in the Late Eocene (40–35 Ma), the Middle Miocene (17–12 Ma), the Late Miocene (ca. 10 Ma) and in the Early Pliocene (ca. 5 Ma) [40]. Especially the Late Miocene and Early Pliocene events resulted in an uplift of ca. 2–3 km and ca. 1 km, respectively, in the onshore area west of the Denmark Strait [40]. These uplift events also resulted in major uplift of the continental crust under the adjacent shelf. The oceanic crust eastward of the COT had meanwhile been subject to rapid subsidence during the Late Eocene and Early Oligocene [43]. The Icelandic mantle plume activity and associated post-rift igneous underplating resulted in markedly less subsidence in the north [44], while significant subsidence had occurred especially south of 63°30’ N where the COT coincides with the present shelf break [20] (Figure 2).
Another important factor controlling the steepness of the slope is the occurrence of strong boundary currents flowing southward along the margin. The bottom current strength intensifies towards the south [32], resulting in southward increasing erosion on the slope [45] and removal of downslope sediment structures [26]. This increase in the bottom current erosive strength towards the south is clearly visible on the bathymetric profiles (Figure 2B,D) where moats of variable scale occur. Most prominent is the large moat within the lower LSW depth stratum. The drastic narrowing of the shelf south of 63°30’ N probably favours gyre formation and turbulence in the area where the south-flowing currents experience the change in slope strike direction. Such turbulence and gyre formation are indicated by the multitude of small moats on bathymetric profiles C and D in Figure 2. As shown earlier, current action is a typical feature of the DWBC regime prevailing under warmer climate. Both during glacial periods and deglaciations, the southward drift of deep-draft icebergs exiting, amongst others, from the northern shelf ice stream systems can be assumed to have also contributed to sediment erosion and destabilisation of the upper slope. Slopes steeper than ca. 4° prevent the build-up of glacial trough-mouth-fans (TMF’s), and represent a favourable environment for the formation of turbidity currents eventually leading to channel incision [46,47,48]. Our data show, that typical TMF systems found to develop beyond cross-shelf troughs are absent from the southern shelf area. In contrast, channel incision and canyon systems are found widespread but are not observed on the upper slope. The strong contour currents, especially in the southern part of the margin, can explain why canyon heads start mid-slope. Side-scan sonar records from the upper slope clearly demonstrate here significant erosion of downslope trending sedimentary bedforms, which are particularly prominent within the LSW depth stratum [26]. A similar situation has been observed on Southeast Greenland’s conjugated margin, the Rockall Margin, off the Irish coast [49,50]. The V-shaped channels observed on the gentler slope north of 64°N do tend to continue further up slope, where bottom currents are less strong. These channels have an uneven distribution of the sediment over the southern and northern shoulder that can be explained due to Coriolis deflection of the sediment turbidity flow, resulting in thicker sediment packages on the southern shoulder. This asymmetry is most likely accentuated by the action of the south-flowing bottom currents. South of 64° N, on the other hand, the form of the V-shaped channels inside the larger canyon systems show no deposition and more erosion on the southern flanks. Both north and south, these channels represent younger features having notably formed after the development of SB 5. They differ, however, with respect to their respective erosion-deposition potential. To the north, where the large cross-shelf troughs are present, and the slope is less steep, sufficient sediment supply and deposition characterizes the channel morphology, while sediment bypassing and erosion, most likely in relation to stronger downslope flow, prevails on the steeper slope to the south. The presumably young seismo-stratigraphic age indicated for these channels suggest that they may have been glacially initiated after ca. 1 Ma (see also below and Figure 3). The morphological look of the channels, particularly to the south, suggest that down-slope current activity may occasionally occur today, for instance, by hyperpycnal flow of sediment-laden meltwater or by cascading dense winter water formed on the shelf [51,52]. Recent oceanographic studies indeed have reported the presence of dense shelf waters on the southeast Greenland margin at 63.3° N [53].
The Acoustic Basal Boundary, ABB, most likely corresponds to the top of the Palaeocene basalt [3]. The overlying seismic Unit I started with deposition of volcanic-derived material of Early to Middle Eocene age [3] followed by sedimentation of terrigenous sediments by turbidity currents, leading to fan development [3]. Following published strontium-isotopes stratigraphy [54], SB 1 most likely was formed around 19.6 Ma (Figure 3). Seismic Unit II consists of several cycles of glauconitic hardground deposits, followed by sandy intervals and deposition of a nannofossil-rich chalk layer. These deposits were formed between the Early and Late Miocene [3], and SB 2 dated at around 10-11 Ma [54] (Figure 3). Seismic Unit III is made up of mainly massive silt with a high abundance of coarser ice-rafted detritus (IRD). This unit was deposited between the Late Miocene and Late Pliocene [3]. SB 3 is concluded to have formed ~2.6–4.4 Ma [54] (Figure 3). The youngest seismic units, Units IV and V, consist of turbidite sequences of massive silts and sands and laminated sand and silt beds including coarser IRD. These sediments were deposited in the Pleistocene and Holocene [3]. SB 4, the top of seismic Unit IV, has been dated at around 1 Ma years old [54] (Figure 3).
Thus, well-defined formation of typical fan systems was restricted to the older, pre-glacial stage of the margin. The first canyon-forming channel formation south of 64° N can be traced back to SB 1, ca. 19.6 Ma ago, i.e., at about the same time as the onset of Eirik Drift formation [12,55]. This development can be linked to an enhancement of Northern Component Water (NCW) fluxes along the Southeast Greenland margin in relation to subsidence of the Iceland-Scotland Ridge [56]. NCW formation can be linked to the newly formed deep-water connection through the Faroe Conduit in the Early Miocene [57] and the opening of Fram Strait allowing deep-water exchange between the Arctic Ocean and basins to the south [58]. The presence of glauconitic sediments (ODP Leg 152 Site 918) with erosional features at the top of the sediment package deposited in the Early to Late Miocene may confirm the start of bottom current activity [3] (Figure 7). Subsidence of the Denmark Strait due to the cooling of the Icelandic mantle plume around 7 Ma ago [59] allowed the onset of the DSOW [60]. Consequently, the bottom currents along the Southeast Greenland margin further intensified. This explains the erosive origin of SB 2, which might have a diachronous character across the Irminger Sea basin. Between 7.5 and 5.6 studies report a weakening of the NCW [36,56,59]). Our data can, however, not confirm this. Approximately 4.5 Ma both ISOW and DSOW flow strengths have been suggested to increased [61]. The timing of these changes in ISOW and DSOW flow notably coincides with the first indications for shelf edge glaciations in southern Greenland [62], which indicate the onset of oscillations in the current strengths linked to the glacial-interglacial fluctuations.
The older, pre-glacial fan complexes formed prior to 19.6 Ma, in a period when deep-water circulation was weak in the young Irminger Sea basin [37]. Fan deposition was therefore hardly affected by contour current action and can thus be assumed to have survived as large-scale topographic irregularities on the lower slope. Depending on topography and seabed roughness, local downslope flow deviation likely occurred during deposition of the fan complexes [63,64], which process is thought to have resulted in the onset of the formation of the slope-perpendicular ridge and canyon system. Thus, the development of canyon-forming channel systems can be assumed to be inherent to the triggering of the formation of the large drift ridge system.
Coeval with accumulation of sediments on the slope, preferably on the drift ridges, during the late Miocene to late Pliocene, tidewater glaciers gradually developed and glacio-fluvial prograding wedges started to form on the shelf. Until SB 4 the canyon-forming channels were U-shaped, while the onset of the young, V-shaped channel formation started only after ca. 1 Ma ago. This development coincides with the mid-Pleistocene revolution (MPR), which marks a shift in climate periodicity from stronger 41-ka cycles towards dominant 100-ka cycles [65]. This MPR event changed the prevailing glacial-interglacial relationship regarding down-slope (glacial) versus along-slope (interglacial) current activity, with obvious implications for the regional sedimentation regime.

6. Conclusions

An evolution model appropriate for the entire Southeast Greenland margin, and covering evolution stages from Eocene to Holocene, is presented in Figure 7.
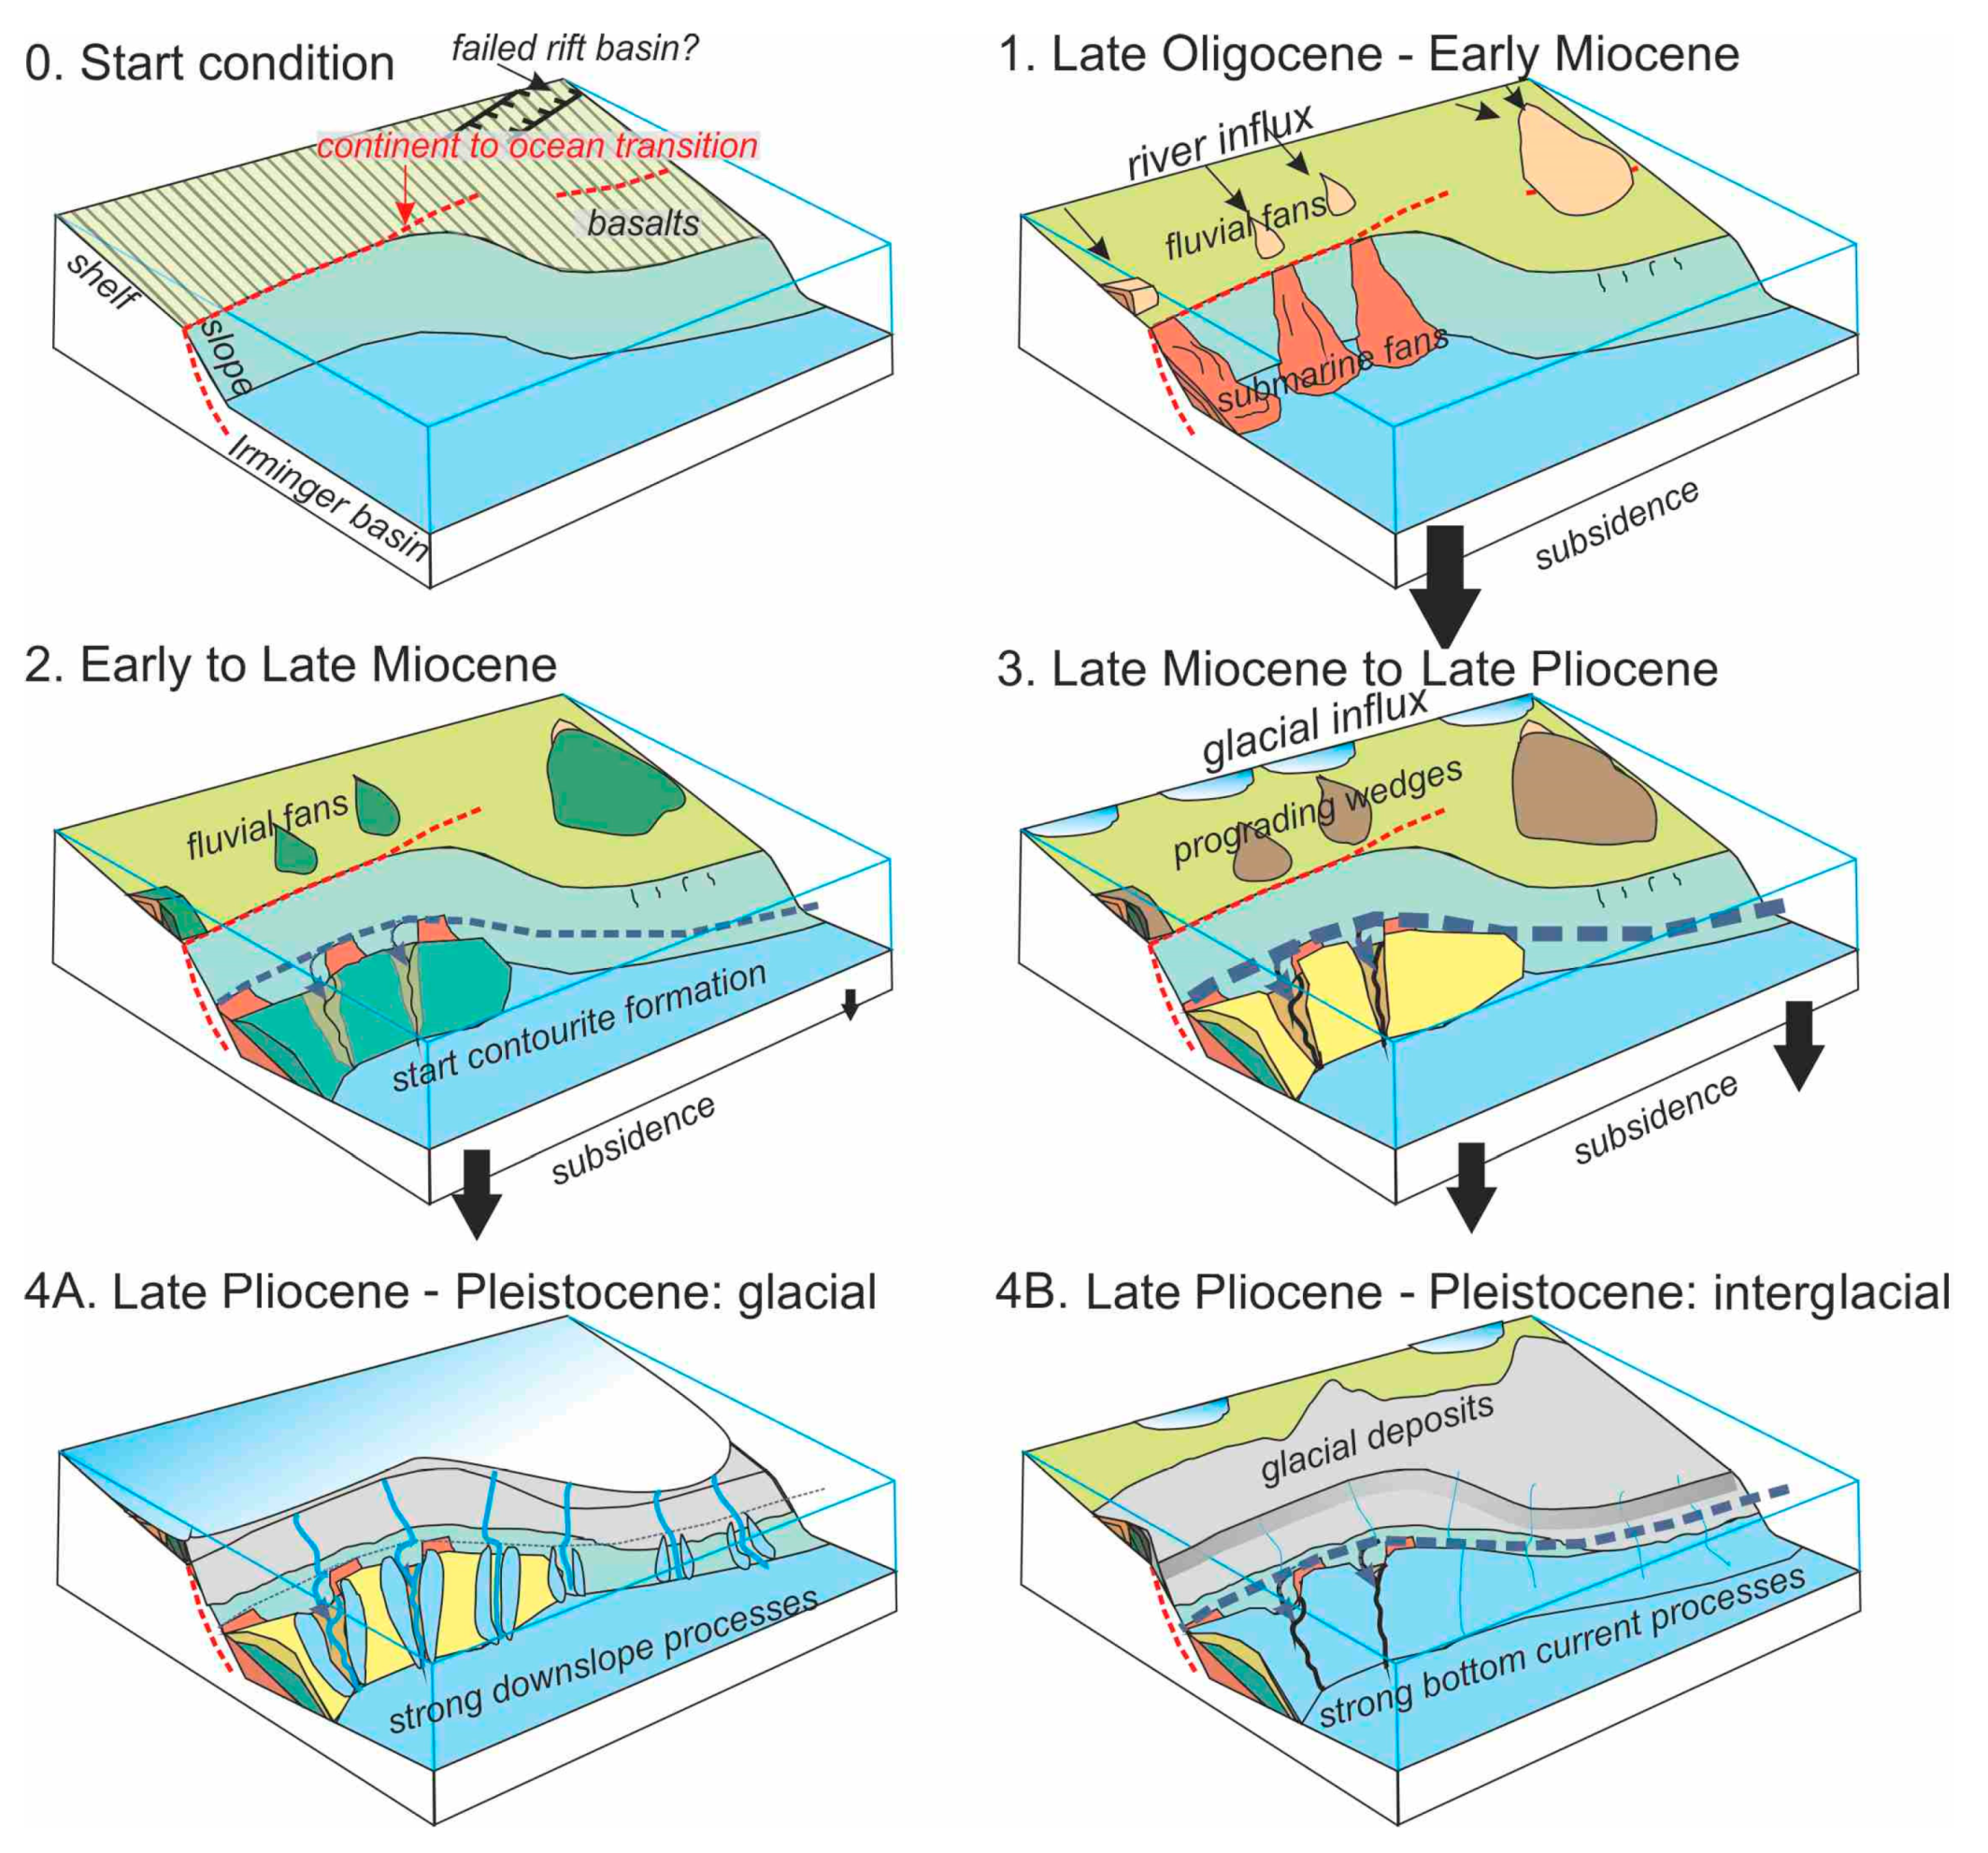
  • The geomorphological difference between the northern and southern part of the Southeast Greenland margin originates from the first stages of the development of the Irminger Sea basin and the Southeast Greenland margin. The regional pattern of tectonic uplift versus oceanic subsidence had a major impact on sediment accommodation space and ocean boundary current circulation.
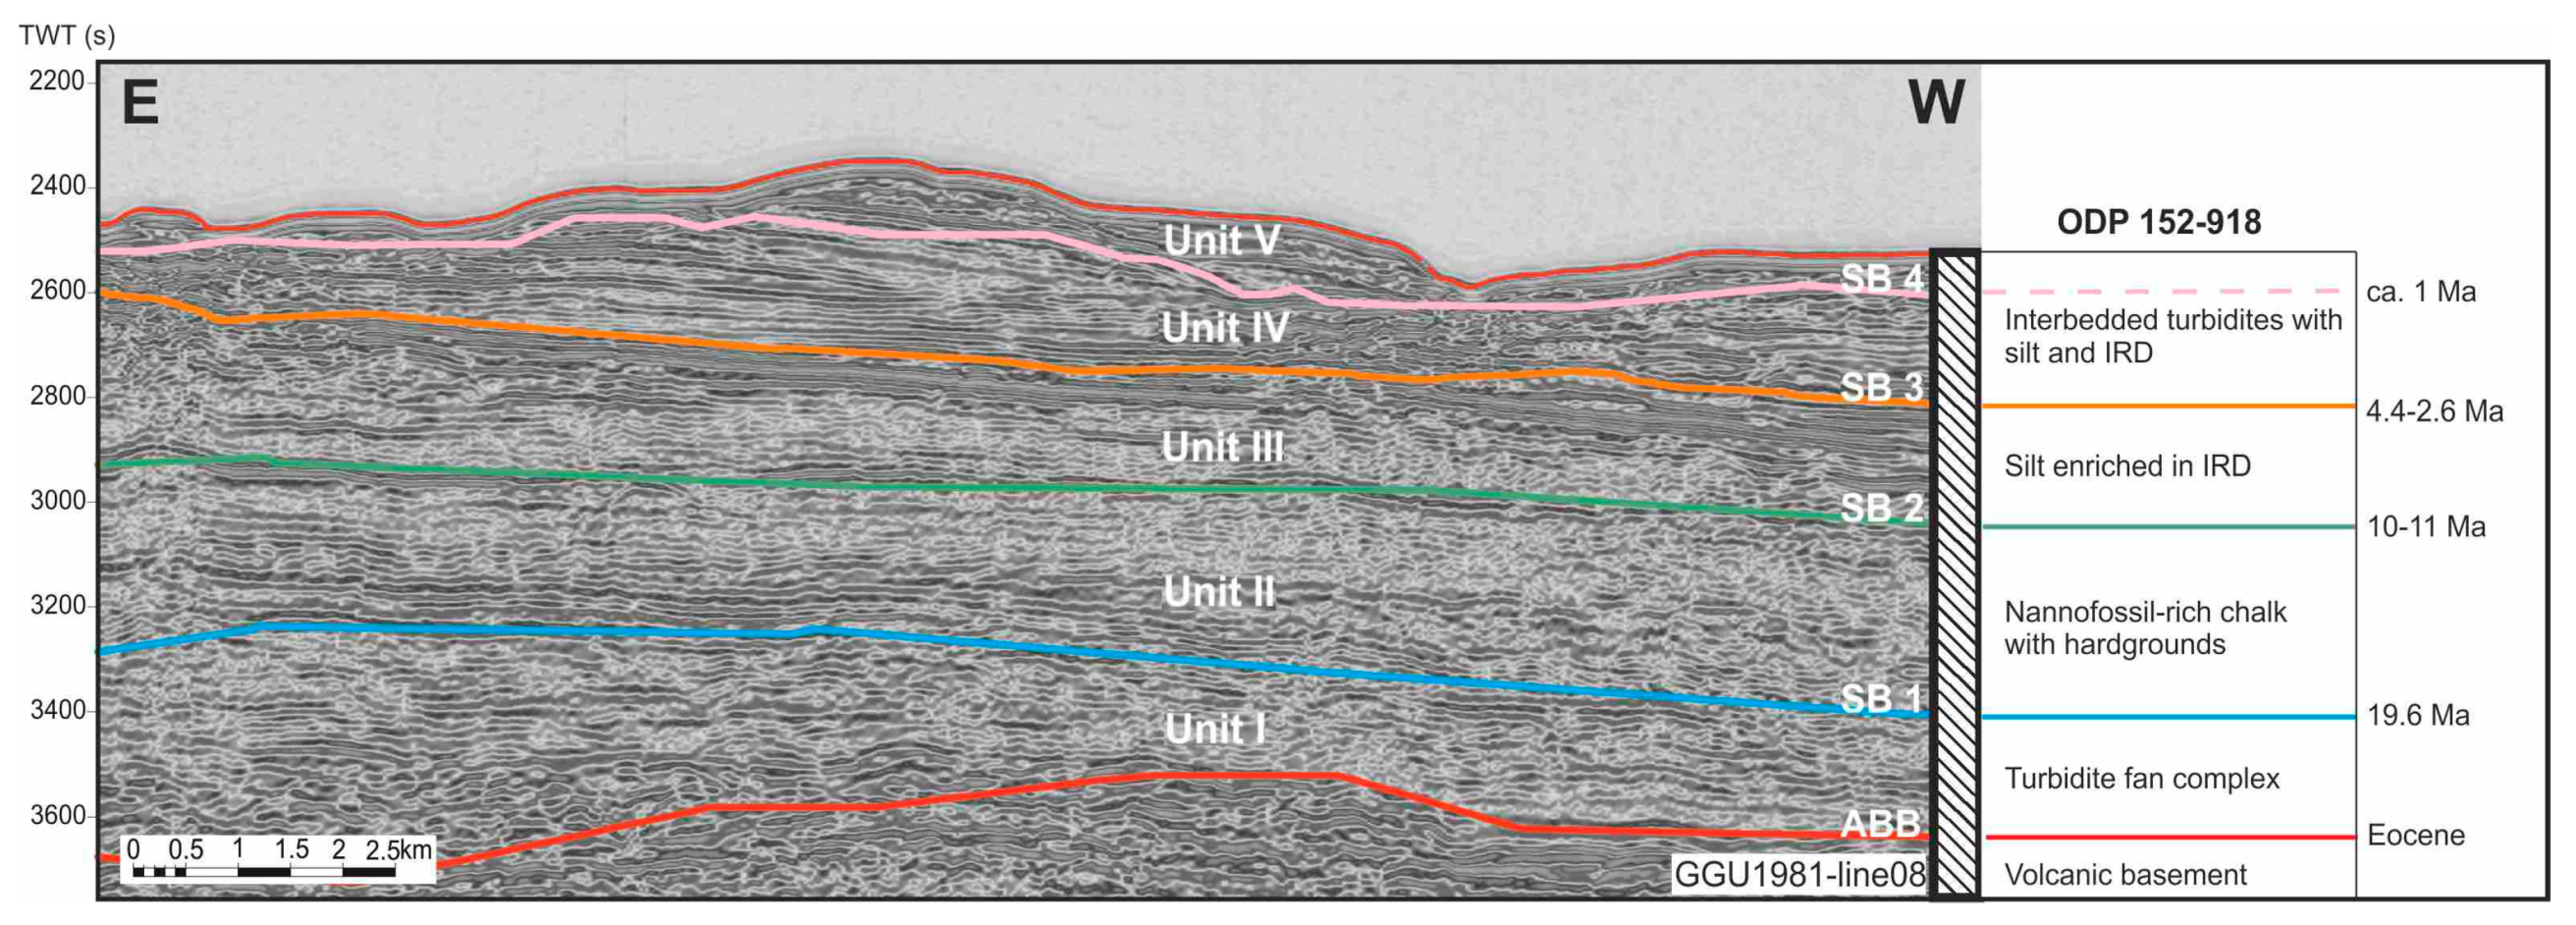
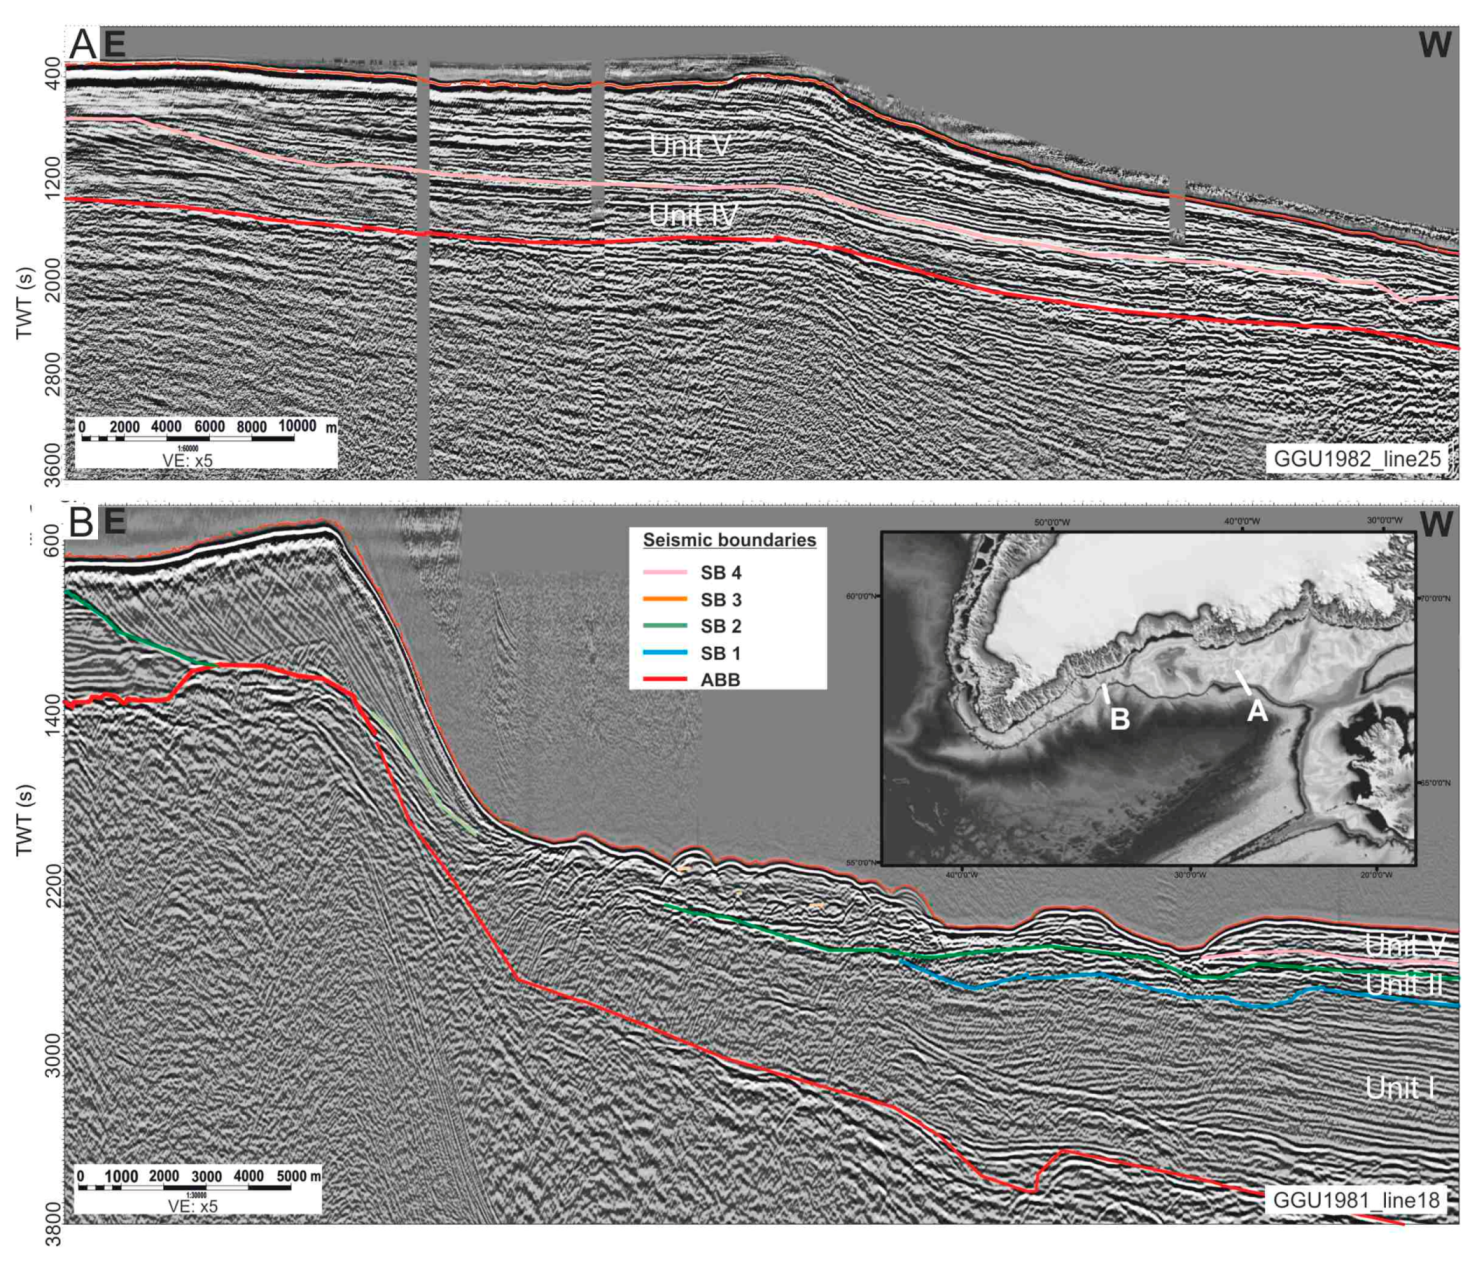
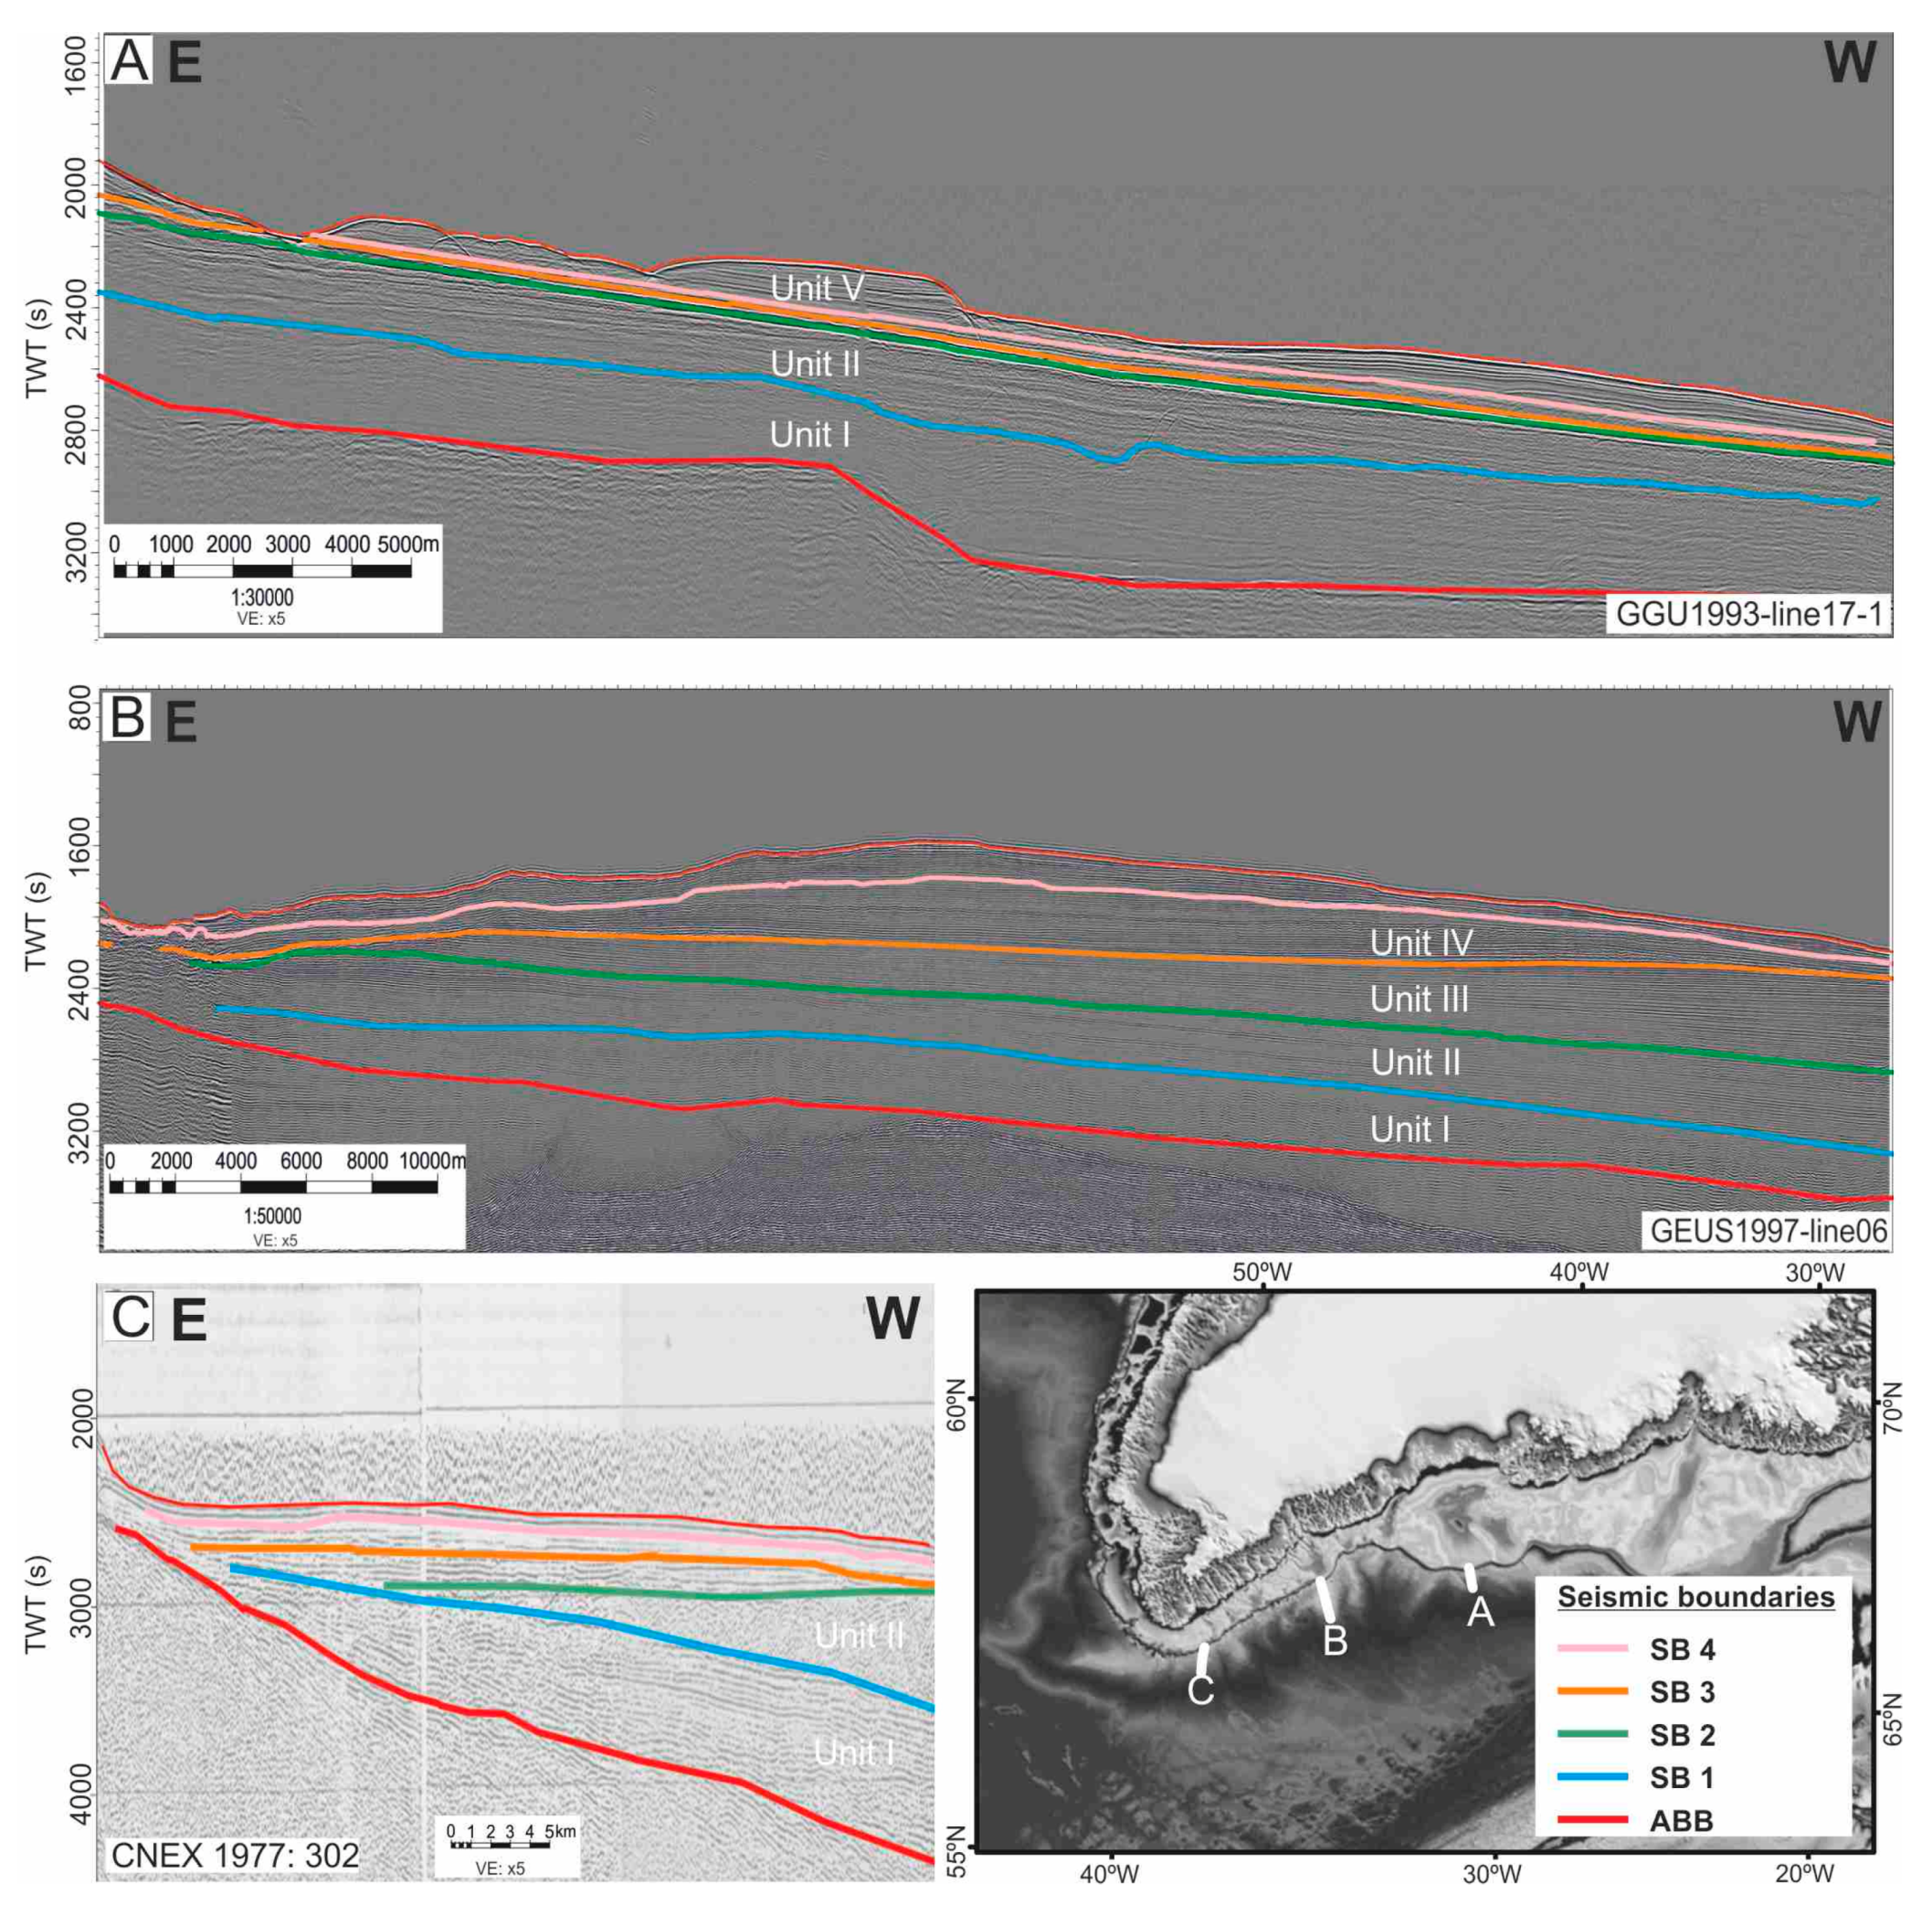
  • The prominent difference in shelf width resulted in the deposition of Oligocene-earliest Miocene turbidite fan complexes along the steeper slope of the southern margin and absence thereof along the northern margin. Due to weak bottom-current activity, these pre-glacial fan complexes were preserved and now form the core of the sediment drift ridges that, contrary to most contourite deposits, are striking perpendicular to the slope. Topographic steering of strong bottom currents since the Early Miocene by these slope-perpendicular sedimentary bodies resulted in further enhancement of these features.
  • A general intensification of the boundary current activity occurred ca. 19 Ma ago. During late Miocene-early Pliocene, tidewater glacier began to advance and glacio-fluvial prograding wedges started to develop on the shelf.
  • Acoustic basement boundary data (ABB) suggests that the pattern of the large, glacial cross-shelf trough system on the wider northern shelf may be linked to an underlying, pre-glacial morphology where fluvial delta fan sediments had been present.
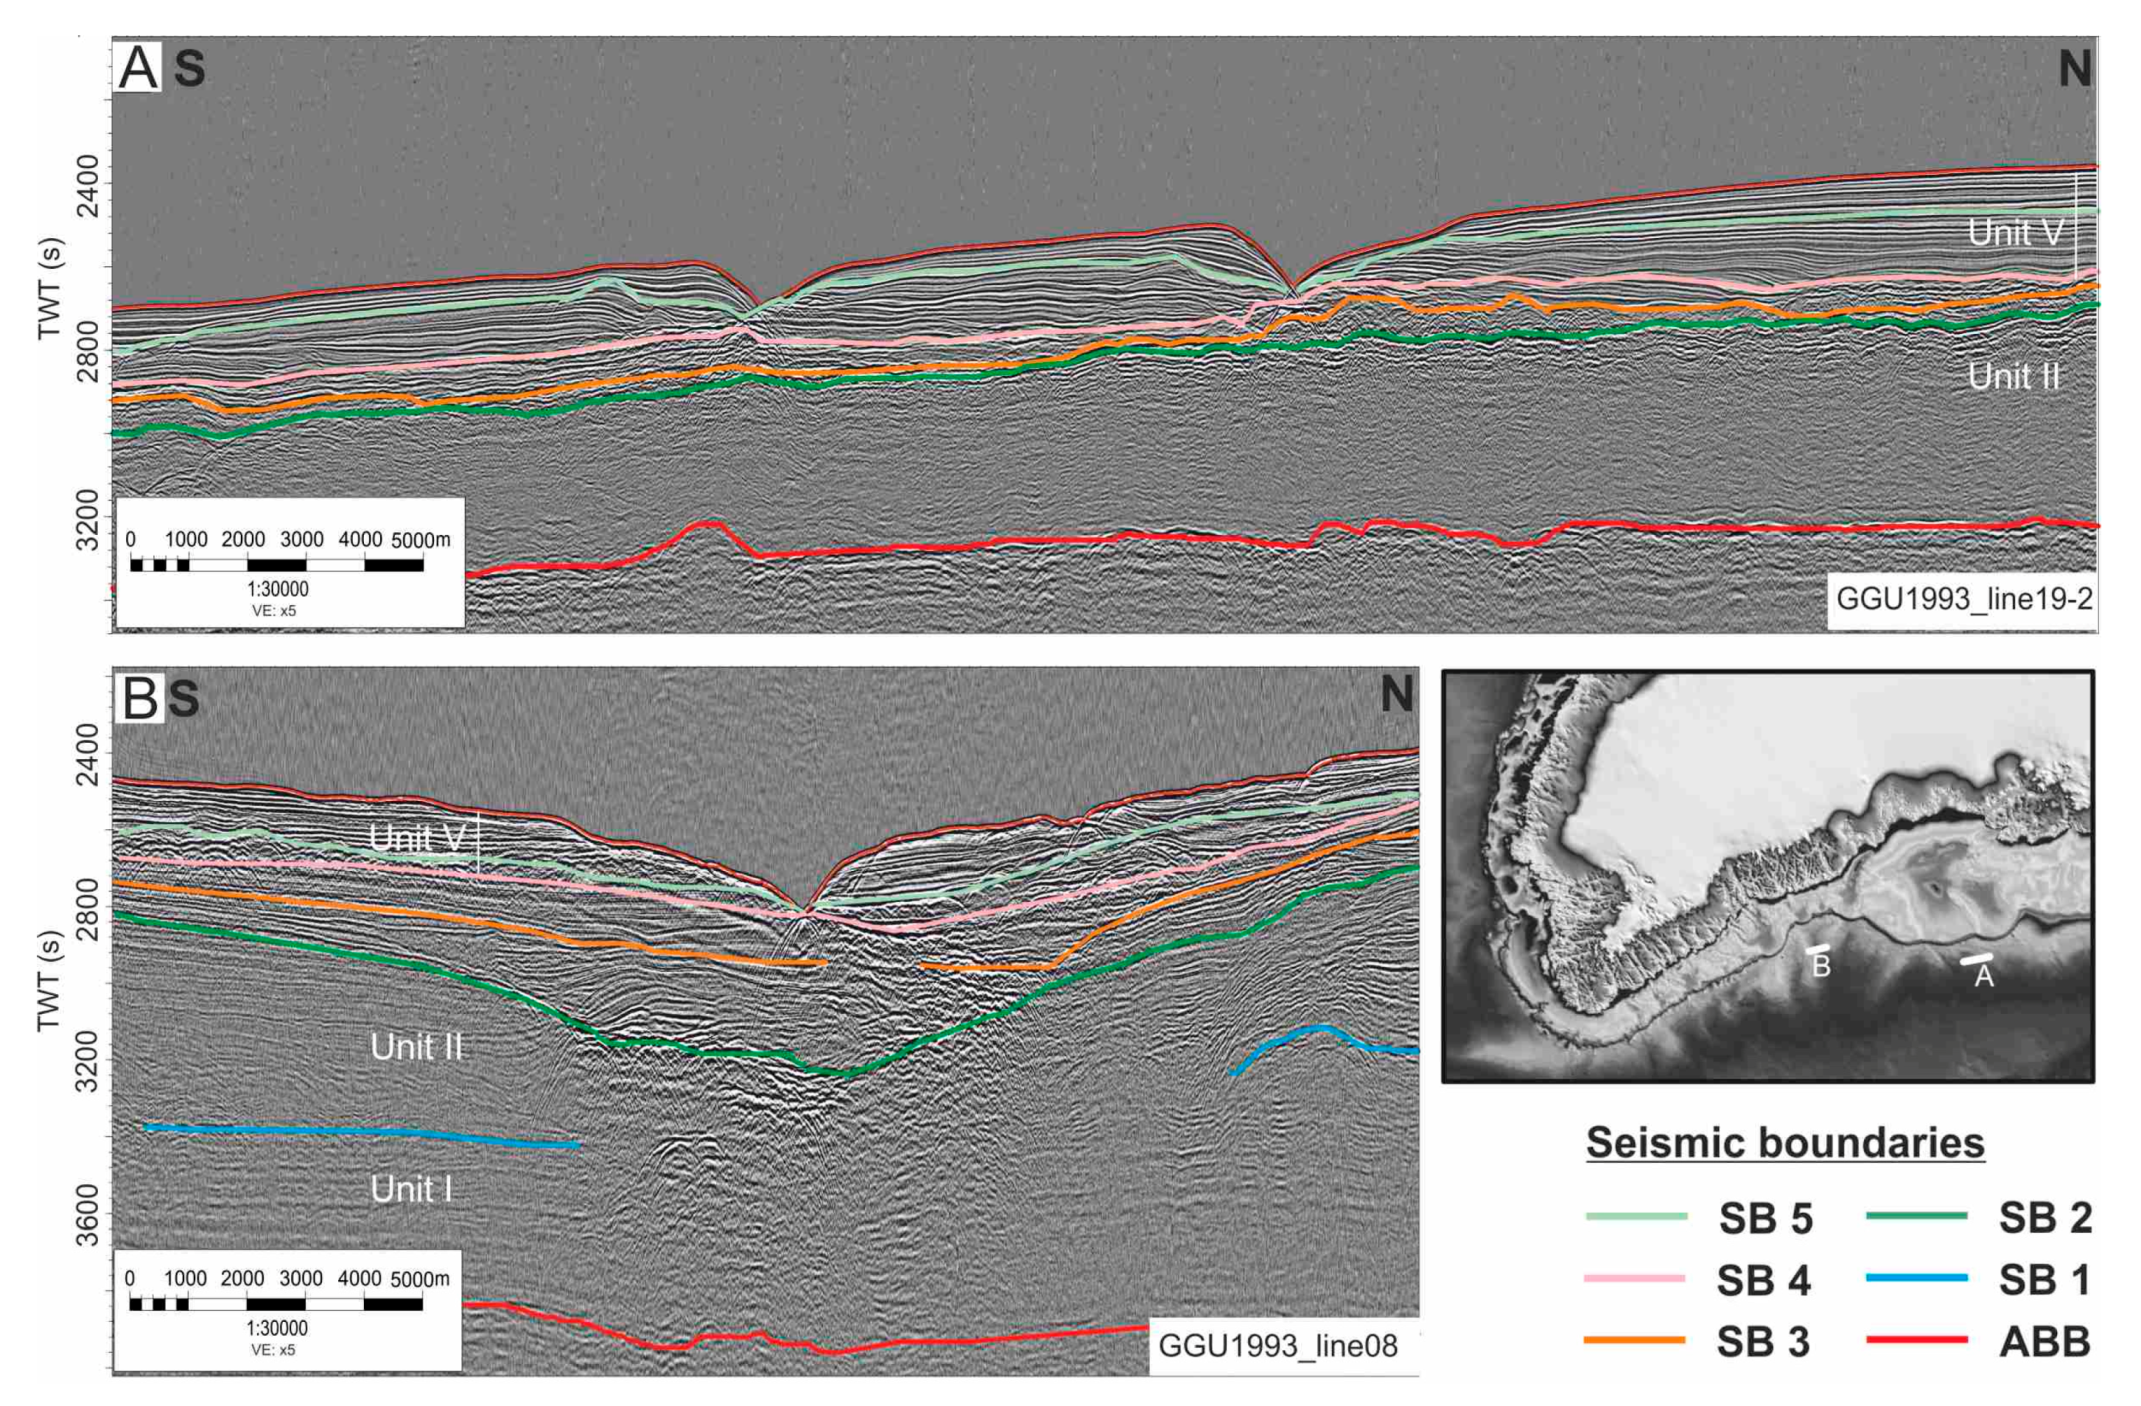
  • Although the general sedimentation pattern documents downslope sediment transport prevailing during glacial stages and along-slope transport during warmer climate, a change in the relative significance of both regimes is concluded to have occurred about 1 Ma ago. This change is marked by the appearance of relatively narrow, V-shaped channels observed on the slope to both the north and south. Their morphological appearance in these two areas is, however, different, which is concluded to indicate stronger channel flow and more sediment bypassing in the channels found associated with the steeper, southern slope.
  • The morphological character of the V-shaped channels further indicates that they form an active conduit for cascading dense winter water or sediment-laden meltwater from the shelf, also today.
  • The occurrence of a marked moat system on the southern slope and lack of such more to the north are in support of oceanographic studies that report intensification and deepening of the deep Boundary Current on its way from Denmark Strait to the Cape Farewell area.

Supplementary Materials

The following are available online at https://www.mdpi.com/2076-3263/9/4/157/s1, Figure S1: Extract of the International Bathymetric Chart of the Arctic Ocean (IBCAO) [18] showing the Southeast Greenland margin. Contour lines are drawn every 200 m; Figure S2: Location map of the seismic profiles provided as Figures S3 to S10; Figure S3: Seismic across slope profile. Its location is shown in Figure S2; Figure S4: Seismic across slope profile. Its location is shown in Figure S2; Figure S5: Seismic across slope profile. Its location is shown in Figure S2; Figure S6: Seismic across slope profile. Its location is shown in Figure S2; Figure S7: Seismic across slope profile. Its location is shown in Figure S2; Figure S8: Seismic across slope profile. Its location is shown in Figure S2; Figure S9: Seismic across slope profile. Its location is shown in Figure S2; Figure S10: Seismic across slope profile. Its location is shown in Figure S2.

Author Contributions

Conceptualization, K.A.H.; Funding acquisition, T.N.; Investigation, K.A.H.; Writing—original draft, K.A.H.; Writing—review & editing, T.N. and A.K.

Funding

This research was funded by the People Programme (Marie Curie Actions) of the European Union’s Seventh Framework Programme FP7/2007-2013/ under REA grant agreement n° 317217.

Acknowledgments

Special thanks to Lars Kjærgaard and Rasmus Rasmussen for helping with collecting, reprocessing and reformatting the seismic data. We also thank the reviewers and editors for their help in improving the manuscript. The research leading to these results forms part of the GLANAM (GLAciated North Atlantic Margins) Initial Training Network funded by the EU the People Programme (Marie Curie Actions).

Conflicts of Interest

The authors declare no conflict of interest.

References

  1. Larsen, H.C. Geological perspectives of the East Greenland continental margin. Bull. Geol. Soc. Denmark 1980, 29, 77–101. [Google Scholar]
  2. Coffin, M.F.; Eldholm, O. Large igneous provinces: Crustal structure, dimensions, and external consequences. Rev. Geophys. 1994, 32, 1–36. [Google Scholar] [CrossRef]
  3. Larsen, H.C.; Saunders, A.D.; Clift, P.D.; Ali, J.R.; Beget, J.E.; Cambray, H.; Demant, A.; Fitton, J.G.; Fram, M.S.; Fukuma, K.; et al. Proceedings of the Ocean Drilling Program, Initial Reports; Ocean Drilling Program: College Station, TX, USA, 1994. [Google Scholar]
  4. Hopper, J.R.; Lizarralde, D.; Larsen, H.C. Seismic investigations offshore South-East Greenland. Geol. Greenl. Surv. Bull. 1998, 180, 145–151. [Google Scholar]
  5. Nielsen, T.; De Santis, L.; Dahlgren, K.I.T.; Kuijpers, A.; Laberg, J.S.; Nygård, A.; Praeg, D.; Stoker, M.S. A comparison of the NW European glaciated margin with other glaciated margins. Mar. Petrol. Geol. 2005, 22, 1149–1183. [Google Scholar] [CrossRef]
  6. Johnson, G.L.; Sommerhoff, G.; Egloff, J. Structure and morphology of the west Reykjanes Basin and southeast Greenland continental margin. Mar. Geol. 1975, 18, 175–196. [Google Scholar] [CrossRef]
  7. Sommerhoff, G. Geomorphologische Prozesse in der Labrador- und Irmingersee. Ein Beitrag zur submarinen Geomorphologie einer subpolaren Meeresregion. Polarforschung 1981, 51, 175–191. [Google Scholar]
  8. Clausen, L. Late Neogene and Quaternary sedimentation on the continental slope and upper rise offshore southeast Greenland: Interplay of contour and turbidity processes. In Proceedings of the Ocean Drilling Program, Scientific Results; Saunders, A.D., Larsen, H.C., Wise, S.W., Jr., Eds.; Ocean Drilling Program Texas A& M Univesity: College Station, TX, USA, 1998; pp. 3–18. [Google Scholar]
  9. Clausen, L. The Southeast Greenland glaciated margin: 3D stratal architecture of shelf and deep sea. In Geological Processes on Continental Margins: Sedimentation, Mass-Wasting and Stability, Geological Society; Stoker, M., Evans, D., Cramp, A., Eds.; Special Publications: London, UK, 1998; Volume 129, pp. 173–203. [Google Scholar]
  10. Funck, T.; Andrup-Henriksen, G.; Dehler, S.A.; Louden, K.E. The crustal structure of the Eirik Ridge at the southern Greenland continental margin. In Proceedings of the Geological Association of Canada-Mineralogical Association of Canada Joint Annual Meeting, St. John’s, NL, Canada, 27–29 May 2012. [Google Scholar]
  11. Hunter, S.E.; Wilkinson, D.; Stanford, J.; Stow, D.A.V.; Bacon, S.; Akhmetzhanov, A.M.; Kenyon, N.H. The Eirik Drift: A Long-Term Barometer of North Atlantic Deepwater Flux South of Cape Farewell, Greenland, Economic and Palaeoceanographic Significance of Contourite Deposits; The Geological Society of London: London, UK, 2007; pp. 245–263. [Google Scholar] [CrossRef]
  12. Müller-Michaelis, A.; Uenzelmann-Neben, G.; Stein, R. A revised Early Miocene age for the instigation of the Eirik Drift, offshore southern Greenland: Evidence from high-resolution seismic reflection data. Mar. Geol. 2013, 340, 1–15. [Google Scholar] [CrossRef] [Green Version]
  13. Fagel, N.; Hillaire-Marcel, C.; Robert, C. Changes in the Western Boundary Undercurrent outflow since the Last Glacial Maximum, from smectite/illite ratios in deep Labrador Sea Sediments. Paleoceanography 1997, 12, 79–96. [Google Scholar] [CrossRef]
  14. Linthout, K.; Troelstra, S.R.; Kuijpers, A. Provenance of coarse ice-rafted detritus near the SE Greenland margin. Neth. J. Geosci. 2000, 79, 109–121. [Google Scholar] [CrossRef] [Green Version]
  15. Faugères, J.-C.; Stow, D.A.V.; Imbert, P.; Viana, A. Seismic features diagnostic of 618 contourite drifts. Mar. Geol. 1999, 162, 1–38. [Google Scholar] [CrossRef]
  16. Rasmussen, S.; Lykke-Andersen, H.; Kuijpers, A.; Troelstra, S.R. Post-Miocene sedimentation at the continental rise of Southeast Greenland: The interplay between turbidity and contour currents. Mar. Geol. 2003, 196, 37–52. [Google Scholar] [CrossRef]
  17. Rebesco, M.; Camerlenghi, A. Contourites; Elsevier: Amsterdam, The Netherlands, 2008. [Google Scholar]
  18. Jakobsson, M.; Mayer, L.A.; Coakley, B.; Dowdeswell, J.A.; Forbes, S.; Fridman, B.; Hodnesdal, H.; Noormets, R.; Pedersen, R.; Rebesco, M.; et al. The International Bathymetric Chart of the Arctic Ocean (IBCAO) Version 3.0. Geophys. Res. Lett. 2012, 39, L12609. [Google Scholar] [CrossRef]
  19. Bridgwater, D.; Davies, F.B.; Gill, R.C.O.; Gorman, B.E.; Myer, J.S.; Pedersen, S.; Taylor, P. Precambrian and Tertiary geology between Kangerdlugssuaq and Angmagssalik, East Greenland. A preliminary report. Rapp. Grønl. Geol. Unders. 1978, 83, 1–17. [Google Scholar]
  20. Larsen, H.C. Geology of the East Greenland Shelf. In Petroleum Geology of the North European Margin; Spencer, A.M., Holter, E., Johnson, S.O., Mørk, A., Nysæther, E., Sognstad, P., Spinnanger, Å., Eds.; Graham and Trotman: London, UK, 1984; pp. 329–339. [Google Scholar]
  21. Surlyk, F.; Clemmensen, L.B.; Larsen, H.C. Post-Paleozoic Evolution of the East Greenland Continental Margin. In Geology of the North Atlantic Borderlands; Kerr, J.W., Ferguson, A.J., Eds.; Canadian Society of Petroleum Geologists Memoir: Calgary, AB, Canada, 1981; Volume 7, pp. 611–645. [Google Scholar]
  22. Talwani, M.; Eldholm, O. Evolution of the Norwegian-Greenland Sea. Geol. Soc. Am. Bull. 1977, 88, 969–999. [Google Scholar] [CrossRef]
  23. Larsen, B. Geology of the Greenland-Iceland ridge in the Denmark Strait. In Structure and Development of the Greenland-Scotland Ridge: New methods and concepts; Saxov, B., Thiede, T., Eds.; Plenum Publisher Corporation: New York, NY, USA, 1983; pp. 425–444. [Google Scholar]
  24. Larsen, H.C.; Saunders, A.D.; Clift, P.D.; Beget, J.; Wei, W.; Spezzaferri, S. ODP Leg 152 Scientific Party. Seven Million Years of Glaciation in Greenland. Science 1994, 264, 952–955. [Google Scholar] [CrossRef] [PubMed]
  25. Helland, P.E.; Holmes, M.A. Surface textural analysis of quartz sand grains from ODP Site 918 off the southeast coast of Greenland suggests glaciation of southern Greenland at 11 Ma. Palaeogeogr. Palaeoclimatol. Palaeoecol. 1997, 135, 109–121. [Google Scholar] [CrossRef] [Green Version]
  26. Kuijpers, A.; Troelstra, S.R.; Prins, M.A.; Linthout, K.; Akhmetzhanov, A.; Bouryak, S.; Bachmann, M.F.; Lassen, S.; Rasmussen, S.; Jensen, J.B. Late Quaternary sedimentary processes and ocean circulation changes at the Southeast Greenland margin. Mar. Geol. 2003, 195, 109–129. [Google Scholar] [CrossRef]
  27. Vanneste, K.; Uenzelmann-Neben, G.; Miller, H. Seismic evidence for long-term history of glaciation on central East Greenland shelf south of Scoresby Sund. Geo-Mar. Lett. 1995, 15, 63–70. [Google Scholar] [CrossRef]
  28. Perez, F.L.; Nielsen, T. Asynchronous ice-sheet development along the central East Greenland margin: A GLANAM project contribution. Geol. Surv. Den. Greenl. Bull. 2017, 38, 61–64. [Google Scholar]
  29. Perez, F.L.; Nielsen, T.; Knutz, P.C.; Kuijpers, A.; Damm, V. Large-scale evolution of the central-east Greenland margin: New insights to the North Atlantic glaciation history. Glob. Planet. Chang. 2018, 163, 141–157. [Google Scholar] [CrossRef]
  30. Sommerhoff, G. Formenschatz und morphologische Gliederung des südostgrönlandischen Schelfgebietes und Kontinentalabhanges. “Meteor” Forsch-Ergebnisse Reihe C 1973, 15, 1–54. [Google Scholar]
  31. Batchelor, L.; Dowdeswell, J.A. The physiography of High Arctic cross-shelf troughs. Quat. Sci. Rev. 2014, 92, 68–96. [Google Scholar] [CrossRef]
  32. Dickson, R.R.; Brown, J. The production of North Atlantic Deep Water: Sources, rates, and pathways. J. Geophys. Res. Oceans 1994, 99, 12319–12341. [Google Scholar] [CrossRef]
  33. von Appen, W.-J.; Koszalka, I.M.; Pickart, R.S.; Haine, T.W.N.; Mastropole, D.; Magaldi, M.G.; Valdimarsson, H.; Girton, J.; Jochumsen, K.; Krahmann, G. The East Greenland Spill Jet as an important component of the Atlantic Meridional Overturning Circulation. Deep Sea Res. Part I Oceanogr. Res. Pap. 2014, 92, 75–84. [Google Scholar] [CrossRef] [Green Version]
  34. Lauderdale, J.M.; Bacon, S.; Naveira Garabato, A.C.; Holliday, N.P. Intensified turbulent mixing in the boundary current system of southern Greenland. Geophys. Res. Lett. 2008, 35, L04611. [Google Scholar] [CrossRef]
  35. Jochumsen, K.; Köllner, M.; Quadfasel, D.; Dye, S.; Rudels, B.; Valdimarsson, H. On the origin and propagation of Denmark Strait overflow water anomalies in the Irminger Basin. J. Geophys. Res. Oceans 2015, 120, 1841–1855. [Google Scholar] [CrossRef] [Green Version]
  36. Müller-Michaelis, A.; Uenzelmann-Neben, G. Development of the Western Boundary Undercurrent at Eirik Drift related to changing climate since the early Miocene. Deep Sea Res. Part I Oceanogr. Res. Pap. 2014, 93, 21–34. [Google Scholar] [CrossRef] [Green Version]
  37. Uenzelmann-Neben, G.; Gruetzner, J. Chronology of Greenland Scotland Ridge overflow: What do we really know? Mar. Geol. 2018, 406, 109–118. [Google Scholar] [CrossRef]
  38. National Oceanographic and Atmospheric Administration (NOAA). Trackline Geophysical Data Viewer. 2014. Available online: http://maps.ngdc.noaa.gov/viewers/geophysics/ (accessed on 1 February 2019).
  39. Gerlings, J.; Hopper, J.R.; Fyhn, M.B.W.; Frandsen, N. Mesozoic and older rift basins on the SE Greenland Shelf offshore Ammassalik. Geol. Soc. Lond. Spec. Publ. 2017, 447, 375–392. [Google Scholar] [CrossRef]
  40. Japsen, P.; Green, P.F.; Bonow, J.M.; Nielsen, T.F.D.; Chalmers, J.A. From volcanic plains to glaciated peaks: Burial, uplift and exhumation history of southern East Greenland after opening of the NE Atlantic. Glob. Planet. Chang. 2014, 116, 91–114. [Google Scholar] [CrossRef]
  41. Dowdeswell, J.A.; Evans, J.; Ó Cofaigh, C. Submarine landforms and shallow acoustic stratigraphy of a 400 km-long fjord-shelf-slope transect, Kangerlussuaq margin, East Greenland. Quat. Sci. Rev. 2010, 29, 3359–3369. [Google Scholar] [CrossRef] [Green Version]
  42. Kuijpers, A.; Werner, F. Extremely deep-draft iceberg scouring in the glacial North Atlantic Ocean. Geo-Mar. Lett. 2007, 27, 383–389. [Google Scholar] [CrossRef]
  43. Clift, P. Plume tectonics as a cause of mass wasting on the southeast Greenland continental margin. Mar. Petrol. Geol. 1996, 13, 771–780. [Google Scholar] [CrossRef]
  44. Clift, P.D.; Carter, A.; Hurford, A.J. Constraints on the evolution of the East Greenland Margin: Evidence from detrital apatite in offshore sediments. Geology 1996, 24, 1013–1016. [Google Scholar] [CrossRef]
  45. Lykke-Andersen, H. Neogene-Quaternary depositional history of the east Greenland shelf in the vicinity of Leg 152 shelf sites. In Proceedings of the Ocean Drilling Program, Scientific Results; Saunders, A.D., Larsen, H.C., Wise, S.W., Jr., Eds.; National Science Foundation: Alexandria, VA, USA, 1998; pp. 29–38. [Google Scholar] [CrossRef]
  46. Ó Cofaigh, C.; Taylor, J.; Dowdeswell, J.A.; Pudsey, C.J. Palaeo-ice streams, trough mouth fans and high latitude continental slope sedimentation. Boreas 2003, 32, 37–55. [Google Scholar] [CrossRef]
  47. Wilken, M.; Mienert, J. Submarine glacigenic debris flows, deep sea channels and past ice-stream behaviour of the East Greenland marin. Quat. Sci. Rev. 2006, 25, 784–810. [Google Scholar] [CrossRef]
  48. Piper, D.J.W.; Normark, W.R. The processes that initiate turbidity currents and their influence on turbidites: A Marine Geology perspective. J. Sediment. Res. 2009, 79, 347–362. [Google Scholar] [CrossRef]
  49. Elliott, G.M.; Shannon, P.M.; Haughton, P.D.W.; Praeg, D.; O’Reilly, B. Mid- to Late Cenozoic canyon development on the eastern margin of the Rockall Trough, offshore Ireland. Mar. Geol. 2006, 229, 113–132. [Google Scholar] [CrossRef]
  50. Sacchetti, F.; Benetti, S.; Georgiopoulou, A.; Shannon, P.M.; O’Reilly, B.M.; Dunlop, P.; Quinn, R.; Ó Cofaigh, C. Deep-water geomorphology of the glaciated Irish margin from high-resolution marine geophysical data. Mar. Geol. 2012, 291–294, 113–131. [Google Scholar] [CrossRef]
  51. Roche, D.M.; Renssen, H.; Weber, S.L.; Goosse, H. Could meltwater pulses have been sneaked unnoticed into the deep ocean during the last glacial? Geophys. Res. Lett. 2007, 34, L24708. [Google Scholar] [CrossRef]
  52. Lohmann, G.; Grosfeld, K.; Butzin, M.; Huybrechts, P.; Zweck, C. Minor effect of meltwater on the ocean circulation during deglaciation. Earth Syst. Dyn. Discuss. 2012, 3. [Google Scholar] [CrossRef]
  53. Sarafanov, A.F.; Sarafanov, A.; Mercier, H.; Lherminier, P.; Sokov, A.; Daniault, N. On the Cascading of Dense Shelf Waters in the Irminger Sea. J. Phys. Oceanogr. 2012, 42, 2254–2267. [Google Scholar]
  54. Israelson, C.; Spezzaferri, S. Strontium-isotope stratigraphy from sites 918 and 919. In Proceedings of the Ocean Drilling Program, Scientific Results; Saunders, A.D., Larsen, H.C., Wise, S.W., Jr., Eds.; Ocean Drilling Program: College Station, TX, USA, 1998; Volume 152, pp. 233–241. [Google Scholar] [CrossRef]
  55. Wold, C.N. Cenozoic sediment accumulation on drifts in the Northern North Atlantic. Paleoceanography 1994, 9, 917–941. [Google Scholar] [CrossRef]
  56. Wright, J.D.; Miller, K.G. Control of North Atlantic Deep Water Circulation by the Greenland-Scotland Ridge. Paleoceanography 1996, 11, 157–170. [Google Scholar] [CrossRef]
  57. Stoker, M.S.; Praeg, D.; Hjelstuen, B.O.; Laberg, J.S.; Nielsen, T.; Shannon, P.M. Neogene stratigraphy and the sedimentary and oceanographic development of the NW European Atlantic margin. Mar. Petrol. Geol. 2005, 22, 977–1005. [Google Scholar] [CrossRef]
  58. Ehlers, B.-M.; Jokat, W. Paleo-bathymetry of the northern North Atlantic and consequences for the opening of the Fram Strait. Mar. Geophys. Res. 2013, 34, 25–43. [Google Scholar] [CrossRef]
  59. Poore, H.; White, N.; Maclennan, J. Ocean circulation and mantle melting controlled by radial flow of hot pulses in the Iceland plume. Nature Geosci. 2011, 4, 558–561. [Google Scholar] [CrossRef]
  60. Bohrmann, G.; Henrich, R.; Thiede, J. Miocene to Quaternary paleoceanography in the northern North Atlantic: Variability in carbonate and biogenic opal accumulation. In Geological History of the Polar Oceans: Arctic Versus Antarctic; Bleil, U., Thiede, J., Eds.; Springer: Dordrecht, The Netherlands, 1990; pp. 647–675. [Google Scholar]
  61. Haug, G.H.; Tiedemann, R. Effect of the formation of the Isthmus of Panama on Atlantic Ocean thermohaline circulation. Nature 1998, 393, 673–676. [Google Scholar] [CrossRef]
  62. Nielsen, T.; Kuijpers, A. Only 5 southern Greenland shelf edge glaciations since the early Pliocene. Sci. Rep. 2013, 3, 1875. [Google Scholar] [CrossRef] [PubMed]
  63. Wåhlin, A.K. Topographic steering of dense currents with application to submarine canyons. Deep Sea Res. Part I Oceanogr. Res. Pap. 2002, 49, 305–320. [Google Scholar] [CrossRef]
  64. Wåhlin, A.K. Downward channeling of dense water in topographic corrugations. Deep Sea Res. Part I Oceanogr. Res. Pap. 2004, 51, 577–590. [Google Scholar] [CrossRef]
  65. Head, M.J.; Gibbard, P.L. Early–Middle Pleistocene transitions: An overview and recommendation for the defining boundary. In Early–Middle Pleistocene Transitions: The Land–Ocean Evidence; Head, M.J., Gibbard, P.L., Eds.; Geological Society of London: London, UK, 2005; pp. 1–18. [Google Scholar]
Figure 1. Extract of the International Bathymetric Chart of the Arctic Ocean (IBCAO) [18] showing the south-eastern margin of Greenland. Upper map: the bottom currents sweeping along the slopes of the Irminger Sea basin are indicated with dashed lines: DWBC = Deep Western Boundary Current; EGC = East Greenland Current; EGCC = East Greenland Coastal Current; LSW = Labrador Sea Water; ISOW = Iceland Scotland Overflow Water; and DSOW = Denmark Strait Overflow Water. Green lines indicate some of the canyons. Red line indicates the division between the broad and narrow shelf, and pink dash line indicates the division between the smooth slope and the incised lower slope. Lower map: location of the different seismic lines used for this study and the location of the ODP Leg 152 Site 918 borehole.
Geosciences 09 00157 g001
Figure 2. (A) Geomorphological map showing the location of the different bathymetric profiles (A to F) and location of the oceanographic Transient Tracers in the Ocean (TTO) array [32]. The dashed lines indicate the different bottom currents. The currents have the same colour as in Figure 1. The hatched line indicates the continent-to-ocean transition as defined by Larsen [20]. (B) ArcGIS generated slope angle map showing the different slope gradients in the study area and the location of some of the larger canyons. (C) The vertical water mass structure of the TTO salinity section [32] plotted on top of a more accurate bathymetric profile (black line on the graph) obtained from the International Bathymetric Chart of the Arctic Ocean (IBCAO) map [18]. The grey line on the graph at the bottom shows the slope angle generated with ArcGIS. (D) Six across slope bathymetric profiles representing the changing steepness in slope. The black lines on the graphs indicate the bathymetric profile, the grey lines on the graph indicates the slope angle generated with ArcGIS. The arrows indicate the likeliness by which the bottom current (see also C) creates different channel incisions. The colours of the arrows and the adjacent names indicate the corresponding water masses in C (LSW: Labrador Sea Water; ISOW = Iceland Scotland Overflow Water; and DSOW = Denmark Strait Overflow Water).
Geosciences 09 00157 g002
Figure 3. Overlay of a simplified core description and age model of the Ocean Drilling Programme (ODP) Leg 152 Site 918 core [3,8] on top of the across-slope orientated seismic profile crossing the core location. The core location is shown in Figure 1. The main seismic boundaries (SB 1–4 and ABB) that define a total of five seismic units (Unit I–V) are shown.
Geosciences 09 00157 g003
Figure 4. (A and B): Two seismic profiles crossing the shelf and shelf break of the Southeast Greenland margin. Profile (A) crosses a gentle slope and profile (B) a much steeper slope. The seismic boundaries are indicated in different colours. The map inset indicates the location of both profiles A and B.
Geosciences 09 00157 g004
Figure 5. (AC): Three across slope seismic profiles representing evolution of the drift deposits in the study area. The map shows the location of the seismic lines.
Geosciences 09 00157 g005
Figure 6. (A and B): Two along-slope seismic profiles visualising the two types of channels present in the study area. The small map inset indicates the location of the seismic lines.
Geosciences 09 00157 g006
Figure 7. Shelf and slope evolution model of the SE Greenland margin. The black, vertical arrows represent subsidence of the Irminger Sea basin and their relative size, indicating the degree of subsidence. Stage 0 represents the starting position in the Eocene with the already wider northern shelf and narrower southern shelf. Stage 1 represents the development of submarine turbidite fan complexes along the southern, narrower shelf in the Late Oligocene—Early Miocene. Stage 2 represents the start of bottom current activity in the Early to Late Miocene. These bottom currents partly tend to deepen under topographic steering by the previously formed fan complexes. Stage 3 represents a period with an overall increase in the bottom current strength and the initial development of tidewater glaciers in the Late Miocene—Late Pliocene. Stage 4 is divided in a part A and B representing the glacial and interglacial periods respectively. During stage 4A the glaciers reach onto the shelf and shelf edge, and large quantities of sediment flow downslope in the form of turbidity currents. These sediments are deposited as channel levees and turbidites on the lower slope and in the Irminger Sea basin. Bottom current activity is subdued in this stage. During stage 4B the glaciers have receded and left behind a thick glacigenic sediment cover on the shelf. Substantially less sediment reaches the shelf break. The much stronger bottom currents redistributed the previously deposited turbidite deposits into the form of contourite deposition. The contourite ridges lead to formation of downward current branches into the canyons.
Geosciences 09 00157 g007

