Article

Sentinel-1 SAR Interferometry for Surface Deformation Monitoring in Low-Land Permafrost Areas

1
Gamma Remote Sensing, 3073 Gümligen, Switzerland
2
3D Geospatial Data Processing Group, Institute of Geography, University of Heidelberg, 69120 Heidelberg, Germany
3
Alfred Wegener Institute Helmholtz Center for Polar and Marine Research, 27570 Potsdam, Germany
4
Asiaq, Greenland Survey, 3900 Nuuk, Greenland
5
Centre of Geographical Studies, IGOT, Universidade de Lisboa, 1600-276 Lisboa, Portugal
6
Department of Geosciences, University of Oslo, 0315 Oslo, Norway
7
Zentralanstalt für Meteorologie und Geodynamik, 1190 Wien, Austria
*
Author to whom correspondence should be addressed.
Remote Sens. 2018, 10(9), 1360; https://doi.org/10.3390/rs10091360
Submission received: 6 July 2018 / Revised: 21 August 2018 / Accepted: 22 August 2018 / Published: 27 August 2018
(This article belongs to the Special Issue Remote Sensing of Dynamic Permafrost Regions)

Abstract

:
Low-land permafrost areas are subject to intense freeze-thaw cycles and characterized by remarkable surface displacement. We used Sentinel-1 SAR interferometry (InSAR) in order to analyse the summer surface displacement over four spots in the Arctic and Antarctica since 2015. Choosing floodplain or outcrop areas as the reference for the InSAR relative deformation measurements, we found maximum subsidence of about 3 to 10 cm during the thawing season with generally high spatial variability. Sentinel-1 time-series of interferograms with 6–12 day time intervals highlight that subsidence is often occurring rather quickly within roughly one month in early summer. Intercomparison of summer subsidence from Sentinel-1 in 2017 with TerraSAR-X in 2013 over part of the Lena River Delta (Russia) shows a high spatial agreement between both SAR systems. A comparison with in-situ measurements for the summer of 2014 over the Lena River Delta indicates a pronounced downward movement of several centimetres in both cases but does not reveal a spatial correspondence between InSAR and local in-situ measurements. For the reconstruction of longer time-series of deformation, yearly Sentinel-1 interferograms from the end of the summer were considered. However, in order to infer an effective subsidence of the surface through melting of excess ice layers over multi-annual scales with Sentinel-1, a longer observation time period is necessary.

Graphical Abstract

1. Introduction

Permafrost is a key element of the cryosphere, shaping about a quarter of the land areas in the Northern hemisphere [1]. Recent and predicted climate warming may lead to widespread permafrost thawing which can have both environmental and climatic impacts on local to global scales, from slope instabilities and destruction of infrastructure to the massive release of greenhouse gases from thawing organic-rich soils. There is therefore a need to monitor regions underlain by permafrost. Permafrost is a thermally defined subsurface phenomenon which cannot be directly detected from space. However, many surface processes characteristic to permafrost terrain and periglacial landforms are expressed at the land surface and are observable with a variety of Earth Observation (EO) sensors [2,3]. One distinguishing earth surface process is terrain elevation change (surface deformation) in low-land permafrost regions.
Low-land permafrost areas, with large amounts of ground ice, are subject to intense seasonal freezing and thawing cycles and, due to phase changes from ground ice to liquid water, are exposed to surface deformation processes [4,5]. Annually, downward movement of the land surface associated with seasonal thaw in summer is compensated by upward movement associated with frost heave in fall [6]. Seasonal changes in elevation can reach decimetres every year. If seasonal thaw in summer dominates in the long term over upward movement associated with frost heave in fall, an effective subsidence of the surface is observed. The position of the Earth’s surface over multi-annual scales can thus be a direct measure of permafrost change. Satellite SAR interferometry (InSAR) has been applied in the past to measure surface deformation over permafrost during thawing seasons [7,8,9,10,11,12,13,14] and to derive remotely sensed active layer thickness [15]. Seasonal as well as year to year developments in the freeze-thaw cycle and subsequent subsidence have been identified using in most cases satellite SAR data of the ERS-1/2 SAR, ALOS-1 PALSAR-1, TerraSAR-X and Radarsat-2 sensors. The records have been however rather sparse, because the acquisitions have been irregular between the years. Nevertheless, the results could be identified as reasonable using models re-sampling the cyclic behaviour of subsidence.
Good temporal sampling is required in order to investigate the seasonality of surface deformation, especially with respect to different landforms. Such records became recently available with the Sentinel-1 mission, with acquisitions regularly available over all polar areas every 6 to 12 days [16]. Sentinel-1 is a C-Band radar-imaging mission (wavelength λ = 5.6 cm) composed of two satellites designed to study land and oceans. Sentinel-1A was launched on April 3, 2014 and Sentinel-1B on 25 April 2016. The Sentinel-1 constellation provides multiple SAR image acquisition strategies, with the TOPS Interferometric Wide Swath (IWS) mode supporting wide-area InSAR applications. Ground sampling distances of Sentinel-1 are in the order 2.3 m in range and 13.6 m in azimuth directions, respectively.
The objective of our study is to identify the subsidence-uplift seasonality for different permafrost areas as well as landscape types, including settlements, volcanic, deltaic and marine deposits. We demonstrate the potential of dense C-band SAR records to analyse surface displacement using Sentinel-1 InSAR data acquired between 2015 and 2018 over four low-land permafrost areas in the Arctic and Antarctica (Figure 1). In the following sections, we present our processing approach, show selected Sentinel-1 summer subsidence maps and time-series of motion with sampling intervals of 6 to 12 days and discuss the results and the validation activities accomplished with TerraSAR-X InSAR data as well as in-situ measurements [14].

2. Sites, Data and Methods
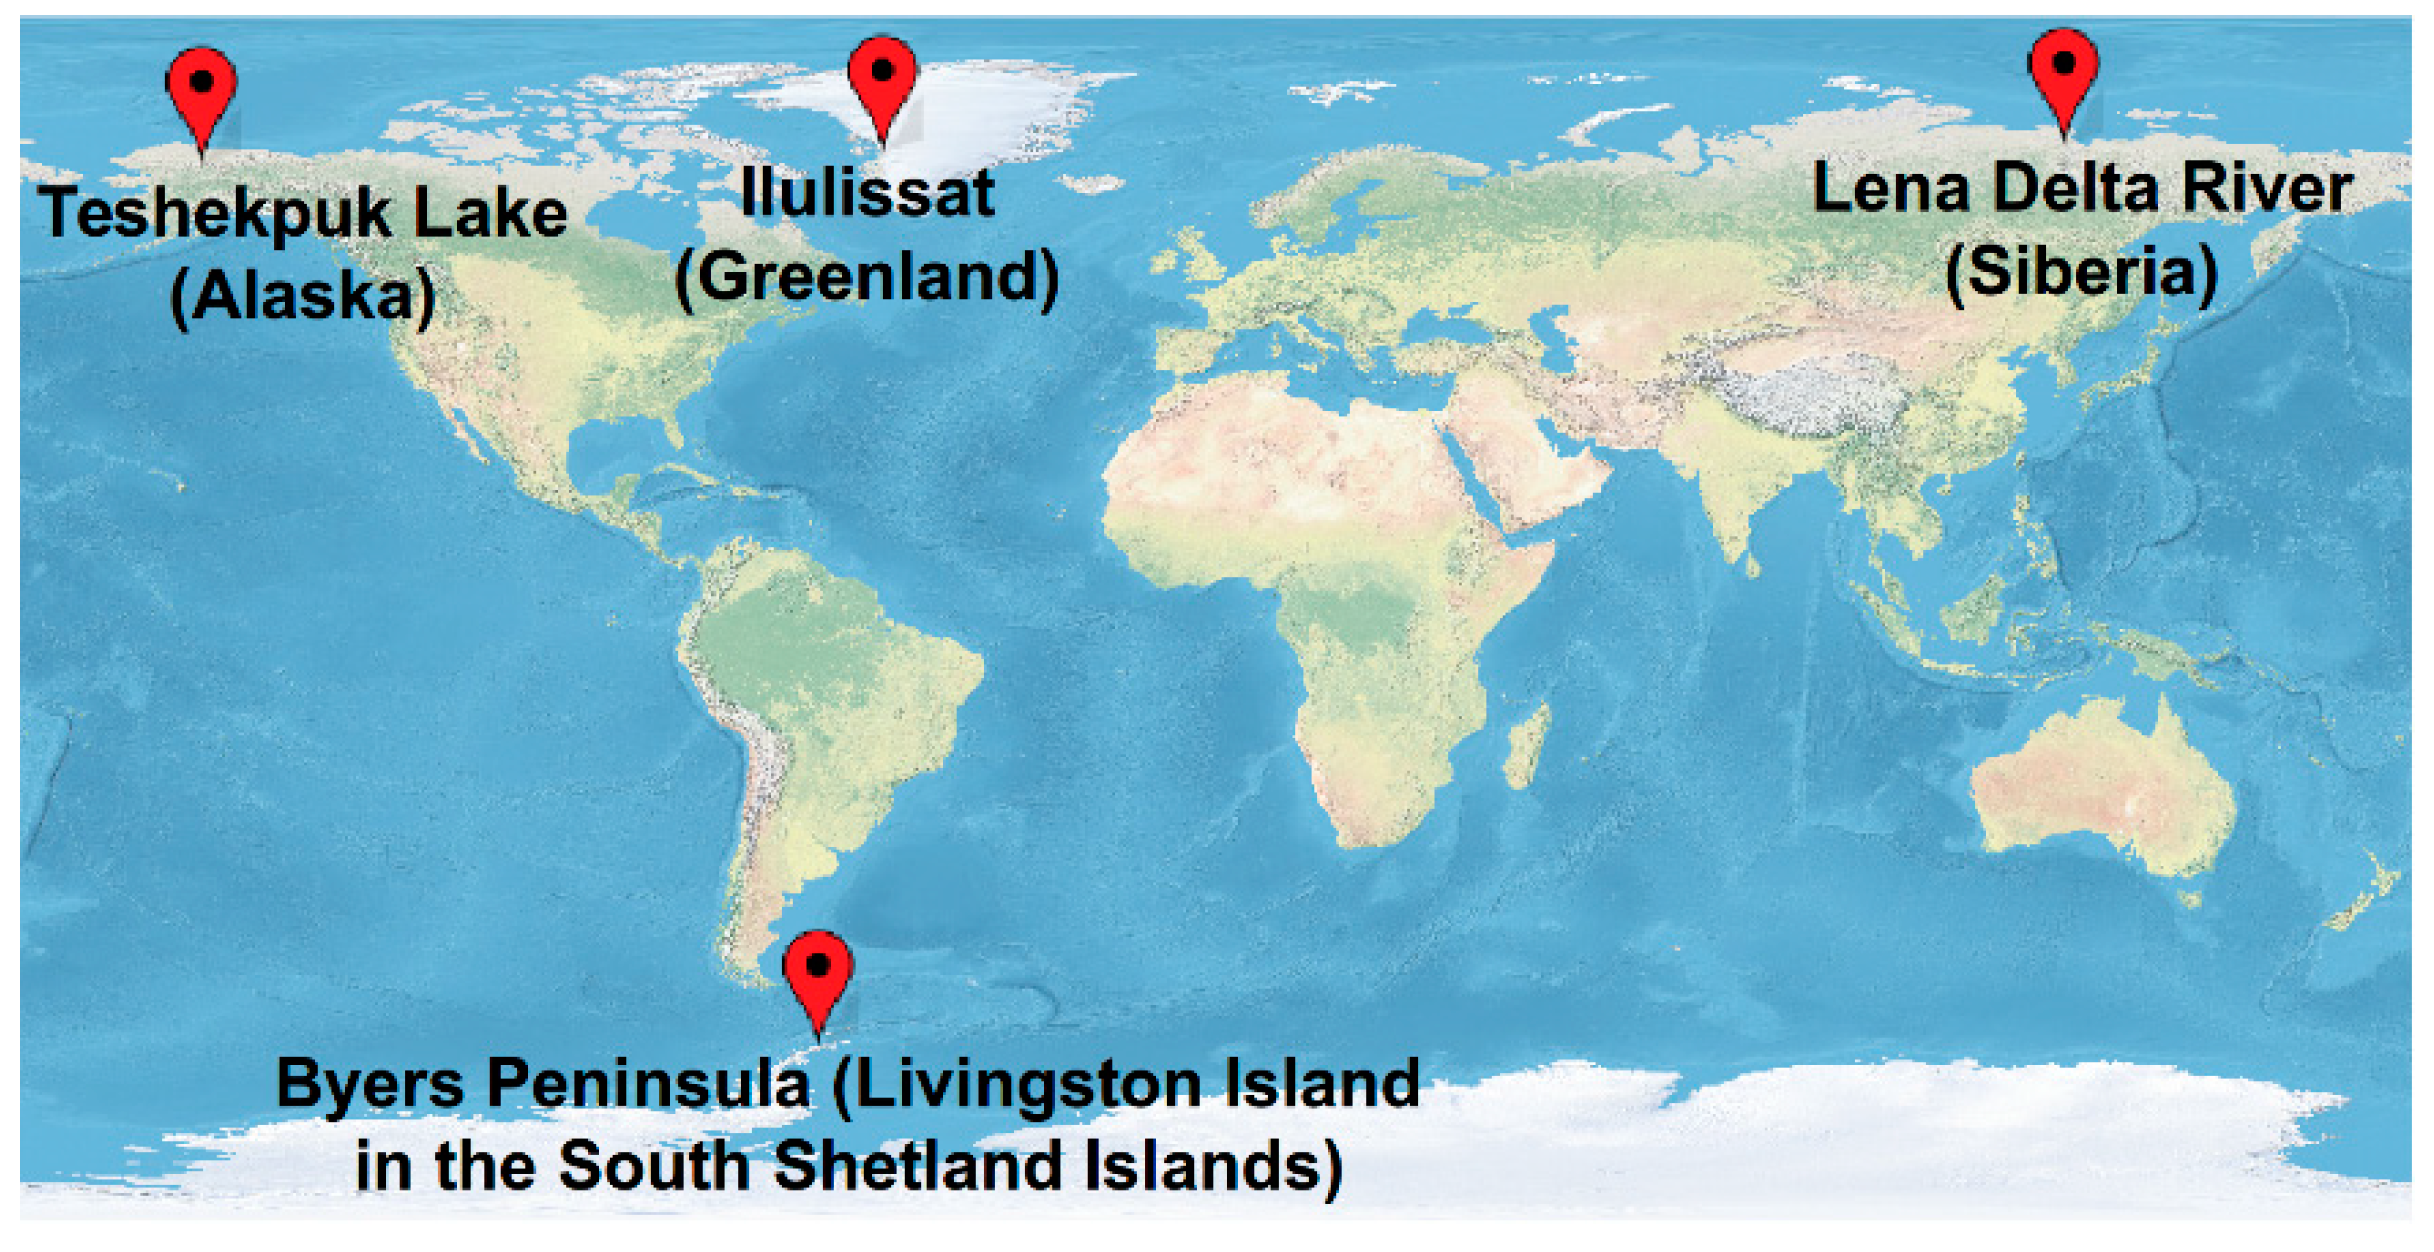
2.1. Study Regions

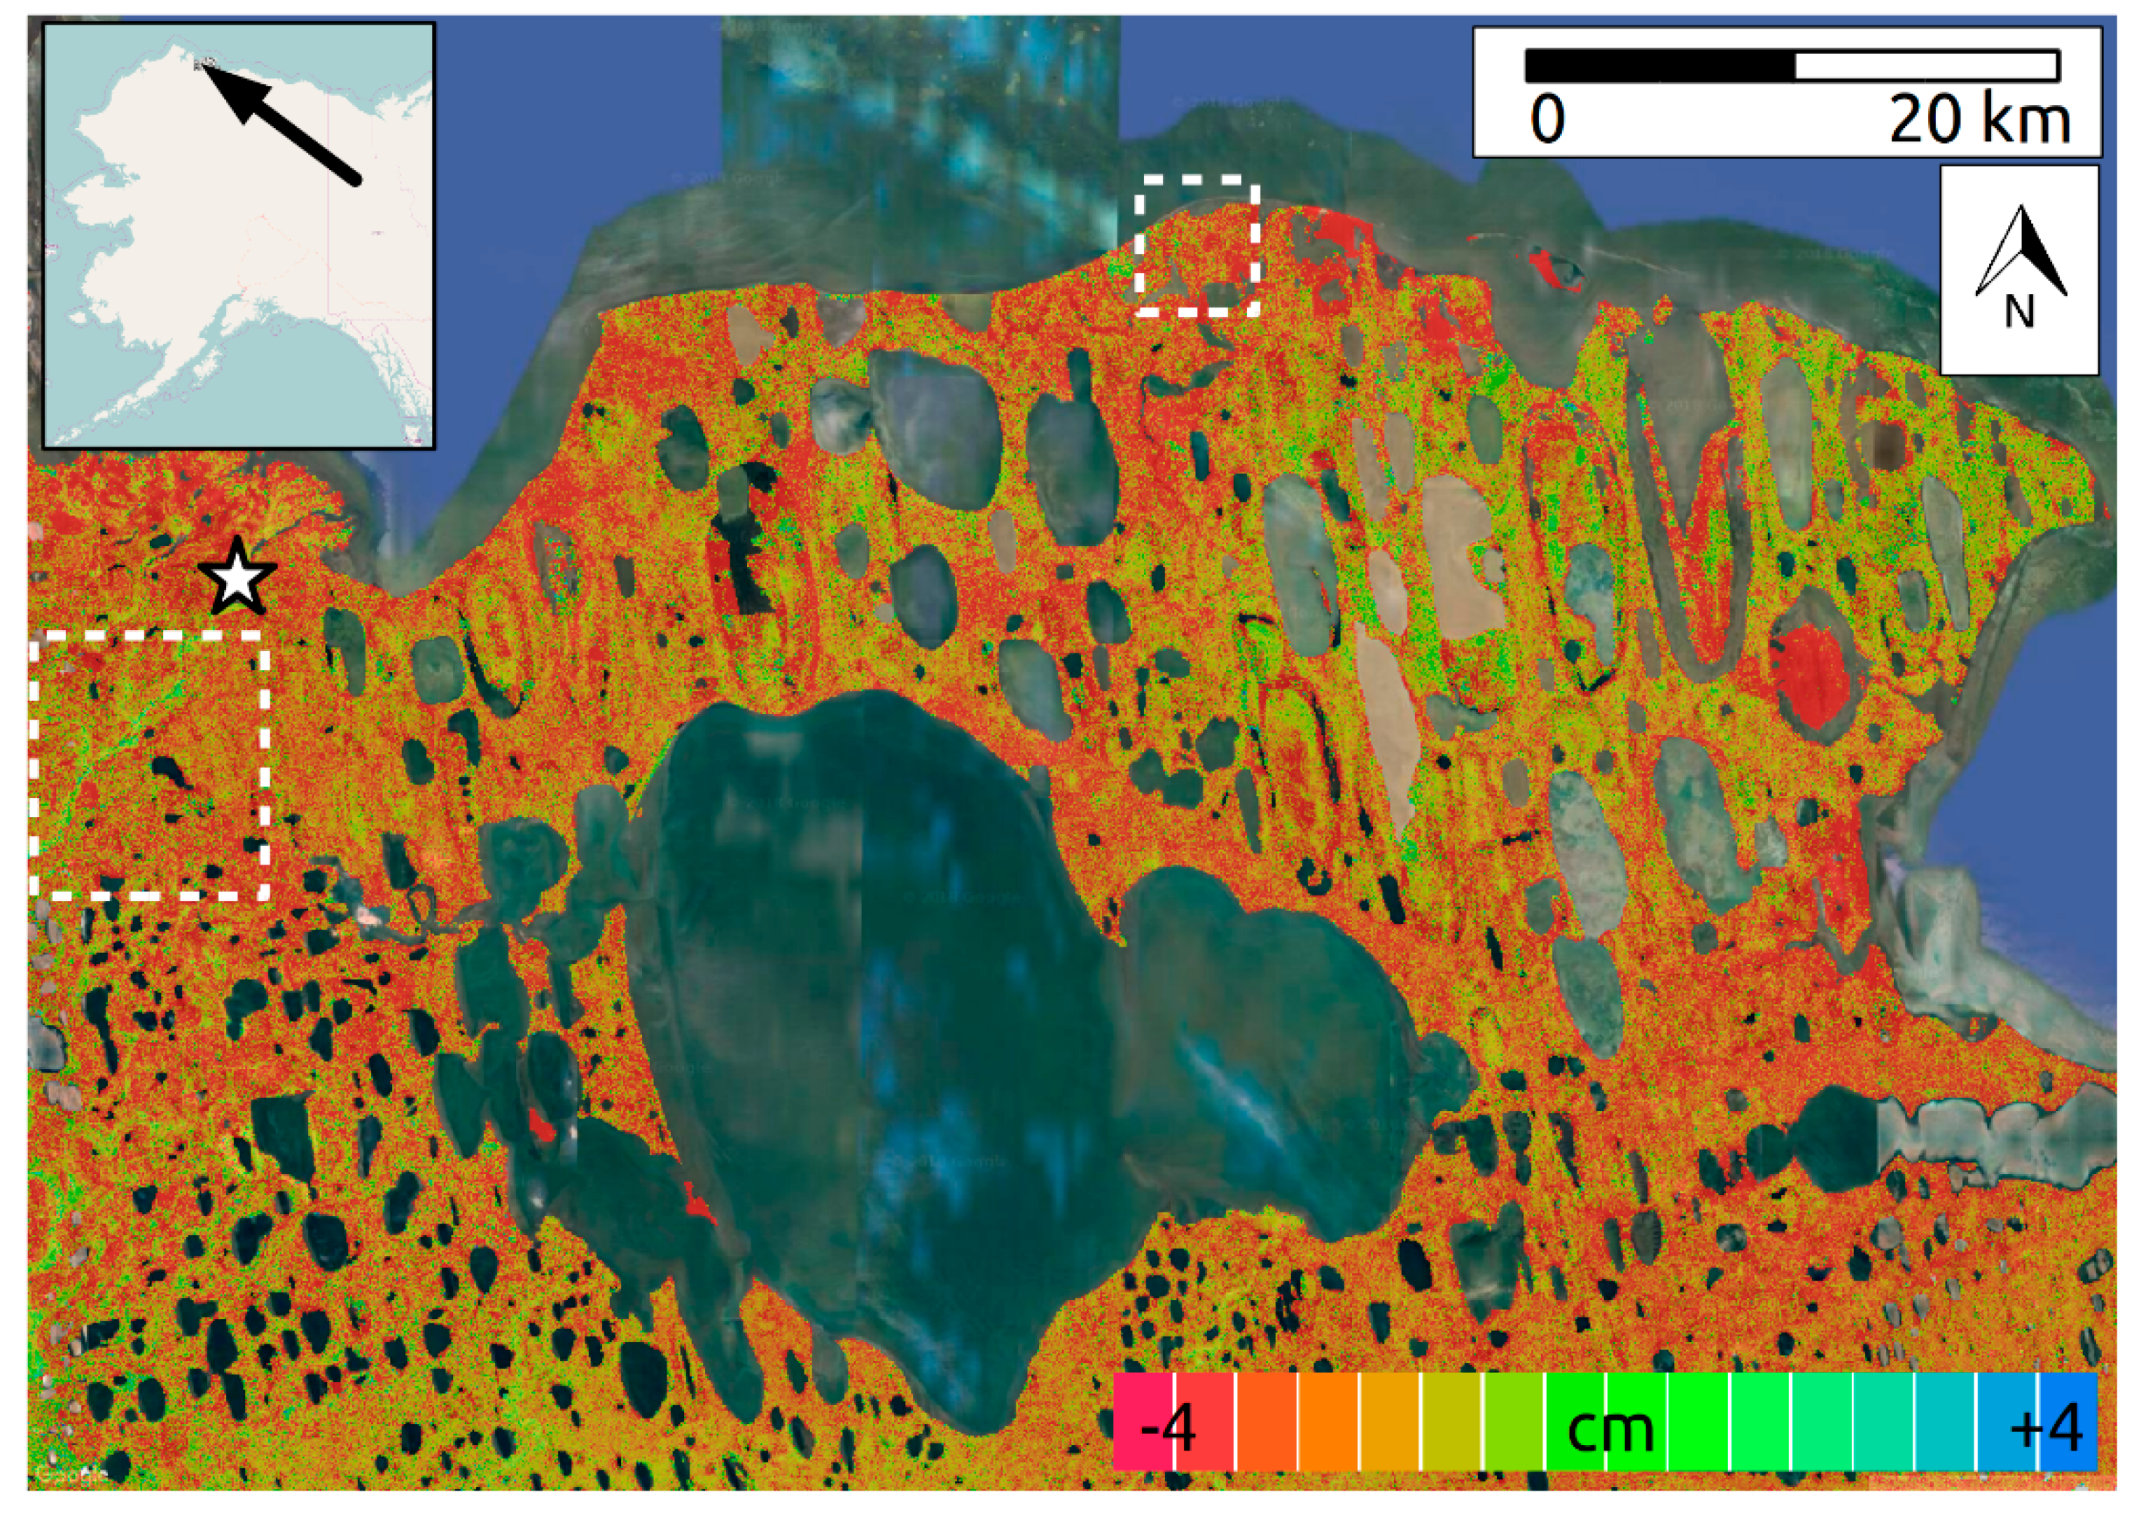
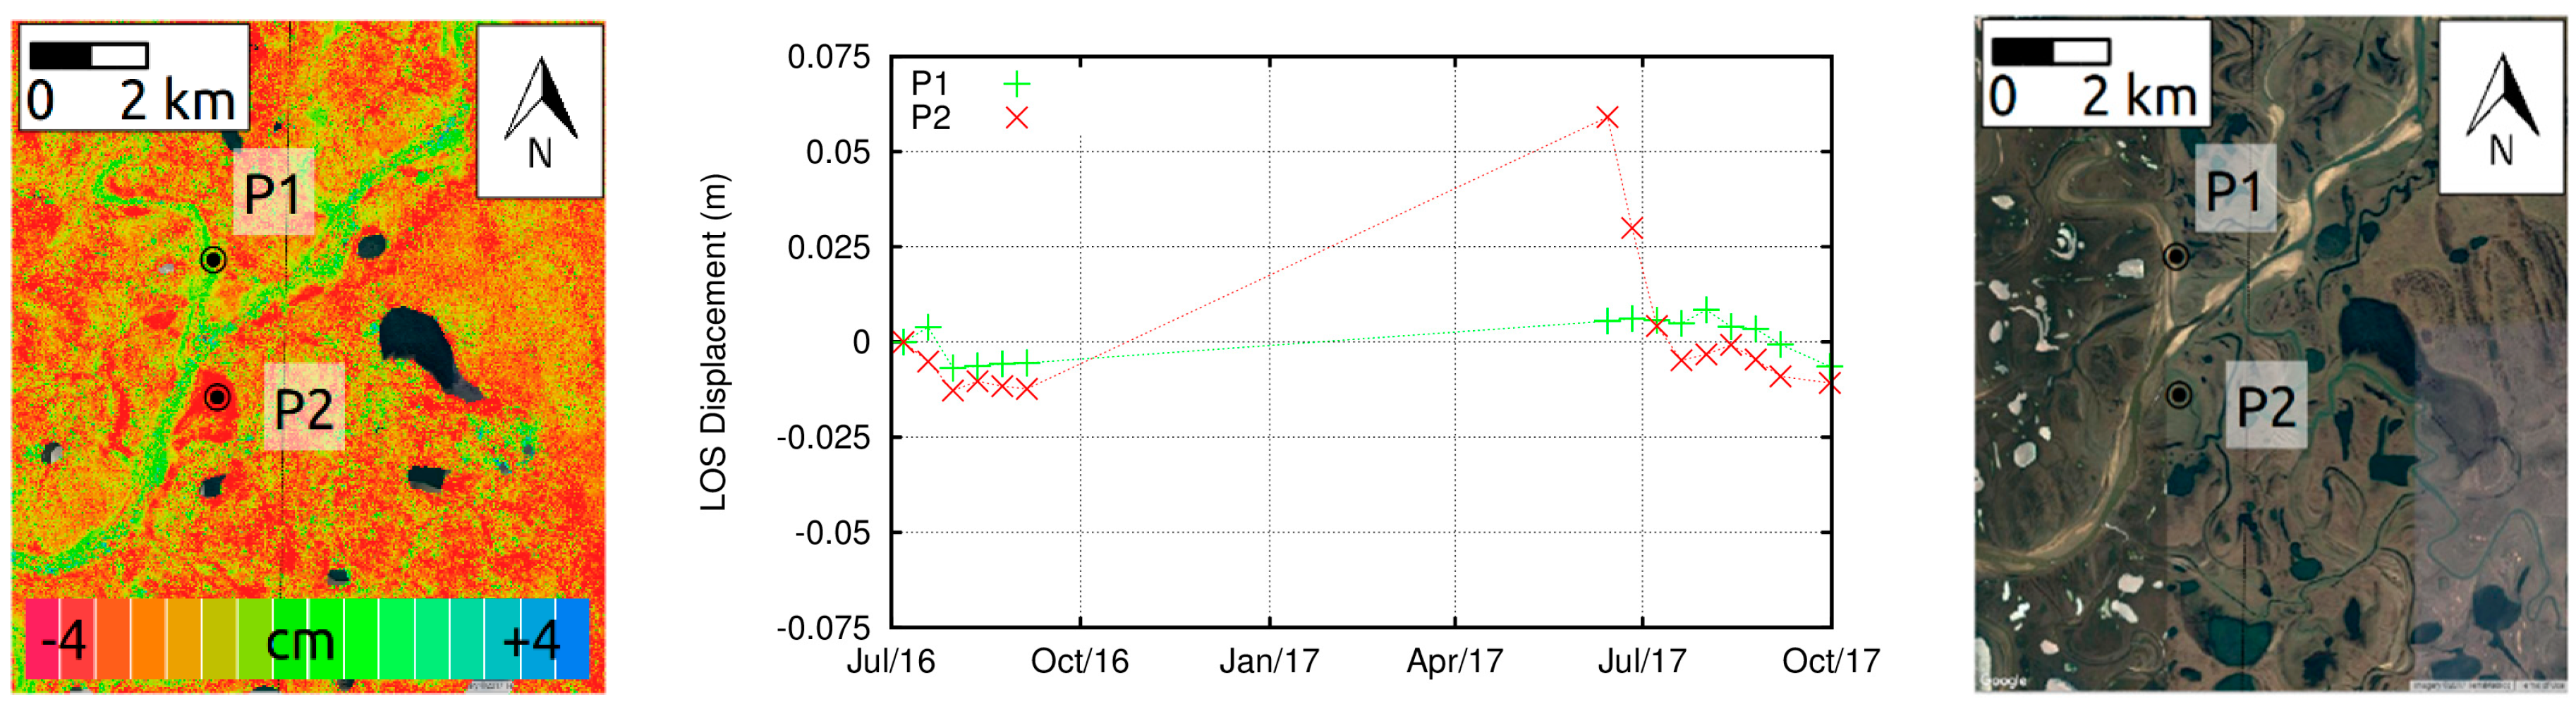
2.1.1. Teshekpuk Lake (Alaska)

Teshekpuk Lake is located in an area with continuous permafrost on the Arctic Coastal Plain in northern Alaska (Figure 1). In particular, the Outer and Younger Outer Coastal Plain around Teshekpuk Lake are characterized by numerous thermokarst lakes and drained thermokarst lake basins and together these two major landscape components occupy more than 80% of the area [17]. The Alaskan Coastal Plain geological setting consists of marine silt and marine sands composed of ice-rich permafrost with dense ice wedge polygon network and is considered highly thaw susceptible [18]. Within the extensive and generally flat landscape, intermediate small uplands (5–7 m above surrounding terrain) represent remnants of a paleo-surface prior to thermokarst development. Analyses of lake dynamics revealed that the Alaskan North Slope is subject to considerable changes, where the Outer Coastal Plain exhibits a general trend of lake drainage, while on the Younger Outer Coastal Plain along the Beaufort Sea coastline lake expansion is dominating [19]. At Barrow, 100–175 km northwest of the study area, mean annual air temperature is −9.7 °C and active layer thickness is typically in a range of 20 to 40 cm in polygonal tundra and within drained thaw lake basins [20].

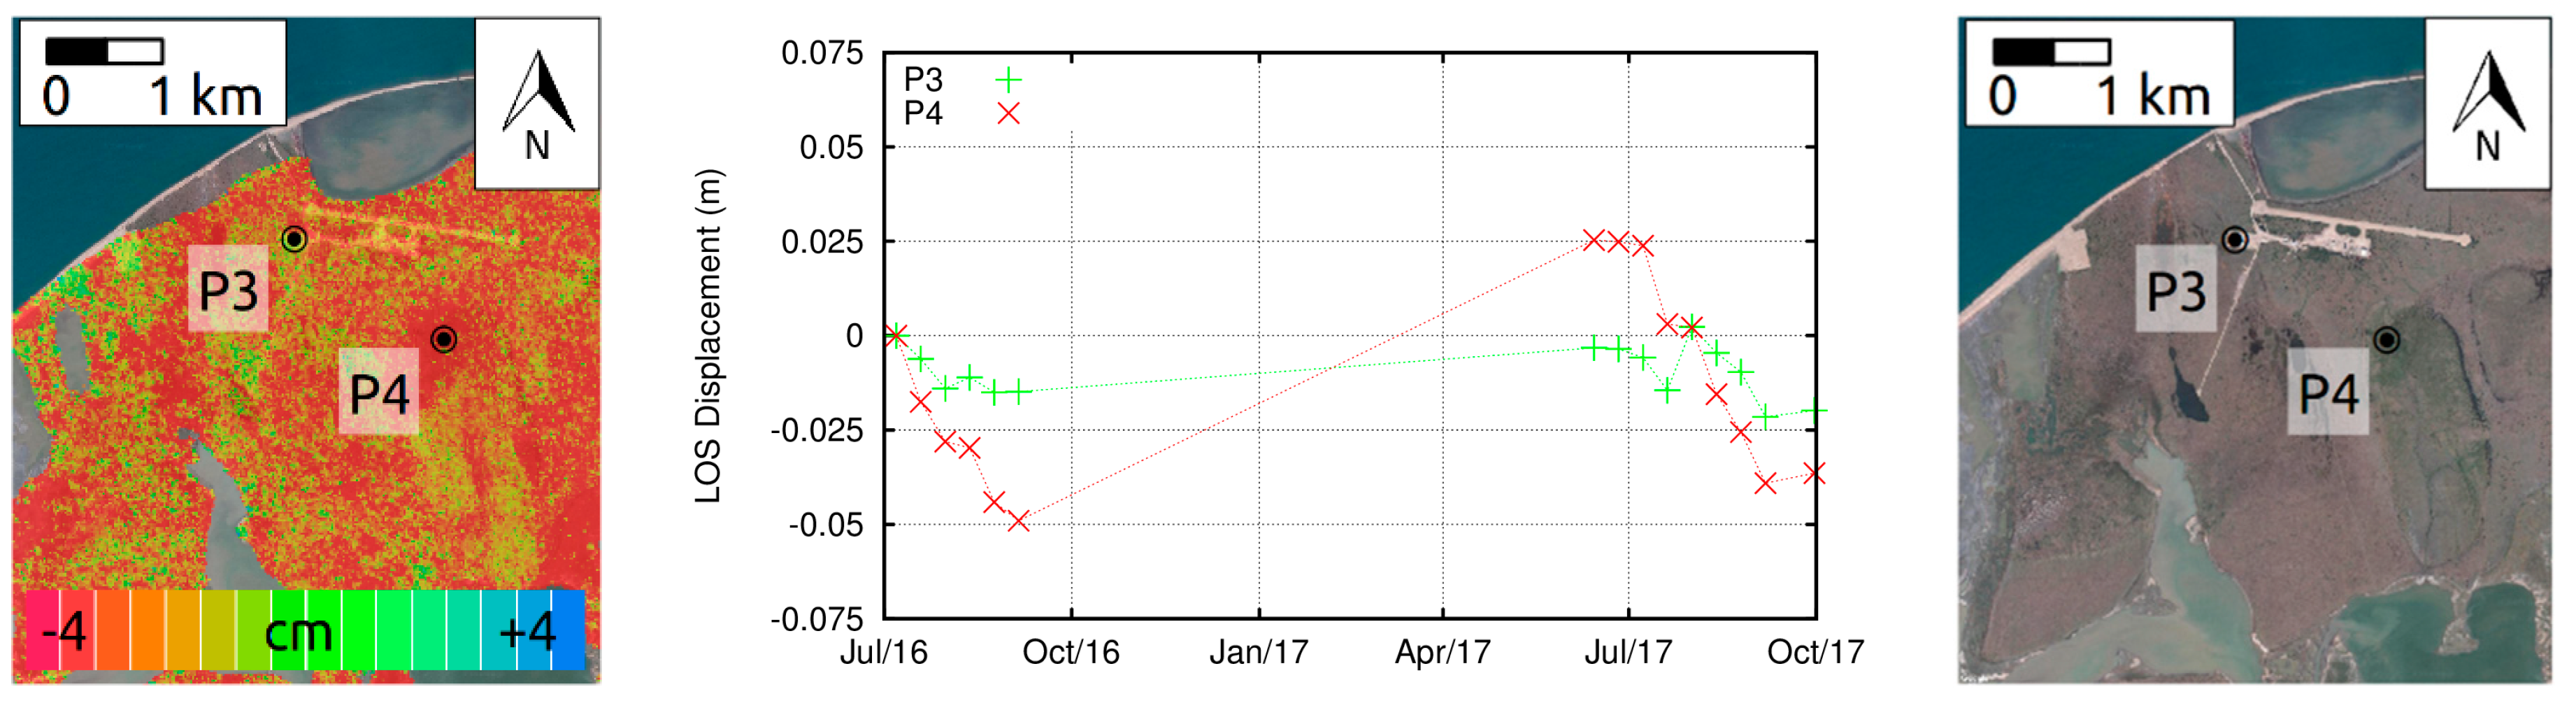
2.1.2. Ilulissat (Greenland)

Ilulissat is located in central West Greenland (Figure 1). It is the third largest town in Greenland with a bit more than 4600 inhabitants according to the Greenland statistics. The annual mean air temperature between 2015 and 2017 was −3.3 °C and the average annual precipitation was 259.3 mm (Asiaq weather station Ilulissat, unpublished). Ilulissat is situated in an area with discontinuous permafrost. The geology consists of clay and silty marine deposits surrounded by gneiss bedrock (Asiaq boring profile archive, unpublished). Settling of existing infrastructure is a well-known problem in Ilulissat. Therefore, it is of interest to understand the current permafrost conditions and possible impact to future infrastructure such as the new projected airport. The Government of Greenland wishes to expand the current airstrip in Ilulissat from 845 × 30 m to a runway of 2200 × 45 m. In addition, new buildings and service facilities need to be established.

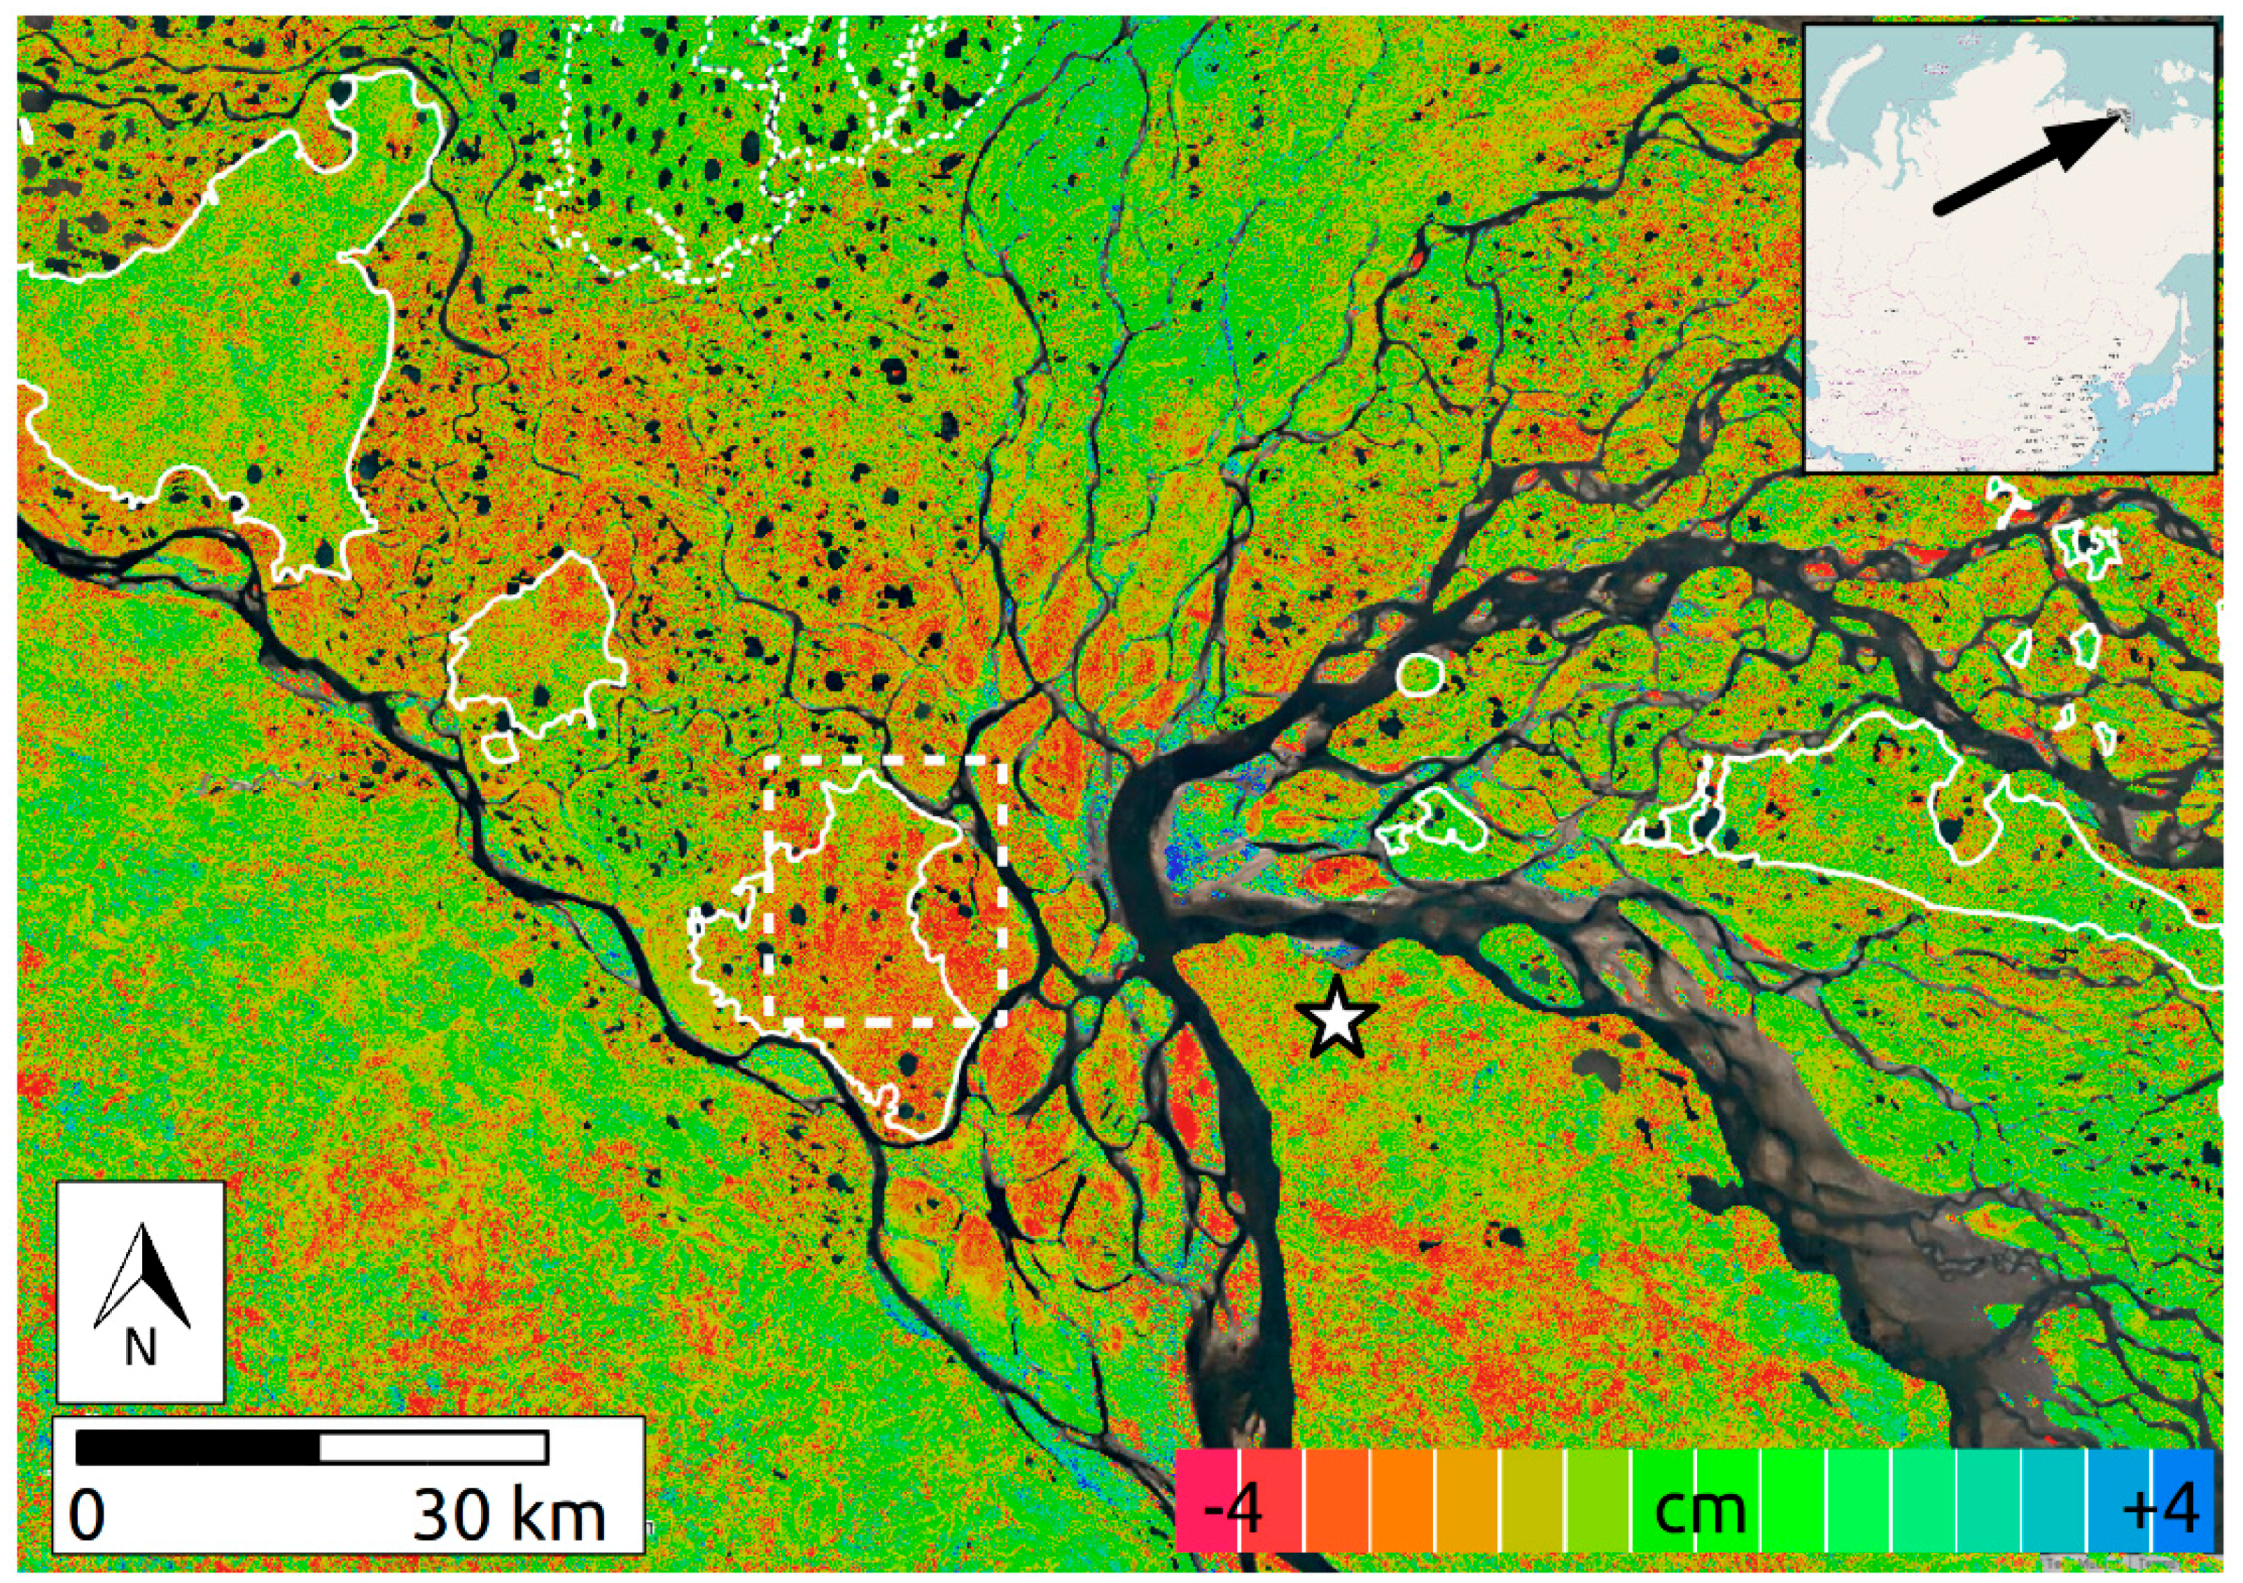
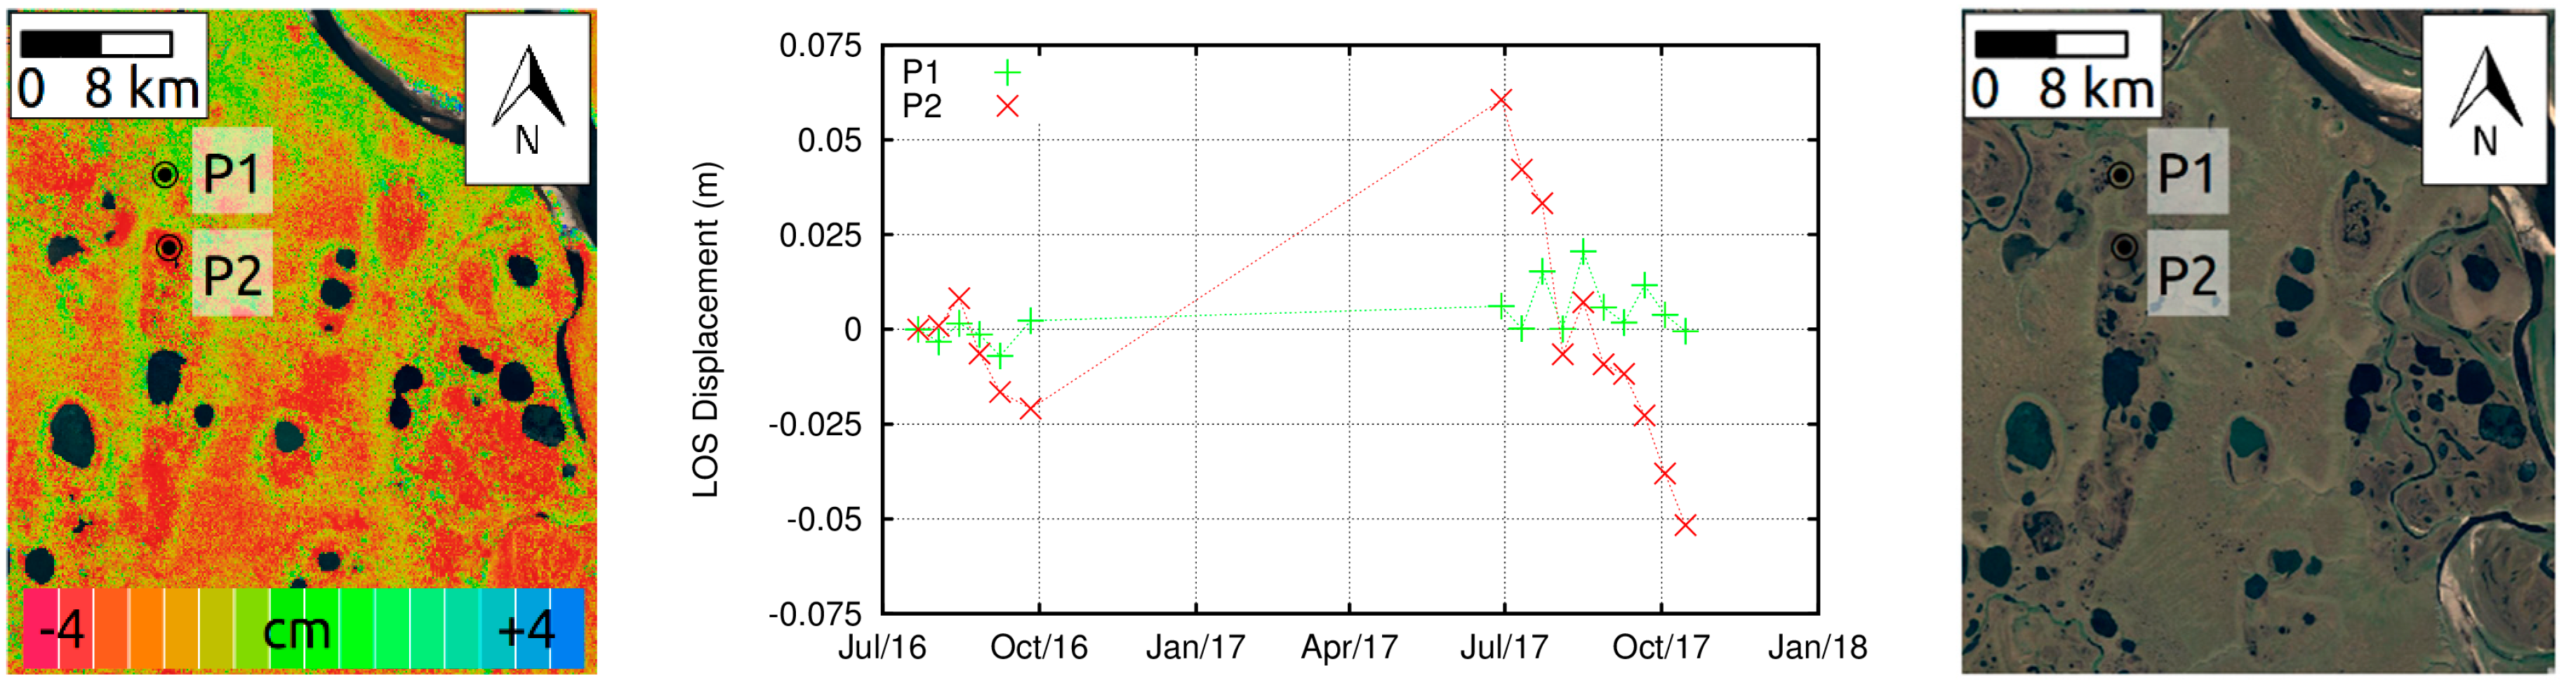
2.1.3. Lena River Delta (Russia)

The Lena River Delta is located at the Laptev Sea coast in Northeast Siberia (Figure 1). With an area of about 30,000 km2 it is the largest delta in the Arctic and one of the largest in the world. The delta comprises more than 1500 islands of various sizes, which are divided by small and large river channels. The delta is located in the zone of continuous permafrost, which largely defines the geomorphology of the region [14]. Geomorphologically, the delta area is a complicated mix of deltaic and non-deltaic units. They differ in their age, geological composition, ground ice content and height above sea level. Typical landscape features in this area are polygonal networks with low-centred polygons filled with water or high-centred polygons, large and small thermokarst lakes, drained lakes basins, drainage networks, thermoerosional valleys, floodplains and small outcrops of Devonian bedrock. The region belongs to the Arctic tundra ecozone and is characterized by typical tundra vegetation, which includes sedges, grasses, dwarf shrubs and a well-developed moss layer. The climate features long, extremely cold winters and short, cool summers, with mean annual temperatures of −10.2 °C, mean February temperatures of −30.6 °C and mean July temperatures of 9.3 °C over the last decade [21]. Snow usually starts to accumulate in September, starts to melt in May and is typically gone in less than a month. Snow depth can significantly vary depending on topography and wind action but typically does not exceed a few decimetres [22].

2.1.4. Byers Peninsula on Livingston Island (South Shetlands Islands)

The South Shetlands Islands are situated about 120 km off the northern tip of the Antarctic Peninsula, forming a group of 11 islands, with Livingston Island being the second largest (Figure 1). The study area is Byers Peninsula, the largest ice-free area of the archipelago, with about 60 km2 and a relief organized as a series of platforms reaching elevations of 70–100 m in the central plateau. Above the platform surface, a few steeper volcanic plugs stand out reaching elevations of 143 to 265 m. The coastal areas show a series of Holocene raised beaches. The bedrock is volcanic, volcanoclastic and detritic (sandstones, mudstones and conglomerates) [23], with most outcrops heavily weathered and fractured showing the effects of frost shattering [24]. The climate is Polar oceanic, with mean annual air temperatures at 70 m elevation of −2.8 °C and annual precipitation estimated from 500 to 800 mm [25]. Mosses and grasses are moderately abundant in the flat marine terraces, with lichens occurring at higher altitudes [26].

2.2. Data

Stacks of Sentinel-1 images were built for the summer seasons between 2015 and 2018 (Table 1). During the summer months of 2016 Sentinel-1 acquisitions were sporadic for all sites apart from Greenland and first images were available when subsidence already took place. For the Greenland study region, regular summer Sentinel-1 acquisitions are available for 2016 and 2017 but not for 2015. Supplementary Table S1 indicates the acquisition dates and time intervals of all Sentinel-1 SAR interferograms considered for the different study regions. The nominal repeat interval of the Sentinel-1 acquisitions was 12 days for the Teshekpuk Lake, the Lena River Delta and the South Shetlands Islands study regions. Over West Greenland the nominal repeat interval of the Sentinel-1 acquisitions was 12 days until 30 September 2016 and 6 days since then. SAR data were acquired at VV polarisation over Teshekpuk Lake and the Lena River Delta and at HH polarization over West Greenland and the South Shetlands Islands.
For topographic phase removal and terrain corrected geocoding we used the IFSAR DEM [27] for Teshekpuk Lake and the TanDEM-X DEM [28,29] for Ilulissat, the Lena River Delta and the South Shetlands Islands study regions. The IFSAR DEM was extracted from single-pass airborne interferometric synthetic aperture radar data collected in summer 2012 and is provided with a posting of 5 m and a vertical accuracy of 3 m (90% confidence level) [27]. The TanDEM-X DEM represents a new standard in global DEMs, with a finer effective horizontal resolution compared to the SRTM (Shuttle Radar Topography Mission) Digital Elevation Database [28]. The TanDEM-X DEM is based on satellite TanDEM-X acquisitions from December 2010 to early 2015 and the product is provided with a pixel spacing of approximately 12 m. The estimated absolute and relative vertical accuracies of the TanDEM-X DEM are <10 m and 2/4 m (slopes ≤ 20%/>20%), respectively [29]. The TanDEM-X DEM shows a remarkable level of details and consistency, making it particularly well suited for InSAR applications at Sentinel-1’s native 10 m resolution. Indeed, an error of 3 m in the estimation of the topographic height, for example, as a consequence of an inaccurate DEM, results for Sentinel-1 typical perpendicular baseline components of 100 m in a phase error of 0.06π, corresponding to a line-of-sight displacement error of less than 1 mm.

2.3. Methods

Our investigations are based on multiple interferograms acquired during the summer season in order to provide consistent series of interferograms with 6 or 12 day time intervals (Supplementary Table S1), which show very good coherence under snow-free conditions. Yearly Sentinel-1 interferograms from the end of the summer also show a sufficient level of coherence (>~0.2) in order to link data between subsequent years. Although mid-winter interferograms over 6 or 12 days also often show high coherence, they could not be considered in our analysis because snow melt, fall or drift—in particular in autumn and spring—cause strong decorrelation [30,31] precluding the possibility of linking winter and summer data.
Our InSAR processing sequence includes the co-registration of the single-look complex Sentinel-1 image, the computation of interferograms in series and over one year at the end of the summer season with a multi-looking factor of 5 pixels in slant-range and of 1 pixel in azimuth, the removal of the topographic-related phase with use of the external DEM, adaptive phase filtering [32], phase unwrapping using a minimum cost-flow algorithm [33], low-pass phase filter, computation of summer cumulative displacement maps and time series of movement via multi-baseline InSAR [34,35] and terrain-corrected geocoding. For the precise co-registration of the Sentinel-1 IWS a refinement based on the spectral diversity within bursts and swaths was included [36]. Occasional ionospheric disturbances were mitigated using a low-pass filter but without applying a procedure based on split-beam [37] or split-spectrum [38] interferometry. Phase unwrapping errors could be not completely avoided and were observed in particular at the scale of a few tens of meters.

3. Results

3.1. Teshekpuk Lake (Alaska)

Sentinel-1 interferograms acquired every 12 days from 14 June to 12 October 2017 were used to compute a map of the averaged summer displacement rates in the satellite line-of-sight direction for Teshekpuk Lake (Alaska) (Figure 2). As suggested by [7], floodplain areas were picked-up as reference. For most of the area the surface displacement is larger than 4 cm. However, not only floodplain areas (P1 in Figure 3) but also other types of landforms, such as for instance former fuel tanks close to the abandoned airfield at Point Lonely (P3 in Figure 4), were without significant movements. Temporal series of displacements on selected locations indicate that within the Arctic peaty silty riverine ecological landscape of the Ikpikpuk River Delta subsidence during the thawing season is occurring rather quickly in June (P2 in Figure 3), while in Arctic peaty sandy lowlands the displacement is more continuous over the observation period (P4 in Figure 4). In both cases, maximum displacements of more than 5 cm are observed. The magnitude of the observed displacement in 2016 (~1 cm for P2 and ~5 cm for P4) is smaller than in 2017 (~6 cm for both P2 and P4), because the Sentinel-1 acquisitions started later within the season (7 July 2016 instead of 14 June 2017). Visual inspection of Sentinel-2 images in 2017 indicates that the main snowmelt (i.e., the transition from snow-covered to snow-free ground) in the Teshepuk lake area occurred between end of May and mid-June, with the ground largely being snow-free on 15 June. Therefore, the first Sentinel-1 acquisition in 2017 (14 June) can be expected to coincide closely with the beginning of seasonal active layer thawing, so that the full seasonal subsidence signal is captured in this year. Interferograms over 12 days between 5 September 2016 and 14 June 2017 and after 30 September 2017 are decorrelated and the time series are thus limited to the summer months. Between the two clusters of summer data part of the movement is thus not recorded because coherent interferograms are missing.
Reference point P1 is located within the Ikpikpuk River Delta with sandy soils with ice-poor permafrost. Here, frequent sedimentation restricts vegetation growth. According to the land cover classification by [39], P2 belongs to Riverine Wet Sedge Tundra, where flat areas on active and inactive floodplains within the Ikpikpuk River Delta are subject to frequent or infrequent flooding. The vegetation cover is dominated by sedges, primarily by Carex aquatilis and Eriophorum angustifolium. The surface around P2 varies from non-patterned relief to low-centred polygons, indicative for ice-wedge development that provides potential for thaw subsidence. At Point Lonely, P3 is located within the area of former fuel tanks. P4 is located within a drained thaw lake basin south of Point Lonely. According to [39], the land cover type belongs to Coastal Wet Sedge Tundra, where low-lying salt-affected areas have vegetation dominated by sedges and the surface is non-patterned. Soils are poorly drained and may have moderately thick peat layers underlain by silty loam and ice-rich permafrost. This is in line with detailed coring investigations by [40] that suggest that, despite the lack of intrasedimentary excess ice in lacustrine sediments and the higher dry bulk density within drained thaw lake basins, accumulation of organic-rich deposits after lake drainage results in high soil ice contents above the mineral drainage layer. The surface within drained lake basins might remain flooded after snow melt and continuously saturated during the growing season.

3.2. Ilulissat (Greenland)

Sentinel-1 interferograms acquired every 6–12 days from 2 June to 18 September 2016 were used to compute a map of the total summer displacement in the satellite line-of-sight direction for Ilulissat (Greenland) (Figure 5). The reference area was selected on an outcrop area. One large localised region with strong subsidence is observed in a terrain with peat that is surrounded by bedrock of gneiss [41]. Boreholes from the area show that the peat is underlain by fine-grained marine sediments. Due to high residual salt concentrations in the sediments, part of the pore water remains unfrozen even during winter [42]. Temporal series of displacements on a couple of selected locations (points P2 in Figure 6 and P4 in Figure 7, both on the peat terrain underlain by fine-grained marine sediments) indicate subsidence from June to July followed by frost heave from August to October. Maximum summer displacements of about 3 cm are observed. Of particular note is that seasonal subsidence-frost heave patterns are superimposed by an inter-annual trend towards stronger subsidence and that the surface seems not to return to its initial elevation. A longer observation time periods will permit studying more precisely the long-term changes of the Earth surface. Outcrop areas (e.g., P1 in Figure 6) and the surrounding of the airport (P3 in Figure 7) appear stable.

3.3. Lena River Delta (Russia)

Sentinel-1 interferograms acquired every 12 days from 29 June to 15 October 2017 were used to compute a map of the cumulative summer displacement in the satellite line-of-sight direction for the Lena River Delta (Siberia) (Figure 8). The reference area was selected on an elevated barren bedrock area within the Kharaulakh Mountain Ridge. Regions with strong subsidence of more than 4 cm and areas without significant displacement (i.e., less than 1 cm) are observed. The three geomorphological units of the Lena Delta [43] cannot be clearly discriminated in the summer Sentinel-1 subsidence maps. While the so called third geomorphological terrace consists of very ice-rich permafrost deposits of yedoma type, the second and first terrace consist of less ice-rich fluvial deposits. Although the potential for subsidence is likely to be different between geomorphological units, InSAR results for the Lena Delta suggest that near-surface soil properties control seasonal subsidence signals.
The temporal series of displacement indicates that the summer subsidence in 2017 was approaching nearly 10 cm for certain locations (e.g., Figure 9). Because the acquisitions in 2016 started later within the season over this site, the magnitude of the observed displacement in 2016 is smaller than in 2017. The difference between the two locations P1 and P2, which belong to the same terrace on Kurungnakh Island in the southern central Lena Delta, are essentially topographical—P1 is an upland area and P2 is in a thermokarst basin. Similar results were observed by [14] with TerraSAR-X InSAR. In addition to thermokarst depressions, stronger displacement is observed on steep slopes compared to surrounding stable flat yedoma uplands on Khardang Island in the western Lena Delta. Extensive bedrock areas in the Lena Delta hinterland and parts of the first river terrace exhibit more heterogeneous subsidence and uplift signals. Active layer depth varies spatially depending on the microtopography and wetness conditions, where elevated and dry locations can exhibit up to 20 cm deeper active layer than low and wet locations [43]. The heterogeneous subsidence signals in Figure 8 might reflect, in addition to the topographical effects, the spatially variable active layer depth and active layer ice/water contents over the delta.

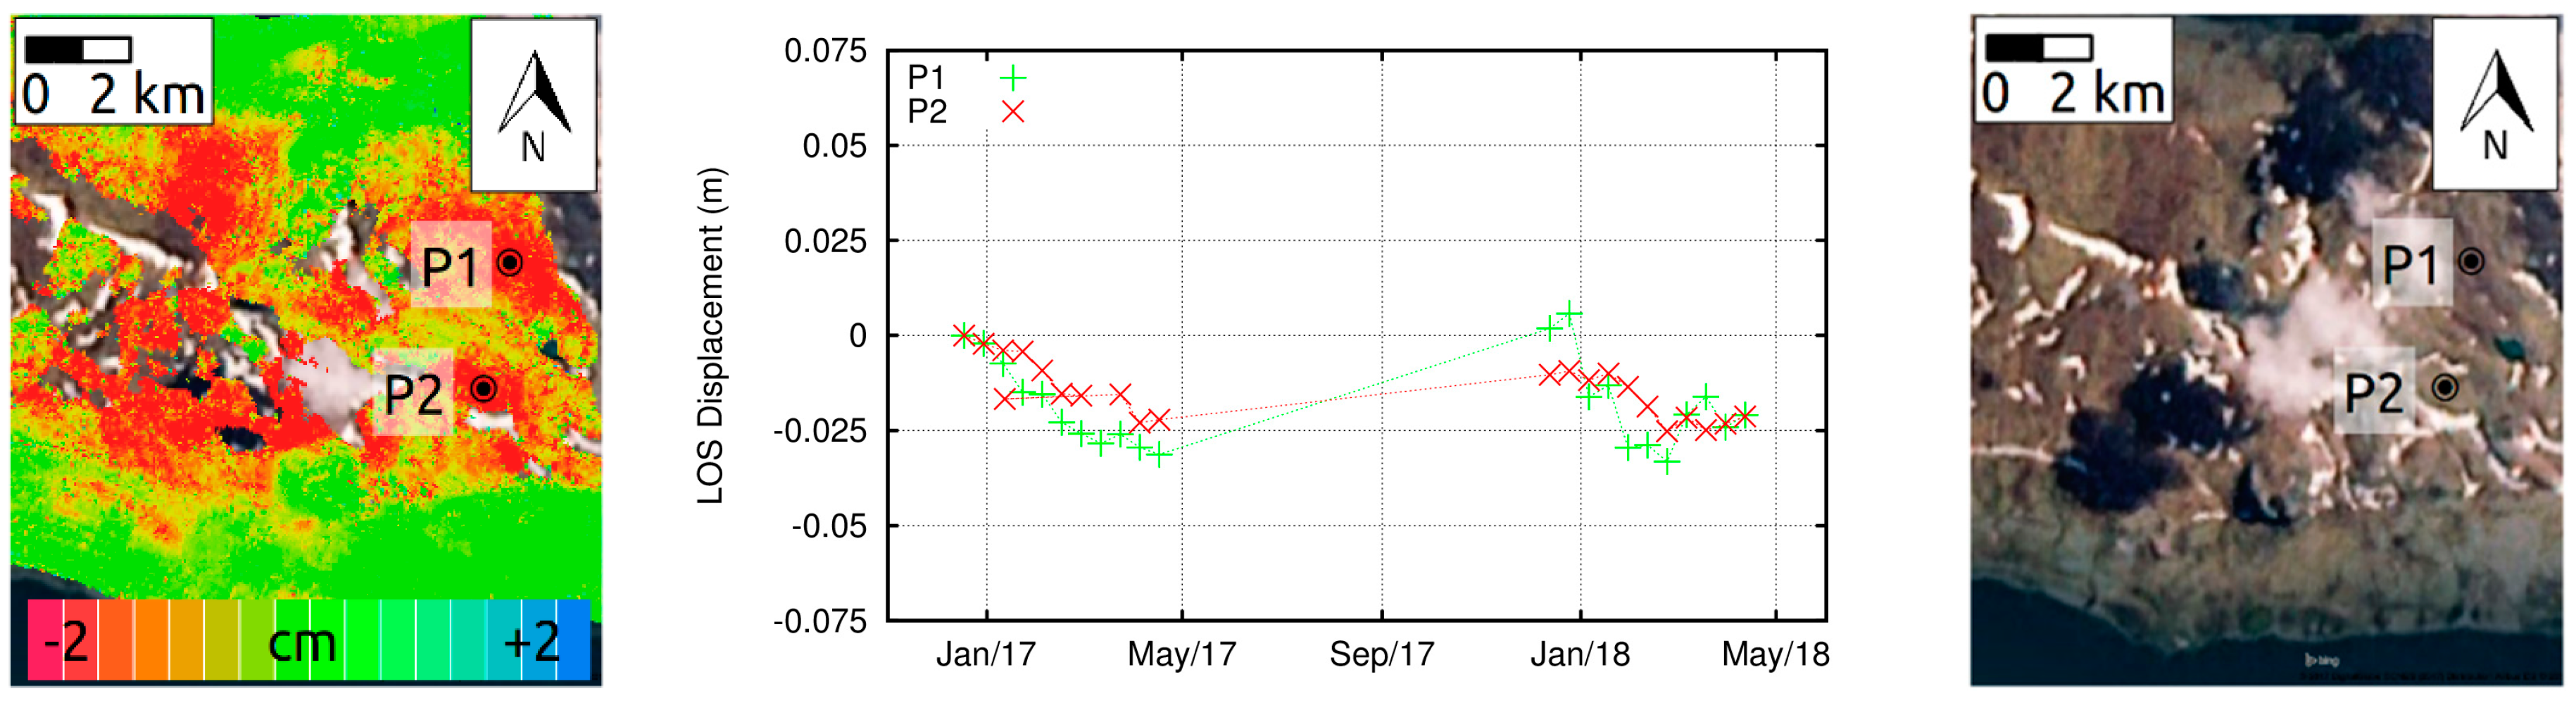
3.4. Byers Peninsula on Livingston Island (South Shetlands Islands)

Sentinel-1 interferograms acquired every 12 days from 30 December 2016 to 5 April 2017 were used to compute a map of the cumulative summer displacement in the satellite line-of-sight direction for Byers Peninsula on Livingston Island (South Shetlands Islands, Antarctic) (Figure 10). The reference area was selected on an outcrop area. Over this region the Sentinel-1 interferograms are generally more decorrelated than over the other sites. In computing the mean displacement maps we considered only image pairs over 12 days with mean coherence values of more than 0.2. The lack of coherence occurs in the highest areas of the peninsula and is related to the longer lasting snow cover and to the intermittent summer snowfall events.
Over Byers Peninsula surface subsidence is less pronounced than for the previously discussed cases, with values reaching 2–3 cm (Figure 11). The areas with lower subsidence occur in the lower elevation sectors, coinciding with Holocene raised beaches, which in Byers form 7 terrace levels up to an elevation of about 22 m. Beach deposits are diverse, varying from coarse cobbly and bouldery sediments and hence have a smaller potential for ice-segregation and frost heave compared to fine-grained deposits, which show intense signs of cryoturbation and the presence of mud-boils in some areas [44]. Permafrost is sporadic in the raised beaches, which also may limit subsidence. It is worth noting that a sector ca. 2.6 km north of Cerro Negro, in the northern beaches, shows increased subsidence coinciding with a moraine deposit as mapped by [23].
The summer subsidence is highest on the plateau surfaces (P1 and P2 in Figure 10), where permafrost is continuous and periglacial features, such as patterned ground, stone streams and solifluction lobes, are ubiquitous [24,45]. The time-series show a period of increasing subsidence from late December to mid-February, followed by general stabilization in both years (Figure 11). In 2017, small amounts of subsidence were observed again in late March. Borehole temperatures from Papagal in Hurd Peninsula (Figure 12), ca. 30 km to the east of Byers Peninsula, show that the 2016/2017 summer period was characterized by fast warming of the soil until mid to end February and then interrupted by a cold spell with refreezing that lasted until 8 March, when ground warmed again until early April until cooling started. The ground thermal regime is coincident with the subsidence measurements, supporting their quality. In 2018, thaw settlement stopped in March, followed by a small heave.

4. Discussion

4.1. Error Assessment

In a first attempt to estimate the uncertainty of the summer surface subsidence Sentinel-1 products we consider past measurements at C-band over urban areas, where a similar high degree of coherence over a multi-annual period is typically observed as in 6–12 days over low-land permafrost areas. In a major validation project [46] an error of 6–7 mm was assessed for single measurements at C-band. This error is partly attributed to noise (e.g., 1–2 mm) and partly to atmospheric artefacts (e.g., 5–6 mm). Stacking about 10 Sentinel-1 12-days interferograms over one summer season in a row (i.e., interferograms A-B, B-C, C-D and so on), results for the noise in an expected displacement error of about 3 to 6 mm (i.e., 10/sqrt (10) * 1–2 mm) and of 5 to 6 mm for the atmosphere (i.e., the atmosphere of the first and last scenes only). Altogether, our expected displacement error is thus on the order of 1 cm.
In urban areas at mid latitudes, we attribute the major error sources to the InSAR quality to tropospheric disturbances and phase noise. For low-land permafrost we should however also take into account possible effects on the InSAR phase of varying ionospheric [37,38], soil moisture [47,48], snow-cover [49] and vegetation [50] conditions. The presence and systematic changes of these variables in differential interferometry may limit the accuracy of the estimated deformation. It is very difficult to quantitatively characterize the impact of all these effects on the observed interferometric phase, because, on one hand, models to derive relative phase changes are not available in all cases, and, on the other hand, sensing the ionospheric conditions and the soil moisture, snow-cover and vegetation characteristics of permafrost regions at a sufficient spatial and temporal scale is nearly impossible. For the moment, we have to bear in mind that the maps and graphs presented at Figure 2, Figure 3, Figure 4, Figure 5, Figure 6, Figure 7, Figure 8, Figure 9, Figure 10 and Figure 11 might not only represent surface displacement but also changes in ionospheric, soil moisture, snow-cover and vegetation conditions.
Finally, we remark that on local areas undersampling of the SAR data in relationship to the large rates of movements can cause phase unwrapping errors. This effect leads to an underestimation of the displacement, as observed over active rock glaciers in mountain permafrost regions [51]. In addition, we observe that thawing might have already started when interferograms are coherent at the beginning of the season. Thus, the amount of detected surface subsidence with Sentinel-1 data in our study might be underestimated.

4.2. Intercomparison of InSAR Results

Another possibility to assess the error of InSAR measurements is to intercompare results from different sensors, possibly operating at different wavelengths. In the southern part of the Lena River Delta, Antonova et al. [14] used TerraSAR-X data for the InSAR analysis. We compared the TerraSAR-X vertical displacement map from the summer of 2013 with the Sentinel-1 line-of-sight displacement map from the summer of 2017 in wet thermokarst basins (Figure 13), where the TerraSAR-X displacement map shows distinct subsidence signals of up to 2 cm. The spatial pattern of subsidence in the basins agrees very well between the TerraSAR-X and Sentinel-1 maps. We focus on four basins and compared Sentinel-1 subsidence maps from both 2016 and 2017 with TerraSAR-X (Figure 14). Additionally, we show a RapidEye optical image from 2010 in order to visually interpret the InSAR patterns. Some extremely wet areas within the four basins are incoherent with TerraSAR-X but valid on Sentinel-1 maps. On one hand, Sentinel-1 can give a better overview of the displacement process. On the other hand, however, it is also possible that these areas are especially prone to errors due to the larger phase noise. Generally, the Sentinel-1 subsidence magnitude in the basins in 2016 is substantially lower than in 2017, because of the incomplete stack of images. Although some spatial patterns look similar on the 2016 and 2017 Sentinel-1 maps of Figure 14 (e.g., basin A, two features in the centre of basin C, lake shores in the basin D), the Sentinel-1 map from 2017 looks much more similar to the TerraSAR-X map. Sentinel-1 in 2017 shows a much larger magnitude of seasonal subsidence compared to TerraSAR-X in 2013, even more if the line-of-sight displacement values would be multiplied by a factor of 1.29 for conversion to vertical direction at an incidence angle of 39 degrees. As described in [14], the climatic conditions were different for the two seasons, with 2013 being the coldest summer of the last decade. The exceptionally cold summer could explain the reduced subsidence detected by TerraSAR-X in 2013. However, not only the physical processes but also the difference in the Sentinel-1 and TerraSAR-X wavelengths, and, thus, the sensitivity to the ground displacement, could play a role.

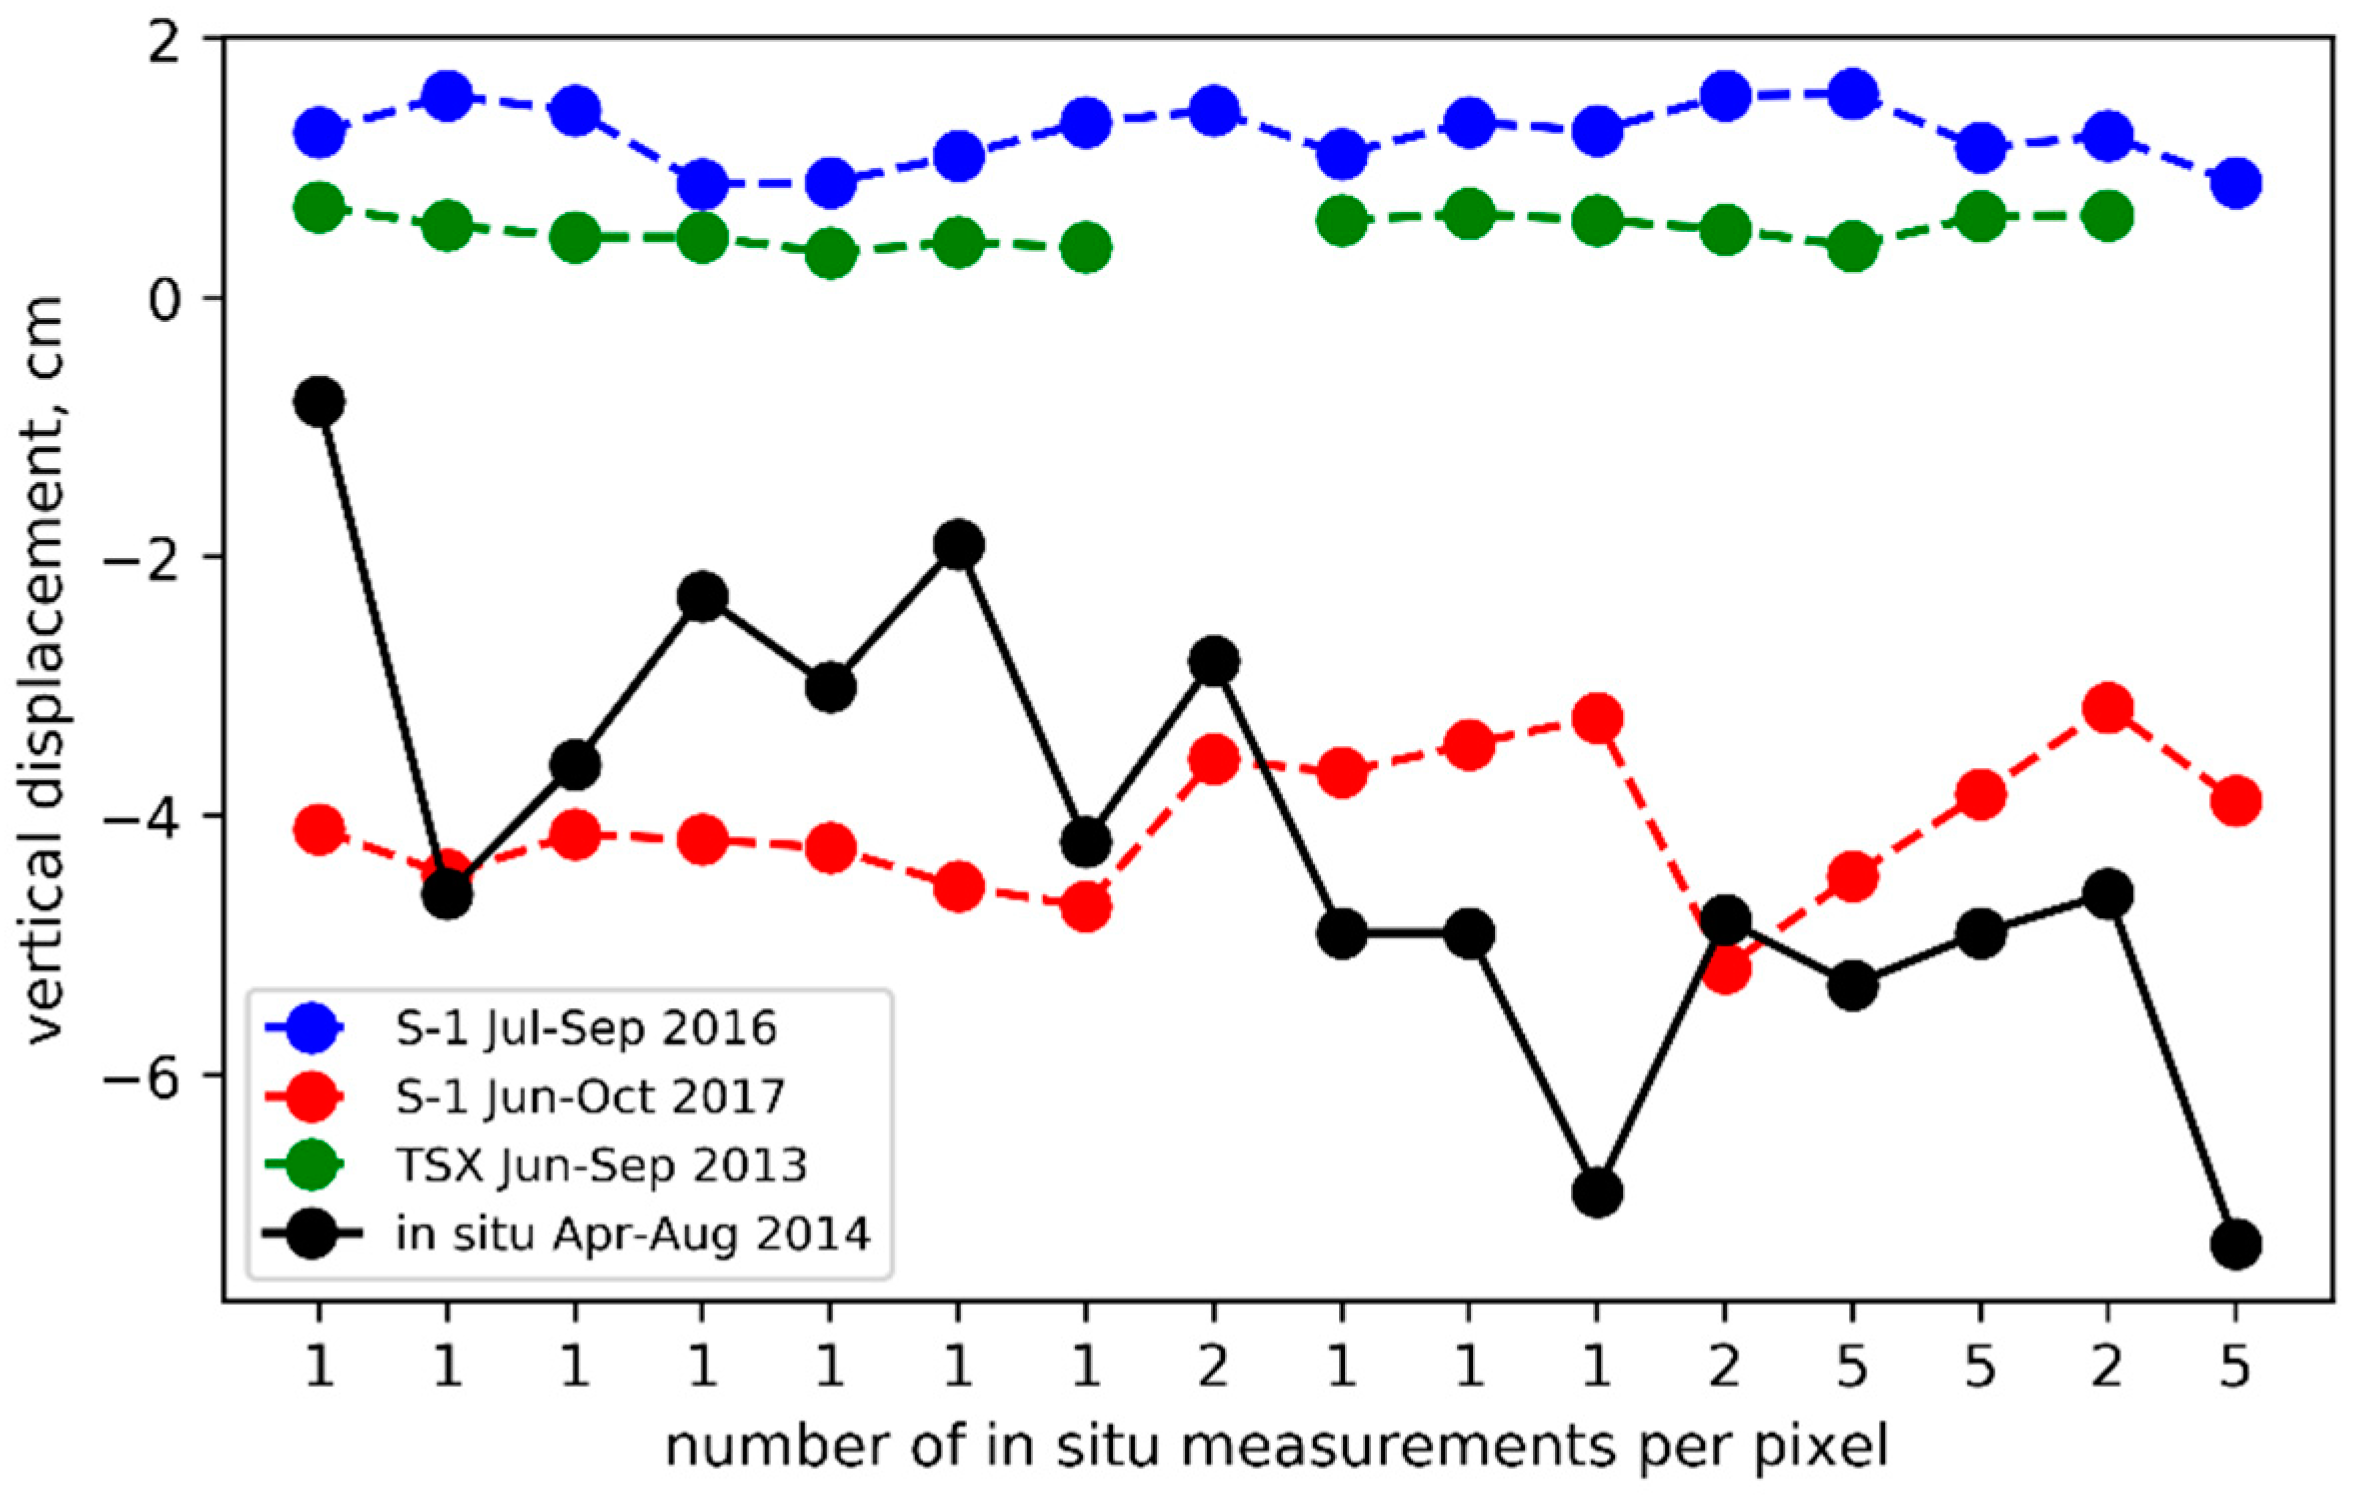
4.3. In-Situ Validation

Only a thorough validation with in-situ data would permit full quantitative assessment of the Sentinel-1 displacement maps. For Ilulissat and Byers Peninsula on Livingston Island no in-situ information is available. For Teshekpuk Lake time series of repeat terrestrial and airborne laser scanning (rLiDAR) are conducted to quantify land surface lowering due to permafrost thaw [52]. For the terrestrial LiDAR, the small areal extent and the mismatch of observation periods limit the information value in comparison to our study. However, general subsidence rates of 6 cm per year found by [52] are in agreement with the summer subsidence magnitudes found in Figure 2, Figure 3 and Figure 4, even if no spatial correspondence between InSAR and LiDAR measurements could be observed. The same consideration applies to airborne rLiDAR measurements conducted by [53] on the Alaskan Outer Coastal Plain, farther east of our study region. Here, between 2006 and 2010, thermokarst pits and polygon troughs substantially widened and subsided by less than 1.4 m.
In the southern part of the Lena River Delta, field measurements of the surface displacement were established in 2013 (for details see [14]). A number of reference rods made from steel and fiberglass was anchored at least 1 m below the typical active layer. Surface displacement was determined by repeatedly measuring the distance between the top of a reference rod and a plexiglass plate resting on the ground surface. Due to logistical reasons, measurements were made not every season and not at the same time of a season. From all years, seasonal subsidence could only be determined in 2014, as there were temporally consistent measurements at 16 locations in spring and summer. In consideration of the lack of other specific in-situ activities tailored to validate the InSAR results we compared the in-situ measured subsidence in 2014 with the 2016 and 2017 Sentinel-1 displacement values averaged in a window of 3 × 3 pixels and projected into the vertical direction. For some locations, we have more than 2 in-situ measurements per InSAR pixel, therefore, we took a mean displacement value for such pixels.
Figure 15 shows the vertical displacement values extracted from the Sentinel-1 InSAR maps from 2016 and 2017 and the TerraSAR-X InSAR map from 2013 as well as the in-situ measurements for the period from April to August 2014. The slight uplift of the TerraSAR-X results is related to the choice of the reference point, the extremely cold 2013 summer and residual atmospheric signals [14]. The Sentinel-1 displacements at the measurement points for the period from July to September 2016 have a slight upward direction, which disagrees with the expected thaw subsidence during summer. Including more interferograms at the beginning and the end of the 2017 season results in the detection of a pronounced downward movement of 3 to 4 cm at all measurement locations. The in-situ measurements of April-August 2014 show a more heterogeneous distribution of subsidence values between 1 and 7 cm. Thaw depths from the Circumpolar Active Layer Monitoring Network (CALM) at measurement site R29A/C were highest in 2014 (35 cm), similar in 2016 (29 cm) and 2017 (30 cm) and lowest in 2013 (26 cm). Despite different years, we observed comparable values of summer subsidence from in-situ data in 2014 and space measurements in 2017.
The correlation coefficients computed between all measurement combinations of Figure 15 are indicated in Table 2. There is a relatively strong correlation between Sentinel-1 values in 2017 and TerraSAR-X values in 2013. Together with the high spatial agreement between the Sentinel-1 and TerraSAR-X maps within the basins (Figure 14), this indicates that in general both SAR systems capture similar ground conditions or processes. However, Sentinel-1 values from 2016 do not show any correlation with the Sentinel-1 values from 2017 or the TerraSAR-X values from 2013. Because both summer seasons of 2016 and 2017 were warmer than 2013, with 2017 slightly cooler than 2016 [14], we conclude that the temporally incomplete stack of interferograms in 2016 does not reflect the true processes. A comparison with in-situ measurements does not reveal a correspondence between InSAR and in-situ measurements. Multiple factors could be a reason. First, we compared different years for in situ and InSAR measurements, although the relative displacement should not change significantly. Another possible reason is sub-pixel variability of the displacement. There are only a few locations where multiple in-situ measurements per pixel are available and one local subsidence value may not be the same as the area of one InSAR measurement. In addition, noise could still possibly affect an InSAR pixel, even after applying averaging. Finally, changing vegetation and soil-moisture local conditions between different years could also partly explain the differences.

4.4. Interpretation of Results

Despite the lack of a strong field validation dataset, we showed the usefulness of Sentinel-1 InSAR data to identify the subsidence-uplift seasonality for different permafrost landscapes and highlighted the spatial differentiation of thaw subsidence magnitudes over large regions. The observed spatial patterns of this process could be considered to study active layer and ground ice dynamics in different geomorphological settings and tundra vegetation communities and may help to identify areas particularly vulnerable to external disturbances. In general, InSAR results suggest that near-surface soil properties control seasonal subsidence signals. In addition, borehole temperatures in the South Shetland Islands indicate coincidence between ground thermal regime and subsidence measurements. While in-situ works that aim on monitoring permafrost thaw subsidence are especially useful for a better process understanding, their explanatory power over larger spatial scales is limited. Complimentary InSAR derived subsidence products provide a broader picture not only for subsidence magnitudes but also in terms of the process spatial variability within landscapes that experience not only permafrost warming but are subject to ground ice melt.
For ground with seasonal thawing only, that is, without excess ice melt, the magnitude of the subsidence signal can be converted into a maximum thaw depth [15]. In Illulissat, for instance, the ground largely consists of clayey sediments (Asiaq boring profile archive, unpublished) and a seasonal signal of 3–4 cm would correspond to 0.7–0.9 m maximum thaw depth in the case of saturated conditions and a typical porosity for clay of 0.5. If the conditions are not entirely saturated near the surface, the active layer would be deeper. In [54], a maximum active layer thickness between 0.9 and 1 m is indicated for this area. For Teshekpuk, the magnitude of the summer subsidence signal at P2 and P4 (Figure 3 and Figure 4) is larger, 5–6 cm corresponding to 0.6–0.7 m of ice thawing into water. This is pointing to a wet site with high porosity. Also over the Lena River Delta some extremely wet areas within the four basins of Figure 14, visually interpreted from the RapidEye optical image, are characterised by large values of summer surface subsidence, if we can exclude that changing soil moisture conditions are also affecting the InSAR measurements. Spatial modelling of the soil porosity and moisture fraction of saturation would allow mapping the maximum active layer thickness from the seasonal surface subsidence measurements [15].
Over our Arctic permafrost areas, the active layer typically starts to thaw in the first half of June and starts to freeze back at the end of September-beginning of October. Over the Lena River Delta, for instance, active layer freezing is usually complete in November [22]. In the Sentinel-1 temporal series of displacement frost heave at the end of the summer season can be observed for Ilulissat (Figure 6 and Figure 7) but not for Teshekpuk Lake and the Lena River Delta (Figure 4 and Figure 9). For these two latter sites interferograms over 12 days after 30 September 2017 and 15 October 2017, respectively, are decorrelated. For Ilulissat, interferograms over 6 days are still coherent until the end of October 2016 and 2017. Indeed, a revisit time of 6 days, possible when both Sentinel-1A and Sentinel-1B regularly operate over the same region (as it is the case for Ilulissat since 2016), leads to more robust results compared to data acquired with a 12 day cycle. In particular at the beginning and at the end of the summer season, the InSAR coherence is higher and phase unwrapping is less prone to errors. In addition, in the case of disturbances due to snow-cover events or strong atmospheric disturbances in one date, leaving out of the analysis one acquisition in a 6 day repeat cycle would result in a 12 day interferogram, while in a 12 day cycle this would result in a 24 days interferogram, with more decorrelation and displacement.

5. Conclusions and Perspectives

We demonstrated how the Sentinel-1 constellation enables operational summer surface deformation estimation for low-land permafrost regions in the Arctic and Antarctica. During the snow-free period coherence is high, permitting the retrieval of a time-series of movement with a temporal sampling of 6 to 12 days. The high spatial resolution and the short temporal sampling of the Sentinel-1 data reveal many spatial details and offer the possibility to identify non-uniform motion. The highest rates of summer surface deformation detected in the four study areas were different, with maximum values of about 5–6 cm over Teshekpuk Lake (Alaska), 3–4 cm over Ilulissat (Greenland), 10 cm over the Lena River Delta (Russia) and 2–3 cm over Byers Peninsula (South Shetland Islands). So far, no systematic differences were observed between Sentinel-1 SAR data acquired at VV (Teshekpuk Lake and the Lena River Delta) and HH (West Greenland and the South Shetlands Islands) polarization.
Coherent interferograms spanning one year at the end of the summer season enable linking data from subsequent years to reconstruct longer time-series of deformation. However, the relatively small magnitude of subsidence observed with Sentinel-1 since 2015 does not permit so far to estimate the annual rates of movement. A longer observation time period is necessary in order to infer over multi-annual scales permafrost degradation occurring through melting of excess ice layers, leading to an effective subsidence of the surface [6]. In such cases InSAR can contribute to the addressing of the persistent isotropic subsidence in permafrost areas, which is correlated with the effect of global warming. Specific permafrost regions are rich in organic material, so that remote detection and quantification of ground subsidence could become of outstanding importance for investigating the permafrost-carbon feedback [4].
An important aspect highlighted by our work is the lack of specific in-situ activities tailored to validate the InSAR results. In-situ experiments should be planned, taking into account the available InSAR subsidence maps, in order for example, to (i) validate the detected surface displacements at the scale of the InSAR pixels, (ii) characterise the locations selected as reference and those coming out without significant movements and (iii) possibly differentiate effects of surface deformation, on one side and of soil moisture, vegetation and snow-cover changes, on the other side. One possibility to specifically validate InSAR results in natural environments is the use of artificial reflectors deployed on foundations at various depths [55]. Further intercomparison activities with other SAR sensors at different wavelengths would also permit to better characterise the performance of Sentinel-1 for the detection of surface subsidence. Past studies [9] suggest in particular that L-band SAR features the best possible performance with regard to coherence over permafrost. Since 2014 the L-band sensor ALOS-2 PALSAR-2 is on orbit and could provide valuable complementary displacement information over our study regions.

Supplementary Materials

The following are available online at https://www.mdpi.com/2072-4292/10/9/1360/s1, Table S1: Acquisition dates and time intervals of the Sentinel-1 images considered for the different study regions.

Author Contributions

T.S., S.W. and A.B. designed the experiments; T.S. and U.W. processed the satellite SAR images; S.A. contributed to the description and discussion of the Lena River Delta part and to the validation; F.G. contributed to the description and discussion of the Teshekpuk Lake and Lena River Delta parts; E.M. contributed to the description and discussion of the Ilulissat part; G.V. contributed to the description and discussion of the Byers Peninsula part; T.S. led the writing of the paper; all authors analysed the results and contributed to the redaction of the paper.

Funding

This research was funded by ESA grant number 4000116196/15/I-NB. F.G. was funded by ERC PETA-CARB #338335.

Acknowledgments

Sentinel-1 images available from Copernicus. IFSAR DEM available from the U.S. Geological Survey. TanDEM-X provided by the German Aerospace Center (DLR), courtesy of DEM_GEOL1365.

Conflicts of Interest

The authors declare no conflict of interest.

References

  1. Anisimov, O.; Nelson, F. Permafrost distribution in the Northern Hemisphere under scenarios of climate change. Glob. Planet. Chang. 1999, 14, 59–72. [Google Scholar] [CrossRef]
  2. Bartsch, A.; Grosse, G.; Kääb, A.; Westermann, S.; Strozzi, T.; Wiesmann, A.; Duguay, C.; Seifert, F.M.; Obu, J.; Goler, R. GlobPermafrost—How space-based earth observation supports understanding of permafrost. In Proceedings of the ESA Living Planet Symposium, Prague, Czech Republic, 9–13 May 2016. [Google Scholar]
  3. Trofaier, A.M.; Westermann, S.; Bartsch, A. Progress in space-borne studies of permafrost for climate science: Towards a multi-ECV approach. Remote Sens. Environ. 2017, 203, 55–70. [Google Scholar] [CrossRef]
  4. French, H.M. The Periglacial Environment, 3rd ed.; John Wiley & Sons, Ltd.: West Sussex, UK, 2007. [Google Scholar]
  5. Günther, F.; Overduin, P.P.; Yakshina, I.A.; Opel, T.; Baranskaya, A.V.; Grigoriev, M.N. Observing Muostakh disappear: Permafrost thaw subsidence and erosion of a ground-ice-rich island in response to arctic summer warming and sea ice reduction. Cryosphere 2015, 9, 151–178. [Google Scholar]
  6. Shiklomanov, N.I.; Streletskiy, D.A.; Little, J.D.; Nelson, F.E. Isotropic thaw subsidence in undisturbed permafrost landscapes. Geophys. Res. Lett. 2013, 40, 6356–6361. [Google Scholar] [CrossRef] [Green Version]
  7. Rykhus, R.P.; Lu, Z. InSAR detects possible thaw settlement in the Alaskan Arctic Coastal Plain. Can. J. Remote Sens. 2008, 34, 100–112. [Google Scholar] [CrossRef]
  8. Liu, L.; Zhang, T.; Wahr, J. InSAR measurements of surface deformation over permafrost on the North Slope of Alaska. J. Geophys. Res. 2010, 115, F03023. [Google Scholar] [CrossRef]
  9. Short, N.; Brisco, B.; Couture, N.; Pollard, W.; Murnaghan, K.; Budkewitsch, P. A comparison of TerraSAR-X, RADARSAT-2 and ALOS-PALSAR interferometry for monitoring permafrost environments, case study from Herschel Island, Canada. Remote Sens. Environ. 2011, 115, 3491–3506. [Google Scholar] [CrossRef]
  10. Strozzi, T.; Grosse, G.; Streletskiy, D. SAR Interferometry for surface deformation monitoring on permafrost areas in Alaska. In Proceedings of the Earth Observation and Cryosphere Science, Frascati, Italy, 13–16 November 2012. [Google Scholar]
  11. Short, N.; LeBlanc, A.-M.; Sladen, W.; Oldenborger, G.; Mathon-Dufour, V.; Brisco, B. RADARSAT-2 D-InSAR for ground displacement in permafrost terrain, validation from Iqaluit Airport, Baffin Island, Canada. Remote Sens. Environ. 2014, 141, 40–51. [Google Scholar] [CrossRef]
  12. Wang, L.; Marzahn, P.; Bernier, M.; Jacome, A.; Poulin, J.; Ludwig, R. Comparison of TerraSAR-X and ALOS PALSAR Differential Interferometry With Multisource DEMs for Monitoring Ground Displacement in a Discontinuous Permafrost Region. IEEE J. Sel. Top. Appl. Earth Obs. Remote Sens. 2017, 10, 4074–4093. [Google Scholar] [CrossRef]
  13. Beck, I.; Ludwig, R.; Bernier, M.; Strozzi, T.; Boike, J. Vertical movements of frost mounds in subarctic permafrost regions analyzed using geodetic survey and satellite interferometry. Earth Surf. Dyn. 2015, 3, 409–421. [Google Scholar] [CrossRef] [Green Version]
  14. Antonova, S.; Sudhaus, H.; Strozzi, T.; Zwieback, S.; Kääb, A.; Heim, B.; Langer, M.; Bornemann, N.; Boike, J. Thaw Subsidence of a Yedoma Landscape in Northern Siberia, Measured In Situ and Estimated from TerraSAR-X Interferometry. Remote Sens. 2018, 10, 494. [Google Scholar] [CrossRef]
  15. Schaefer, K.; Liu, L.; Parsekian, A.; Jafarov, E.; Chen, A.; Zhang, T.J.; Gusmeroli, A.; Panda, S.; Zebker, H.; Schaefer, T. Remotely sensed active layer thickness (ReSALT) at Barrow, Alaska using interferometric synthetic aperture radar. Remote Sens. 2015, 7, 3735–3759. [Google Scholar] [CrossRef]
  16. Torres, R.; Snoeij, P.; Geudtner, D.; Bibby, D.; Davidson, M.; Attema, E.; Potin, P.; Rommen, B.; Floury, N.; Brown, M.; et al. GMES Sentinel-1 mission. Remote Sens. Environ. 2012, 120, 9–24. [Google Scholar] [CrossRef]
  17. Jones, B.; Arp, C. Observing a Catastrophic Thermokarst Lake Drainage in Northern Alaska. Permafr. Periglac. Process. 2015, 26, 119–128. [Google Scholar] [CrossRef] [Green Version]
  18. Farquharson, L.; Mann, D.H.; Grosse, G.; Jones, B.; Romanovsky, V. Spatial distribution of thermokarst terrain in Arctic Alaska. Geomorphology 2016, 273. [Google Scholar] [CrossRef]
  19. Nitze, I.; Grosse, G.; Jones, B.; Arp, C.; Ulrich, M.; Fedorov, A.; Veremeeva, A. Landsat-Based Trend Analysis of Lake Dynamics across Northern Permafrost Regions. Remote Sens. 2017, 9, 640. [Google Scholar] [CrossRef]
  20. Streletskiy, D.; Shiklomanov, N.; Little, J.; Nelson, F.; Brown, J.; Nyland, K.; Klene, A. Thaw Subsidence in Undisturbed Tundra Landscapes, Barrow, Alaska, 1962–2015. Permafr. Periglac. Process. 2016, 28, 566–572. [Google Scholar] [CrossRef]
  21. Weather Archive on Stolb Island. Available online: https://rp5.ru/Weather_archive_on_Stolb_Island (accessed on 5 July 2018).
  22. Boike, J.; Kattenstroth, B.; Abramova, K.; Bornemann, N.; Chetverova, A.; Fedorova, I.; Fröb, K.; Grigoriev, M.; Grüber, M.; Kutzbach, L.; et al. Baseline characteristics of climate, permafrost and land cover from a new permafrost observatory in the Lena River Delta, Siberia (1998–2011). Biogeosciences 2013, 10, 2105–2128. [Google Scholar] [CrossRef] [Green Version]
  23. López-Martínez, J.; Martínez de Pisón, E.; Serrano, E.; Arche, A. Geomorphological Map of Byers Peninsula, Livingston Island; Geomap Series, Sheet 5-A; British Antarctic Survey: Cambridge, UK, 1996. [Google Scholar]
  24. Oliva, M.; Hrbacek, F.; Ruiz-Fernández, J.; de Pablo, M.Á.; Vieira, G.; Ramos, M.; Antoniades, D. Active layer dynamics in three topographically distinct lake catchments in Byers Peninsula (Livingston Island, Antarctica). Catena 2016, 149, 548–559. [Google Scholar] [CrossRef]
  25. Bañón, M.; Justel, A.; Velázquez, D.; Quesada, A. Regional weather survey on Byers Peninsula, Livingston Island, South Shetland Islands, Antarctica. Antarct. Sci. 2013, 25, 146–156. [Google Scholar] [Green Version]
  26. Vera, M.L. Colonization and demographic structure of Deschampsia antarctica and Colobanthus quitensis along an altitudinal gradient on Livingston Island, South Shetland Islands, Antarctica. Polar Res. 2011, 30, 7146. [Google Scholar] [CrossRef] [Green Version]
  27. Interferometric Synthetic Aperture Radar (IFSAR) Alaska. Data Available from the U.S. Geological Survey. Available online: https://lta.cr.usgs.gov/IFSAR_Alaska (accessed on 16 April 2018).
  28. Grohmann, C. Evaluation of TanDEM-X DEMs on selected Brazilian sites: Comparison with SRTM, ASTER GDEM and ALOS AW3D30. Rem. Sens. Environ. 2018, 212, 121–133. [Google Scholar] [CrossRef] [Green Version]
  29. Wessel, B. TanDEM-X Ground Segment—DEM Products Specification Document, EOC, DLR, Oberpfaffenhofen, Germany, Public Document TD-GS-PS-0021, Issue 3.1. 2016. Available online: https://tandemx-science.dlr.de (accessed on 5 July 2018).
  30. Strozzi, T.; Wegmüller, U.; Mätzler, C. Mapping Wet Snowcovers with SAR Interferometry. Int. J. Remote Sens. 1999, 20, 2395–2403. [Google Scholar] [CrossRef]
  31. Silvan, L.; Hajnsek, I. Opportunities of snow property extraction based on single and multi pass SAR interferometry: TanDEM-X. In Proceedings of the 2012 IEEE International Geoscience and Remote Sensing Symposium, Munich, Germany, 22–27 July 2012. [Google Scholar]
  32. Goldstein, R.M.; Werner, C.L. Radar interferogram filtering for geophysical applications. Geophys. Res. Lett. 1998, 25, 4035–4038. [Google Scholar] [CrossRef] [Green Version]
  33. Costantini, M. A novel phase unwrapping method based on network programming. IEEE Trans. Geosci. Remote Sens. 1998, 36, 813–821. [Google Scholar] [CrossRef]
  34. Berardino, P.; Fornaro, G.; Lanari, R.; Sansosti, E. A new algorithm for surface deformation monitoring based on small baseline differential SAR interferograms. IEEE Trans. Geosci. Remote Sens. 2002, 40, 2375–2383. [Google Scholar] [CrossRef]
  35. Werner, C.; Wegmüller, U.; Strozzi, T. Deformation time-series of the Lost-Hills oil field using a multi-baseline interferometric SAR inversion algorithm with finite difference smoothing constraints. In Proceedings of the AGU Fall Meeting, San Francisco, CA, USA, 3–7 December 2012. [Google Scholar]
  36. Zan, F.D.; Guarnieri, A.M.M. TOPSAR: Terrain Observation by Progressive Scans. IEEE Trans. Geosci. Remote Sens. 2006, 44, 2352–2360. [Google Scholar] [CrossRef]
  37. Wegmüller, U.; Strozzi, T.; Werner, C. Ionespheric Path Delay Estimation using Split-Beam Interferometry. In Proceedings of the IGARSS 2012, Munich, Germany, 22–27 July 2012. [Google Scholar]
  38. Gomba, G.; Parizzi, A.; De Zan, F.; Eineder, M.; Bamler, R. Toward Operational Compensation of Ionospheric Effects in SAR Interferograms: The Split-Spectrum Method. IEEE Trans. Geosci. Remote Sens. 2016, 54, 1446–1461. [Google Scholar] [CrossRef]
  39. Jorgenson, M.T.; Heiner, M. (Cartographer); Ecosystems of northern Alaska; Unpublished 1:1.5 Million-Scale Map; ABR., Inc.: Fairbanks, AK, USA; The Nature Conservancy: Seattle, WA, USA, 2003. [Google Scholar]
  40. Fuchs, M.; Lenz, J.; Jock, S.; Nitze, I.; Jones, B.; Strauss, J.; Günther, F.; Grosse, G. Impacts on successive thermokarst lake stages on soil organic matter, Arctic Alaska. J. Geophys. Res. 2018. in review. [Google Scholar]
  41. Jessen, S.; Holmslykke, H.; Rasmussen, K.; Richardt, N.; Holm, P. Hydrology and pore water chemistry in a permafrost wetland, Ilulissat, Greenland. Water Resour. Res. 2013, 50, 4760–4774. [Google Scholar] [CrossRef]
  42. Foged, N.; Ingeman-Nielsen, T. Permafrost in Marine Deposits at Ilulissat Airport in Greenland, Revisited. In Proceedings of the 9th International Conference on Permafrost, Fairbanks, AK, USA, 29 June–3 July 2008; pp. 445–450. [Google Scholar]
  43. Morgenstern, A.; Röhr, C.; Grosse, G.; Grigoriev, M. The Lena River Delta—Inventory of Lakes and Geomorphological Terraces; Alfred Wegener Institute—Research Unit Potsdam: Potsdam, Germany, 2011. [Google Scholar] [CrossRef]
  44. Correia, A.; Oliva, M.; Ruiz-Fernández, J. Evaluation of frozen ground conditions along a coastal topographic gradient at Byers Peninsula (Livingston Island, Antarctica) by geophysical and geoecological methods. Catena 2017, 149, 529–537. [Google Scholar] [CrossRef] [Green Version]
  45. López-Martínez, J.; Serrano, E.; Schmid, T.; Mink, S.; Linés, C. Periglacial processes and landforms in the South Shetland Islands (northern Antarctic Peninsula region). Geomorphology 2012, 155, 62–79. [Google Scholar]
  46. Crosetto, M.; Monserrat, O.; Bremmer, C.; Hanssen, R.; Capes, R.; Marsh, S. Ground motion monitoring using SAR interferometry: Quality assessment. Eur. Geol. 2009, 26, 12–15. [Google Scholar]
  47. Zwieback, S.; Hensley, S.; Hajnsek, I. Soil Moisture Estimation Using Differential Radar Interferometry: Toward Separating Soil Moisture and Displacements. IEEE Trans. Geosci. Remote Sens. 2017, 55, 5069–5083. [Google Scholar] [CrossRef]
  48. Zwieback, S.; Liu, X.; Antonova, S.; Heim, B.; Bartsch, A.; Boike, J.; Hajnsek, I. A Statistical Test of Phase Closure to Detect Influences on DInSAR Deformation Estimates besides Displacements and Decorrelation Noise: Two Case Studies in High-Latitude Regions. IEEE Trans. Geosci. Remote Sens. 2016, 54, 5588–5601. [Google Scholar] [CrossRef]
  49. Gunirriesen, T.; Hogda, K.A.; Johnsen, H.; Lauknes, I. InSAR for estimation of changes in snow water equivalent of dry snow. IEEE Trans. Geosci. Remote Sens. 2001, 39, 2101–2108. [Google Scholar] [CrossRef]
  50. Zwieback, S.; Hajnsek, I. Influence of Vegetation Growth on the Polarimetric Zero-Baseline DInSAR Phase Diversity—Implications for Deformation Studies. IEEE Trans. Geosci. Remote Sens. 2016, 54, 3070–3082. [Google Scholar] [CrossRef]
  51. Barboux, C.; Strozzi, T.; Delaloye, R.; Wegmüller, U.; Collet, C. Mapping slope movements in Alpine environments using TerraSAR-X interferometric methods. J. Photogramm. Remote Sens. 2015, 109, 178–192. [Google Scholar] [CrossRef] [Green Version]
  52. Günther, F.; Grosse, G.; Ulrich, M.; Nitze, I.; Sachs, T.; Jones, B. Combining terrestrial, air- and space-borne remote sensing for permafrost thaw subsidence change detection in Arctic Alaska. In Proceedings of the AGU Fall Meeting, New Orleans, LA, USA, 11–15 December 2017. [Google Scholar]
  53. Jones, B.; Stoker, J.; Gibbs, A.; Grosse, G.; Romanovsky, V.; Douglas, T.; Kinsman, N.; Richmand, B. Quantifying landscape change in an arctic coastal lowland using repeat airborne LiDAR. Environ. Res. Lett. 2013, 8. [Google Scholar] [CrossRef]
  54. Ingeman-Nielsen, T.; Foged, N.N.; Butzbach, R.; Jørgensen, A.S. Geophysical Investigations of Saline Permafrost at Ilulissat, Greenland. In Proceedings of the 9th International Conference on Permafrost, Alaska Fairbanks, AK, USA, 29 June–3 July 2008; pp. 773–778. [Google Scholar]
  55. Strozzi, T.; Teatini, P.; Tosi, L.; Wegmüller, U.; Werner, C. Land subsidence of natural transitional environments by satellite radar interferometry on artificial reflectors. J. Geophys. Res. Earth Surf. 2013, 118, 1–15. [Google Scholar] [CrossRef]
Figure 1. Study regions in the Arctic (from west to east Teshekpuk Lake in Alaska, Ilulissat in Greenland and the Lena River Delta in Siberia) and Antarctica (Byers Peninsula of Livingston Island in the South Shetland Islands).
Remotesensing 10 01360 g001
Figure 2. Subsidence map over Teshekpuk Lake (Alaska) from Sentinel-1 InSAR from 14 June to 12 October 2017. The white star indicates the reference position, the white boxes the enlargements of Figure 3 and Figure 4.
Remotesensing 10 01360 g002
Figure 3. Time series of displacement in the line-of-sight direction over a floodplain area (P1) and within the Arctic peaty silty riverine ecological landscape of the Ikpikpuk River Delta (P2) within the Teshekpuk Lake site. For location see Figure 2. Map data are from Google, DigitalGlobe.
Remotesensing 10 01360 g003
Figure 4. Time series of displacement in the line-of-sight direction over former fuel tanks close to the abandoned airfield at Point Lonely (P3) and in Arctic peaty sandy lowlands (P4) within the Teshekpuk Lake site. For location see Figure 2. Map data are from Google, DigitalGlobe.
Remotesensing 10 01360 g004
Figure 5. Subsidence map over Ilulissat (Greenland) from Sentinel-1 InSAR from 2 June to 18 September 2016. The white star indicates the reference position, the white boxes the enlargements of Figure 6 and Figure 7.
Remotesensing 10 01360 g005
Figure 6. Time series of displacement in the line-of-sight direction over an outcrop area (P1) and on peat terrain underlain by fine-grained marine sediments (P2) within the Ilulissat site. For location see Figure 5. Map data are from Google, DigitalGlobe.
Remotesensing 10 01360 g006
Figure 7. Time series of displacement in the line-of-sight direction over the airport strip (P3) and on peat terrain underlain by fine-grained marine sediments (P4) within the Ilulissat site. For location see Figure 5. Map data are from Google, DigitalGlobe.
Remotesensing 10 01360 g007
Figure 8. Subsidence map over the Lena River Delta (Russia) from Sentinel-1 InSAR from 29 June to 15 October 2017. The white star indicates the reference position, the white dashed box the enlargement of Figure 9. The second and third geomorphological units of the Lena Delta [43] are shown with white dotted and continuous polygons, respectively.
Remotesensing 10 01360 g008
Figure 9. Time series of displacement in the line-of-sight direction over an upland area (P1) and a thermokarst basin (P2) within the same terrace on Kurungnakh Island in the southern central Lena River Delta. For location see Figure 8. Map data are from Google, DigitalGlobe.
Remotesensing 10 01360 g009
Figure 10. Subsidence map over Byers Peninsula on Livingston Island (South Shetlands Islands, Antarctica) from Sentinel-1 InSAR from 30 December 2016 to 5 April 2017. The white star indicates the reference position, the white box the enlargement of Figure 11.
Remotesensing 10 01360 g010
Figure 11. Time series of displacement in the line-of-sight direction over two points on the plateau surfaces of Byers Peninsula. For location see Figure 10. Map data are from Bing Aerial.
Remotesensing 10 01360 g011
Figure 12. Ground temperatures at different depths from the Papagal borehole in Hurd Peninsula (Livingston Island).
Remotesensing 10 01360 g012
Figure 13. Summer displacement maps for a southern part of the Lena River Delta (Kurungnakh-Sise Island) in the vertical direction from TerraSAR-X data in 2013 [14] and in the line-of-sight direction from Sentinel-1 data in 2017. Large water bodies are clipped out. Thermokarst basins are delineated manually in dashed black. Locations of in-situ measurements are shown with red stars.
Remotesensing 10 01360 g013
Figure 14. Local comparisons of subsets of InSAR displacement maps from TerraSAR-X in the vertical direction between 7 June and 14 September 2013 [14], Sentinel-1 in the line-of-sight direction between 22 July and 26 September 2016, Sentinel-1 in the line-of-sight direction between 29 June and 15 October 2017 and RapidEye optical image from 2010. Large water bodies were clipped out. Thermokarst basins are delineated manually in dashed black. The location of the lettered basins can be found in Figure 13. The colour scale is the same for each map in a column.
Remotesensing 10 01360 g014
Figure 15. Vertical displacement values extracted from the Sentinel-1 InSAR maps of July-September 2016 and June-October 2017, the TerraSAR-X InSAR map of June-September 2013 and the in-situ measurements of April-August 2014. Where number of measurements per pixel was larger than one, an averaged measurement is considered.
Remotesensing 10 01360 g015
Table 1. Sentinel-1 time periods of observation for the different study regions.
Study RegionSentinel-1 Time Period
Teshekpuk Lake (Alaska)07/07/2016 → 05/09/2016
14/06/2017 → 30/09/2017
Ilulissat (Greenland)26/07/2015 → 24/09/2015
02/06/2016 → 30/10/2016
03/06/2017 → 25/10/2017
Lena River Delta (Siberia)22/07/2016 → 26/09/2016
29/06/2017 → 15/10/2017
Byers Peninsula (South Shetlands Islands)30/12/2016 → 17/04/2017
25/12/2017 → 12/04/2018
Table 2. Correlation coefficients for all combinations of measurements.
Sentinel-1 2016Sentinel-1 2017TSX 2013In-Situ 2014
Sentinel-1 20161−0.270.15−0.01
Sentinel-1 2017 10.59−0.27
TSX 2013 1−0.14
In-situ 2014 1

