


Abstract
A survey of global ocean island basalt geochemistry shows a remarkably strong linear correlation (average r2 = 0·95) between Zr and Nb concentrations. Fractional crystallization explains neither the range in Zr and Nb concentrations nor the fact that regression lines have intercepts significantly different from zero. A substantial, linearly correlated (average r2 = 0·92) variability in Zr and Nb concentrations remains in the datasets after correction for fractional crystallization. Linear correlation between Zr and Nb concentrations is not expected from variable degrees of melting because the concentration of Nb is significantly more sensitive to the degree of melting than that of Zr. Our main conclusion is that the Zr/Nb systematics of ocean island basalts requires binary mixing, and more specifically mixing of two separate melts. We show that a mid-ocean ridge basalt melt is the depleted endmember, common to all examined ocean island basalts. The enriched endmember has a very variable Zr/Nb ratio. We speculate that, rather than implying the existence of several distinct enriched reservoirs, the highly variable Zr/Nb ratio could reflect intra-mantle processes such as fertilization by small-degree melts or carbonate–silicate melt immiscibility.
INTRODUCTION
Twenty-five years of geochemical research into the origin and significance of ocean island basalts (OIB) has cemented an ‘accepted’ picture of the chemical structure of the mantle. The cornerstone of the ‘accepted’ idea has remained unchanged: chemical and isotopic signatures of OIB magmas reflect the existence of components in the mantle that have remained relatively isolated up to billions of years. The original nomenclature of mantle components (Zindler & Hart, 1986) has been expanded and opinions differ regarding the petrological significance of these ‘endmembers’ and the scale of mantle heterogeneity. Additions and modifications to the ‘accepted’ model appear to be welcomed by the OIB community but ideas advocating complete departure from the ‘accepted’ consensus are relegated into a league of interesting, provoking but nevertheless unrealistic attempts at revolution. Whether or not there is a need for departure from ‘accepted’ ideas about OIB petrogenesis depends on how much significance is attributed to those observations that are not explained by existing models. We are not convinced that ‘accepted’ ideas can be successfully modified to ultimately explain the full evidence. Indeed, we believe that the combination of the following observations legitimates proposal of alternative models:
He–Pb paradox. In the ‘accepted’ model, OIB with high 206Pb/204Pb and 208Pb/204Pb ratios, the so-called HIMU (high μ, where μ = 238U/204Pb) signature, are sourced from 1–2-Gy-old subducted oceanic crust, sediment or a mixture of both. Over periods of 1–2 Gy, the 3He/4He ratio of such a source will approach zero, yet the observed 3He/4He ratio in HIMU OIB is ∼6 (RA). In the framework of ‘accepted’ models, this paradox can be resolved only by postulating an unconstrained open system behaviour of He (e.g. Hanyu & Kaneoka, 1998).
OIB Pb-isotope signatures in the context of global differentiation. The ‘accepted’ OIB model discusses Pb-isotope signatures relative to a depleted mantle that evolved with a single-stage μ (after Chase, 1981). Only within such a framework are OIB Pb isotopes compatible with the view that oceanic crust (both ancient and young) is a source component of OIB. When examined relative to a realistic Pb-isotope mantle evolution model, OIB Pb-isotope arrays are binary mixing lines that cannot directly be used to infer source nature (Kamber & Collerson, 1999).
Efficiency of recycling in depleted mantle. Evidence for recycling of both continent-derived material and subducted oceanic crust into the depleted mantle is irrefutable. A prerequisite of ‘accepted’ OIB models is that domains survive in the mantle that withstand complete mixing into surrounding astenosphere over periods of up to 2 Gy. Survival of such domains has been questioned on the basis of convection models (e.g. van Keken & Ballentine, 1998) but there is also geochemical evidence for more efficient mixing of recycled components in the depleted mantle. The second terrestrial Pb paradox refers to the fact that MORB-source mantle evolved with a significantly higher than present Th/U ratio over much of its history. Solutions to this paradox have in common that after ∼2 Gy, the depleted mantle Th/U ratio started to decrease strongly as a result of preferential recycling of U from the continents (Kramers & Tolstikhin, 1997; Kramers et al., 1998; Collerson & Kamber, 1999; Elliott et al., 1999). The Pb-isotope composition of MORB is a time-integrated signal (representing >4·3 Gy) and its relative uniformity (compared with the recycled components) therefore requires that, at least for the last 2 Gy, mixing of recycled components into the depleted mantle has been efficient. This observation raises concerns regarding the preponderance of relatively isolated recycled sources on which ‘accepted’ OIB models rely.
Nb/Ta paradox. Mantle tomography leaves no doubt that oceanic slabs can penetrate into the lower mantle (e.g. van der Hilst et al., 1991) and could be stored over long time periods in the bottom 1000 km of the mantle (van der Hilst & Kárason, 1999). Indeed, a hidden mantle reservoir is also required by terrestrial Nb/Ta, Nb/La and Ti/Zr mass balance (e.g. McDonough, 1991). Kamber & Collerson (2000) and Rudnick et al. (2000) concluded, independently, that deeply subducted oceanic slabs have a significantly superchondritic Nb/Ta ratio of ∼30–35. On the basis of this estimate, eclogitic slabs that are hidden in the lower mantle account for ∼5 wt % of the silicate Earth. However, OIB do not have elevated Nb/Ta, which suggests that ancient oceanic crust is not a major OIB source component, thereby further substantiating claims based on Pb isotopes.
Concentration levels of incompatible elements in OIB. Estimates of melting degrees experienced by OIB magmas frequently require sources that have elevated concentrations in very incompatible elements (e.g. McKenzie & O’Nions, 1995, 1998). Zou & Zindler (1996) speculated that source enrichment and eventual OIB melting could be related in an ‘autometasomatic’ event. Although typical melting models are successful at deriving OIB melts from previously enriched sources, little is known about the enrichment itself (e.g. Zou & Zindler, 1996). In contrast to arc magmas, where the source of metasomatizing fluids is known (e.g. Ayers, 1998), ‘accepted’ OIB models make poorly constrained assumptions regarding the nature and origin of metasomatizing fluids or melts.
In view of these problems with ‘accepted’ OIB ideas we propose to take a fresh look at key characteristics of OIB but not necessarily with the aim of formulating a new model. One aspect of OIB geochemistry that has become increasingly ubiquitous is evidence for mixing. The most spectacular evidence for coexistence of two surprisingly different melts (i.e. hybridization) under an ocean island has recently been provided by Saal et al. (1998) in an analytically challenging Pb-isotope study of Polynesian OIB. The aim of our paper is to revisit the issue of very strong enrichment of OIB in incompatible elements and to test whether trace element chemistry of global OIB is compatible with binary mixing. We are particularly interested in the variability of enrichment within a cogenetic suite of OIB, a feature that we believe could hold more clues to understanding their genesis.
TRACE ELEMENT PATTERNS OF OIB
In Fig. 1 selected trace element abundances of three OIB from Mangaia Island (Cook–Austral Chain) are plotted normalized to average continental crust to emphasize three features: (1) many OIB are more strongly enriched than average continental crust in a number of elements, notably the light and middle rare earth elements (LREE and MREE); (2) major differences occur in the enrichment patterns between OIB and average continental crust; these are understood in terms of processes that influence the formation of continental crust (e.g. Ayers, 1998; Ewart et al., 1998) and will not be further discussed in this paper; (3) similarly differentiated basalts from a single ocean island (or even a single flow) can have strongly variable enrichment. Our main focus is to investigate the significance of this last feature. In particular, the following questions will be addressed:
to what degree is enrichment of strongly and mildly incompatible elements coupled?
Is systematic behaviour of strongly and mildly incompatible elements simply the result of fractional crystallization?
If not, can a combination of other processes (e.g. variable degrees of partial melting, variable enrichment of mantle source, or changing mineralogy in the mantle melting column) explain covariant enrichment?
Is there trace element evidence for mixing of two distinctive melts, as suggested by radiogenic isotopes (e.g. Saal et al., 1998; Kamber & Collerson, 1999)?
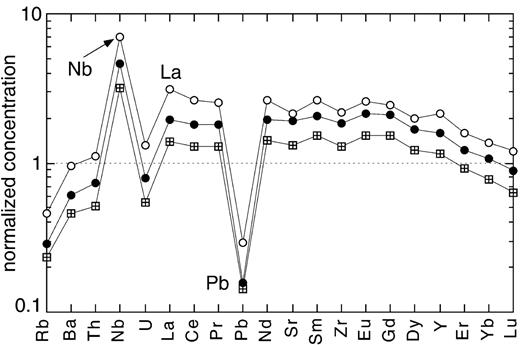
Continental crust normalized (Rudnick & Fountain, 1995) trace element concentration diagram for three OIB samples from Mangaia Island (Woodhead, 1996): M4 (13·47 wt % MgO; squares with crosses), M1 (6·84 wt % MgO; •) and M17 (6·06 wt % MgO; ○). The large difference in enrichment between similarly fractionated samples M1 and M4 should be noted. Even the most primitive sample is more enriched in most incompatible trace elements than average continental crust.
Here we use the variation in concentration of a very incompatible element (Nb) with that of a more compatible element (Zr) (Treuil’s method; Ferrara & Treuil, 1973) for world-wide OIB data to answer these questions.
Zr/Nb SYSTEMATICS OF OIB
Zr and Nb have very different bulk distribution coefficients in an upper-mantle melting regime, expressed as DZrsolid/liquid >> DNbsolid/liquid (e.g. Green et al., 1989), yet the average correlation coefficient (r2) between Zr and Nb concentrations is 0·95 in 51 studied world-wide OIB datasets (see Table 1). In many cases the degree of correlation is comparable with that between Zr and Hf —elements of identical charge and effective ionic radius and hence indistinguishable bulk distribution coefficients (Table 1). The compiled database covers the majority of OIB for which data are available. Because data were obtained by various techniques [X-ray fluorescence (XRF), instrumental neutron activation analysis (INAA), inductively coupled plasma mass spectrometry (ICP-MS) and spark source spectrometry] inter-analytical bias might be present, which is likely to reduce correlation between Zr and Nb concentrations. However, this problem is likely to be minimal; first, because in a previous study based on the same datasets, Kamber & Collerson (2000) have found excellent correlation between Nb and Ta, despite these elements having been measured by different techniques; second, because the compiled Zr and Hf data were also usually measured by different techniques but show no substantial bias, neither in correlation coefficient, nor in Zr/Hf ratio (Table 1), and hence intercept. The common usage of trace element ratios (between elements of differing compatibility) masks the tight correlation between Zr and Nb concentrations because intercepts are significantly different from zero (see Table 1). Thus there is a systematic change in the ratio of two such elements as a function of concentration, despite their concentrations being linearly correlated. Clearly, any viable model for OIB petrogenesis must be capable of successfully explaining this observation.
Zr/Nb and Zr/Hf systematics of global OIBs
| Locality and | Nb vs Zr (uncorrected) | Nb vs Zr (FC corrected) | Zr vs Hf | MgO wt% | ||||||||
| data source | ||||||||||||
| Intercept | Slope | r2 | n | ΔZr | % FC | Intercept | Slope | r2 | Zr/Hf | r2 | ||
| Ascension1 | 34·6 | 4·64 | 0·947 | 4 | 1·7 | 40 | 40·45 | 4·51 | 0·930 | 43·67 | 0·996 | 4·3–5·3 |
| Azores2 | ||||||||||||
| Faial | 18·11 | 4·79 | 0·992 | 3 | 1·3 | 26 | 19·82 | 4·74 | 0·988 | 44·81 | 0·999 | 7·8–9·7 |
| Pico | −3·79 | 5·56 | 0·974 | 5 | 1·5 | 31 | −11·50 | 5·79 | 0·967 | 42·32 | 0·981 | 8·2–10·8 |
| São Miguel (AD 1652) | 107·8 | 3·58 | 0·952 | 3 | 1·1 | 11 | 100·8 | 3·66 | 0·787 | 44·65 | 0·988 | 6·7–8·3 |
| Balleny3 | 89·8 | 1·85 | 0·958 | 10 | 1·5 | 31 | 110·9 | 1·38 | 0·884 | 43·06 | 0·950 | 7·2–11·6 |
| Bouvet1,4 | 3·25 | 6·63 | 0·936 | 10 | 1·8 | 45 | 13·58 | 6·38 | 0·907 | 43·48 | 0·972 | 3·5–4·5 |
| Cameroon5 (Pagalu) | −21·03 | 4·96 | 0·919 | 9 | 1·5 | 31 | 125·8 | 2·58 | 0·912 | 8·5–14·8 | ||
| Canaries6–8 | ||||||||||||
| La Palma | 4·79 | 4·52 | 0·976 | 23 | 1·7 | 40 | 123·6 | 3·04 | 0·767 | 5·6–8·7 | ||
| Tenerife | 7·96 | 3·32 | 0·970 | 9 | 1·7 | 42 | 41·71 | 2·88 | 0·855 | 3·5–9·9 | ||
| Cape Verde9 | a | |||||||||||
| São Tiago | 131·7 | 2·41 | 0·975 | 3 | 1·5 | 35 | 98·00 | 2·67 | 0·995 | 44·37 | 0·989 | 7·8–13·5 |
| São Vincente | −73·46 | 4·92 | 0·933 | 4 | 2·2 | 55 | −63·11 | 4·89 | 0·885 | 6·2–11·7 | ||
| Comores10,11 | ||||||||||||
| La Grille | 38·68 | 2·31 | 0·890 | 6 | 2·3 | 57 | 39·12 | 2·27 | 0·903 | 9·2–13·4 | ||
| Karthala | 8·89 | 4·05 | 0·938 | 12 | 1·5 | 35 | 11·34 | 3·95 | 0·895 | 5·1–13·7 | ||
| Moheli (Karthala-type) | 75·67 | 3·07 | 0·984 | 4 | 1·6 | 37 | 83·69 | 2·77 | 0·954 | 7·8–12·6 | ||
| Moheli (La Grille type) | 34·32 | 2·54 | 0·939 | 8 | 1·9 | 47 | 35·01 | 2·53 | 0·935 | 9·7–11·7 | ||
| Cook–Austral12–18 | ||||||||||||
| MacDonald | 33·36 | 4·05 | 0·945 | 13 | 3·0 | 67 | 32·17 | 3·97 | 0·947 | 6·1–18·9 | ||
| Mangaia | 50·09 | 2·92 | 0·839 | 15 | 1·9 | 48 | 51·35 | 2·68 | 0·648 | 44·08 | 0·975 | 6·0–15·7 |
| Rurutu (young) | 50·35 | 3·75 | 0·982 | 6 | 1·7 | 41 | 61·36 | 3·55 | 0·966 | 6·0–10·3 | ||
| Rurutu (old) | 43·96 | 4·06 | 0·951 | 14 | 1·8 | 45 | 42·76 | 3·86 | 0·944 | 43·64 | 0·999 | 6·0–13·9 |
| Rapa | −18·71 | 5·30 | 0·924 | 5 | 1·9 | 47 | 54·64 | 2·91 | 0·481 | 35·70 | 0·972 | 5·9–22·6 |
| Tubuai | 62·30 | 2·35 | 0·985 | 17 | 3·0 | 67 | 62·28 | 2·25 | 0·983 | 42·02 | 0·972 | 6·2–15·0 |
| Galapagos19,20 | ||||||||||||
| Isabela | 63·64 | 4·50 | 0·819 | 17 | 1·6 | 37 | 77·09 | 3·87 | 0·744 | 42·76 | 0·847 | 4·8–6·9b |
| Marchena | 66·84 | 9·75 | 0·849 | 7 | 1·3 | 26 | 79·16 | 8·45 | 0·823 | 45·53 | 0·602 | 5·8–6·8 |
| Gough21 (middle basalts) | 78·61 | 4·33 | 0·870 | 21 | 2·1 | 52 | 84·33 | 4·00 | 0·543 | 6·1–14·0 | ||
| Hawaii22–24 | ||||||||||||
| Mauna Kea | 74·37 | 5·76 | 0·948 | 10 | 1·6 | 38 | 77·83 | 5·17 | 0·826 | 38·43 | 0·945 | 6·1–12·1 |
| Kilauea | 46·77 | 6·07 | 0·962 | 9 | 1·7 | 42 | 58·53 | 4·54 | 0·874 | 6·7–14·8 | ||
| Oahu (Waianae) | 39·74 | 6·84 | 0·951 | 11 | 1·7 | 43 | 34·75 | 7·01 | 0·945 | 7·1–10·0c | ||
| Heard Island25,26 | ||||||||||||
| Laurens Peninsula | 104·8 | 4·54 | 0·606 | 4 | 1·2 | 17 | 336·2 | 1·85 | 0·167 | 5·0–7·2 | ||
| Big Ben | 99·53 | 5·28 | 0·574 | 15 | 2·0 | 49 | 142·7 | 3·69 | 0·668 | 5·7–16·0d | ||
| Hollister Ridge27 | 53·72 | 6·78 | 0·984 | 11 | 4·0 | 75 | 48·41 | 6·65 | 0·985 | 41·08 | 0·987 | 6·3–12·5e |
| Iceland28–30 | ||||||||||||
| Grjótháls | 9·23 | 8·79 | 0·985 | 6 | 2·7 | 63 | 9·23 | 8·76 | 0·984 | 8·7–10·7 | ||
| Gœsafjöll | 2·17 | 8·41 | 0·965 | 5 | 1·2 | 16 | 2·12 | 8·42 | 0·849 | 7·5–11·9 | ||
| Krafla | 12·23 | 8·87 | 0·943 | 22 | 3·5 | 71 | 11·88 | 8·88 | 0·944 | 8·0–10·0 | ||
| Eastern Rift Zone | 17·38 | 8·18 | 0·998 | 7 | 7·4 | 87 | 16·32 | 7·97 | 0·999 | 5·1–13·1 | ||
| Mid-Iceland Belt | 21·15 | 7·77 | 0·951 | 7 | 2·6 | 62 | 20·79 | 7·65 | 0·961 | 8·0–11·1f | ||
| Western Rift Zone | 14·81 | 6·69 | 0·990 | 4 | 10·2 | 90 | 13·99 | 6·68 | 0·991 | 6·9–10·0 | ||
| Inaccessible31 | 91·52 | 2·66 | 0·759 | 7 | 1·2 | 18 | 74·95 | 2·76 | 0·941 | 4·1–9·2g | ||
| Kerguelen32 | 56·22 | 7·25 | 0·803 | 10 | 2·8 | 65 | 57·49 | 6·24 | 0·658 | 44·19 | 0·981 | 5·0–13·4h |
| La Réunion33 | ||||||||||||
| Piton des Neiges | 18·30 | 6·94 | 0·974 | 5 | 1·2 | 14 | 14·53 | 7·05 | 0·950 | 4·1–13·5 | ||
| Piton de la Fournaise | 33·66 | 7·29 | 0·989 | 3 | 2·2 | 54 | 17·09 | 7·88 | 0·960 | 6·3–8·9 | ||
| Marion34 | 81·94 | 3·90 | 0·908 | 9 | 1·6 | 37 | 70·13 | 3·79 | 0·656 | 4·8–14·3 | ||
| Marquesas35,36 | 124·9 | 4·86 | 0·921 | 13 | 1·6 | 39 | 131·0 | 4·14 | 0·980 | 5·5–10·5i | ||
| Ontong Java37 (Malaita) | 1·97 | 15·5 | 0·941 | 10 | 2·0 | 49 | 2·46 | 15·4 | 0·914 | 6·1–11·1j | ||
| Pitcairn38,39 | 57·04 | 5·49 | 0·950 | 7 | 5·4 | 81 | 52·3 | 5·22 | 0·961 | 41·98 | 0·935 | 6·1–14·8k |
| SE Indian Ridge40 | −1·21 | 8·93 | 0·999 | 5 | 3·1 | 68 | ||||||
| Society12 | ||||||||||||
| Mehitia | −10·46 | 7·30 | 0·986 | 16 | 1·6 | 37 | −15·14 | 7·50 | 0·895 | 45·53 | 0·851 | 6·9–16·8 |
| Moua Pihaa | 76·77 | 4·62 | 0·999 | 4 | 1·6 | 38 | 86·38 | 4·27 | 0·996 | 6·3–10·3 | ||
| Teahitia | 44·86 | 7·09 | 0·928 | 8 | 1·2 | 15 | 268·3 | −0·13 | 0·002 | 8·3–14·0 | ||
| St Helena41 | 37·83 | 3·24 | 0·933 | 19 | 2·2 | 54 | 45·51 | 2·95 | 0·866 | 40·56 | 0·927 | 6·4–13·7 |
| Tristan da Cunha42 | 64·45 | 3·14 | 0·954 | 11 | 1·5 | 32 | 92·72 | 2·44 | 0·928 | 6·0–12·0 | ||
| Walvis Ridge43–45 | 38·37 | 4·66 | 0·924 | 22 | 2·6 | 61 | 34·86 | 4·74 | 0·927 | 43·83 | 0·948 | 6·0–8·3 |
r2, correlation coefficient; n, number of samples, ΔZr, ratio between samples richest and poorest in Zr; FC, fractional crystallization.
aSão Antão omitted (suspect Zr data: very low Zr/Hf ratios); bsample 105 omitted; cKolekole-type; dbasalt–trachybasalts; esample 16-2 omitted because of anomalous Zr/Hf ratio; fsample BL4 omitted; galkali basalts, sample 3 from Long Ridge omitted; hMt Bureau only, sample 55 omitted because of aberrant Zr concentration; ishield building Nuka Hiva basalts only; jolder series; kSt Paul Island.
First-order considerations
The most obvious, often implicitly assumed, explanation for tight linear correlations between elements of different compatibility is fractional crystallization. A magma becomes increasingly enriched in incompatible elements as more and more early phases (mainly olivine and clinopyroxene) crystallize. Figure 2a shows that variable degrees of Rayleigh fractionation of olivine produce distinct linear Zr vs Nb relationships for different parental magmas. The pertinent questions are whether this process can account for the entire range of incompatible element concentration commonly found in OIB suites and whether it can explain intercepts significantly different from zero (Table 1).
![Bivariate Zr vs Nb concentration plots. (a) Perfect linear arrays result from olivine fractionation (space between open symbols corresponds to an increment of 5% olivine [Fo89·5] segregation). The four arbitrarily chosen parental melt Nb and Zr concentrations (▪) determine the slope of the fractionation lines. It should be noted that all linear regressions intersect very close to the origin, irrespective of the Zr/Nb ratio of the parental melt. (b) Comparison of raw (•) and reconstituted (○) data from Tubuai Island (Chauvel et al., 1992; Kogiso et al., 1997). It should be noted that fractional crystallization explains only 22% of the spread in concentration of both elements and further that the fit parameters for the linear regressions (not shown) remain largely unchanged. Arrows connect two datapoints before and after correction. The length of the longer arrow corresponds to addition of 28% solids. (c) Comparison of raw (•) and reconstituted (○) data from Inaccessible Island (Cliff et al., 1991). It should be noted that restoration in this example increases the spread and improves the correlation for linear regressions (not shown). Arrow connects a sample that experienced 26% fractional crystallization. (d) Comparison of raw (•) and reconstituted (○) data from Teahitia, Society Islands (Hémond et al., 1994). Correction for fractional crystallization successfully restores to one melt composition (MgO = 13·95 wt %) by reducing both the spread and the degree of linear correlation in the data. (Note that correlation coefficient of corrected data is only 0·002.)](https://oup.silverchair-cdn.com/oup/backfile/Content_public/Journal/petrology/41/7/10.1093_petrology_41.7.1007/3/m_egd059.f2.jpeg?Expires=1716382365&Signature=OVlnPR70aucQ4Lpl91XQ5PN3Ql3K-YDgPjITw6tLqU7HQa9Q4BOezNV79lNFmCN56t54qn-8XdKt25jYE7~XhRZfeLa9iX0naIRkS0RjQMIZsMgsPKWE9JTNzGekScV8YBE5uS4b9RFFcXsIlOhuDRUSqax~92HZR8Rmmvc7oXyvicR26fJ0QuuOiBh1Gp-uTYIpRNVtN7iAakoYlk9RtB1qVrFkcCWGAhLgLULeDGasmwUxb7yAJWdXnYLLMV~Lr4gVlfocKDqdiyl3hgAm7UTFY085gRK5HfuRm36Go02x~DNo~LzZCmLSGuZjFE2lWsUDw7SKyLWGG2yURE1Pyg__&Key-Pair-Id=APKAIE5G5CRDK6RD3PGA)
Bivariate Zr vs Nb concentration plots. (a) Perfect linear arrays result from olivine fractionation (space between open symbols corresponds to an increment of 5% olivine [Fo89·5] segregation). The four arbitrarily chosen parental melt Nb and Zr concentrations (▪) determine the slope of the fractionation lines. It should be noted that all linear regressions intersect very close to the origin, irrespective of the Zr/Nb ratio of the parental melt. (b) Comparison of raw (•) and reconstituted (○) data from Tubuai Island (Chauvel et al., 1992; Kogiso et al., 1997). It should be noted that fractional crystallization explains only 22% of the spread in concentration of both elements and further that the fit parameters for the linear regressions (not shown) remain largely unchanged. Arrows connect two datapoints before and after correction. The length of the longer arrow corresponds to addition of 28% solids. (c) Comparison of raw (•) and reconstituted (○) data from Inaccessible Island (Cliff et al., 1991). It should be noted that restoration in this example increases the spread and improves the correlation for linear regressions (not shown). Arrow connects a sample that experienced 26% fractional crystallization. (d) Comparison of raw (•) and reconstituted (○) data from Teahitia, Society Islands (Hémond et al., 1994). Correction for fractional crystallization successfully restores to one melt composition (MgO = 13·95 wt %) by reducing both the spread and the degree of linear correlation in the data. (Note that correlation coefficient of corrected data is only 0·002.)
A similar picture unfolds if concentration levels of compatible elements are studied. Fractional crystallization of 40% olivine would lower the Ni concentration of the remaining liquid by a factor of almost 100 (using a conservative DNiolivine/liquid of 10; Kinzler et al., 1990). However, Ni concentrations even in the more evolved OIB are still comparatively high (generally >50 ppm) and the Ni Cmaximum/Cminimum ratios rarely exceed 20 (e.g. Ni Cmaximum/Cminimum for the selected Walvis Ridge basalts is 4·3). Notwithstanding the fact that incompatible trace element levels in some of the more evolved OIB suites (particularly hawaiite to benmoreitic series) can be modelled by fractional crystallization (e.g. le Roex & Erlank, 1982; le Roex et al., 1990; Ablay et al., 1998), we conclude that the variability of enrichment observed in the vast majority of OIB cannot solely reflect fractional crystallization.
Another prediction of simple olivine segregation is that the intercept of a linear regression through the Zr vs Nb concentration data should always be close to zero (Fig. 2a), irrespective of the (in our case arbitrarily chosen) concentrations in the parental melt. This is because olivine, in which Zr and Nb are both highly incompatible, plots very close to the origin of a concentration plot. However, regression lines for natural data invariably have non-zero intercepts. The average Zr intercept calculated from global OIB is 49 (Table 1), which explains why Zr/Nb ratios systematically vary with Nb concentration. In clinopyroxene Zr is more compatible than is Nb (Dclinopyroxene/liquid of 0·1234 vs 0·0077; Zack et al., 1997) and therefore clinopyroxene removal could lead to Zr vs Nb concentration trends with positive Zr intercepts. However, removal of olivine and clinopyroxene in proportions of 0·6:0·4 only lifts the Zr intercept to a value of 12. Fractional crystallization alone therefore fails to account for the observation that the majority of regressions of natural data yield intercepts significantly different from zero. This suggests that an additional process is at work.
Zr/Nb systematics beyond fractional crystallization
To assess which other processes could be responsible for the wide range of trace element concentrations found in OIB it is necessary to correct for removal of liquidus phases. Unfortunately, this procedure relies on a large number of assumptions that are difficult to test. For the purpose of evaluating whether the covariation between Zr and Nb concentrations remains linear after correction of crystal fractionation it is not necessary to know the composition of the parental melt. Rather, the more evolved melts are reconstituted to the composition of the most primitive sample used in Table 1. The largest uncertainty derives from the unknown proportions of removed liquidus phases and their distribution coefficients for Zr. Uncertainties regarding the major element compositions of the liquidus phases are second order and will not be further considered here.
We use the MgO content as a proxy for degree of differentiation despite this ignoring the effects of plagioclase fractionation. However, as pointed out by Albarède (1992), plagioclase is of limited importance in OIB post-melting fractionation. This is illustrated in Fig. 3, where apparent liquid lines of descent are shown for St Helena and Gough in plots of FeO vs FeO/MgO. This plot is particularly useful to assess the importance of plagioclase fractionation, as the FeO/MgO ratio is unaffected but FeO is increased. The apparent liquid lines of descent for both Gough and St Helena demonstrate the dominance of olivine over clinopyroxene over plagioclase fractionation. This is true even for the very evolved samples (with MgO < 5 wt %) that were generally not included for calculation of Zr vs Nb correlation in Table 1 (see also caption to Fig. 3). Data in Table 1 were corrected for crystal fractionation with a four-stage restoration. Stage one (for MgO up to 6 wt %) involved addition of olivine, clinopyroxene and plagioclase in 0·4:0·2:0·4 proportion (MgO of olivine, 40 wt %; MgO of clinopyroxene, 14 wt %; MgO of assemblage, 18·8 wt %). In stage two (from 6 to 8 wt % MgO), the proportion of olivine to clinopyroxene to plagioclase was changed to 0·6:0·2:0·2 (MgO of olivine, 43 wt %; MgO of clinopyroxene, 14 wt %; MgO of assemblage, 28·6 wt %). Stage three (from 8 to 10 wt % MgO) involved olivine and clinopyroxene only, in a proportion of 0·8:0·2 (MgO of olivine, 45 wt %; MgO of clinopyroxene, 14 wt %; MgO of assemblage, 38·8 wt %). Final stage four involved olivine (MgO 48 wt %) addition alone. Nb and Zr were treated as completely incompatible in all three phases, except for Zr in clinopyroxene, for which a distribution coefficient of 0·1234 was used (Zack et al., 1997).
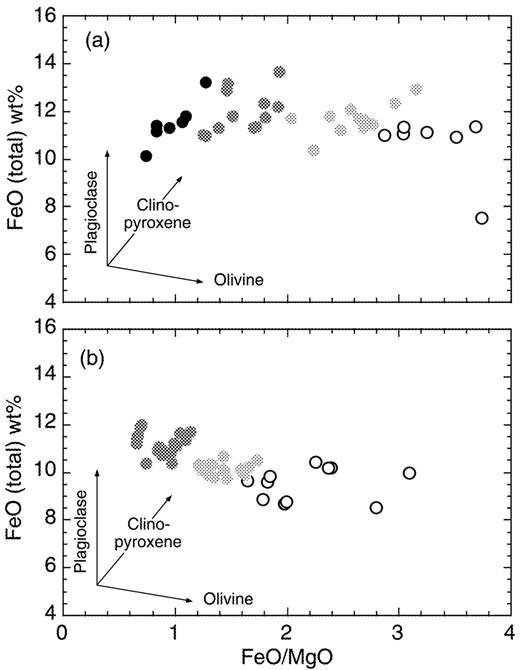
Plot of FeO (total) vs FeO/MgO ratio. (a) Data points for St Helena samples (Chaffey et al., 1989) are coded for MgO content: 2–4 wt %, white; 4–6 wt %, light grey; 6–10 wt %, dark grey; 10–14 wt %, black. Fractionation over this large range in MgO is evidently dominated by olivine and even the most evolved samples show only limited evidence for clinopyroxene and plagioclase removal. Removal vectors after Albarède (1992). It should be noted that in Table 1 only samples with MgO > 6 wt % were used for St Helena. (b) Identical plot for middle basalts from Gough (le Roex, 1985). Colour coding for MgO content: 3–6 wt %, white; 6–10 wt %, light grey; 10–18 wt %, dark grey. Table 1 uses only samples with MgO between 6 and 14 wt %.
The reconstituted datasets were then used to calculate a second set of regression parameters for correlations in Zr vs Nb plots (Table 1). It is evident that the quality of correlation, on average, deteriorates only marginally and that a significant linear correlation still exists after correction for fractional crystallization. More specifically, the median correlation coefficient dropped from 0·950 in the original dataset to 0·921 in the corrected datasets. Furthermore, the changes in Zr intercept (median difference of 5·94) and slope (median difference of 0·233) are also small.
Effects of the outlined restoration procedure are illustrated for three datasets. Figure 2b shows a comparison between raw and back-corrected data for basalts from the island of Tubuai [data from Chauvel et al. (1992) and Kogiso et al. (1997)]. It is immediately obvious that although olivine, clinopyroxene and plagioclase addition does reduce the total range in Zr concentrations there remains 78% of the original (large) spread in the reconstituted magma (with MgO 14·95 wt %) and that the data still define a largely unchanged linear array. For datasets that include primitive samples with high incompatible trace element contents restoration does not significantly reduce the data spread and in a few cases even enlarges the spread (Fig. 2c). Only for a single dataset (Teahitia) does the restoration model provide the full explanation for data spread and linear correlation.
Our analysis of Zr/Nb systematics thus confirms the findings of previous studies (e.g. Nicholson & Latin, 1992) claiming that fractional crystallization alone cannot explain the range of enrichment in incompatible trace elements of individual OIB suites. In addition, our analysis shows that the linear correlation between concentrations of Nb and Zr is a feature of the magma(s) that existed before fractional crystallization. In a next step we use this observation to evaluate the role of variable degree of melting in the OIB source.
Effect of degree of melting on Zr/Nb systematics
It is impossible to derive very enriched OIB melts from single-stage melting of depleted upper mantle (McKenzie & O’Nions, 1995, 1998). Therefore, if enriched melts are to be derived from the upper mantle, it is necessary to postulate an enriched source. Figure 4a illustrates Zr vs Nb concentrations for increasing degrees of modal batch and aggregated fractional melting of such an enriched source (composition: 1 part MORB + 9 parts primitive mantle; mineralogy: 60% olivine + 25% orthopyroxene + 10% clinopyroxene + 5% garnet). Although neither of these endmember models is realistic, they both illustrate the pertinent point: because of the difference in the bulk distribution coefficients between Zr and Nb, any melting model will generate a curve, and not a straight line, on a bivariate plot. In other words, the Nb concentration in the melt is far more sensitive to the degree of melting than is Zr (Fig. 4a). It is thus clear that the residual variation (i.e. after correction for fractional crystallization) in incompatible trace element enrichment of OIB is not simply a function of variable melting degree.
![(a) Concentration arrays predicted by changes in melt fraction (filled symbols refer to batch melting; open symbols to accumulated fractional melting). Plotted points correspond to melt fractions of 0·001, 0·002, 0·005, 0·008, 0·01, 0·012, 0·015, 0·02, 0·025, 0·05, 0·06, 0·07, 0·08, 0·1, 0·125, 0·15, 0·25, 0·5 and 1. Enriched source composition (19·2 ppm Zr; 0·91 ppm Nb) consists of one part N-MORB and nine parts primitive mantle [both after Hofmann (1988)]. Both models assume modal melting with constant mineralogy of source (60% olivine + 25% orthopyroxene + 10% clinopyroxene + 5% garnet). Partition coefficients for clinopyroxene and garnet after Green et al. (1989), and for olivine and orthopyroxene after Ewart et al. (1998). Changing degrees of melting generate curved concentration arrays, irrespective of the melting model. (b) Concentration arrays modelled by accumulated fractional melting of a moderately depleted source (•) vs an enriched source (○). Plotted points correspond to melt fractions of 0·001, 0·002, 0·005, 0·008, 0·01, 0·012, 0·015, 0·02, 0·025, 0·05, 0·06, 0·07, 0·08 and 0·1. Depleted source (9·71 ppm Zr; 0·62 ppm Nb) is primitive mantle (Hofmann, 1988). Enriched source (33·4 ppm Zr; 1·34 ppm Nb) consists of 7·5 parts primitive mantle and 2·5 parts N-MORB (Hofmann, 1988). Other parameters identical to (a). Mixing line (through ♦) symbols) connects a 0·50% melt from the enriched reservoir with a 6% melt from the depleted reservoir. The line is defined as Zr = 80·3 + 2·81 × Nb.](https://oup.silverchair-cdn.com/oup/backfile/Content_public/Journal/petrology/41/7/10.1093_petrology_41.7.1007/3/m_egd059.f4.jpeg?Expires=1716382365&Signature=Ep8NGbJ4mr1tbDYHB3AOH4-nH~urc0ndAghh0x3Aw4Kx-oYIBtKbgeGwOn-ox-1CtFmuxbL0WqxPERDllNoBkU9LAYn-YpYkd0A-86SEtsIygmnBZq1f6DhYroOPB4ME9aIa3HRu8~ewK3alknFc4nbDSFPFcKn9iFBrERf1ww7zHpPQmp9vL6B12JK0P6ycVxQ-dKHcpO0JJwqEOI31MTcahz2sVUczDRCWcS7wT-3-4lStqAL8eD80A1Q5ghvyTAbVb8Qd8u0DmrOdhpILwop-JmzU5ThnEH0g~bxJSTK3fE4Ib4h2v3EEkfMnt0iXf2A8weqfHV5PaH91osQS5g__&Key-Pair-Id=APKAIE5G5CRDK6RD3PGA)
(a) Concentration arrays predicted by changes in melt fraction (filled symbols refer to batch melting; open symbols to accumulated fractional melting). Plotted points correspond to melt fractions of 0·001, 0·002, 0·005, 0·008, 0·01, 0·012, 0·015, 0·02, 0·025, 0·05, 0·06, 0·07, 0·08, 0·1, 0·125, 0·15, 0·25, 0·5 and 1. Enriched source composition (19·2 ppm Zr; 0·91 ppm Nb) consists of one part N-MORB and nine parts primitive mantle [both after Hofmann (1988)]. Both models assume modal melting with constant mineralogy of source (60% olivine + 25% orthopyroxene + 10% clinopyroxene + 5% garnet). Partition coefficients for clinopyroxene and garnet after Green et al. (1989), and for olivine and orthopyroxene after Ewart et al. (1998). Changing degrees of melting generate curved concentration arrays, irrespective of the melting model. (b) Concentration arrays modelled by accumulated fractional melting of a moderately depleted source (•) vs an enriched source (○). Plotted points correspond to melt fractions of 0·001, 0·002, 0·005, 0·008, 0·01, 0·012, 0·015, 0·02, 0·025, 0·05, 0·06, 0·07, 0·08 and 0·1. Depleted source (9·71 ppm Zr; 0·62 ppm Nb) is primitive mantle (Hofmann, 1988). Enriched source (33·4 ppm Zr; 1·34 ppm Nb) consists of 7·5 parts primitive mantle and 2·5 parts N-MORB (Hofmann, 1988). Other parameters identical to (a). Mixing line (through ♦) symbols) connects a 0·50% melt from the enriched reservoir with a 6% melt from the depleted reservoir. The line is defined as Zr = 80·3 + 2·81 × Nb.
It could be argued that integration of melt in the melting environment would smooth out the curved Zr vs Nb relationship generated by variable degrees of melting. The problem with such an explanation is that the observed range in trace element concentrations in residual datasets would already require relatively large variations in the degree of melting. If melt integration is invoked, this problem is magnified, as the true range of incompatible trace element concentrations is telescoped into the mixing array. This can be appreciated from the Nb/Zr/Y modelling by Fitton et al. (1997). Those workers could reproduce the slope defined by Icelandic lavas in an Nb/Y vs Zr/Y plot (their fig. 3b) with a model involving 2% melt retention. However, a 1–10% variation in degree of melting could explain only ∼40% of the data spread (for a garnet-bearing source). For a spinel-bearing source, the same range in melting degree could account for only ∼15% of the data spread. We therefore conclude that Zr/Nb systematics of OIB cannot be explained by variable degree of melting of a compositionally homogeneous source.
Melt integration in the melting column is, in effect, a mixing process. It is therefore inherently difficult to distinguish from mixing of two (potentially unrelated) melts. The ‘accepted’ interpretation of Zr/Nb ratios and radiogenic isotope signatures of OIB relies on two principles: first, that the OIB source is variably enriched; second, that melting occurs to variable extent in these sources. The simplest such case is binary mixing of one type of melt produced in a more enriched source portion with a second type of melt coming from a more depleted source portion. Figure 4b shows accumulated fractional melting curves for a relatively depleted source compared with that of a strongly enriched source. Mixing lines with positive slopes in the range of those observed in natural datasets (ranging between 1·38 and 15·4; Table 1) are obtained only when the depleted source is melted to a considerably higher degree than the enriched source. Although we accept this as a possibility we find it counterintuitive, particularly as enriched, metasomatized mantle peridotites and lherzolites commonly contain additional phases such as richterite, phlogopite or apatite (e.g. Hauri et al., 1993). Hydrous phases tend to lower the solidus, which seems to contradict the model requirement of limited melting.
In summary, the surprisingly coherent behaviour of Zr vs Nb concentrations in the majority of global OIB requires some form of (binary) mixing process.
THE DEPLETED ENDMEMBER
Two recent studies have pointed out that the Pb-isotope variations for individual ocean islands (or even individual magma eruptions) are best explained by two-component mixing, implying the coexistence of two different magmas before or during melt aggregation. Saal et al. (1998), in an analytically challenging experiment, have found very large variations in Pb-isotope composition in melt inclusions from isotopically homogeneous lava samples from the Cook and Society Islands. They found linear arrays on 207Pb/206Pb vs 208Pb/206Pb plots with clear evidence for an isotopically enriched and a more primitive mixing endmember. Kamber & Collerson (1999), in a study of global OIB Pb-isotope systematics, have suggested that the linear OIB arrays in plots of 207Pb/204Pb vs 206Pb/204Pb have no age significance but instead reflect binary mixing between a depleted melt and an isotopically enriched melt from an unfractionated reservoir. They also found that a depleted endmember (most probably ambient MORB-source mantle) is common to all OIB.
We propose that the Zr/Nb systematics of global OIB provides additional evidence for binary mixing and we furthermore postulate that all OIB have a common depleted mixing endmember. If OIB indeed share a common mixing endmember, the Zr vs Nb concentration regression lines of all datasets should, within reason, intersect at a common point. There are, however, two factors that could cause deterioration in the closeness of intersection. First, slopes and intercepts of our regression lines (listed in Table 1) may not necessarily be accurate in spite of the closeness of fit to the data. This is because of the possibility of systematic bias introduced by analytical calibration. In older studies, both Nb and Zr concentrations were usually determined by the XRF technique. More modern studies, however, often present mixed datasets in which Zr is measured by XRF and Nb by ICP-MS. Potentially biased regressions from mixed datasets (constituting the majority of those used in Table 1) would therefore enlarge the area in which all regression lines intersect. Second, some OIB have a substantial lithospheric mantle component, which may affect their Zr/Nb systematics. Derivation of OIB from, or contamination with old lithospheric mantle (in some cases sub-continental-like material) has, for example, been demonstrated by He isotopes (Hilton et al., 1995), Os isotopes (Widom et al., 1997; Hassler & Shimizu, 1998) and large ion lithophile element (LILE) characteristics of OIB (Claude-Ivanaj et al., 1998). Lithospheric mantle xenoliths, on average, have subchondritic Nb/Ta ratios (McDonough, 1990). The Nb surplus in the lithospheric mantle is indeed also reflected by low Nb/Ta ratio of those OIB for which such a component has been suggested on independent evidence (Kamber & Collerson, 2000). In the following discussion, data from the Azores, Cameroon, Karthala (Comores), Cape Verde, Heard and Kerguelen have been excluded from our statistical treatment. There is a possibility that a lithospheric mantle component could explain the low correlation coefficients for Zr/Nb concentrations in Heard Island and Kerguelen samples, as well as the unusual Zr-axis intercepts for Cape Verde, Heard and Azores samples (Table 1). We also excluded the regression parameters for Teahitia because of the insignificant correlation coefficient of the residual dataset.
To evaluate the hypothesis of a common, depleted OIB endmember, we calculated the 741 intersections of the regression lines and the angle of intersection (β) from the remaining 40 datasets. Figure 5 shows the calculated 741 Nb and Zr intersections as functions of β. The first and most important observation is the lack of evidence for a multi-modal distribution. To test the normality of distribution, we computed histograms for the products of β times Nb and Zr, respectively (Fig. 6). The optical impression of normal distribution is confirmed by the low skewness (0·50 for Nb and 1·21 for Zr). We therefore conclude that Zr/Nb systematics is compatible with the view that a depleted endmember is common to all OIB.
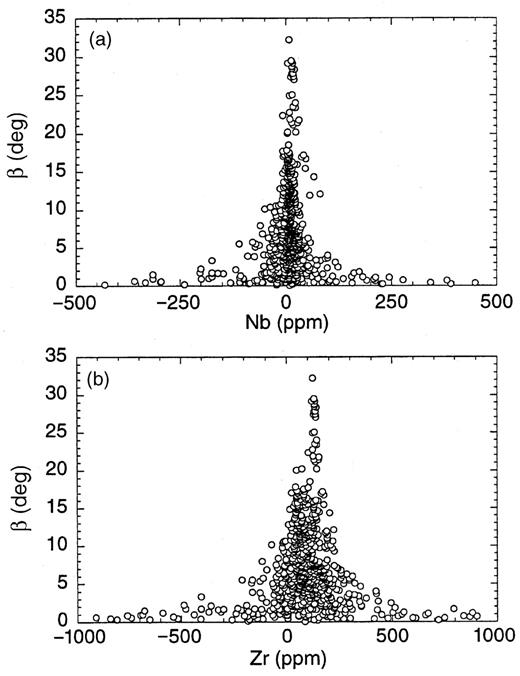
Plots of intersection angle (β in degrees) between 40 regression lines of selected datasets from Table 1 vs Nb (a) and Zr (b) concentrations at intersections (n = 741). It should be noted that intersection concentrations far off the median and weighted average result from intersections at very low angles. These correspond to intersections of quasi-parallel regression lines. This wide spread precludes calculation of meaningful standard deviations. Nevertheless, intersections at high angles define a common depleted end-member to all OIBs in the range of 0–10 ppm Nb and 50–150 ppm Zr. Further discussion is given in the text.
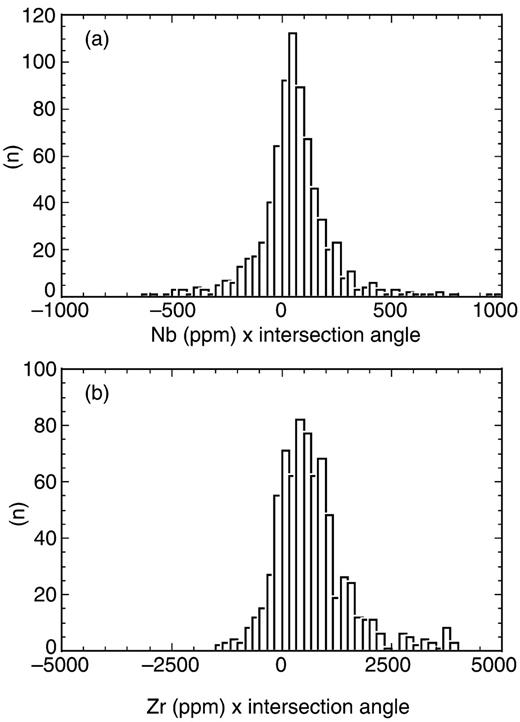
Histograms of products of Nb (a) and Zr (b) concentrations at intersections and intersection angle (β in degrees). Both datasets have low skewness (0·50 for Nb and 1·21 for Zr), which indicates near-normal distribution. Also, in terms of ‘peakedness’, both distributions are near-normal with moment coefficients of kurtosis of 4·88 (Nb) and 2·65 (Zr).
Because intersections of quasi-parallel lines (under low angles) scatter widely, it is necessary to calculate the average intersection by a weighted mean where β is used as the weighting factor. The respective intersection values compare well with the medians: 92 ppm (weighted mean) and 84 ppm (median) for Zr concentration, and 7·92 ppm (weighted mean) and 7·92 ppm (median) for Nb concentration. Unless an arbitrary chosen cut-off limit for the interception angle is chosen (i.e. rejecting data from regressions that intersect below a certain angle), no sensible errors for these averages can be estimated. Nevertheless, our estimated concentrations of Nb and Zr in the postulated common depleted endmember are in reasonable agreement with estimated average MORB melts, namely, 3·5 ± 1·9 ppm Nb and 104 ± 42 ppm Zr (Hofmann, 1988).
Quantitative treatment of Zr/Nb systematics is limited by assumptions made regarding fractional crystallization and possible analytical bias. Nevertheless, the analysis of interception points shows that Zr/Nb systematics is not in conflict with a common MORB-like depleted mixing endmember that we have postulated based on Pb-isotope constraints (Kamber & Collerson, 1999).
THE ENRICHED ENDMEMBER(S)
Zr/Nb systematics also helps to constrain further the nature of enriched OIB components, regardless of whether OIB have a common depleted component. In our view, the origin of enriched mantle melt remains elusive. We therefore restrict the discussion to some limiting constraints.
We have demonstrated that even after correction for fractional crystallization most OIB are unexpectedly enriched in many incompatible (and compatible) trace elements. Furthermore, it is obvious from Table 1 that the specific slopes in Zr vs Nb concentration diagrams are highly variable for global OIB. At an arbitrarily chosen Nb concentration of 100 ppm, the corresponding Zr concentrations in global OIB vary between 250 and 1540 ppm. Such a variation in Zr/Nb ratios could, in theory, be explained by very small degree melting of sources with strongly variable olivine contents (high proportions of olivine are required for the high Zr/Nb OIB). However, if a fit to the entire set of incompatible trace element data is attempted (particularly the REE) it is clear that single-stage melting of MORB-source or primitive upper mantle is unrealistic for the origin of enriched OIB. McKenzie & O’Nions (1998) have given a comprehensive discussion of this issue and concluded that at least the strongly enriched OIB require a two-stage history in which the source is enriched (by a small-degree melt from within the garnet stability field) before OIB melt generation per se. McKenzie & O’Nions (1998) did not address the issue of variable trace element enrichment within a cogenetic suite of OIB samples but it appears possible that their model could produce the enriched endmembers for the binary mixing envisaged in our model.
An alternative approach is to identify naturally occurring highly enriched mantle melts. Of all terrestrial magmas those with carbonatitic and kimberlitic affinity are generally the most strongly enriched in many incompatible trace elements. An increasing number of purely oceanic carbonatites (or reaction products between them and oceanic mantle xenoliths) are being found. Most recently, Coltorti et al. (1999) reported the occurrence of glass and clinopyroxene reaction rims in lherzolite and wehrlite xenoliths from La Grille volcano (Grand Comore Island). Some of these glasses, which Coltorti et al. (1999) interpreted as quenched melt products between a carbonatitic metasomatizing fluid and a primary mantle assemblage, are strongly enriched in incompatible trace elements. In Fig. 7 we compare primitive mantle normalized contents of two such glasses with those in a typical La Grille basanite [data from Deniel (1998)]. The good match demonstrates that carbonatitic melts (or reaction products of carbonatitic melt with ambient mantle) could represent the enriched endmember for the proposed binary mixing model.
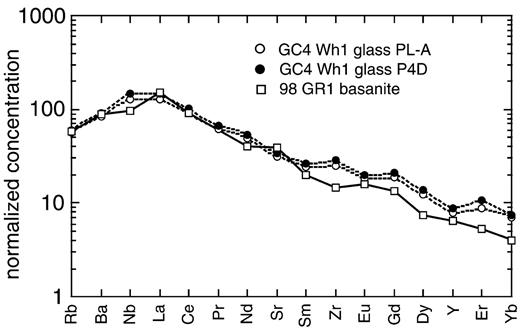
Primitive mantle (after Hofmann, 1988) normalized trace element plot for a representative enriched La Grille basanite (□ 98 GR1; from Deniel, 1998) and two glass reaction rims from wehrlite xenolith (• and ○ GC4 WH1; from Coltorti et al., 1999). There is a remarkably good fit for the strongly to mildly incompatible elements. Further discussion is given in the text.
Petrogenesis of carbonatites is a complex issue. Some carbonatites could be the product of liquid immiscibility between carbonate and silicate melt whereas others appear to be generated by partial melting of carbonated peridotite (e.g. Harmer & Gittins, 1998). Liquid immiscibility has a strong potential to fractionate incompatible elements. Interestingly, high field strength elements (HFSE) show unexpectedly incoherent partitioning between carbonate and silicate phase, as noted by Veksler et al. (1998). According to that study, Zr partitions far more strongly into the silicate melt (DZrcarbonate/silicate = 0·016) than Nb (DNbcarbonate/silicate = 0·503). Presence or absence of liquid immiscibility and variable degree of physical separation between carbonate and silicate melt therefore offer attractive explanations for the very variable Zr/Nb ratio required for the enriched endmember of our binary mixing model. Equally strong HFSE fractionation has been observed between carbonatitic fluids and carbonates and silicates, by Bühn & Rankin (1999). Those workers found that alkali-carbonatitic fluids fractionate Zr whereas Nb is concentrated in volatile-deficient sövitic host carbonatite. Metasomatism by such carbonatites, coupled with devolatilization, is therefore another mechanism that could create large differences in Zr/Nb ratio of enriched mantle.
The ultimate origin of carbonatites and kimberlitic magmas themselves remains a contentious issue. Because they are predominantly found (or preserved?) in continental settings it was speculated that they might originate in deep subcontinental lithospheric mantle (SCLM) roots. However, recent rare gas studies on carbonatites indicate that some could derive from undegassed lower mantle (e.g. Sasada et al., 1997; Marty et al., 1998; Dauphas & Marty, 1999). The possibility of enriched OIB melts originating in the lower mantle has also been claimed on the basis of Os-isotope evidence (e.g. Brandon et al., 1998). The thermal structure of the lower-mantle and lowermost-mantle solidus are poorly understood, and opinions about the possibility of lower-mantle melting differ (e.g. Zerr et al., 1998; da Silva et al., 2000). We simply note that the larger differences in distribution coefficients between the predominant lower-mantle phases (e.g. Gasparik & Drake, 1995) would allow for much wider concentration differences in melts, thereby eliminating the need for reservoir enrichment. Kato et al. (1996) pointed out that the complete exhaustion of CaSi-perovskite could lead to melts with kimberlitic major and trace element compositions.
IMPLICATIONS OF BINARY MIXING FOR ISOTOPE CHARACTERISTICS OF OIB
Radiogenic isotopes are a widely used tool in attempts to decipher the nature of mantle sources that contribute to oceanic magmatism (e.g. Zindler & Hart, 1986). The radiogenic isotope systematics of basalts of individual ocean islands (or stratigraphic units) is formally consistent with binary mixing in that well-defined data arrays are common in multi-isotope plots. The most convincing example for hybridization of two isotopically and geochemically distinctive melts has recently been reported by Saal et al. (1998). If, as we argue, all OIB that lack contamination by SCLM are binary mixtures, linear data arrays are predicted in plots of isotope ratios of the same element (i.e. 207Pb/204Pb vs 206Pb/204Pb, 208Pb/204Pb vs 206Pb/204Pb and 186Os/188Os vs 187Os/188Os). Kamber & Collerson (1999) have shown that this criterion is met by Pb-isotope systematics of global OIB. This appears also to be true for the very limited 186Os/188Os vs 187Os/188Os data (Brandon et al., 1998).
In isotope ratio plots that combine different elements (e.g. 87Sr/86Sr vs 143Nd/144Nd), however, deviations from linear mixing arrays are plausible if mixing endmembers have significantly different concentration ratios. We have demonstrated that Zr/Nb systematics requires enriched endmembers with strongly variable Zr/Nb ratios. Because Sr and Nd have very similar bulk-distribution coefficients in MORB melting (Hofmann, 1988), the large variation in Sr/Nd ratios found in OIB (from 1 to 30 with a median of 15·6; Kamber & Collerson, 1999) clearly demonstrates the involvement of a process in the genesis of OIB that is efficiently fractionating these two elements. There is a possibility that the wide range of Sr/Nd ratios of OIB is partly caused by clinopyroxene and plagioclase crystallization. However, the Walvis Ridge example shows that a large range in Sr/Nd existed in the melt before possible clinopyroxene and plagioclase removal (Fig. 8). We note that immiscibility of carbonate–silicate melts and metasomatism by carbonatitic fluids have strong potential to fractionate Sr from Nd. Veksler et al. (1998) have determined partitioning of Sr and Nd between carbonate and silicate melts and have found them to be very different (DSrcarbonate/silicate = 4·1, DNdcarbonate/silicate = 0·92). The median Sr/Nd ratio of 15·56 of global OIB is identical to the primitive mantle value of 15·3 and significantly higher than the average MORB value of 10·1 [from compilation by Hofmann (1988)]. Perfect carbonate–silicate separation could fractionate the primitive mantle Sr/Nd ratio to between ∼70 (carbonate) and ∼3·5 (silicate), not dissimilar to the range observed in nature.
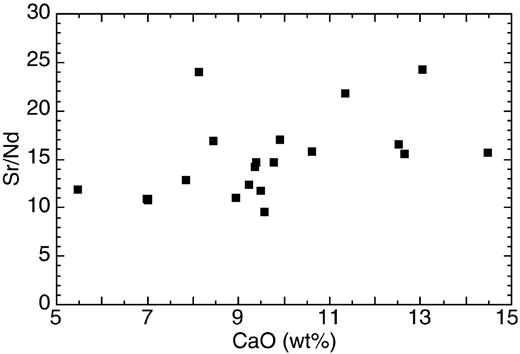
Sr/Nd ratios vs CaO content of Walvis Ridge basalts (from Richardson et al., 1982; Thompson & Humphris, 1982; Humphris & Thompson, 1983). Plagioclase fractionation evidently cannot explain the spread in Sr/Nd ratio.
We have already demonstrated (Kamber & Collerson, 1999) that Sr- vs Nd-isotope systematics of OIB that lack SCLM contamination can be successfully explained by binary mixing between a depleted and a near-chondritic endmember. Furthermore, we argued that the entire OIB Pb-isotope array could also be generated by only two endmembers that differ significantly in their 207Pb/204Pb composition (the depleted mantle having a lower 207Pb/204Pb ratio because of continental growth with no significant recycling of U in Archaean and early Proterozoic times; Collerson & Kamber, 1999). The vast spread in 206Pb/204Pb and 208Pb/204Pb was explained as forming during a transient high U/Pb and Th/Pb stage, caused by strong fractionation during intra-mantle differentiation (e.g. carbonate–silicate melt immiscibility), which is also indicated by the Zr/Nb systematics.
Isotopic characterization of the mantle needs to be reassessed in view of the possibility that OIB could represent hybrid melts between two distinctive endmembers with different isotope and incompatible trace element composition.
CONCLUSIONS
Global OIB show surprisingly tight linear correlations between Zr and Nb concentration. The major element composition and compatible element concentrations of these OIB impose a maximum limit to effects of fractional crystallization. Even after reconstituting to possible parental magma compositions, substantial variability in Zr and Nb (and other trace element) concentrations remains. Furthermore, the linear relationship between Zr and Nb concentrations and the generally positive Zr-intercept remain largely unchanged (Table 1).
By comparison with predictions of melting models we show that the variability in incompatible trace element concentration in parental OIB magmas is not due to variable degrees of melting. The concentration of the highly incompatible element Nb is far more strongly dependent on the degree of melting than that of the mildly incompatible element Zr. Therefore, variable degrees of melting predict curved arrays in Zr vs Nb concentration plots.
We propose that the linear Zr vs Nb concentration arrays reflect binary mixing (hybridization) of two distinctive melts. We suggest that all OIB have a common depleted endmember that is similar to MORB. The enriched endmember has a very variable Zr/Nb ratio. Rather than implying the existence of several, distinct enriched reservoirs, we speculate that the highly variable Zr/Nb ratio could reflect intra-mantle processes. Enrichment of normal mantle peridotite with a low (but variable) degree melt from within the garnet stability field (McKenzie & O’Nions, 1998), carbonatitic fluid metasomatism or carbonate–silicate immiscibility (Green & Wallace, 1988) have the potential to produce melts of the required Zr/Nb composition. The sources of the metasomatizing agent are either the lowermost mantle or the depleted mantle.
The proposed binary mixing model is supported by Pb-isotope (Saal et al., 1998; Kamber & Collerson, 1999) and Os-isotope systematics (Brandon et al., 1998). Sr/Nd ratios in OIB are sufficiently variable to allow for significant deviation from a linear mantle mixing array and combined Sr–Nd-isotope systematics is therefore not conclusive evidence against a simple two-component mantle model.
*Corresponding author: Tel: +61-7-3365-8580. Fax: +61-7-3365-1277. e-mail: kamber@earthsciences.uq.edu.au
We would like to thank Marcel Regelous for compiling parts of the OIB database, and Tony Ewart for stimulating discussions. Reviews by W. Bohrson, G. Fitton and M. Thirlwall are gratefully acknowledged. B.S.K. fondly remembers late, witty and mind-sharpening nights with the Cox family—thank you! This work was supported by Swiss National Science Foundation Grant 8220-050352 to B.S.K.
REFERENCES
Ablay, G. J., Carroll, M. R., Palmer, M. R., Martí, J. & Sparks, R. S. J. (
Albarède, F. (
Ayers, J. (
Barling, J., Goldstein, S. L. & Nicholls, I. A. (
Brandon, A. D., Walker, R. J., Morgan, J. W., Norman, M. D. & Prichard, H. M. (
Bühn, B. & Rankin, A. H. (
Chaffey, D. J., Cliff, R. A. & Wilson, B. M. (
Chase, C. G. (
Chauvel, C., Hofmann, A. W. & Vidal, P. (
Chauvel, C., McDonough, W., Guille, G., Maury, R. & Duncan, R. (
Claude-Ivanaj, C., Bourdon, B. & Allègre, C. J. (
Cliff, R. A., Baker, P. E. & Mateer, N. J. (
Collerson, K. D. & Kamber, B. S. (
Coltorti, M., Bonadiman, C., Hinton, R. W., Siena, F. & Upton, B. G. J. (
da Silva, C. R. S., Wentzcovitch, R. M., Patel, A., Price, G. D. & Kewato, S. L. (
Dauphas, N. & Marty, B. (
Deniel, C. (
Elliott, T. R. (
Elliott, T., Zindler, A. & Bourdon, B. (
Ewart, A., Collerson, K. D., Regelous, M., Wendt, J. I. & Niu, Y. (
Ferrara, G. & Treuil, M. (
Fisk, M. R., Upton, B. G. J., Ford, C. E. & White, W. M. (
Fitton, J. G., Saunders, A. D., Norry, M. J., Hardarson, B. S. & Taylor, R. N. (
Frey, F. A. & Weis, D. (
Gasparik, T. & Drake, M. J. (
Gerlach, D. C., Cliff, R. A., Davies, G. R., Norry, M. & Hodges, N. (
Green, D. H. & Wallace, M. E. (
Green, T. H., Die, S. H., Ryan, C. G. & Cousens, D. R. (
Hanyu, T. & Kaneoka, I. (
Harmer, R. E. & Gittins, J. (
Hassler, D. R. & Shimizu, N. (
Hauri, E. H., Shimizu, N., Dieu, J. J. & Hart, S. R. (
Hekinian, R., Bideau, D., Stoffers, P., Cheminée, J. L., Muhe, R., Puteanus, D. & Binard, N. (
Hémond, C., Arndt, N. T., Lichtenstein, U. & Hofmann, A. W. (
Hémond, C., Devey, C. W. & Chauvel, C. (
Hilton, D. R., Barling, J. & Wheller, G. E. (
Hoernle, K. (
Hofmann, A. W. (
Hofmann, A. W. & Jochum, K. P. (
Humphris, S. E. & Thompson, G. (
Kamber, B. S. & Collerson, K. D. (
Kamber, B. S. & Collerson, K. D. (
Kato, T., Ohtani, E., Ito, Y. & Onuma, K. (
Kinzler, R. J., Grove, T. L. & Recca, S. I. (
Kogiso, T., Tatsumi, Y., Shumoda, G. & Barsczus, H. G. (
Kramers, J. D. & Tolstikhin, I. N. (
Kramers, J. D., Nägler, T. F. & Tolstikhin, I. N. (
le Dez, A., Maury, R. C., Vidal, P., Bellon, H., Cotten, J. & Brousse, R. (
le Roex, A. P. (
le Roex, A. P., Cliff, R. A. & Adair, B. J. I. (
le Roex, A. P. & Erlank, A. J. (
Lee, D.-C., Halliday, A. N., Fitton, J. G. & Poli, G. (
Mahoney, J., le Roex, A. P., Peng, Z., Fisher, R. L. & Natland, J. H. (
Marty, B., Tolstikhin, I., Kamensky, I. L., Nivin, V., Balaganskaya, E. & Zimmermann, J. L. (
McDonough, W. F. (
McDonough, W. F. (
McKenzie, D. & O’Nions, R. K. (
McKenzie, D. & O’Nions, R. K. (
Nicholson, H. & Latin, D. (
Palacz, Z. A. & Saunders, A. D. (
Presley, T. K., Sinton, J. M. & Pringle, M. (
Reynolds, R. W. & Geist, D. J. (
Richardson, S. H., Erlank, A. J., Reid, D. L. & Duncan, A. R. (
Rudnick, R. L. & Fountain, D. M. (
Rudnick, R. L., Barth, M., Horn, I. & McDonough, W. F. (
Saal, A. E., Hart, S. R., Shimizu, N., Hauri, E. H. & Layne, G. D. (
Sasada, T., Hiyagon, H., Bell, K. & Ebihara, M. (
Slater, L., Jull, M., McKenzie, D. & Gronvöld, K. (
Späth, A., le Roex, A. & Duncan, R. A. (
Tejada, M. L. G., Mahoney, J. J., Duncan, R. A. & Hawkins, M. P. (
Thompson, G. & Humphris, S. E. (
Turner, S., Hawkesworth, C., Rogers, N. & King, P. (
van der Hilst, R. D. & Kárason, H. (
van der Hilst, R. D., Engdahl, E. R., Spakman, W. & Nolet, G. (
van Keken, P. E. & Ballentine, C. J. (
Veksler, I. V., Petibon, C., Jenner, G. A., Dorfman, A. M. & Dingwell, D. B. (
Vicenzi, E. P., McBirney, A. R., White, W. M. & Hamilton, M. (
Vlastelic, I., Dosso, L., Guillou, H., Bougault, H., Geli, L., Etoubleau, J. & Joron, J. L. (
Wagner, T. P., Clague, D. A., Hauri, E. H. & Grove, T. L. (
Weaver, B. L., Wood, D. A., Tarney, J. & Joron, J.-L. (
Widom, E., Carlson, R. W., Gill, J. B. & Schmicke, H.-U. (
Woodhead, J. (
Woodhead, J. D. (
Woodhead, J. D. & Devey, C. W. (
Woodhead, J. D. & McCulloch, M. T. (
Yang, H.-J., Frey, F. A., Weis, D., Giret, A., Pyle, D. & Michon, G. (
Zack, T., Foley, S. F. & Jenner, G. A. (
Zindler, A. & Hart, S. (
