- Full paper
- Open access
- Published:
Using ambient vibration measurements for risk assessment at an urban scale: from numerical proof of concept to Beirut case study (Lebanon)
Earth, Planets and Space volume 69, Article number: 60 (2017)
Abstract
Post-seismic investigations repeatedly indicate that structures having frequencies close to foundation soil frequencies exhibit significantly heavier damages (Caracas 1967; Mexico 1985; Pujili, Ecuador 1996; L’Aquila 2009). However, observations of modal frequencies of soils and buildings in a region or within a current seismic risk analysis are not fully considered together, even when past earthquakes have demonstrated that coinciding soil and building frequencies leads to greater damage. The present paper thus focuses on a comprehensive numerical analysis to investigate the effect of coincidence between site and building frequencies. A total of 887 realistic soil profiles are coupled with a set of 141 single-degree-of-freedom elastoplastic oscillators, and their combined (nonlinear) response is computed for both linear and nonlinear soil behaviors, for a large number (60) of synthetic input signals with various PGA levels and frequency contents. The associated damage is quantified on the basis of the maximum displacement as compared to both yield and ultimate post-elastic displacements, according to the RISK-UE project recommendations (Lagomarsino and Giovinazzi in Bull Earthq Eng 4(4):415–443, 2006), and compared with the damage obtained in the case of a similar building located on rock. The correlation between this soil/rock damage increment and a number of simplified mechanical and loading parameters is then analyzed using a neural network approach. The results emphasize the key role played by the building/soil frequency ratio even when both soil and building behave nonlinearly; other important parameters are the PGA level, the soil/rock velocity contrast and the building ductility. A numerical investigation based on simulation of ambient noise for the whole set of 887 profiles also indicates that the amplitude of H/V ratio may be considered as a satisfactory proxy for site amplification when applied to measurements at urban scale. A very easy implementation of this method, using ambient vibration measurements both at ground level and within buildings, is illustrated with an example application for the city of Beirut (Lebanon).

.
Background
It has been often observed that buildings suffer larger damage from earthquake shaking if their fundamental frequency is close to that of soil (Takewaki 1998; Guéguen et al. 1998; Hellel et al. 2010). However, these past lessons of soil and building spectral coincidence leading to greater damage are generally not taken directly into account, neither in present-day seismic regulations at small scale, nor in large-scale seismic risk analysis. Concerning the former, the characteristics of seismic loading are generally derived from the code, i.e., based on very crude site classification, without specific attention to site frequency and associated amplification. Recent findings by De Biasio et al. (2015) or Perrault and Guéguen (2015) have already concluded that the ground motion intensity offering the best correlation with damage in a nonlinear and realistic building model is the spectral ordinate around the fundamental building frequency. As to the large-scale risk estimates, there often exists a lack of consistency between seismic hazard studies which do take into consideration the actual soil frequencies and the large-scale vulnerability estimation and seismic risk maps which pay only poor attention to building frequencies. The latter generally follow a statistical approach because of the lack of detailed information about existing buildings. They use more traditional specifications such as structural typology, age of the building and maintenance level, together with empirical formulas relating damage to simple seismic loading parameters: A large part of the more detailed outcomes of local hazard analysis is therefore most often poorly accounted for. These empirical methods for vulnerability estimation are essentially based on the feedback from past earthquakes and a crude appraisal of structural characteristics from rapid visual inspections. The scope of this paper is therefore to contribute to the improvement of large-scale risk assessment methodology, with an attempt to account simultaneously for the dynamic characteristics of the buildings and of the soil (i.e., their natural frequencies) and to investigate whether it helps in better predicting the structural damage.
The main challenge is to propose and test damage assessment approaches that could combine the spectral contents of the ground motion and the dynamic behavior of the buildings, while being simple and robust enough to be applied at a large scale (typically urban scale). The challenge comes from the fact that the building and soil characteristics exhibit a very large spatial variability due to building heterogeneities (height, material, age, etc) and geological conditions, while the goal is to obtain reliable estimates for a whole urban area.
In that aim, we performed a comprehensive parameter study to investigate the seismic demand for a set of 141 SDOF elastoplastic oscillators with mechanical characteristics (frequency, elastic limit) representative of most common building typologies and height (Lagomarsino and Giovinazzi 2006), lying at the surface of a large set (887) of realistic soil profiles with linear behavior compiled from European, Japanese and Californian sources, for a series of 60 reference rock motions covering a wide range of magnitude, distance and PGA values. For each case, the simulated damage is quantified on a continuous scale between 0 (no damage) and 4 (collapse) according to the EMS98 intensity scale. Then, a “damage increment” is evaluated for the same oscillator resting on the soil profile compared to spatially uniform rock conditions. The extensive simulated database (over 7 million models in total) has been analyzed using an artificial neural network approach to correlate this rock-to-soil damage increment to several simple and macroscopic explanatory variables linked to soil behavior (PGA, fundamental frequency, velocity contrast) as well as building characteristics (frequency, ductility), without any a priori information on the functional form of such relationships (Dreyfus 2005). All this “conceptual framework” is shortly described in the first section.
The next two sections present two additional developments aiming at improving the field applicability of the approach and testing its robustness. The first one deals with the testing of a simple and easy-to-obtain parameter as a relevant proxy for site amplification in order to replace the velocity contrast considered in the first section. Therefore, we used the same simulation results and the same neural network approach, to investigate the performance of other site amplification proxies (such as H/V amplitude, V S30, V S10), which would be easily available and economically affordable. A good candidate for such a proxy is the “A 0HV” amplitude, i.e., the amplitude of the H/V ratio derived from microtremor recordings. The other development deals with the changes brought by the consideration of nonlinearity in site response, such as a shift to lower frequency and decrease in amplitude, as results of the first section correspond only to linear site response. New neural networks are built for the modified rock-to-soil damage increment resulting from the nonlinear site response, and the results are compared to the linear site response cases.
Finally, the ultimate step is to sense-check this approach on an example case: The expected damage in Beirut, Lebanon, in terms either of soil-to-rock damage increment or of absolute damage, is mapped for various reference rock PGA values on the basis of the available information, i.e., building inventory, microtremor measurements and H/V processing, and instrumentally derived relationships providing building frequency as a function of story number, typology and foundation soil.
Conceptual model, numerical simulations and typical results
Model parameters
Investigating the impact of the coincidence of frequencies between soil and structure involves the consideration of a structure placed on a multilayered soil profile, the whole system being loaded by a seismic signal corresponding to outcropping bedrock. The main model components are shortly described in the following:
-
1.
The seismic excitation consists of a series of 60 synthetic realistic accelerograms for different scenarios (magnitude between 3 and 7, distance between 5 and 100 km, PGA from 0.02 to 8.6 m/s2). They are obtained using the GMPE-like approach originally proposed by Sabetta and Pugliese (1996), which allows to obtain realistic time domain waveforms presenting both frequency and non-stationary characteristics representative of real accelerograms.
-
2.
A set of 887 multilayered soil profiles corresponding to real sites was considered in this work. It consists of 614 Japanese KiK-net sites, 251 sites from the USA made available by D. Boore (http://quake.usgs.gov/~boore) and 22 European sites measured during the NERIES project (Di Giulio et al. 2012). The KiK-net velocity profiles were directly collected at http://www.kyoshin.bosai.go.jp and consist of surface-to-downhole measurements of S and P wave velocities. Some of these profiles were modified as explained in Salameh (2016) in order to have a minimum velocity of 800 m/s in the underlying half-space, considered as seismic bedrock. The main characteristics of the resulting profiles are presented in Salameh (2016) and Almakari et al. (2016) (refer to “Appendix”): The profile database mainly consists of usual stiff soils, with shallow to intermediate thickness (smaller than 200 m in most cases, with only few sites—<6%—with fundamental frequency below 1 Hz), and “normally hard” to very hard underlying bedrock. V S30 is lower than 200 m/s for only 40 sites, while it exceeds 800 m/s for about 150 sites. Each soil profile is defined by its number of layers and their thickness, P and S wave velocity (V P, V S) and mass density. In the absence of any further information about the quality factors Q S and Q P, we assumed Q S = V S/10, with V s in m/s, and Q P = 2Qs (Aki and Richards 1980; Fukushima et al. 1995).
-
3.
One hundred and forty-one SDOF oscillators with an elastoplastic behavior and realistic properties (Fig. 1) were considered according to the outcomes of the Risk-UE European project. Lagomarsino and Giovinazzi (2006) compiled the main characteristics of the various Euro-Mediterranean building types such as fundamental periods, elastic yield displacement d y and ductility ratios d u/d y, where d u is the ultimate displacement. All these structures are classified into five main building classes aggregating different typologies: masonry (class 1), non-designed reinforced concrete (RC) (class 2), designed RC with low (class 3), medium (class 4) and high (class 5) ductility.
Fig. 1 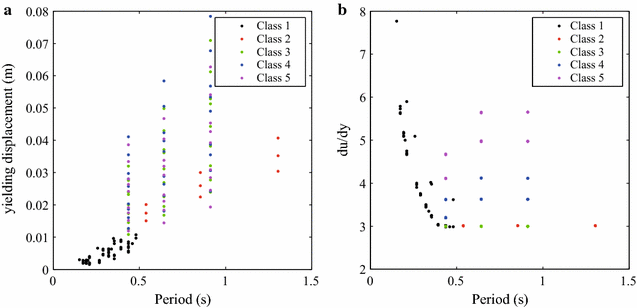
Distribution of the mechanical parameters of the 141 building structures as a function of their fundamental period (s): a yielding displacement d y (m); b ductility ratio d u/d y. The color code corresponds to five different typology classes [taken from Lagomarsino and Giovinazzi (2006)]

Numerical simulation and damage estimates
The computation of the building response is performed as follows: The linear site response is first computed for the 887 profiles and the 60 rock reference time series a R,i (t), with the reflectivity approach developed by Kennett (1983). The resulting surface signal time series a S,i (t) is then injected at the base of an elastoplastic oscillator without including soil structure interaction (SSI) phenomena. For this first methodological study indeed, we consider the frequency shift associated with SSI as too slight, in most cases, to significantly modify the results. The dynamic equation of motion controlling the relative displacement d of a damped elastoplastic oscillator having a 5% damping under a seismic excitation is solved and is given by (Eq. (1)):
where m, c and k are the mass, viscous damping and stiffness of the SDOF oscillator.
This equation is solved with a computation code written in Fortran language that proceeds using the step-by-step Newmark method, taking into account the yield limit that determines the elastoplastic behavior of the perfect elastoplastic oscillator.
Finally, the damage is quantified through a new damage index (DI), introduced to homogenize the results obtained for building typologies with very different elastic and ultimate displacement limits. This recently developed index is based on the EMS98 damage levels on a 0–4 scale according to the RISK-UE project (Lagomarsino and Giovinazzi 2006). Here, we consider a real number varying from 0 to 4 to describe the damage state on the basis of the comparison of the maximum structural displacement d max with various displacement thresholds derived from the capacity curve as shown in Fig. 2:

Definition of the damage index based on the damage state and displacements thresholds of Lagomarsino and Giovinazzi (2006). The black line is the capacity curve; the multi-colored piecewise linear line corresponds to the new defined damage index. d y is the yield displacement (m) and d u is the ultimate displacement (m). See text for further explanations
-
D0 (no damage): For d max < 0.7d y, DI = d max/(0.7dy); for this no damage state, DI ranges from 0 to 1.
-
D1 (slight damage): For 0.7d y < d max < 1.5d y, DI = 1 + (d max − 0.7d y)/(0.8d y); for the slight damage state, DI ranges from 1 to 2.
-
D2 (moderate damage): For d max between 1.5d y and 0.5(d y + d u), DI = 2 + (d max − 1.5d y)/[0.5(d y + d u) − 1.5d y]; for the moderate damage state, DI ranges from 2 to 3.
-
D3 (extensive damage): For d max between 0.5(d y + d u) and d u; DI = 3 + [d max − 0.5(d y + d u)] [d u − 0.5(d u − d y)], for the extensive damage state, DI ranges from 3 to 4.
-
D4 (collapse): For d max > d u, DI = 4 for complete collapse damage state.
The final step is to compute a “damage increment index” Δ(DI) corresponding to the damage index variation for an identical oscillator loaded by the site motion a S,i (t) and the corresponding rock motion a R,i (t): Δ(DI) = DI(soil) − DI(rock). This damage increment is thus estimated for a total of 7,504,020 combinations (887 soil profiles, 60 input signals, 141 oscillators), except for the cases where either DI (rock) or DI (soil) is equal to 4 (i.e., the maximum displacement of the considered oscillator exceeds d u), which were discarded in order not to introduce any “saturation” effect with the DI upper limit of 4. On the other extreme, the “no damage” state D0 was assigned a nonzero value from 0 to 1 to keep track of the consequence of site effects even within the undamaged elastic domain of building behavior. This elimination left a total number of 6,501,701 combinations, i.e., a reduction of 13.4%. This proportion is relatively stable for all building classes, except for class 1—masonry—for which it reaches 29%, as it is the most vulnerable class.
Analysis of results: neural network approach
The statistical analysis of this huge set of results has been performed using a neural network approach. The goal is to investigate, without any a priori indication on the actual functional forms, the dependency of the output (i.e., the soil-to-rock damage increment Δ(DI)) on a limited number of input parameters representing the structural and site characteristics, together with the loading intensity. The selected inputs are the outcropping rock PGA as a proxy to seismic loading intensity, the shear velocity contrast (C = V smax/V smin, with V smax and V smin being the largest and lowest velocity values in the soil column) as a proxy for site amplification, and the ratio between soil and structure frequencies as an indicator of the spectral coincidence. A fourth input could have been the ductility ratio, but it was considered preferable to group the oscillators by typology class (1–5) and to construct one neural network for each of the five building classes. A simple architecture (Fig. 3) with three to four input variables, one hidden layer and one output (the damage increment index) was chosen for the neural network, and its internal characteristics (number of hidden neurons, training algorithm and activation functions) were optimized by a thorough sensitivity study quantifying the performance of the network by the standard deviation of residuals between predicted and “real” outputs. This performance was systematically analyzed on three randomly generated subsets (training, validation and test sets), with an early stopping criterion. Indeed, once the training converges after a series of iterative computations that minimize errors, the results are considered as reliable and can be further analyzed.

Architecture of the neural network selected for each of the five typology classes: Inputs are the structure-to-soil frequency ratio, the velocity contrast and the PGA; the output is the damage increment index between rock and soil
The outcomes of such an approach may be analyzed in different ways.
First, a very useful indication about the overall performance of the neural network in explaining the damage increment results is provided by the standard deviation of the output residuals (RMSE) and the amount of reduction with respect to the raw set of damage increment values. Such a reduction was found to be in the range 30–50%, as indicated in Table 1 (model 1 for class 3 building). This might be considered as relatively small when considering the number of input parameters, which has been deliberately chosen as being very small to enable an easy use in routine situations. Another useful indication is the coefficient of determination R 2 between the original damage increment results DI and those predicted with the neural network. The corresponding values listed in Table 1 for class 3 typologies, typical of the 4 other classes, are around 0.80, which indicates that the predictions are well correlated with the results of direct numerical simulation.
Another very useful indicator is provided by the “synaptic weights,” which characterize the respective impact of each of the three considered inputs on the damage increment output. They are estimated for each input parameter i (i = 1, 3) as follows (Eq. 2):
where N h is the number of hidden neurons, and W h ij are the identified weights of each neuron between the input layer (index i) and the hidden layer (index j).
Figure 4 (and Table 1 for class 3 buildings) shows that the most important input is the structure-to-soil frequency ratio (~45%) whatever the considered building class: This confirms the relevancy of this parameter for predicting the damage increase due to site conditions. One may notice, however, that the second largest parameter is the PGA (~30%), i.e., the excitation level, and the last parameter having the lowest synaptic weight percentage is the velocity contrast (~20%).

Percentage of synaptic weights of the three inputs in the neural network approach (model 1): f struct/f soil, velocity contrast and PGA for the five typology classes as defined by Lagomarsino and Giovinazzi (2006)
Using the final weights and biases and replacing them in the activation functions, we can compute the output (damage increment between rock and soil conditions) as a function of each of the considered input variables, with the following relationship:
where (W 1 , W 2 ) and (b 1 , b 2 ) are the matrices of weights and bias in the hidden and output layers, respectively, and φ 1 and φ 2 are the optimal activation functions, which were found to be the tangent sigmoid functions and the linear one for the output and hidden layers, respectively. The coefficients of the matrices of weights and biases are detailed in appendix of Salameh (2016). I n and T n are the normalized input and output values, i.e., with respect to the minimum and maximum values of each “physical” input and output parameters, so as to get normalized values between −1 and +1. More details can be found in Salameh (2016) about the selection and optimization of neural networks.
An example of the corresponding damage predictions is displayed in Fig. 5 which exhibits the variation of the rock-to-soil damage increment for only the class 3 (RC, low ductility) as a function of the “leading parameter,” i.e., the structure-to-soil frequency ratio (f struct/f soil) and the velocity contrast for different values of PGA, from weak (0.05 m/s2) to strong motion (4 m/s2). The bottom curves detail the dependency of Δ(DI) on f struct/f soil for four specific velocity contrast values: C = 2, 5, 10 and 20.

Variation of the class 3 (RC, low ductility) rock-to-soil damage increment as a function of the structure and soil frequency ratio f struct/f soil, and the velocity contrast C, for four different values of PGA (from weak on the left to strong on the right). The color code on the top frames corresponds to the Δ(DI), while the bottom curves correspond to Δ(DI) as a function of f struct/f soil for four values of c indicated by horizontal dashed white lines in top frames
These results—which are typical of what is obtained also for other building classes—emphasize the major impact of the spectral coincidence between soil and building natural frequencies. The synaptic weight around 50% for the frequency ratio f struct/f soil is associated with a marked peak of the damage increment around f struct/f soil = 1, with values exceeding 2 for moderate to strong motion and large velocity contrast, i.e., large site amplification. Such a conceptually simple model thus allows to quantify what had been repeatedly observed in post-seismic investigations: Having a fundamental frequency close to that of soil leads to increased damage. Conversely, if the building frequency is lower than the soil frequency, the building does not “feel” the effect of the site resonance, and the damage level is comparable on soil and rock: This was observed for instance in Mexico City in 1985 for very high-rise buildings with frequencies much below 0.5 Hz. This result might, however, be modified for multi-degree-of-freedom oscillators if some overtone is coinciding with site frequency. A second observation is related to the impact of velocity contrast: The stronger the site amplification, the larger the damage increment Δ(DI). It is finally worth noticing the damage increment is found to be rather low for low PGA levels, then to increase significantly for moderate PGA levels (~0.2–0.4 g) and then to saturate or even decrease for very large PGA levels. This is related to: (1) the nonlinear behavior in the structure activated only beyond some threshold pga value, (2) the definition of the damage index, with very low values as long as the structure remains elastic and (3) the significant damage on rock for very strong motion.
Field applicability: testing H / V amplitude as a site amplification proxy
One of the “physical” input parameters used in the previous section is the velocity contrast within the soil, i.e., the contrast between the stiffest layer (the underlying bedrock) and the softest one (generally the surface layer). This parameter is a natural, physical proxy for the site amplification (considering also that density contrast plays only a marginal role in site amplification compared to velocity contrast). However, measuring it on a real site is not so easy, as it requires the use of geotechnical and/or geophysical techniques such as in-hole seismics (downhole, cross-hole or suspension logging) to retrieve the shear wave velocity profile until reaching the “seismic” bedrock, i.e., the deepest geological unit that controls the fundamental frequency. Such techniques are not easy to implement at a large urban scale because of their invasive nature, environmental impact, and high cost (especially for deep bedrock). The motivation here is therefore to try to find a suitable alternative for this velocity contrast parameter that could be determined much more easily with less invasive, more practical and simple methods. As one of the other input parameters, the soil frequency, is easy to obtain from ambient vibration measurements and H/V processing (Nakamura 1989), we decided to test also the use of the H/V peak amplitude (A 0HV) as a proxy for site amplification. Even though it has been repeatedly reported that A 0HV parameter cannot be considered as a reliable estimate of the site amplification A S, there are many consistent instrumental indications that A 0HV could be a lower bound estimate of A S (Haghshenas et al. 2008). Numerical modeling has also outlined that larger the impedance contrast is, larger is the H/V amplitude (Albarello and Lunedei 2011). As microtremor measurements are not available for the 887 sites we considered, we tested this tentative proxy by generating noise synthetics for each of these 887 multilayered soil structures, using the SESAME approach (Bonnefoy-Claudet et al. 2006) and the Hisada discrete wave-number simulation code (HDWN, Hisada 1995). In short, this approach consists in assuming that microtremors are due to sources randomly located in time and space at the surface of a horizontally layered medium: These sources are point forces with random orientation and random time occurrence. The Green’s functions for each surface source are computed with HDWN and are then convolved with a delta-like source time function and stacked to obtain noise synthetics. More details (source-to-receiver distances, number of sources, duration, etc.) may be found in Bonnefoy-Claudet et al. (2006) and Salameh (2016). The fundamental frequency (f0HV) and the corresponding amplitude (A 0HV) are then extracted from the H/V curves computed with the Geopsy software (www.geopsy.org; Wathelet et al. 2008). One example is displayed in Fig. 6 for one particular soil profile.

Example of seismic noise simulation results for a soil profile (ABSH02 from KIK-net database): a shear wave velocity profile of the soil, b S wave transfer function using transmission/reflection method, c example noise synthetics along the 3 components (East, North, Vertical), d H/V curve from synthetic noise
The actual values of the fundamental frequencies (f 0t) and the corresponding amplifications (A 0t), as identified on the transfer functions computed for vertically incident plane S waves, are compared to the f 0HV and A 0HV values extracted from the noise synthetics in Fig. 7. The f 0t and f 0HV values exhibit an excellent 1:1 correlation (Fig. 7a), confirming that the f 0HV value is a reliable estimate of the site fundamental frequency.

Statistics of comparison between fundamental frequency f 0T and amplification A 0T derived from 1D SH transfer functions, and estimated values derived from H/V processing of noise synthetics (f 0HV and A 0HV). a Frequencies with coefficient of determination R 2 = 0.94; b amplitudes with R 2 = 0.70. The solid blue lines correspond to f 0HV = f 0t and A 0HV = A 0t
On the other hand, the comparison of amplitude extracted from the transfer functions A 0t and the A 0HV extracted from H/V curve derived from noise synthetics (Fig. 7b) exhibits a much larger scatter around the line A 0t = A 0HV; however, the two values are definitely correlated in a statistical sense with R 2 = 0.7. As noticed in Bonnefoy-Claudet et al. (2008), A 0HV are larger than A 0HV which is due to the choice of pure random orientation of excitation forces at the surface.
We then constructed a new neural network similar to those developed in the previous section, replacing, however, the velocity contrast, V max/V min, with the H/V amplitude, A 0HV. The performance of the neural network is similar to those obtained in the previous section, as summarized in Table 1 (model 2): The variance reduction is even slightly larger (around 45%), as well as the coefficient of determination between predictions and original simulation results (0.86). In addition, the synaptic weights are comparable, and so are also the predicted dependencies of the damage increment as a function of the three input parameters. In particular, damage increment increases with increasing A 0HV amplitude and increasing PGA (Fig. 8). The largest predicted damage increment is, however, slightly smaller for strong motion and large A 0HV amplitude; further investigations are needed to understand the actual origin of these slight differences, whether it comes from limitations in the generation of noise synthetics or in the use of A 0HV instead of velocity contrast.

Variation of the class 3 (RC, low ductility) rock-to-soil damage increment as a function of the structure and soil frequency ratio f struct/f soil, and the H/V amplitude, for four different values of PGA (from weak on the left to strong on the right). The color code on the top frames corresponds to the Δ(DI), while the bottom curves correspond to Δ(DI) as a function of f struct/f soil for four values of A 0HV indicated by horizontal dashed white lines in top frames
A few other usual site proxies were also tested in Salameh (2016): V S30 and V S10 which exhibit a comparable performance, though slightly lower than A 0HV. We therefore conclude from this comprehensive numerical investigation that the simplicity, low cost and short duration of H/V measurements contribute in making A 0HV a satisfactory site amplification proxy with a remarkable quality/cost ratio.
Robustness study: impact of soil nonlinearity
The concept of spectral coincidence implicitly assumes some kind of quasi-linear behavior, with limited changes in natural frequencies of soil and/or structure. The results of the two previous sections, involving elastoplastic oscillators with variable ductility ratio, indicate that this concept is robust enough to withstand strong nonlinearity in the structure. The scope of this section is to investigate whether the nonlinearity in the site response can significantly weaken the dominant importance of spectral coincidence effects, as it may significantly change the site frequency and the associated amplification. The soil nonlinear behavior is most often characterized by a degradation of its mechanical properties, involving a shear modulus reduction and a damping increase with increasing shear strain; it basically results in deamplifying the ground motion and shifting the frequency response toward lower values (Bonilla et al. 2005; Régnier et al. 2013, 2016).
The realistic soil profiles adopted previously are thus modeled using nonlinear site response analysis, and the response analysis of the comprehensive set of SDOF oscillators is repeated here for the modified loading including the effects of soil nonlinearity. We used the code “NOAH” (NOnlinear Anelastic Hysteretic method, Bonilla 2001): This finite difference code propagates vertically incident plane SH ground motion in a soil deposit, by integrating the dynamic equation of motion at each time step. This method is more appropriate than the equivalent linear approach, especially for severe shaking with large strains.
Nonlinear material properties are actually unknown in the original site database, which contains only the “elastic” parameters. It is therefore needed to assign to each layer of each profile some realistic values for the nonlinear parameters (the shear degradation modulus and the damping). Depending on the code, they may be specified either through shear strength profile, or through degradation curves, describing the dependency of G/G max and damping as a function of shear strain for each layer. For instance, the latter are required for most linear equivalent software like SHAKE, while the former is required by the NOAH code used in this study, through cohesion and friction angle profiles. We thus had to associate a friction angle and a cohesion to each layer for the NOAH input files: This was done using specific “rules” applied to the shear wave velocity profiles. We simply followed the approach used by PEER (“Pacific Earthquake Engineering Research Center”) for the incorporation of a NL term in the recent revision of Ground Motion Prediction Equation for Western United States (NGAW2 project, Kamai et al. 2014): They used two sets of generic, depth-dependent NL degradation curves depending on the soil cohesion: The “EPRI” curves are assigned to cohesionless soils, while “IV” (Imperial Valley) curves are assigned to cohesive soils. Following the PEER approach, all soil profiles having a V S30 value lower than 190 m/s were considered as cohesive (“IV”), while sites with V S30 higher than 190 m/s were considered as cohesionless, in both cases from the surface down to the bedrock. This assignment procedure is very arbitrary, and we think, however, it provides a first set of results on the impact of soil nonlinearity, that is worth being analyzed in a statistical sense. More details on these NL site response computations and their main results can be found in Almakari et al. (2016).
Then, the artificial neural network approach was used again with the same procedure as in the previous sections, to correlate the new damage increment values taking into account the nonlinear site response with the same three input parameters: ratio of structural and soil (linear) frequencies f struct/f soil, reference rock PGA and velocity contrast C = V max/V min. The whole set of new results is discussed in more detail in Salameh (2016); we will focus here only on one example comparison, for RC buildings with low ductility (class 3).
The last column of Table 1 (model 3) lists the performance indicators and the synaptic weights for this last model: It is worth noticing that the standard deviation reduction (40%) is comparable and even slightly larger than in the linear site response case, while the dominant synaptic weight still remains associated with the frequency ratio f struct/f soil: Even for nonlinear site and building response, the values of linear elastic frequencies are a key parameter for the damage assessment. Another remarkable result is the slight increase in the synaptic weight of PGA, associated with a slight decrease of the velocity contrast synaptic weight, which are both consistent and related to the nonlinear site response, which lowers the amplification at high PGA, especially for soft soils with low velocities (and high velocity contrast).
Figure 9 compares the variation of the predicted damage increment as a function of the structure-to-soil frequency ratio for one velocity contrast value (C = 10) and four different values of rock PGA, in both linear (blue) and nonlinear (red) site response cases. Besides the similarity of overall curves, one can notice two significant changes: (a) the slight shift in the location of the peak, from f struct/f soil = 1 in the linear site response case to f struct/f soil around 0.6–0.7 in the NL site response case for moderate to strong PGA values (2 and 4 m/s2), and (b) the decrease of rock-to-soil damage increment at the peak value and in the high-frequency range (f struct/f soil > 1). Both observations are consistent with the NL site response, which shifts the soil frequencies to lower values, and reduce the high-frequency amplification (Régnier et al. 2013, 2016; Almakari et al. 2016).

Comparison of the variation of predicted rock-to-soil damage increment for class 3 buildings as a function of the structure-to-soil frequency ratio in the linear (blue) and nonlinear (red) cases, for four values of PGA and considering a velocity contrast c = 10
The nonlinear site response thus impacts the rock-to-soil damage increment: The displacement at the top of an elastoplastic oscillator is lower when considering a nonlinear behavior for the soil compared to the linear case, especially when the oscillator frequency is larger than the site frequency. The higher the level of nonlinearity in the site response (i.e., the larger the strains in the soil), the larger is the reduction of the oscillator displacement. Spectral coincidence is found to still have a dominant role, but in a more complicated way. Soil–structure resonance can take place when the new shifted site frequency coincides with the structural frequency: The “spectral coincidence” effect is thus shifted toward f struct/f soil values lower than 1.
Application to Beirut
Lebanon is a small Middle East country crossed by the 1200-km-long Levant Fault System (LFS). In Lebanon, the LFS splits into three main branches, on land and offshore: the left lateral strike-slip Yammouneh Fault (last known rupture: 1202, M7.5), the Beirut–Tripoli Thrust (551, M7+) and the Rachaya–Serghaya Fault (1759, M6.5). The 551 event was accompanied by a tsunami hitting the whole eastern Mediterranean coast, destroying several cities including Beirut, Tripoli, Saida and Tyre. The most recent large earthquake is the double shock of March 16, 1956 (Ms = 4.8–5.1) which killed 136 people, destroyed 6000 houses and damaged 17,000 houses (Brazee and Cloud 1984; Khair et al. 2000). Seismological trenches have shown that the return period of devastating earthquakes is about 1100 years along the Yammouneh Fault (Daëron et al. 2007), 1500–1750 years along the Mount Lebanon Thrust (Elias et al. 2007) and ~1300 years along Serghaya Faults (Gomez et al. 2003).
The objective is to map the rock-to-soil damage increment for the Beirut City area, for several ground-shaking scenarios (from weak to very strong) that could help to establish priorities within the framework of an improved seismic prevention policy. The basic tool is the neural network approach developed in the previous sections, especially the second one based on the structure-to-soil frequency ratio, PGA level and H/V amplitude. In that aim, the required information is an inventory of buildings with their typology and frequencies, together with the measurement of the soil frequencies and of the corresponding A 0HV amplitudes.
For this purpose, 7362 buildings located in downtown Beirut were surveyed by Saint Joseph University (USJ) staff within the framework of the LIBRIS ANR project, gathering information on the age of construction, number of floors and position of each building. In addition, the same project allowed performing ambient vibration measurements in a set of 330 buildings, to establish reliable relationships between building frequency and number of floors (Salameh et al. 2016), highlighting a slight difference between rock and soil. A frequency could then be estimated for each of the so-surveyed 7692 buildings, together with their typology class defined from their age as follows: (1) Buildings constructed before 1950 with a number of floors <4 are considered as masonry (i.e., class 1), (2) buildings constructed between 1950 and 2005 (introduction of the Lebanese seismic code) are considered as non-designed RC (i.e., class 2), and (3) those constructed after 2005 are considered as designed RC with low ductility class (i.e., class 3).
Regarding site information, a total of 827 sites were measured for the Beirut City area (Brax 2013; Salloum et al. 2014; Salameh et al. 2016) to obtain the soil resonance frequency map of Beirut using HVSR (horizontal to vertical spectral ratio) approach (Nakamura 1989). The large density of measurements allowed to derive interpolated maps of both soil frequency and A 0HV amplitude, which could in turn be used to estimate the f struct/f soil and A 0HV values for each of the 7692 buildings.
Damage increment maps could then be constructed using natural interpolation with a grid step of 100 m. Figure 10 shows the interpolated map of the damage increment computed with the neural network models derived from Model 2 (Table 1) for an earthquake scenario with an outcropping rock PGA of 0.25 g, which corresponds to the 2012 Lebanese seismic regulations. Various conclusions can be inferred from such damage increment maps:

Interpolated map of the damage increment computed for 7692 buildings in Beirut with the neural network approach (model no. 2) for a rock PGA of 0.25 g, using a 100-m resolution. Mapping uses the Universal Transverse Mercator (UTM) coordinate system (Zone: 36). The blue line corresponds to the River of Beirut. The color code explained on the right corresponds to the damage increment. Only areas with data for both the soil and the building stock are considered (white zones correspond to areas with missing information—mainly building information)
-
(a)
The presence of different geological settings in Beirut with a higher seismic risk is witnessed by the existence of red areas with damage increment between 1 and 2 damage grades. This is the case especially for Badaro, Bourj Hammoud and the Nahr-Beirut river areas in the eastern and southern parts: These areas correspond to younger and thicker quaternary sediments with low resonance frequencies and higher H/V amplitude (Brax 2013; Cornou et al. 2014). These three areas correspond to deposits of the river of Beirut, with moderate to large amplification at frequencies between 1 and 4 Hz often corresponding to the frequencies of the medium- to high-rise buildings located in those areas.
-
(b)
The blue zones with negligible damage increment correspond to two rocky geological formation, rather than areas where building frequencies would be systematically lower than soil frequencies.
Besides the damage increment, it is also interesting to estimate and map the absolute damage on the actual soil conditions throughout Beirut to identify, in addition to the location of the most severely damaged areas, the corresponding damage level that will be a key parameter for estimating post-earthquake losses and designing mitigation policies. Therefore, we developed another series of neural networks correlating the absolute damage for a given (site, building) pair as a function of the structure-to-soil frequency ratio, the A 0HV amplitude and PGA for building classes 1–3. The output (damage level) is the damage index DI (soil) described previously corresponding to the EMS98 damage grades, which is color-coded as follows in Fig. 10:
-
0 < DI < 1: no damage (blue)
-
1 < DI < 2: slight (green)
-
2 < DI < 3: moderate (yellow)
-
3 < DI < 4: extensive (orange)
Note also that, as mentioned in the first section, we do not consider buildings collapsing in the distribution of damage.
Histograms in Fig. 11 display the distribution of damage grades, from no damage to extensive, for all the 7692 buildings surveyed in Beirut, for various loading levels described by a rock PGA increasing from 0.05 to 0.5 g as recent hazard studies suggest a significantly higher level than presently considered in the Lebanese code (e.g., Danciu and Giardini 2015; Huijer et al. 2016). As PGA increases, the percentage of undamaged buildings decreases from 100 to 38% for PGA = 0.25 g and 5% for PGA = 0.3 g. Slight damage appears for PGA = 0.1 g, moderate damage at PGA = 0.2 g and extensive damage for PGA = 0.25 g. For PGA larger than 0.35 g, the whole building stock is at least slightly damaged. The proportion of “moderately damaged” buildings increases steadily from 35% at 0.3 g to about 60% at 0.5 g, while the proportion of extensively damaged buildings increases from 2% at 0.25 g to 20% at 0.5 g. One can therefore expect that a repetition of the historical earthquakes on the Mount Lebanon thrust (551 AD, M7+) or on the Yammouneh fault (1202, M7.5) generating rock PGA in this range would cause major death toll and economic losses.

Histograms depicting the predicted distribution of damage grades, from no damage (blue) to extensive (orange), among the whole set of buildings surveyed in Beirut, as a function of the rock PGA loading level (0.05–0.5 g)
Conclusions
The work presented here was an attempt to test with conceptually simple models the damaging impact of spectral coincidence between structure and site, and to use comprehensive numerical simulation to propose easy-to-use tools to estimate damage increment due to site conditions at an urban scale, including an example application (here for the city of Beirut, Lebanon).
The impact of spectral coincidence, which seems obvious in case of tuned resonance of linear systems (soil and building), could be, however, considerably modified and attenuated in case of strong nonlinearities either in the soil or in the building. One must nevertheless mention recent trends in building-specific vulnerability estimations that take into account the spectral content of the input motion around the building fundamental frequency (De Biasio et al. 2015; Perrault and Guéguen 2015). The present work goes one step further along the same direction in considering also nonlinearities in the site response, but with a different approach as (a) it focuses on the damage differences between identical buildings located on a given site and on the reference rock, instead of considering only the “absolute” damage level, and (b) it considers multiple explanatory variables, mixing the rock loading level, site conditions and building characteristics through the peak ground acceleration on standard rock, a site amplification proxy and the ratio of elastic frequencies of building and soil, f struct/f soil. It is found that even in the case of soil or building nonlinearities, the elastic frequency ratio f struct/f soil has the predominant role in controlling the rock-to-soil damage increment, ahead of the loading level summarized by the rock PGA and the site amplification proxy.
The comprehensive set of numerical simulations analyzed with a neural network approach led to relatively easy-to-use mathematical relationships (even though without any “physical” functional form) that were applied to the case of Beirut city (Lebanon). The soil and building frequencies are derived from ambient vibration measurements, which are numerous enough to map f 0soil over the whole downtown area of Beirut and to derive f 0struct simply from the number of floors and the nature of the foundation site (rock of soil). In addition, the use of the amplitude of the H/V ratio as a site amplification proxy is shown—on a numerical basis—to provide as reliable damage estimates as a series of more “physical” proxies as the velocity contrast, which is in practice very expensive and difficult to obtain at a whole city scale. It was therefore possible to map the expected rock-to-soil damage increment for different shaking scenarios characterized by a rock PGA from 0.05 to 0.5 g, and also to map the estimated absolute damage level with a similar neural network approach and for the same shaking scenario. The proposed method proves to be easy to use for damage assessment at urban scale: It requires the usual type of information gathered for risk assessment, i.e., a seismic microzonation (here based only on dense microtremor measurements and H/V processing), a building inventory (here based primarily on construction date and height) and reliable estimates of building elastic frequencies (here based on specific relationships for the local building stock derived from a large number—several hundred—of ambient vibration measurements on building top floor).
We thus consider this attempt was successful in demonstrating the relevancy and the feasibility of the approach, which allows in some way to benefit from the advantages of the “mechanical” approach typically used for the design of specific buildings, at an urban scale where usually only empirical, macroseismic methods based on semi-qualitative/semiquantitative information are used. However, this is only a first attempt, which would deserve many further checks and developments. While it is likely that refinements in the site or building response models would not basically change the key features of the results from a qualitative viewpoint, it might significantly change the quantitative relationships describing damage increment or absolute damage as a function of explanatory variables, which would in turn impact the applications to practical cases. Among the possible or needed improvements, some deal with the site response, in particular with more realistic NL site parameters (as shown in Almakari et al. (2016), it is likely that the very arbitrary model used here overestimates NL behavior for deep deposits and underestimates it for shallow deposits), and may be also with more region-specific input waveforms (a sensitivity study showed, however, that the overall results are not changed statistically speaking with replacing the set of synthetic time histories by a set of real accelerograms). Some other deal with the building response, especially with the consideration of multi-degree-of-freedom oscillators, especially for high-rise, intermediate to long-period buildings, and the incorporation of more elaborated nonlinear behavior, which would better reproduce the loading and unloading phases for reinforced concrete or masonry buildings than a simple elastoplastic oscillator. It is worth mentioning that a sensitivity study with multi-degree-of-freedom (MDOF) elastoplastic oscillators (Neziri 2016) indicated some significant changes corresponding to coincidence between soil fundamental frequency and building overtones, mainly at low PGA levels (linear response), and smaller changes at higher PGA because of the lesser importance of higher modes in case of larger drifts and larger damping.
Finally, it would be worth also exploring the performance of other sets of explanatory variables (for instance, the actual site amplification A0T, or some other ground motion intensity measures like PGV instead of the too crude PGA parameter) in order to further reduce the standard deviation of residuals and identify the best input parameters: Our bias here was to deliberately consider only a very small number of simple, easy-to-obtain parameters.
In any case, the best test for such an approach would be to check its results for cities with significant site amplification having already been hit by damaging earthquakes, and where effects of such spectral coincidence could be checked on actually observed damage (e.g., Mexico City 1985; Kathmandu, Nepal 2015; Puerto Viejo and other coastal cities, Ecuador 2016).
References
Aki K, Richards PG (1980) Quantitative seismology: theory and methods, vol 1. Freeman, San Francisco
Albarello D, Lunedei E (2011) Structure of an ambient vibration wavefield in the frequency range of engineering interest ([0.5, 20] Hz): insights from numerical modelling. Near Surf Geophys 9(6):543–559
Almakari M, Régnier J, Salameh C, Cadet H, Bard PY, Lopez-Caballero F, Cornou C (2016) Modulation of weak motion site transfer functions by non-linear behavior: a statistical comparison of 1d numerical simulation with KiKnet data. In: 5th IASPEI/IAEE international symposium: effects of surface geology on seismic motion, Taipei, 15–17 August 2016
Bonilla LF (2001) NOAH: users manual. Institute for Crustal Studies, University of California, Santa Barbara
Bonilla LF, Archuleta R, Lavallée D (2005) Hysteretic and dilatant behavior of cohesionless soils and their effects on nonlinear site response: field data observations and modeling. Bull Seismol Soc Am 95(6):2373–2395
Bonnefoy-Claudet S, Cornou C, Bard PY, Cotton F, Moczo P, Kristek J (2006) H/V ratio: a tool for site effects evaluation. Results from 1-D noise simulations. Geophys J Int 167(2):827–837
Bonnefoy-Claudet S, Köhler A, Cornou C, Wathelet M, Bard PY (2008) Effects of Love waves on microtremor H/V ratio. Bull Seismol Soc Am 98(1):288–300
Brax M (2013) Aléa et microzonage sismiques à Beyrouth/Seismic hazard and micrzonation in Beirut. Ph.D. thesis, Université Joseph Fourier I, Grenoble, France, 279 pp (in English)
Brazee RJ, Cloud WK (1984) United States earthquakes, 1957. No. 84-957. US Geological Survey, Reston
Cornou C, Brax M, Salloum N, Rahhal ME, Harakeh F, Harb J (2014) Shear-wave velocity structure and correlation with n-spt values in different geological formations in Beirut, Lebanon. In: Second european conference on earthquake engineering and seismology, August 24–29, Istanbul
Daëron M, Klinger Y, Tapponnier Y, Elias A, Jacques E, Sursock A (2007) 12,000-year-long record of 10–13 paleoearthquakes on the Yammouneh fault, Levant fault system, Lebanon. Bull Seismol Soc Am 97(3):749–771
Danciu L, Giardini D (2015) Global Seismic Hazard Assessment Program-GSHAP legacy. Ann Geophys 58(1):S0109. doi:10.4401/ag-6734
De Biasio M, Grange S, Dufour F, Allain F, Peter-Lazar I (2015) Intensity measures for probabilistic assessment of non-structural components acceleration demand. Earthq Eng Struct Dyn 44(13):2261–2280
Di Giulio G, Savvaidis A, Ohrnberger M, Wathelet M, Cornou C, Knapmeyer-Endrun B (2012) Exploring the model space and ranking a best class of models in surface-wave dispersion inversion: application at European strong-motion sites. Geophysics 77(3):B147–B166
Dreyfus G (2005) Neural networks: methodology and applications. Springer Science & Business Media, Berlin
Elias A, Tapponnier P, Singh SC, King GC, Briais A, Daëron M (2007) Active thrusting offshore Mount Lebanon: source of the tsunamigenic AD 551 Beirut-Tripoli earthquake. Geology 35(8):755–758
Fukushima Y, Gariel JC, Tanaka R (1995) Site-dependent attenuation relations of seismic motion parameters at depth using borehole data. Bull Seismol Soc Am 85(6):1790–1804
Gomez F, Meghraoui M, Darkal AN, Hijazi F, Mouty M, Suleiman Y (2003) Holocene faulting and earthquake recurrence along the Serghaya branch of the Dead Sea fault system in Syria and Lebanon. Geophys J Int 153(3):658–674
Guéguen P, Chatelain JL, Guillier B, Yepes H, Egred J (1998) Site effect and damage distribution in Pujili (Ecuador) after the 28 March 1996 earthquake. Soil Dyn Earthq Eng 17(5):329–334
Haghshenas E, Bard PY, Theodulidis N, SESAME WP04 Team (2008) Empirical evaluation of microtremor H/V spectral ratio. Bull Earthq Eng 6(1):75–108
Hellel M, Chatelain JL, Guillier B, Machane D, Salem RB, Oubaiche EH, Haddoum H (2010) Heavier damages without site effects and site effects with lighter damages: Boumerdes City (Algeria) after the May 2003 earthquake. Seismol Res Lett 81(1):37–43
Hisada Y (1995) An efficient method for computing Green’s functions for a layered half-space with sources and receivers at close depths (Part 2). Bull Seismol Soc Am 85(4):1080–1093
Huijer C, Harajli M, Sadek S (2016) Re-evaluation and updating of the seismic hazard of Lebanon. J Seismol 20(1):233–250
Kamai R, Abrahamson NA, Silva WJ (2014) Nonlinear horizontal site amplification for constraining the NGA-West 2 GMPEs. Earthq Spectra 30:1223–1240
Kennett B (1983) Seismic wave propagation in stratified media. Cambridge University Press, Cambridge
Khair K, Karakaisis G, Papadimitriou E (2000) Seismic zonation of the dead Sea transform fault area. Ann Geophys 43(1). doi:10.4401/ag-3620
Lagomarsino S, Giovinazzi S (2006) Macroseismic and mechanical models for the vulnerability and damage assessment of current buildings. Bull Earthq Eng 4(4):415–443
Nakamura Y (1989) A method for dynamic characteristics estimation of subsurface using microtremor on the ground surface. Q Rep Railw Tech Res Inst 30(1):1–14
Neziri Z (2016) Soil-structure spectral coincidence for Multi-Degree of Freedom, elasto-plastic buildings: a numerical study. Master Thesis (MEEES, Master in Earthquake Engineering and Engineering Seismology), University of Grenoble-Alpes, June 2016, 39 pp
Perrault M, Guéguen P (2015) Correlation between ground motion and building response using California earthquake records. Earthq Spectra 31(4):2027–2046
Régnier J, Cadet H, Bonilla LF, Bertrand E, Semblat JF (2013) Assessing nonlinear behavior of soils in seismic site response: statistical analysis on KiK-net strong motion data. Bull Seismol Soc Am 103(3):1750–1770
Régnier J, Cadet H, Bard PY (2016) Empirical quantification of the impact of non-linear soil behavior on site response. Bull Seismol Soc Am 106(4):1710–1719. doi:10.1785/0120150199
Sabetta F, Pugliese A (1996) Estimation of response spectra and simulation of nonstationary earthquake ground motions. Bull Seismol Soc Am 86(2):337–352
Salameh C (2016) Ambient vibrations, spectral contents and seismic damage: a new approach adapted to urban scale. Application to Beirut (Lebanon). Ph.D. thesis, University Grenoble-Alpes, France, defended on June 21, 2016 (284 pp, in English). http://www.theses.fr/2016GREAU008. Accessed 7 April 2017
Salameh C, Guillier B, Harb J, Cornou C, Bard PY, Voisin C, Mariscal A (2016) Seismic response of Beirut (Lebanon) buildings: instrumental results from ambient vibrations. Bull Earthq Eng 14(10):2705–2730. doi:10.1007/s10518-016-9920-9
Salloum N, Jongmans D, Cornou C, Abdelmassih DY, Chehade FH, Voisin C, Mariscal A (2014) The shear wave velocity structure of the heterogeneous alluvial plain of Beirut (Lebanon): combined analysis of geophysical and geotechnical data. Geophys J Int 199(2):894–913
Takewaki I (1998) Remarkable response amplification of building frames due to resonance with the surface ground. Soil Dyn Earthq Eng 17(4):211–218
Wathelet M, Jongmans D, Ohrnberger M, Bonnefoy-Claudet S (2008) Array performances for ambient vibrations on a shallow structure and consequences over VS inversion. J Seismol 12(1):1–19
Authors’ contributions
Most of the scientific and technical work has been carried out by the first author (CS) during her Ph.D. work under the scientific supervision of the four next coauthors. JG contributed to the compilation of Beirut buildings database. MA contributed to the nonlinear site response during her Master internships. The redaction has been shared among the first five coauthors. All authors read and approved the final manuscript.
Acknowledgements
This work was supported by the LIBRIS ANR project (2010–2014) funded by the French national Research agency in collaboration between ISTerre Laboratory (Grenoble, France) and Notre Dame University-Louaize (NDU, Lebanon). It was also partially funded by IRD (Institut de recherche pour le développement) through a Ph.D. fellowship and Labex OSUG@2020 (Investissements d’avenir—ANR10 LABX56). The authors also thank Boumédiène Derras for his help and advice about the artificial neural network approach and particularly the reviewers for their fruitful comments to improve this work.
Competing interests
The authors declare that they have no competing interests.
Publisher’s Note
Springer Nature remains neutral with regard to jurisdictional claims in published maps and institutional affiliations.
Author information
Authors and Affiliations
Corresponding author
Appendix
Appendix
See Fig. 12.

Overview of main site characteristics for the considered soil profiles: distribution of a V s30 values, b f 0 values, c total thickness values and d bedrock shear wave velocity
Rights and permissions
Open Access This article is distributed under the terms of the Creative Commons Attribution 4.0 International License (http://creativecommons.org/licenses/by/4.0/), which permits unrestricted use, distribution, and reproduction in any medium, provided you give appropriate credit to the original author(s) and the source, provide a link to the Creative Commons license, and indicate if changes were made.
About this article

Cite this article
Salameh, C., Bard, PY., Guillier, B. et al. Using ambient vibration measurements for risk assessment at an urban scale: from numerical proof of concept to Beirut case study (Lebanon). Earth Planets Space 69, 60 (2017). https://doi.org/10.1186/s40623-017-0641-3
Received:
Accepted:
Published:
DOI: https://doi.org/10.1186/s40623-017-0641-3