Multidisciplinary Observing in the World Ocean’s Oxygen Minimum Zone Regions: From Climate to Fish — The VOICE Initiative
 Véronique Garçon1*
  Johannes Karstensen2*
  Artur Palacz3
  Maciej Telszewski3
  Tony Aparco Lara4 Denise Breitburg5
  Francisco Chavez6
  Paulo Coelho7 Marcela Cornejo-D’Ottone8
  Carmen Santos9
  Björn Fiedler2 Natalya D. Gallo10,11
  Marilaure Grégoire12
  Dimitri Gutierrez13,14
  Martin Hernandez-Ayon15
  Kirsten Isensee16
  Tony Koslow10
  Lisa Levin10,11
  Francis Marsac17
  Helmut Maske18
  Baye C. Mbaye19
  Ivonne Montes20
  Wajih Naqvi21
  Jay Pearlman22
  Edwin Pinto23
  Grant Pitcher24,25 Oscar Pizarro26,27
  Kenneth Rose28 Damodar Shenoy29
  Anja Van der Plas30 Melo R. Vito31
  Kevin Weng32
- 1CNRS/Laboratoire d’Études en Géophysique et Océanographie Spatiales, Toulouse, France
- 2GEOMAR Helmholtz Centre for Ocean Research Kiel, Kiel, Germany
- 3International Ocean Carbon Coordination Project, Institute of Oceanology of Polish Academy of Sciences, Sopot, Poland
- 4Facultad de Ciencias Fisicas, Universidad Nacional Mayor de San Marcos, Lima, Peru
- 5Smithsonian Environmental Research Center, Edgewater, MD, United States
- 6Monterey Bay Aquarium Research Institute, Moss Landing, CA, United States
- 7Instituto Nacional de Investigação Pesqueira e Marinha, Luanda, Angola
- 8Escuela de Ciencias del Mar and Instituto Milenio de Oceanografia, Pontificia Universidad Catolica de Valparaíso, Valparaíso, Chile
- 9Faculdade de Ciências, Universidade Agostinho Neto, Luanda, Angola
- 10Integrative Oceanography Division, Scripps Institution of Oceanography, University of California, San Diego, La Jolla, CA, United States
- 11Center for Marine Biodiversity and Conservation, Scripps Institution of Oceanography, University of California, San Diego, La Jolla, CA, United States
- 12Department of Astrophysics, Geophysics and Oceanography, Faculty of Sciences, Université de Liège, Liège, Belgium
- 13Dirección General de Investigaciones Oceanográficas y de Cambio Climático, Instituto del Mar del Perú (IMARPE), Callao, Peru
- 14Programa de Maestría de Ciencias del Mar, Universidad Peruana Cayetano Heredia, Lima, Peru
- 15Instituto de Investigaciones Oceanológicas, Universidad Autónoma de Baja California, Ensenada, Mexico
- 16Intergovernmental Oceanographic Commission of UNESCO, Paris, France
- 17UMR 9190 Centre pour la Biodiversité Marine, l’Exploitation et la Conservation (MARBEC), IRD, University of Montpellier, CNRS, Sète, France
- 18Departamento de Oceanografía Biológica, Centro de Investigación Científica y de Educación Superior de Ensenada, Ensenada, Mexico
- 19Laboratory of Atmospheric and Ocean Physics, University Cheikh Anta Diop, Dakar, Senegal
- 20Instituto Geofísico del Perú, Lima, Peru
- 21Council of Scientific and Industrial Research, New Delhi, India
- 22Institute of Electrical and Electronics Engineers France, Paris, France
- 23Instituto Oceanografico de la Armada del Ecuador, Base Naval Sur, Instituto Oceanografico, Guayaquil, Ecuador
- 24Fisheries Research and Development, Department of Agriculture, Forestry and Fisheries, Cape Town, South Africa
- 25Department of Biological Sciences, Faculty of Science, University of Cape Town, Cape Town, South Africa
- 26Department of Geophysics, Facultad de Ciencias Físicas y Matemáticas, University of Concepción, Concepción, Chile
- 27Millennium Institute of Oceanography, University of Concepción, Concepción, Chile
- 28Horn Point Laboratory, University of Maryland Center for Environmental Science, Cambridge, MD, United States
- 29CSIR-National Institute of Oceanography, Dona Paula, India
- 30Subdivision Environment, Ministry of Fisheries and Marine Resources, Swakopmund, Namibia
- 31Instituto Nacional de Desenvolvimento das Pescas (INDP), Mindelo, Cape Verde
- 32Department of Fisheries Science, Virginia Institute of Marine Science, College of William & Mary, Gloucester Point, VA, United States
Multidisciplinary ocean observing activities provide critical ocean information to satisfy ever-changing socioeconomic needs and require coordinated implementation. The upper oxycline (transition between high and low oxygen waters) is fundamentally important for the ecosystem structure and can be a useful proxy for multiple observing objectives connected to eastern boundary systems (EBSs) that neighbor oxygen minimum zones (OMZs). The variability of the oxycline and its impact on the ecosystem (VOICE) initiative demonstrates how societal benefits drive the need for integration and optimization of biological, biogeochemical, and physical components of regional ocean observing related to EBS. In liaison with the Global Ocean Oxygen Network, VOICE creates a roadmap toward observation-model syntheses for a comprehensive understanding of selected oxycline-dependent objectives. Local to global effects, such as habitat compression or deoxygenation trends, prompt for comprehensive observing of the oxycline on various space and time scales, and for an increased awareness of its impact on ecosystem services. Building on the Framework for Ocean Observing (FOO), we present a first readiness level assessment for ocean observing of the oxycline in EBS. This was to determine current ocean observing design and future needs in EBS regions (e.g., the California Current System, the Equatorial Eastern Pacific off Ecuador, the Peru–Chile Current system, the Northern Benguela off Namibia, etc.) building on the FOO strategy. We choose regional champions to assess the ocean observing design elements proposed in the FOO, namely, requirement processes, coordination of observational elements, and data management and information products and the related best practices. The readiness level for the FOO elements was derived for each EBS through a similar and very general ad hoc questionnaire. Despite some weaknesses in the questionnaire design and its completion, an assessment was achievable. We found that fisheries and ecosystem management are a societal requirement for all regions, but maturity levels of observational elements and data management and information products differ substantially. Identification of relevant stakeholders, developing strategies for readiness level improvements, and building and sustaining infrastructure capacity to implement these strategies are fundamental milestones for the VOICE initiative over the next 2–5 years and beyond.
Introduction
Challenges for Multidisciplinary Sustained Ocean Observations
The physical, biogeochemical, and ecosystem state of the ocean is shaped by multiple processes that operate in parallel and interact with each other. The interactions might be negligible, linear, or highly non-linear and often cross disciplines, time scales (subseconds to centuries and longer), and boundaries (atmosphere, cryosphere, land). Comprehensive observing requires a mix of in situ and remote sensing observing technology hosted physically by observation platforms. Thus, the motivating ocean observing objective must be known (societal benefit of an ocean product), and data integration and ocean observing product generation, including dissemination, are important elements.
The Framework for Ocean Observing (FOO: UNESCO, 2012; Figure 1) provides guidance for structuring ocean observing, from societal requirements, monitoring the ocean via observations, data integration, and downstream services related to ocean observing products, including ocean observing codesign aspects for product improvement and new product creation. The FOO is a strategic document that provides valuable guidelines for assessing ocean observing problems, but it is not an implementation plan for specific ocean observing applications.
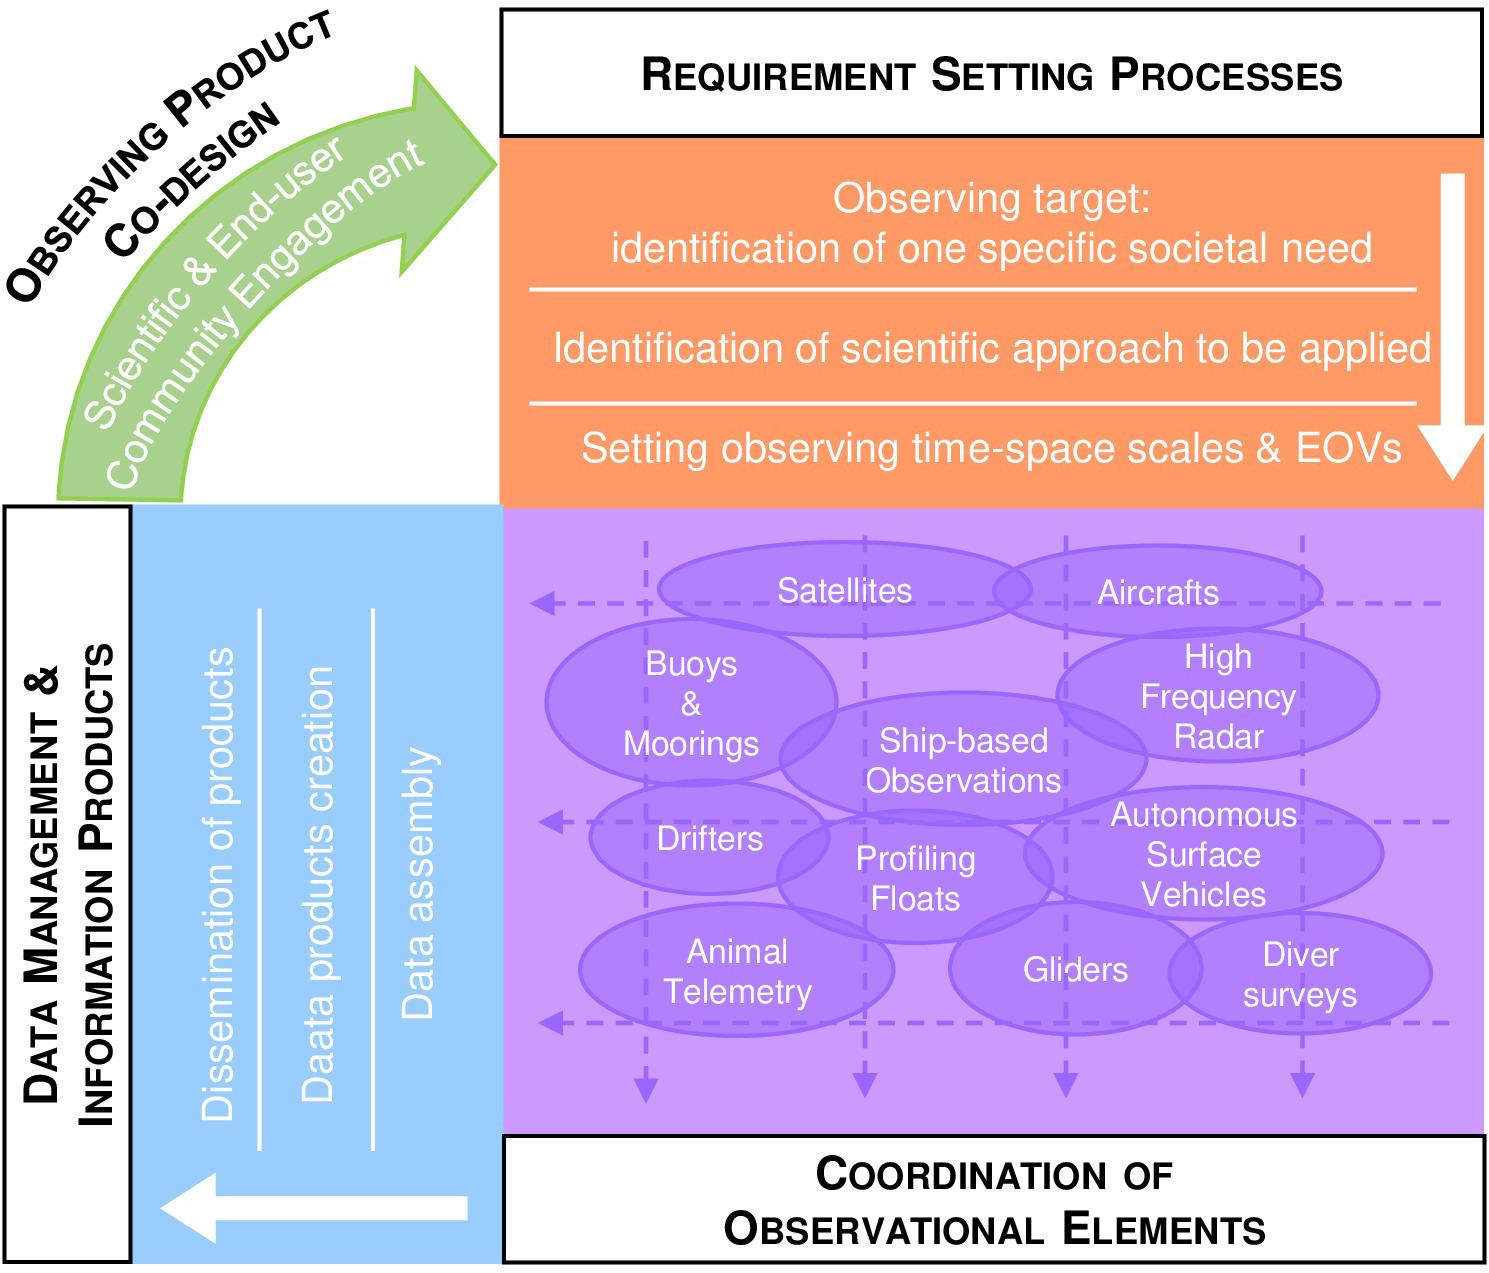
Figure 1. Conceptual structure for an ocean observing value chain designed to match the original structure of the Framework for Ocean Observing (FOO) (Adapted from the UNESCO, 2012).
The “loop” that is executed when applying the FOO principles to a certain observing objective (e.g., seasonal cycle of habitat compression in a certain area) is also called the “ocean observing value chain.” Value chain is a concept adopted from economics that describes a process in which a system is organized through subsystems, each adding value with inputs, transformation processes, and outputs. By evaluating the value chain for a region or an observing objective, it reveals not only the contributing structural elements and their linkages but sets the options for optimization of the system (following Porter, 1985). The total value delivered by the system is the sum of the value of all subsystems. The value chain activities are separated into primary activities (operations, distribution, trade) and secondary activities (research and development, human resources).
To determine the ocean observing status for a certain objective, the activities within the FOO ocean observing value chain are analyzed. The primary activities are (i) requirement processes, (ii) coordination of observational elements, and (iii) data management and information products. These three activities are referred to here as “the FOO pillars.” The secondary activities are identical to those described in economics: research and development, and human resources. To evaluate the maturity of the primary and secondary activities, a readiness level scheme, such as proposed by the FOO, can be applied for each of the FOO pillars. In Table 1, we summarize measures and metrics characteristic of three basic readiness levels (concept, mature, and pilot) describing the status of the individual ocean observing activities within each region considered in this study. The FOO (UNESCO, 2012) uses a more refined nine-level readiness level scale nested within the basic three level scales: from concept (levels 1–3) and pilot (levels 4–6) to mature (levels 7–9). In this paper, we assign either one specific level or a range of levels (e.g., 4–5) by comparing, for example, to what extent the requirement processes set in a given region match those described by the FOO readiness level scale.
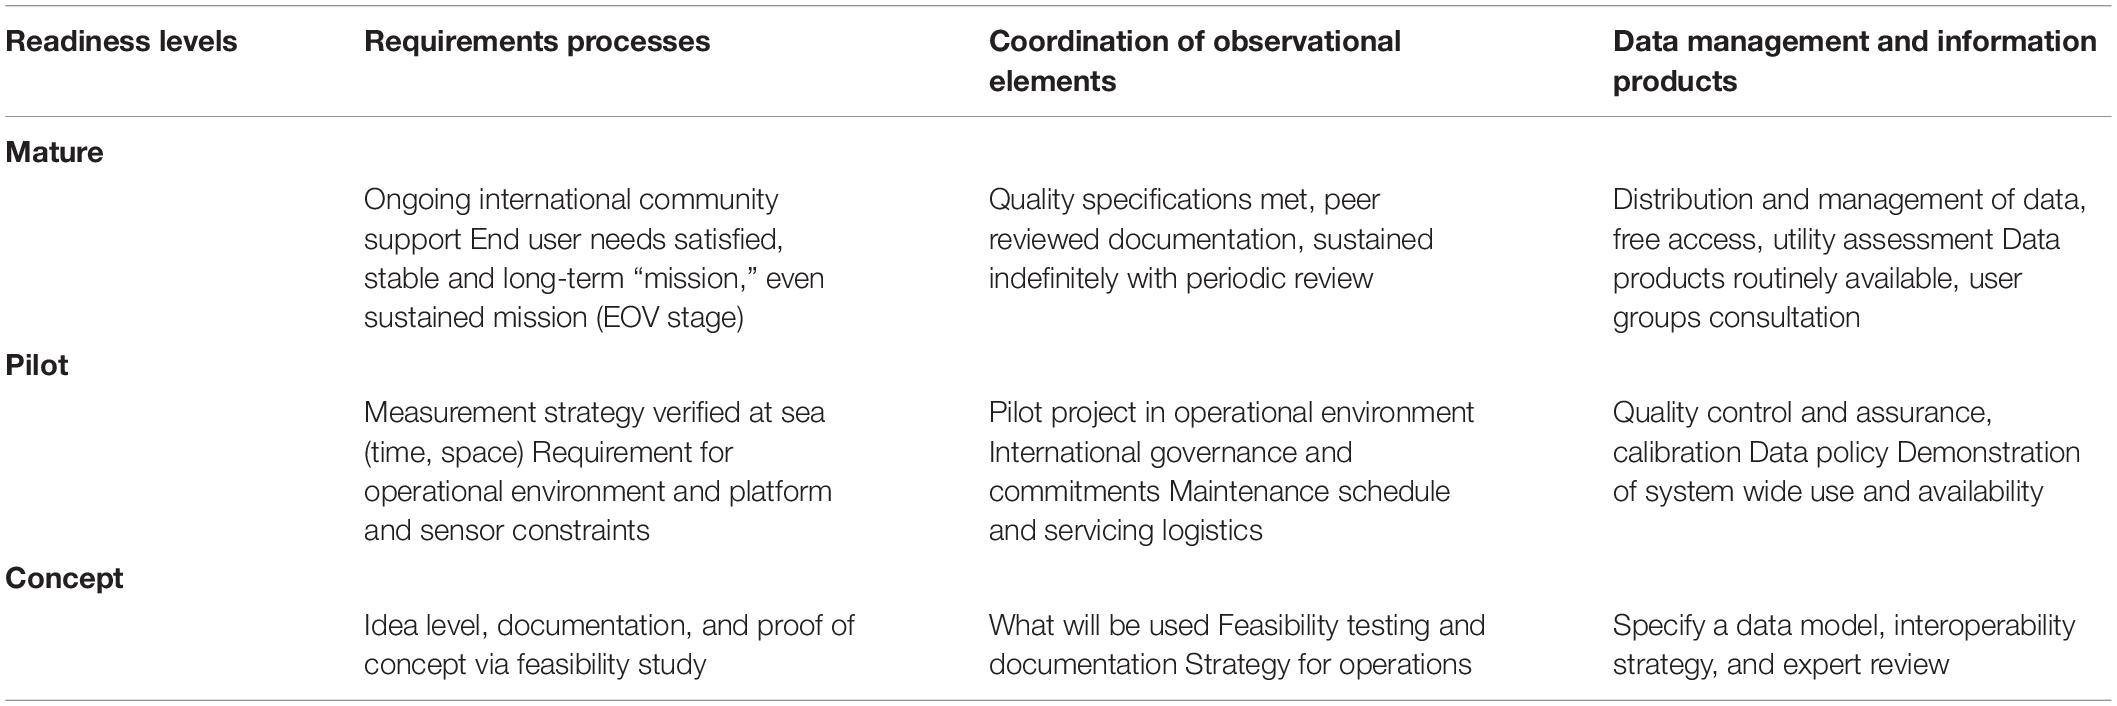
Table 1. Readiness levels for ocean observing value chain assessments adopted for the VOICE initiative.
One objective in defining an observing system (including the whole value chain) is to achieve maximum efficiency (optimization) within the constraint of enabling sustainability and meeting sponsoring organizations’ requirements. For example, the observations executed in the context of the Global Ocean Observing System (GOOS) and the Global Climate Observing System (GCOS) are activities that are cosponsored by the Intergovernmental Oceanographic Commission of UNESCO, the World Meteorological Organization, the International Council for Science, and the UN Environment. The sponsoring organizations expect multiple uses of the data. This means, for example, that certain elements of the ocean observing value chain for monitoring the seasonal variability of habitat compression for fisheries advice, which may deliver to operational aspects in the GOOS, may also be used in the ocean observing value chain for long-term trends in deoxygenation, as a clear GCOS topic. The two observing objectives obviously differ in their respective time scales and requirements on data quality, and also the data integrators and users of the products are different, but the observing infrastructure may overlap with each other and also with other GOOS and GCOS observing value chains. As such, the “integration for optimization” of several ocean observing objectives is a complex process that probably is best initiated by assessing and analyzing the functionality and elements of the regional ocean observing value chains.
In this paper, we present the variability of the oxycline and its impact on the ecosystem (VOICE) as initiative which attempts to (i) identify ocean observing value chains that are in operation in several eastern boundary systems (EBSs) around the globe and (ii) to assess their apparent readiness levels with respect to all three pillars of the FOO, with a particular observing objective in mind.
Introduction to the OMZ and Eastern Boundary System Regions
Oxygen minimum zones (OMZs) in the global ocean are oceanic regions with low oxygen concentrations as a result of high ratios of the rate of oxygen consumption to ocean ventilation in the mesopelagic ocean (Wyrtki, 1962; Luyten et al., 1983; Karstensen et al., 2008; Paulmier and Ruiz-Pino, 2009). OMZs are found neighboring EBS in the Atlantic and Pacific oceans and also in the northern Indian Ocean (see Figure 2 for the VOICE regions). OMZs are high in nutrient content and exchanges between OMZ and EBS create highly productive biological regions with high biomass and primary and secondary productivity, which in turn support important fisheries. In addition to natural variability, the EBSs are under the impact of human activities due to their proximity to coasts. The upwelling EBSs cover ∼0.01% of the global ocean area but sustain ∼20% of the world’s wild fisheries (Pauly and Christensen, 1995).
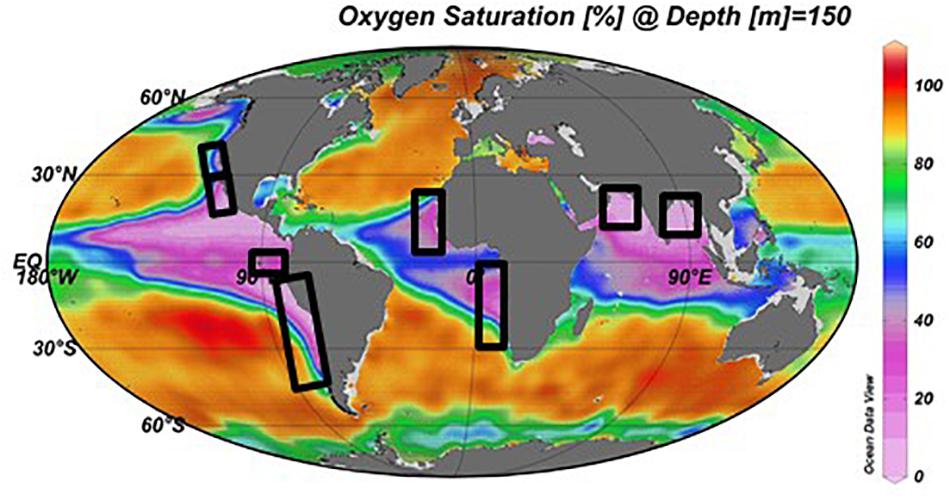
Figure 2. Location of selected VOICE regions overlain on top of the global map of annual oxygen saturation (%) at 150 m depth. Regions included in VOICE: the oxygen minimum zone/eastern boundary systems (EBSs) (OMZ/EBS), the California Current System (US West coast and the Southern California Current system off Mexico), the Equatorial Eastern Pacific off Ecuador, the Peru–Chile Current system, West Africa off Senegal and Cape Verde Islands, the northern Benguela off Namibia, and the Northern Indian Ocean (Bay of Bengal and Arabian Sea).
The ecosystem functioning of upwelling EBS is an interlinked multidisciplinary problem. Cross-shelf processes drive the exchange of water between the continental shelf OMZ and boundary currents, leading to the import and export of, for example, heat, freshwater, sediments, nutrients, plankton, and fish larvae. Coastal upwelling, which is associated with vertical and horizontal water transport, is a physical process of particular importance. Coastal upwelling regulates primary productivity and drives the major fisheries in the upwelling EBS due to persistent winds (e.g., Bakun and Nelson, 1991; Albert et al., 2010; Desbiolles et al., 2016; Kämpf and Chapman, 2016) and bottom friction. Upwelling systems respond to local forcing but likewise are impacted by open ocean conditions (Gibbs et al., 1998; Palóczy et al., 2014).
Upwelling systems are particularly vulnerable to stressors. Regional-scale drivers and pressures may include commercial and recreational overfishing, sea-ranching aquaculture, oil and gas development and seabed mining, shipping, dredging, and waste disposal, and regional manifestations of climate change (see Hayes et al., 2012 for an example assessment for a well-managed global system operated in the context of the Integrated Marine Observing System/Blue Link of Australia). Given the multiple socioeconomic societally relevant activities in the EBS regions, there is considerable interest in observing and monitoring these areas.
The greatest concentration of commercial and recreational wild fishing effort is on the continental shelves and margins and includes both demersal and pelagic resources. For example, the highly productive surface waters off West Africa and in the Peru–Chile Current system, where OMZs are very close to the EBS fishing areas, support valuable commercial and recreational fisheries (Prince and Goodyear, 2006; Chavez et al., 2008; Stramma et al., 2011; Gutiérrez et al., 2016). Groundfish fisheries are economically important in some EBS, and fisheries species show species-specific responses to near-bottom oxygen levels (Keller et al., 2017). Aquaculture is also expanding rapidly to feed a growing global human population. Sea-ranching aquaculture relies on raising fish in fixed locations and often deals with high densities of animals, which may impact local biogeochemical oceanic and coastal conditions (i.e., pH and oxygen). Aquaculture operations may also be vulnerable to changing ocean conditions. For example, oyster hatcheries in Oregon, United States, experienced significant economic losses when oyster seed production collapsed due to the upwelling of more acidic waters (Barton et al., 2012).
Sea level rise, changes in ocean circulation and stratification, increases in tropical cyclone intensity, ocean acidification, and oxygen loss are manifestations of ongoing climate change. For instance, off the US West Coast, Feely et al. (2008) showed evidence of upwelling of “acidified” water onto the shelf. Low pH conditions affect shell dissolution in pteropods, which is an indicator of declining habitat suitability owing to ocean acidification in the California Current Ecosystem (Bednaršek et al., 2014). Sustained ocean observing systems provide an excellent opportunity to monitor these physicochemical changes and their ecosystem impacts.
Offshore oil or gas reserves and production areas are present off West Africa and transportation related to these commercial ventures is increasing in this upwelling EBS region. Similarly, ballast water exchanges along shipping lanes along the Atlantic and Pacific shorelines can introduce alien species that could subsequently harm ecosystems. Marine debris, particularly plastics, can have deleterious effects on all marine animals in the food chain. For turtles, seabirds, and whales, smothering, ingestion, and entanglement are threats and can also serve as a vector for biological invasions (Gregory, 2009). In EBS regions, alongshore currents might exacerbate the problem.
Since the OMZs play a role in the dynamics of the EBS, improving our understanding of EBS and fish, and thereby improving fisheries management and enhancing food security, are key long-term goals of VOICE. Fisheries harvests are an ecosystem service and only become a stressor when overfishing occurs.
Ocean Observing in the VOICE Regions
The GOOS in EBS Regions
Because VOICE is motivated by the application of the FOO and as such is linked to GOOS, we first consider how ocean observing efforts in the EBS regions are visible on the global from the perspective of GOOS. To track long-term observing efforts, GOOS relies on the information collected and made available by the Joint Technical Commission for Oceanography and Marine Meteorology (JCOMM) in situ Observing Programs Support Centre (JCOMMOPS), which assembles information about when, where, and which observations have been executed and by whom. JCOMMOPS does not manage the actual observational data coming from various observational platforms but, rather, assembles all their metadata information (including the link to data centers that host the observational data).
By making use of the metadata in JCOMMOPS, we present here a first assessment of EBS ocean observations. JCOMMOPS operates at the boundary between “coordination of observational elements” and “data management and information products” (the second and third FOO pillars). This means that if missing information needed for analyses has not been incorporated into an integrated data aggregate or it is not adequately described in the metadata, then JCOMMOPS can coordinate the needed updates. Likewise, it could also be that the metadata are not complete or made available via the agreed data assembly centers.
Note that our assessment only considers the GOOS observing networks: profiling drifters Argo, Ship-Based Hydrographic Investigation Program, Global Sea Level Observing System, global network of open ocean time series stations (OceanSITES), Ships Observations Team, and Data Buoy Cooperation Panel. We use an example from the upwelling EBS region off West Africa in the Southeast Atlantic considering the VOICE relevant exclusive economic zones (EEZs) of the following countries: Republic of Congo, Republic of Angola (VOICE representative), Namibia (VOICE representative), and the relevant part of the South African EEZ (VOICE representative). JCOMMOPS lists for this region 46 observing platforms when we consider all possible levels of observing status (probable, confirmed, registered, operational, closed, inactive). From the JCOMMOPS metadata, it is evident that the platforms include 25 Argo floats, 11 Ships Observations Team ships, one Global Sea Level Observing System sea level station, and nine Data Buoy Cooperation Panel surface drifters. The parameters observed (numbers in brackets denote the number of platforms in the JCOMMOPS metadata base) are subsurface pressure, temperature, salinity (25), bulk sea-surface temperature (8), air temperature (7), air pressure (7), relative humidity (7), and oxygen (1). Observations are executed by the following countries: United States (16), Germany (12), United Kingdom (7), France (4), European Union (3), and four platforms do not specify the responsible country.
At this stage, we have to acknowledge that very few of the observing efforts are apparently reflected in the JCOMMOPS metadata base, meaning very few are “visible” in the GOOS and GCOS observing coordination. In contrast, a search for research cruises in the Pan-European infrastructure for ocean and marine data management (SeaDataNet1) reveals 321 research cruises for the Southeast Atlantic (covering the period 1975–2016). It is clear that better linkage of international metadata bases is required to make observing efforts visible and in turn accessible for global analyses of current capacities and gaps in ocean observing.
Ocean Observing in EBS Regions From a Fisheries View
Fisheries are a major societal driver for ocean observing in the EBS regions. The need for information on target species, their food webs, and habitats can be informed from dedicated observing by national agencies in the respective EBS countries. One very successful and long-standing observing effort that combines fish stock assessments and capacity development is organized via the Centre for Development Cooperation in Fisheries through operations aboard the Norwegian research vessel (RV) “Dr. Fridtjof Nansen” in EBS waters off Angola. The “RV Nansen” campaigns include the observation of biological/ecosystem variables, biogeochemistry, and physical oceanography. Moreover, meteorological variables are observed.
Because access to the “RV Nansen” data is subject to specific restrictions, data integration, beyond fish stock assessments, is not always fully explored. Likewise, the existence of the data and the observing efforts are not visible through JCOMMOPS and hence are not recognized as a contribution to the GOOS. Tchipalanga et al. (2018) provide an example of a typical “bottle neck” case in the FOO context: they found that further time series research on physical data from RV Nansen cruises revealed new insight into fish stock dynamics, creating the potential for prediction and thus better management. In the FOO ocean observing value chain framework, the Tchipalanga et al. (2018) example demonstrates that by bringing the third FOO Pillar “Data Management and Information Products” from Pilot readiness levels 5 (verification) to readiness level 6 (demonstration of availability, use, interoperability), a different class of ocean observing product is made available in the Angolan EBS. This development of a primary activity in the FOO (the three “pillars”) was only possible because of parallel support of secondary activities (research and development, and human resources; see Tchipalanga et al., 2018).
Satellite Observing
Another data source crucial for monitoring the EBS is satellite remote sensing data with multiannual coverage. Ocean color is a valuable proxy for many biogeochemical relevant parameters (e.g., chlorophyll concentration), as well as dynamics such as the absolute dynamic topography or the sea level anomaly. Horizontal resolution is often a limitation, and the land/sea transition can generate data problems and large uncertainties.
In upwelling EBS regions, wind forcing is of considerable interest (Bakun and Nelson, 1991). The wind exhibits a drop-off in a narrow strip close to the coast which the scatterometer data cannot document due to the 25-km blind strip close to the coast. On the other hand, altimeters on board ENVISAT, Jason-1, Jason-2, and SARAL satellites are able to document the spatial variability of the mean wind drop-off near the coast (Astudillo et al., 2017). This offers promising routes for the study of upwelling EBS with the upcoming Surface Water Ocean Topography altimeter2.
The Voice Initiative
The IMSOO3 Workshop
The concept behind the VOICE initiative was developed during a workshop on Integrating Multidisciplinary Sustained Ocean Observations (IMSOO) held in February 2017 (Palacz et al., 2017a) and was designed to address one of the three IMSOO themes on Integrated and Multidisciplinary Ocean Observing of Oxygen Minimum Zones (the other two were on plankton observations and on boundary currents). The IMSOO-OMZ group decided to define an initiative that will address a first application of the FOO strategy (see the section “Introduction”) and to undertake an assessment of the observing requirements, the existing and planned observing infrastructure, and the data integration and dissemination system in OMZ regions. The next step, based on the assessment in step 1, will be the development of possible implementation plans for improving the readiness levels of the FOO pillars in the OMZ regions. It was decided that the implementation plan must include a strategy for “data sharing standards” for multidisciplinary, multiplatform observations developing scientific strategies and also for creating suitable products to respond to the societal requirements identified for observing systems.
As an outcome, an overarching question, linked to multiple societal drivers for OMZ observing (e.g., fisheries, aquaculture, OMZ expansion, biodiversity changes, greenhouse gas emissions, carbon sequestration), was agreed upon for the proposed IMSOO-OMZ activity: “How do changing OMZs affect the spatiotemporal distribution, productivity, and trophic structure of benthic and pelagic communities?”
However, realizing that many ocean observing value chains are associated with the above question, more specific but related scientific questions helped to narrow down the assessment space:
• What are the physical mechanisms controlling/influencing oxygen supply to OMZs?
• What are the biological components controlling/influencing oxygen consumption?
• How does bentho-pelagic coupling affect biogeochemical and ecological feedbacks?
• What is the role of microbial community metabolism on the development of OMZs?
• What is the bottom-up effect of changing OMZs on the trophic structure?
• How does the fish biomass and community structure change in relation to a changing OMZ?
From this overarching set of questions, the IMSOO-OMZ working group discussed approaches to propose fit-for-purpose, multidisciplinary ocean observing systems for OMZ regions. To do so, questions related to sustainability also need to be addressed. Therefore, societal impacts and benefits of the planned project were discussed considering the three broad GOOS application areas: (i) climate, (ii) operational services, and (iii) marine ecosystem health. These areas contribute to a large number of the United Nations Sustainable Development Goals (UN-SDGs), and in particular to SDG 13 and 14 addressing “Climate action” and “Life below water,” respectively.
Multiple ocean observing value chains need to be assessed and analyzed. This assessment is the first step toward optimization—with “optimization by integration” meaning, for example, determining the potential for multiple uses of data, observing, integration, and dissemination infrastructure. An example of an optimization by integration is to use an observing platform for short-term oxycline variability (e.g., autonomous underwater electric gliders) as well as estimating decadal oxygen trends. In principle, this is an easy task; however, the climate application (decadal oxygen trend) requires a much higher precision and, as such, a different calibration effort for the glider oxygen sensor. To make the oxycline glider mission “fit-for-the climate purpose,” it is most important to convey the additional request to the glider operator. Moreover, the glider operator needs guidelines (Best Practices; Pearlman et al., 2019) and also funding to perform the necessary calibration.
Based on a priori knowledge on the current observing systems (see also the section “The GOOS in EBS Regions”), certain challenges for the fit-for-purpose OMZ observing systems were identified at the IMSOO meeting, such as (i) better constrained biogeochemical fluxes (in particular respiration), (ii) temporal and spatially better resolved physical supply pathways of oxygen, (iii) improved model constraints on atmospheric/wind forcing, and (iv) increased understanding of the impacts of OMZs on changes in biological community structure and productivity.
Technology requirements were briefly considered concluding that a complementary approach of ship-based, fixed-point, autonomous, and satellite remote-sensing observations are needed to survey the relevant time and space scales for describing the phenomena associated with OMZ-relevant processes. The issue of scale, regional versus global, was raised in the context of phenomena and observations and modeling feasibility. The IMSOO-OMZ group concluded that, currently, the focus of demonstration activities for the fit-for-purpose observing system should be confined to the regional scale, taking into account not only the financial feasibility but also the increasing complexity when basin scale processes are included by integrating a wider range of contributing processes. Building on existing and forthcoming initiatives, a multidisciplinary OMZ project would be implementable in a number of key geographic regions, such as the California Current System (US West coast and the Southern California Current system off Mexico), the Equatorial Eastern Pacific off Ecuador, the Peru–Chile Current system, West Africa off Senegal and Cape Verde Islands, the northern Benguela off Namibia, and the Northern Indian Ocean (Bay of Bengal and Arabian Sea) (Figure 2). The choice of these nine OMZ regions was partly based on published maps of the highest economic vulnerability depending on the success of fisheries in a given country (Allison et al., 2009).
Possible challenges relating to implementation of the recommended OMZ project include: (i) securing financial resources for a sustainable observation program, (ii) legality of working in EEZs, (iii) accessing historical and current data, and (iv) technological limitations in instrument and sensor development.
Setting the Scientific Question for VOICE
To address the needs identified by the IMSOO-OMZ workshop, it was decided to define a “demonstration project,” which would focus on a specific key feature of the OMZ that is of high relevance in the context of many of the scientific objectives, namely, the depth of the upper oxycline (Figure 3). The upper oxycline depth is constrained by a delicate balance between physical, biogeochemical, and biological processes, which interact non-linearly, particularly through mesoscale to submesoscale dynamics and is an ideal environment to test impacts of observations and models on dynamics hypotheses. We show here for orientation the oxycline defined by the difference in oxygen concentrations in the surface waters (between 70 and 10 m) (Figure 3).
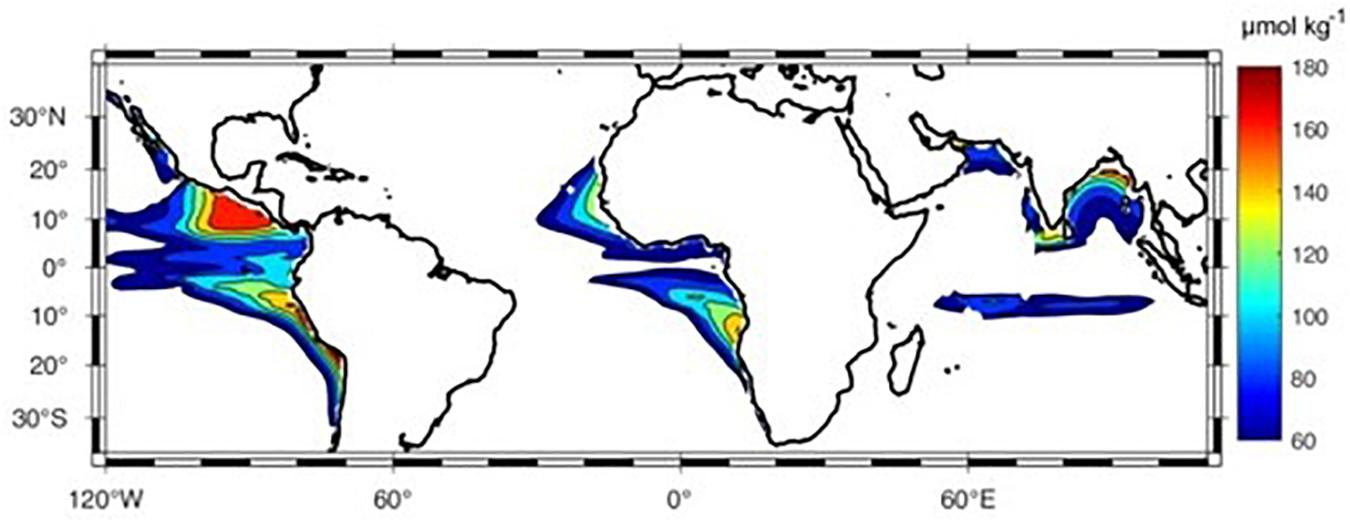
Figure 3. Distribution of the oxygen difference between 70 and 10 m depth (concentrations < 60 μmol kg–1 have been omitted) based on an oxygen climatology. Data from Schmidtko et al. (2017).
Because of the fundamental impact of oxygen on almost all marine life (Breitburg et al., 2018), as well as biogeochemical cycling processes, the oxycline sharpness, and its location impact both biotic and abiotic processes, and its changes have significant potential impacts on entire ecosystems. Both models and observations reveal that oxycline variability is driven by a balance of biological, biogeochemical, and physical processes. Therefore, an IMSOO demonstration project focusing on the oxycline features of all OMZ systems of interest, with colocated, multidisciplinary sustained ocean observations, will have benefit for society.
It was acknowledged that oxycline dynamics do not encompass all processes controlling OMZ formation and change. Nonetheless, the focused topic of the VOICE has a tractable scope, for which tangible implementation plans could be further developed. To identify a user group, the OMZ focus was further narrowed down to the regional observing of oxycline-related processes in the OMZ-neighboring EBS regions.
FOO Readiness Level Assessments in VOICE Regions
Assessing ocean observing systems with respect to the oxycline topic involves a comprehensive analysis of the current capacities set against the phenomena and essential ocean variables (EOV5) associated with oxycline time and space variability, the spatiotemporal sampling design requirements, as well as platform, instrument, and sensor requirements.
During the IMSOO workshop, a preliminary list of such requirements was produced (Palacz et al., 2017a) and assembled into an ad hoc questionnaire to be sent to key stakeholders in targeted EBS regions (Appendix in Supplementary Material). Initially targeting a global representation, we realized in the scoping process that we managed to also interest ocean stakeholders (scientists, fisheries agencies) in the Southern California Current system off Mexico and the Equatorial Eastern Tropical Pacific off Ecuador in the VOICE initiative, while for other regions (e.g., Oman, Iran), these attempts were not successful.
To gather information for this assessment, we decided to reach out to key stakeholders to get their inputs. Given this was the first FOO implementation approach to describe readiness levels for multidisciplinary observing, and recognizing the limited expertise in the VOICE group in designing stakeholder questionnaires, deficiencies in the questionnaire precluded rigorous statistical analysis.
The design of the questionnaire addressed a need for simple, clearly articulated objectives that highlight our topic of interest, namely, the readiness level assessment of all the necessary elements for ocean observing of the oxycline, building on the FOO elements, and the type of respondents. Ocean observing related to OMZs/EBS and connected to the oxycline has global dimensions and thus immediately poses the problem of selecting a target audience for the questionnaire. For practical reasons, but acknowledging that the results will not be representative from a statistical point of view, we sent our questionnaire to a small sample (a dozen) of potential respondents that extended the initial IMSOO-OMZ group. Based on recommendations, one or two regional champions per EBS were selected that acted as representatives but without a formal application process. The questionnaires were completed by individuals or groups of two or three persons who had reasonable knowledge of the ocean observing efforts in the studied EBS regions. FOO design elements were assessed for requirement processes, coordination of observational elements, and data management and information products.
All aspects of questionnaire design and its results are seen as contributions to the anticipated end product of the VOICE initiative, which is a blueprint of multidisciplinary sustained ocean observing in EBS regions. The blueprint should outline a strategy on the minimum and optimal set of observational and modeling requirements for a fit-for-purpose system that is capable of informing society about observing outcomes related to the variability of the oxycline (e.g., habitat compression, deoxygenation) and as an integrative part of the GOOS (Palacz et al., 2017b). The blueprint would be available to implement in any region, but unless the regional requirements are compatible with VOICE, they would not be taken into consideration when drafting the blueprint. Planning of VOICE was split in two different stages: the preparatory stage (2017–2019) and the implementation stage (2019–2022) (Figure 4). For a region to become a potential beneficiary of VOICE implementation activities, interest among its stakeholders in one or more of the VOICE questions needs to be demonstrated.
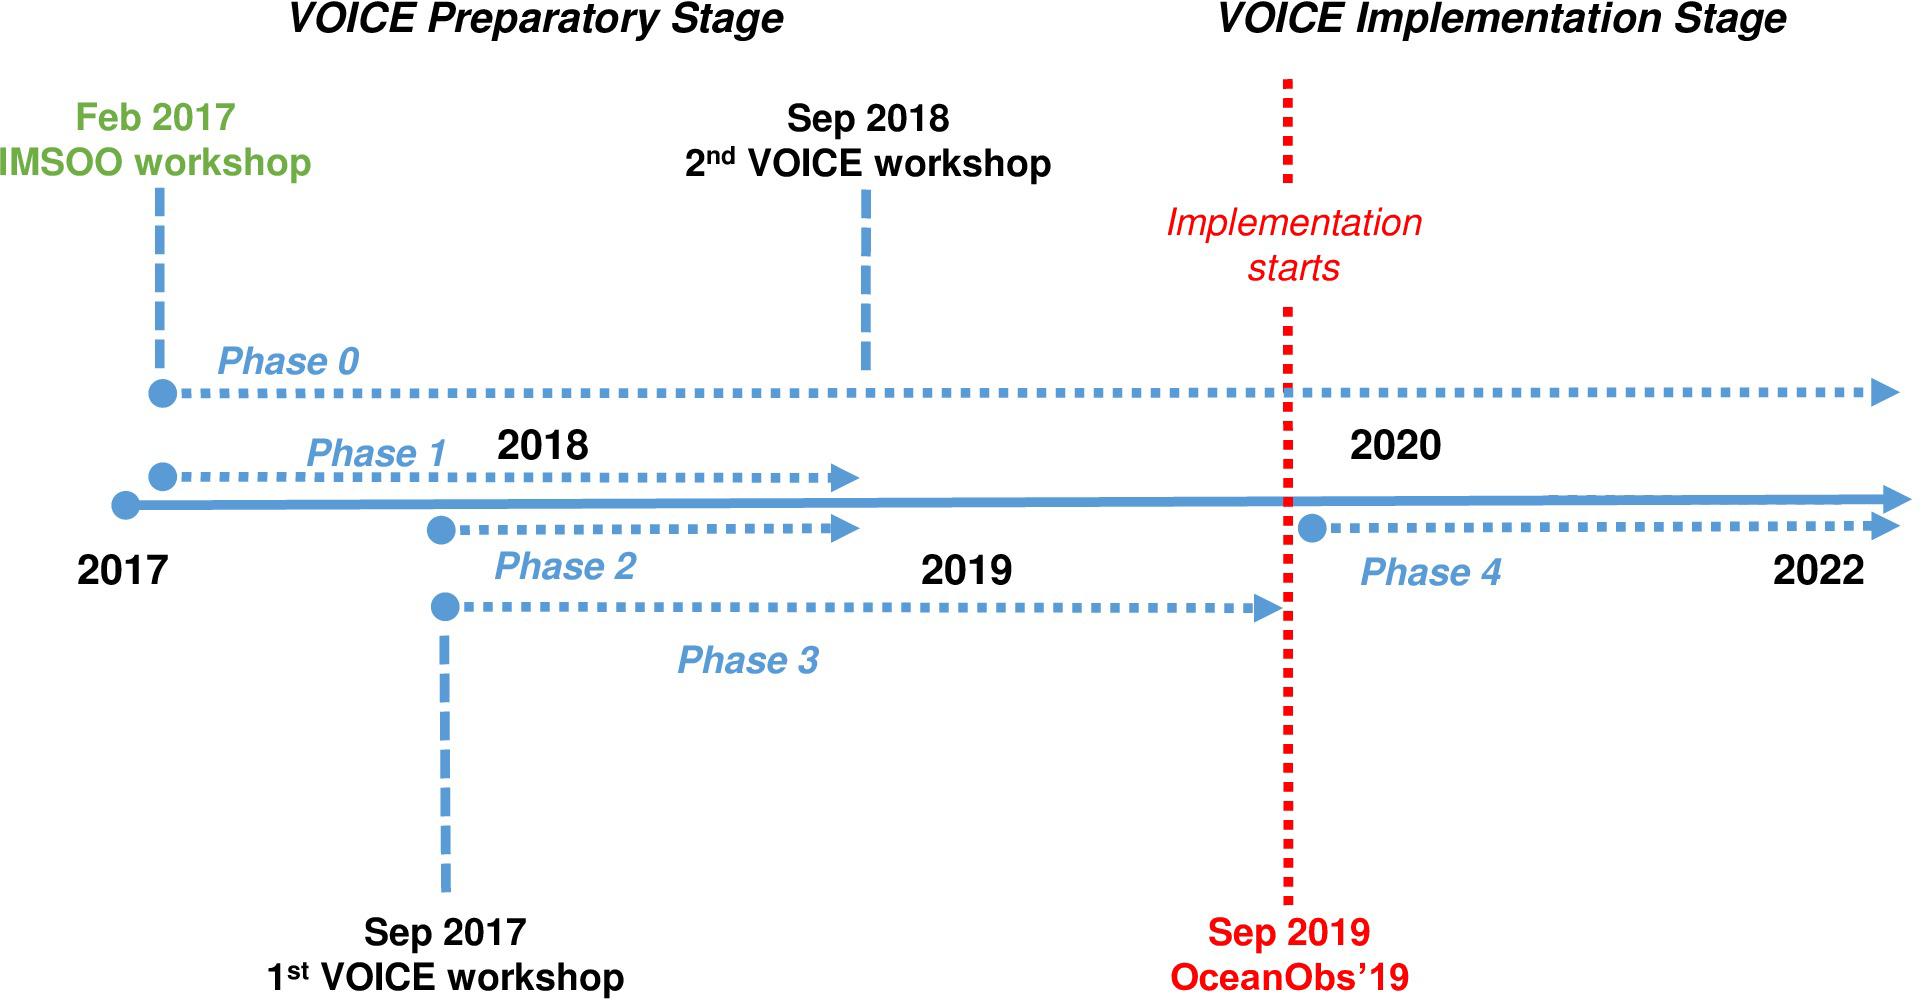
Figure 4. The variability of the oxycline and its impact on the ecosystem (VOICE) timeline as agreed upon during the Integrating Multidisciplinary Sustained Ocean Observations (IMSOO) workshop.
The questions were posed in the context of the overarching issue of “How do changing OMZs affect the spatiotemporal distribution, productivity, and trophic structure of the benthic and pelagic communities?” as stated in the IMSOO workshop report (Palacz et al., 2017a). However, bearing in mind the objectives of VOICE, the participants were asked to specifically focus, if possible, on the aspect of oxycline variability and its impacts on the ecosystem in “their” EBS. In our case, the questionnaire should be considered an initial semiquantitative effort in what should be a multistep process of assessing progress against the requirements for ocean observations. We acknowledge that there is uncertainty about false negatives in the results shown in the following tables and figures, meaning that some empty cells might simply represent a lack of knowledge and not a lack of observing efforts. Our analysis was consequently geared toward what we know (full cells) rather than what we know less about (empty cells). We also strongly emphasize that the ultimate goal of the readiness level assessment was not to discard the low readiness level components of the observing system (i.e., some regions) but rather to promote efforts leading to a gradual increase in the readiness level where it is most needed. The readiness level assessment from concept to pilot or mature (FOO, UNESCO, 2012; Table 1) includes maturity and integrity of requirements set for observations, current observing capability, and data and information product management for both the capability and the fitness for purpose.
Readiness level assessment and timeline to achieve maturity depends on the specific observing objective and can be region specific. There are clear interlinkages between the three FOO pillars notably in assigning readiness level, and one cannot be judged independently of the others. VOICE will realize the principles of FOO, going through the complete cycle from requirement setting to increasing readiness level of observations to optimized data management and information product delivery (Figure 1).
Requirement Setting Processes: The First FOO Pillar
The first FOO pillar (FOO1) seeks to assess the societal needs in terms of the environment or ecosystem information required to address specific observing objectives. This pillar also includes the observing approach to be used to respond to the observing objectives of relevance to VOICE. In other words, it asks, “What observing product is required?” and “How do we need to observe and integrate the data to create the product?” To assess the readiness level of the FOO1, a list of questions was formulated in the questionnaires (Table 2). The analysis was made by building a master answer file with all EBS regions and designing a graphical representation of the synthesized information (Figures 5, 6).
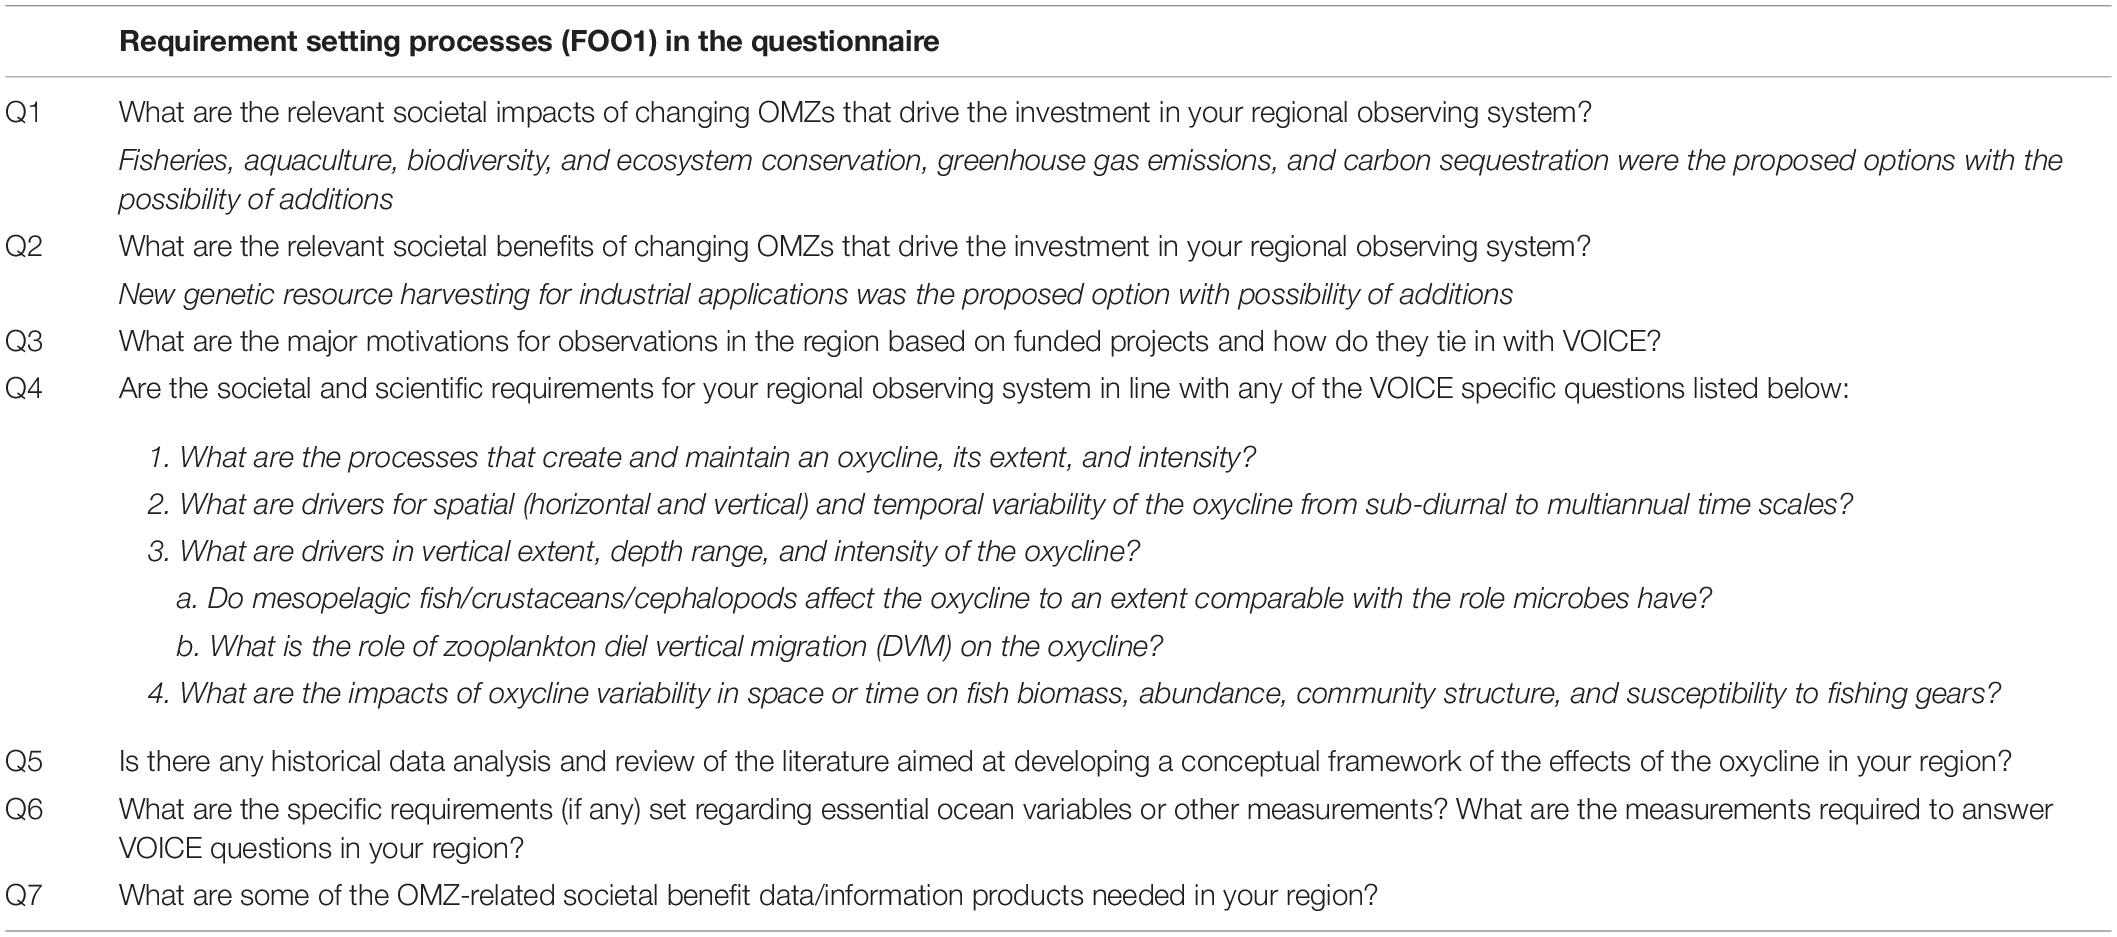
Table 2. List of questions in the questionnaires related to FOO1.
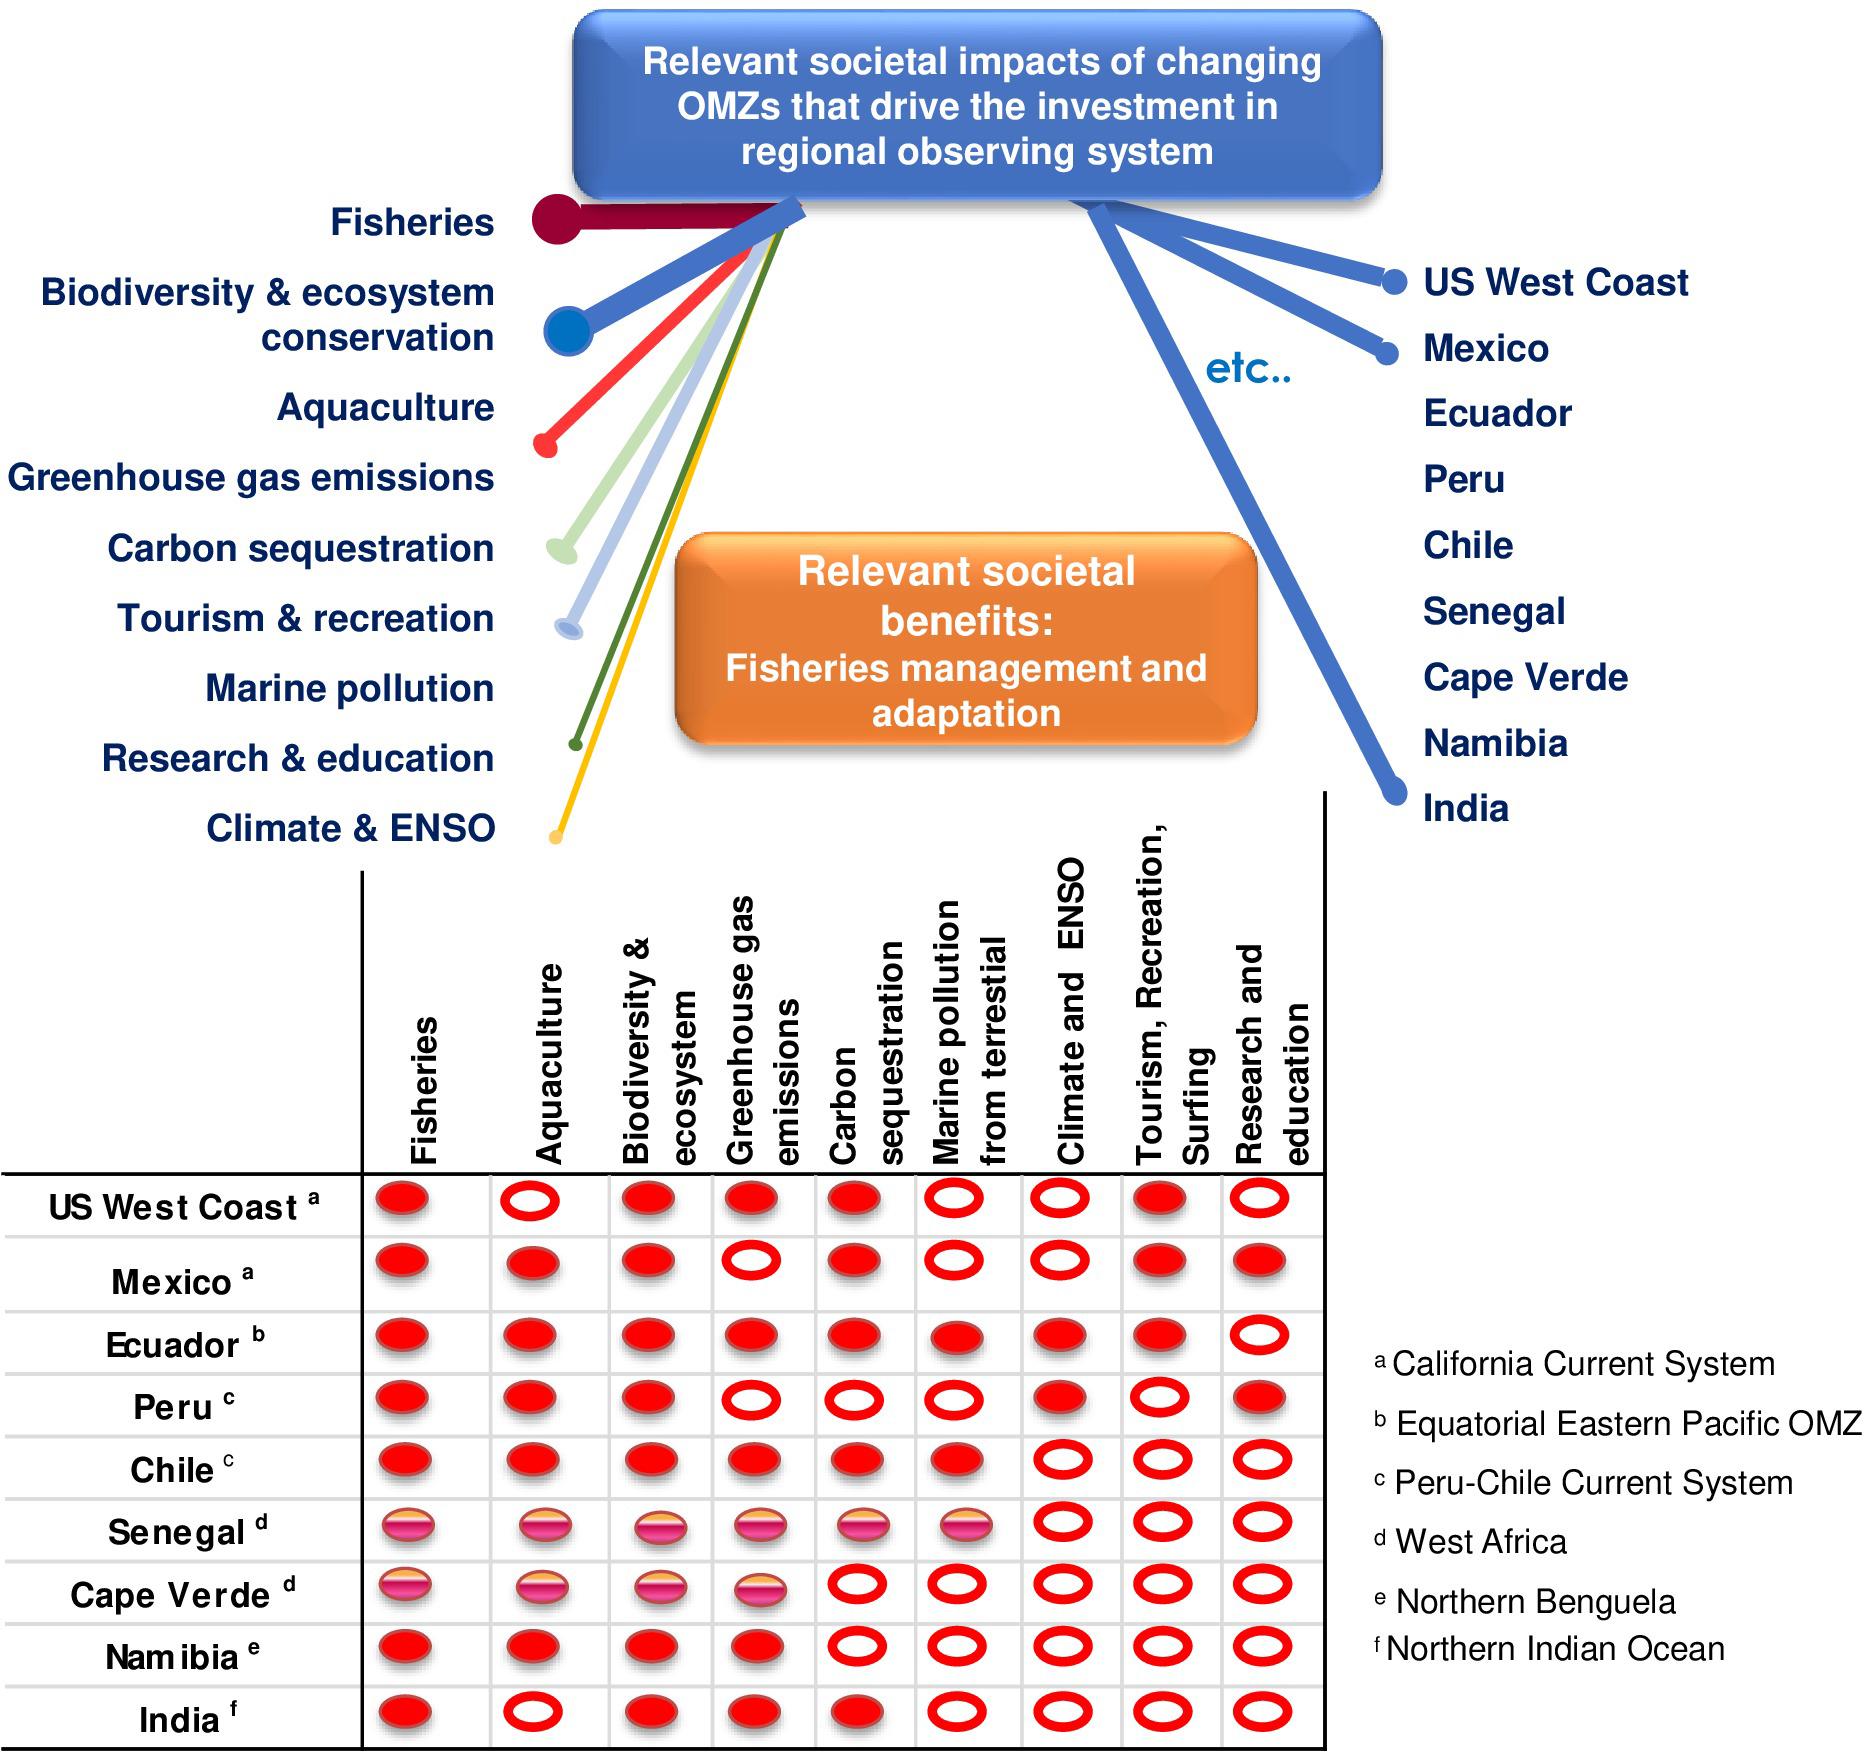
Figure 5. Societal impacts and benefits are driving investments in a given oxygen minimum zone (OMZ) region of the world ocean. Shading indicates that these regions rely mostly on partnerships with foreign countries to carry out their monitoring activities. The two-toned pink oval indicates that the region relies mostly on partnerships with foreign countries, the filled red oval that the region is managing the monitoring at its own national level, and the outlined red oval that the region does not ensure the given monitoring activity. Please note it will not be repeated on all subsequent figures/tables.
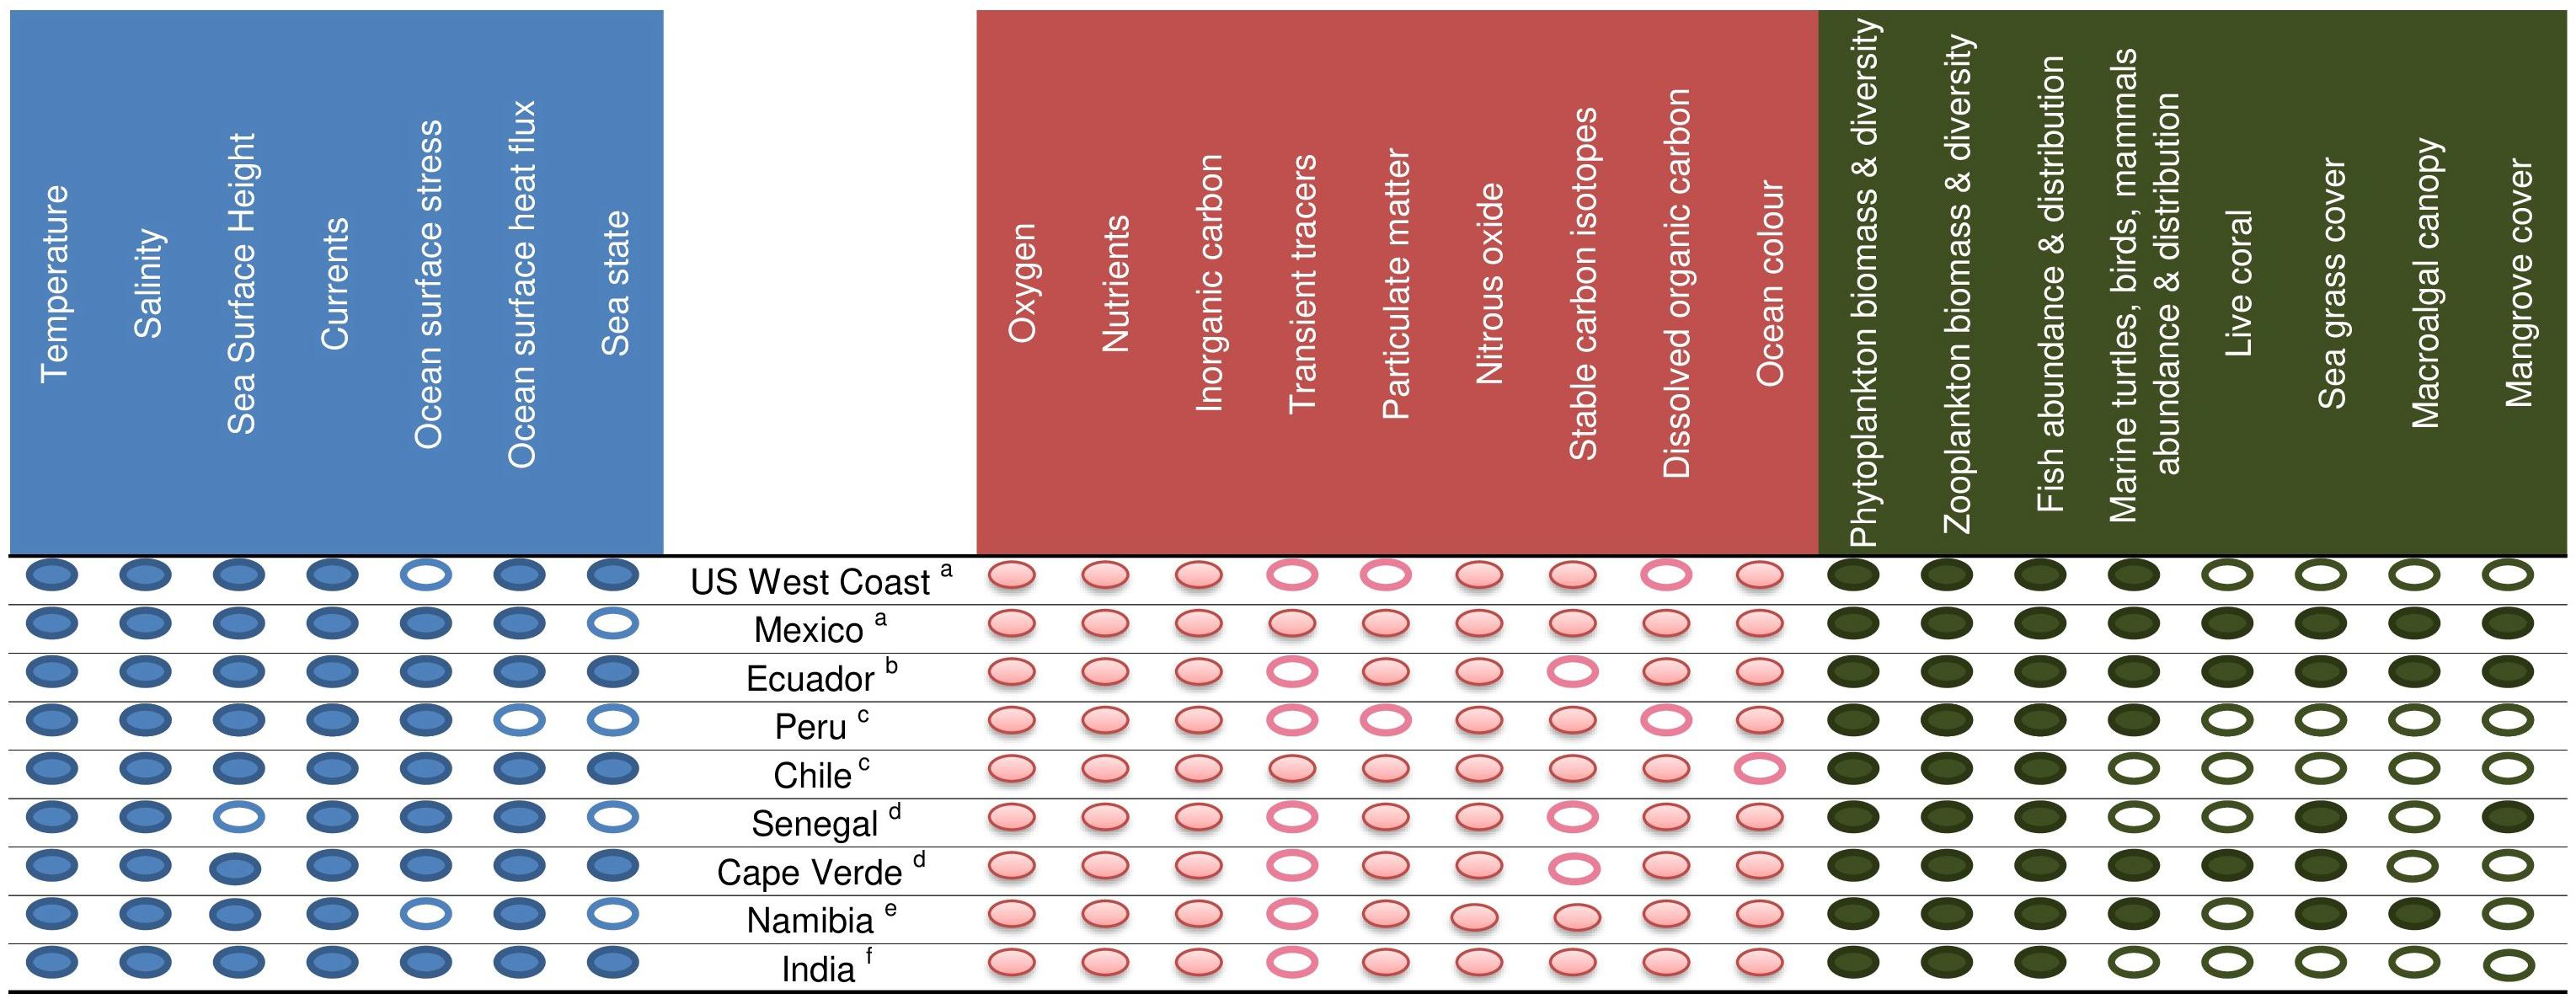
Figure 6. Essential ocean variable observational requirements based on the questionnaire responses for each oxygen minimum zone (OMZ)-selected region.
We included in the questionnaire design all EOVs,6 related to physics, climate, biogeochemistry, biology, and ecosystems. Although several BioEco EOVs might be considered less mature or poorly quantified in the context of VOICE, we decided to include them all in case some regions might consider some of them important.
It is worth mentioning here that all respondents to the questionnaires except for Cape Verde and Senegal adopted a national perspective on the requirements, capabilities, and data management. West Africa stands out in terms of their observing capabilities because of the inclusion of foreign (German and French) efforts. If this approach were to be applied consistently, the questionnaires would be filled in differently for most other regions. In general, there is a need to consider major international capabilities in the regions of interest and contrast them with the purely national ones.
Fisheries and biodiversity and ecosystems conservation rank first (Figure 5) among all societal observing objectives in each OMZ followed by aqua/mariculture. However, all OMZ regions stressed that fisheries were given the highest priority. The relative importance of other drivers (greenhouse gas emission, carbon sequestration, tourism, recreation and surfing, research and education, marine pollution from terrestrial waste (waste waters, plastics, nutrient loads), climate change, and ENSO varied among regions. The relevant societal benefits of changing OMZs that drive the investment in most of the regional observing systems are fisheries and ecosystem management and adaptation and for Ecuador the willingness to secure healthier environments for fisheries and aquaculture farming.
The term “fisheries” was generally used to mean both the population of a fish species occurring in a specific area or region, as well as the activities (e.g., catch, fleet dynamics) related to their harvest. Often, the specific area or region of interest is based on the life cycle and biology of the population, such as migration patterns of different life stages (e.g., eggs, larvae, juveniles, adults) and the degree of genetic mixing with other nearby populations of the same species. The fish and fisheries monitoring data are typically analyzed for the entire region or for subareas within the region and they indicate how the catch is reported (e.g., reporting zones) and how the fishery is managed (e.g., area closures).
Fish exhibit species-specific avoidance of low-oxygen areas (Craig, 2012). Individual fish are exposed to time-varying low oxygen concentrations because they are moving in oxygen fields that also vary in time and space (Neilan and Rose, 2014). Certain demersal fish species are able to live under the hypoxic conditions characteristic of OMZs, while others are not (Gallo and Levin, 2016). This exposure to low oxygen affects the growth, mortality, reproduction, and movement (as part of avoidance) of individuals (Wu, 2002; McNatt and Rice, 2004; Vaquer-Sunyer and Duarte, 2008; Thomas et al., 2015; Salvanes et al., 2018). If sufficiently high numbers of individuals are affected, the OMZs can lead to population-level changes in weight at age (growth), population size (total number of individuals in the region), and horizontal and vertical spatial distributions (Rose et al., 2009). Growth can affect mortality and reproduction (and therefore abundance) because these processes in fish are often strongly influenced by body size (Rose et al., 2001).
Some regions have well-established sustained national observing programs in coastal and open ocean waters, which operate all year at varying frequencies. Other regions rely to varying degrees on international partnerships through the Food and Agriculture Organization of the United Nations support, French IRD funding, and other projects (Figure 5).
With regard to the issue of the oxycline-related scientific questions (see Table 2) relevant in a given region, most regions answered positively to questions 1, 2, 3, and general 4 and Cape Verde to questions 3 and 4. All more general OMZ-related scientific questions relevant to study in the region (see the section “The Voice Initiative” above) were answered positively in all regions. This indicates that almost all EBS regions have relevant societal benefits and impacts of changing OMZs that drive their investment in their own EBS region.
A review of the literature reveals dedicated review papers on OMZs and ocean observing for some EBS regions, sometimes in national scientific journals. Examples include, for instance, in the California Current system, works from Bograd et al. (2008, 2015), Keller et al. (2010, 2015, 2017), Koslow et al. (2011, 2013, 2017), Sato et al. (2017); in the Peru–Chile current system, Chavez et al. (2003, 2008), Gutiérrez et al. (2008), Ulloa and Pantoja (2009), Purca et al. (2010), Ulloa et al. (2012), Alegre et al. (2015), Graco et al. (2017); and in the Northern Indian Ocean, Naqvi et al. (2000, 2006, 2009), Prakash et al. (2012), Banse et al. (2014), and Bristow et al. (2017). Some of this research has focused on studying oxycline variability in a broader sense, examining ventilation processes of the OMZ at the basin scale but not encompassing all the VOICE objectives, thus being more focused on the climate observing objective and not on the fisheries objective. Certain review papers have taken a comparative approach to studying OMZ effects, for example, on benthic ecosystems and on demersal fish communities; these include data from many of the EBS (e.g., Levin, 2003; Gallo and Levin, 2016, and the related citations therein). It is also important to note the ongoing efforts by the International Union for Conservation of Nature in publishing a new global report on “Ocean deoxygenation: everyone’s problem—causes, impacts, consequences, and solutions” and within the Intergovernmental Oceanographic Commission UNESCO working group Global Ocean Oxygen Network of a synthesis paper led by Grant Pitcher entitled “A comparison of ocean and coastal systems subject to low oxygen,” which will include all our selected EBS regions. Some regions included a few manuscripts covering a historical analysis (e.g., Bograd et al., 2008; 2015; Koslow et al., 2011, 2013, 2017 for the California Current system).
Concerning the measurements of EOVs required to answer VOICE questions in a given region, Figure 6 offers a summarized response. Physical EOVs like temperature, salinity, and currents are considered essential and should be measured as a function of depth in all regions. The same holds true for some biogeochemical EOVs such as oxygen, nutrients, and inorganic carbon. For biological EOVs, the monitoring of phytoplankton and zooplankton biomass and diversity are also critical as are fish abundance and diversity in all regions.
Ocean surface stress is thought to be critical for oceanic system dynamics in many of the systems. Sea surface height is indicated to be looked at almost everywhere. Sea state, a critical variable for air–sea exchange, is considered essential in many OMZ systems. Ocean color is used routinely in almost all regions. Particulate matter is not measured everywhere despite its key role in oxygen dynamics and carbon sequestration.
With regard to biological and ecosystem EOVs, information on upper trophic levels such as the abundance and distribution of marine turtles, birds, and mammals is considered a requirement by some questionnaire respondents in some regions but not all. It should be considered that our questionnaire process could have been subject to the presence of disciplinary bias, with insufficient attention paid to the monitoring of BioEco EOVs. Information on the requirement of higher trophic levels may not be present in the answers because the most knowledgeable people on the topic were not reached in our questionnaire and the communities of practices built around marine predators use different sampling platforms. A stronger interaction with these communities should thus be encouraged. Higher trophic levels are important in the VOICE context as indicators of marine ecosystem health, and although they are usually well documented, the data may not be easily accessible. Since fisheries rank as a top priority driver, we recommend a higher level of disaggregation in the future (e.g., demersal and pelagic fisheries) whenever possible.
Sea grass cover, macroalgal canopy, mangrove cover, and live coral are not estimated as essential everywhere, as their distribution varies widely, based on geographical and temporal requirements. However, for Mexico for instance, corals located at the fringe of the OMZ constitute a strong factor driving the need for investment and raising awareness of deoxygenation.
Other key variables, not yet considered as EOVs, such as microbes and iron, were also considered. Some regions answered positively to the questionnaire on these two variables, whereas others responded positively to only one of the variables.
Considering the synthesis of information regarding this FOO1 “Requirement Processes” illustrated in Figures 5, 6 and the master information, we can then attribute, somewhat subjectively, a range of levels within the mature, pilot, or concept readiness levels, considering the detailed description of each readiness level (UNESCO, 2012; Table 1). For instance, all regions were beyond the concept level, with six of them at levels 6–8, two at levels 4–5, and one at level 8. Figure 7 presents the suggested allocation of readiness level assessment for all selected OMZ regions.
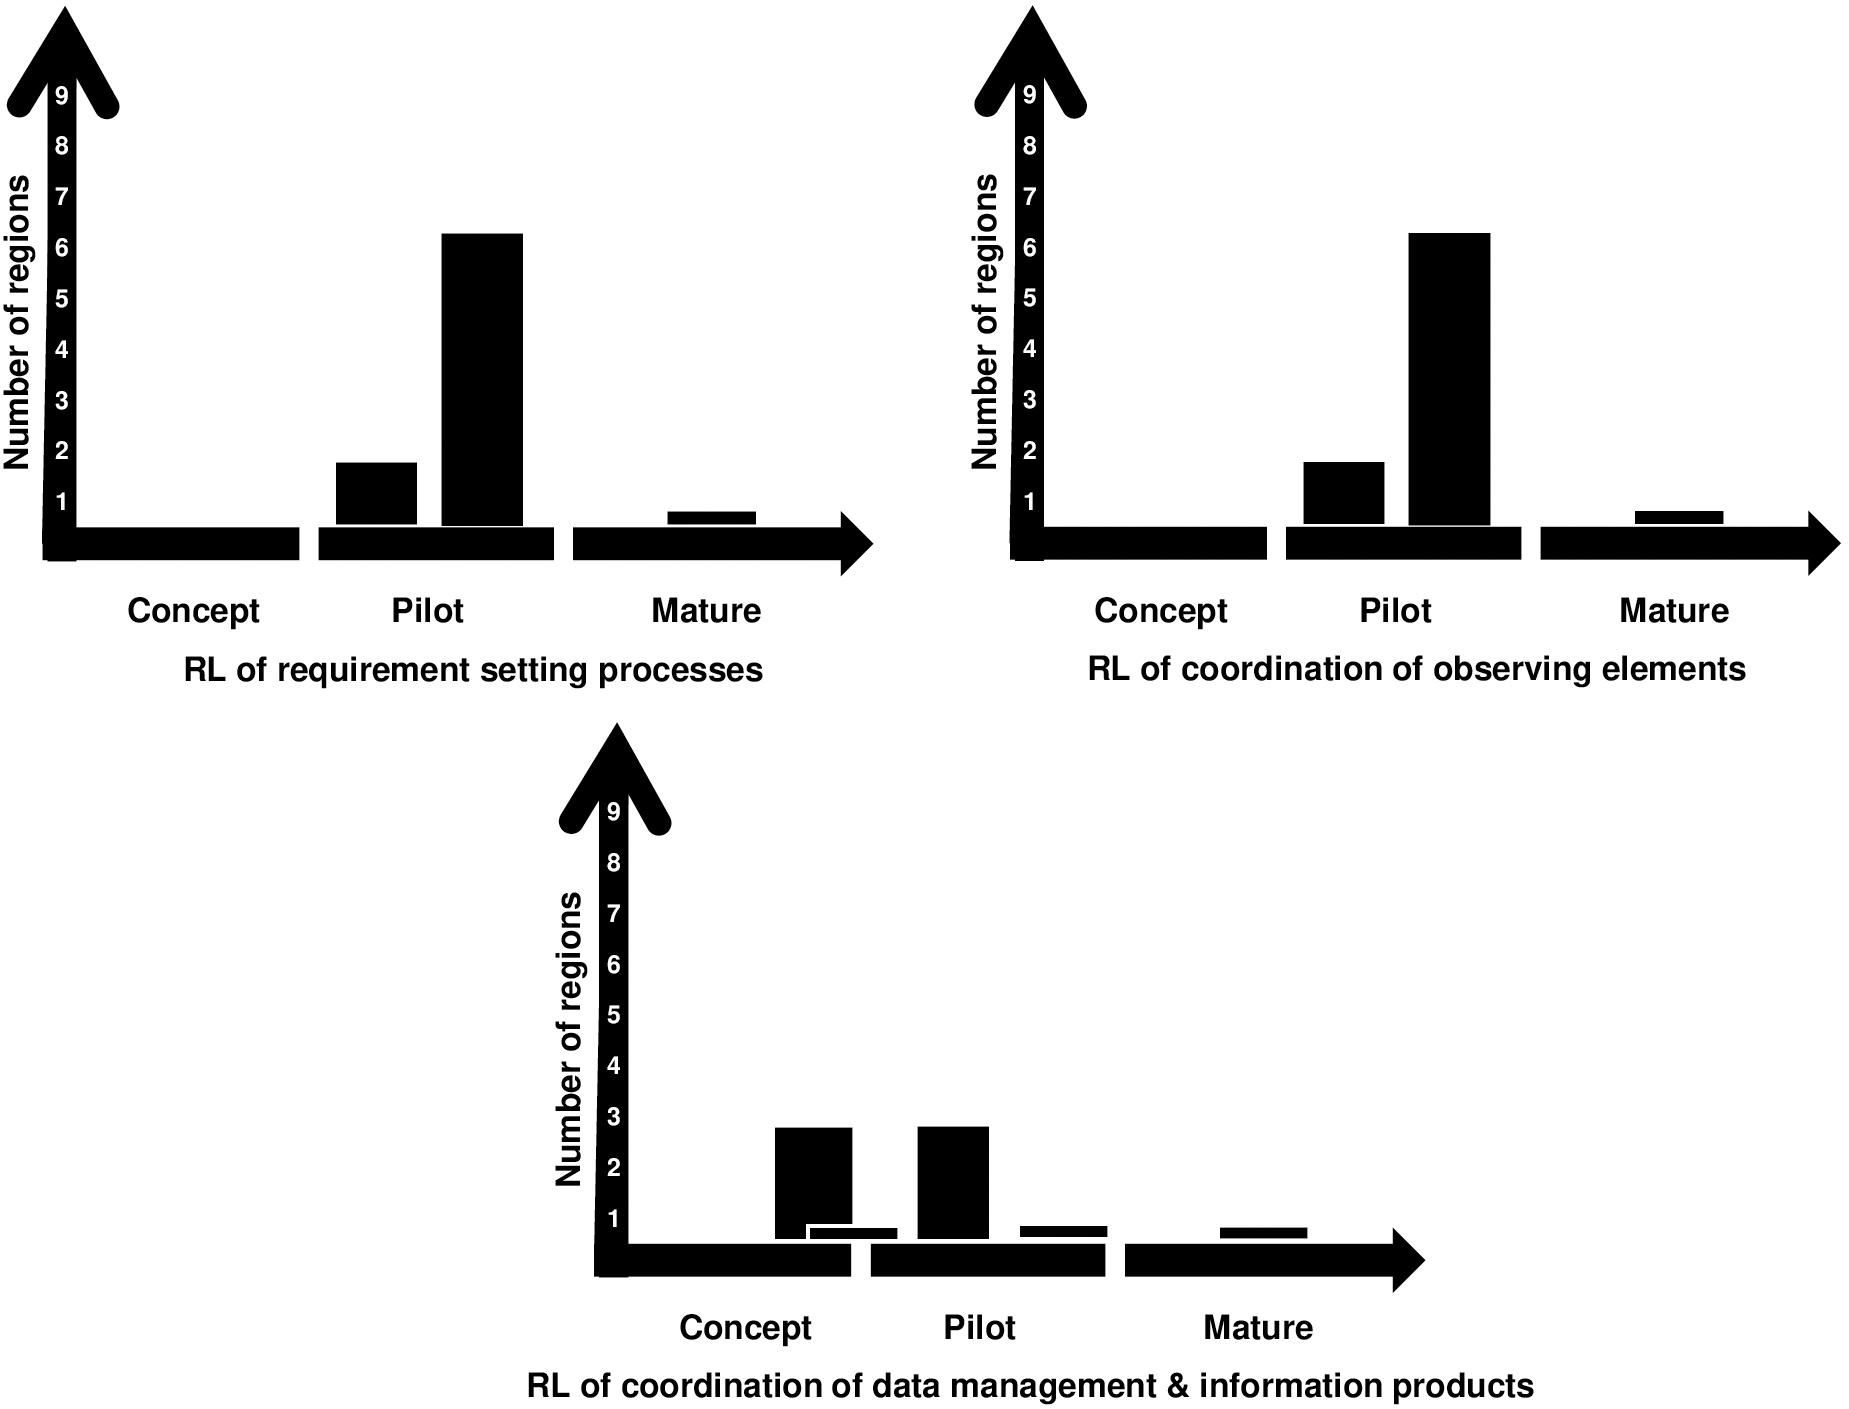
Figure 7. Tentative assessment of readiness levels for Framework for Ocean Observing (FOO) pillars no. 1, 2, and 3 for all selected oxygen minimum zone (OMZ) regions.
Coordination of Observing Elements: The Second FOO Pillar
The second FOO pillar (FOO2) sheet “Coordination of Observational Elements” seeks to answer the question “What do we (currently) measure, how and which coordination?” Here we are equally interested in learning about what phenomena are being observed and which parameters are being measured—both are closely linked to the scientific approach that has been selected in the FOO1. To assess the readiness level of FOO2, first a list of questions was formulated in the questionnaires (Table 3). The analysis was made by building a master answer file with all EBS regions and designing a graphical representation of the synthesized information (Figures 8–10).
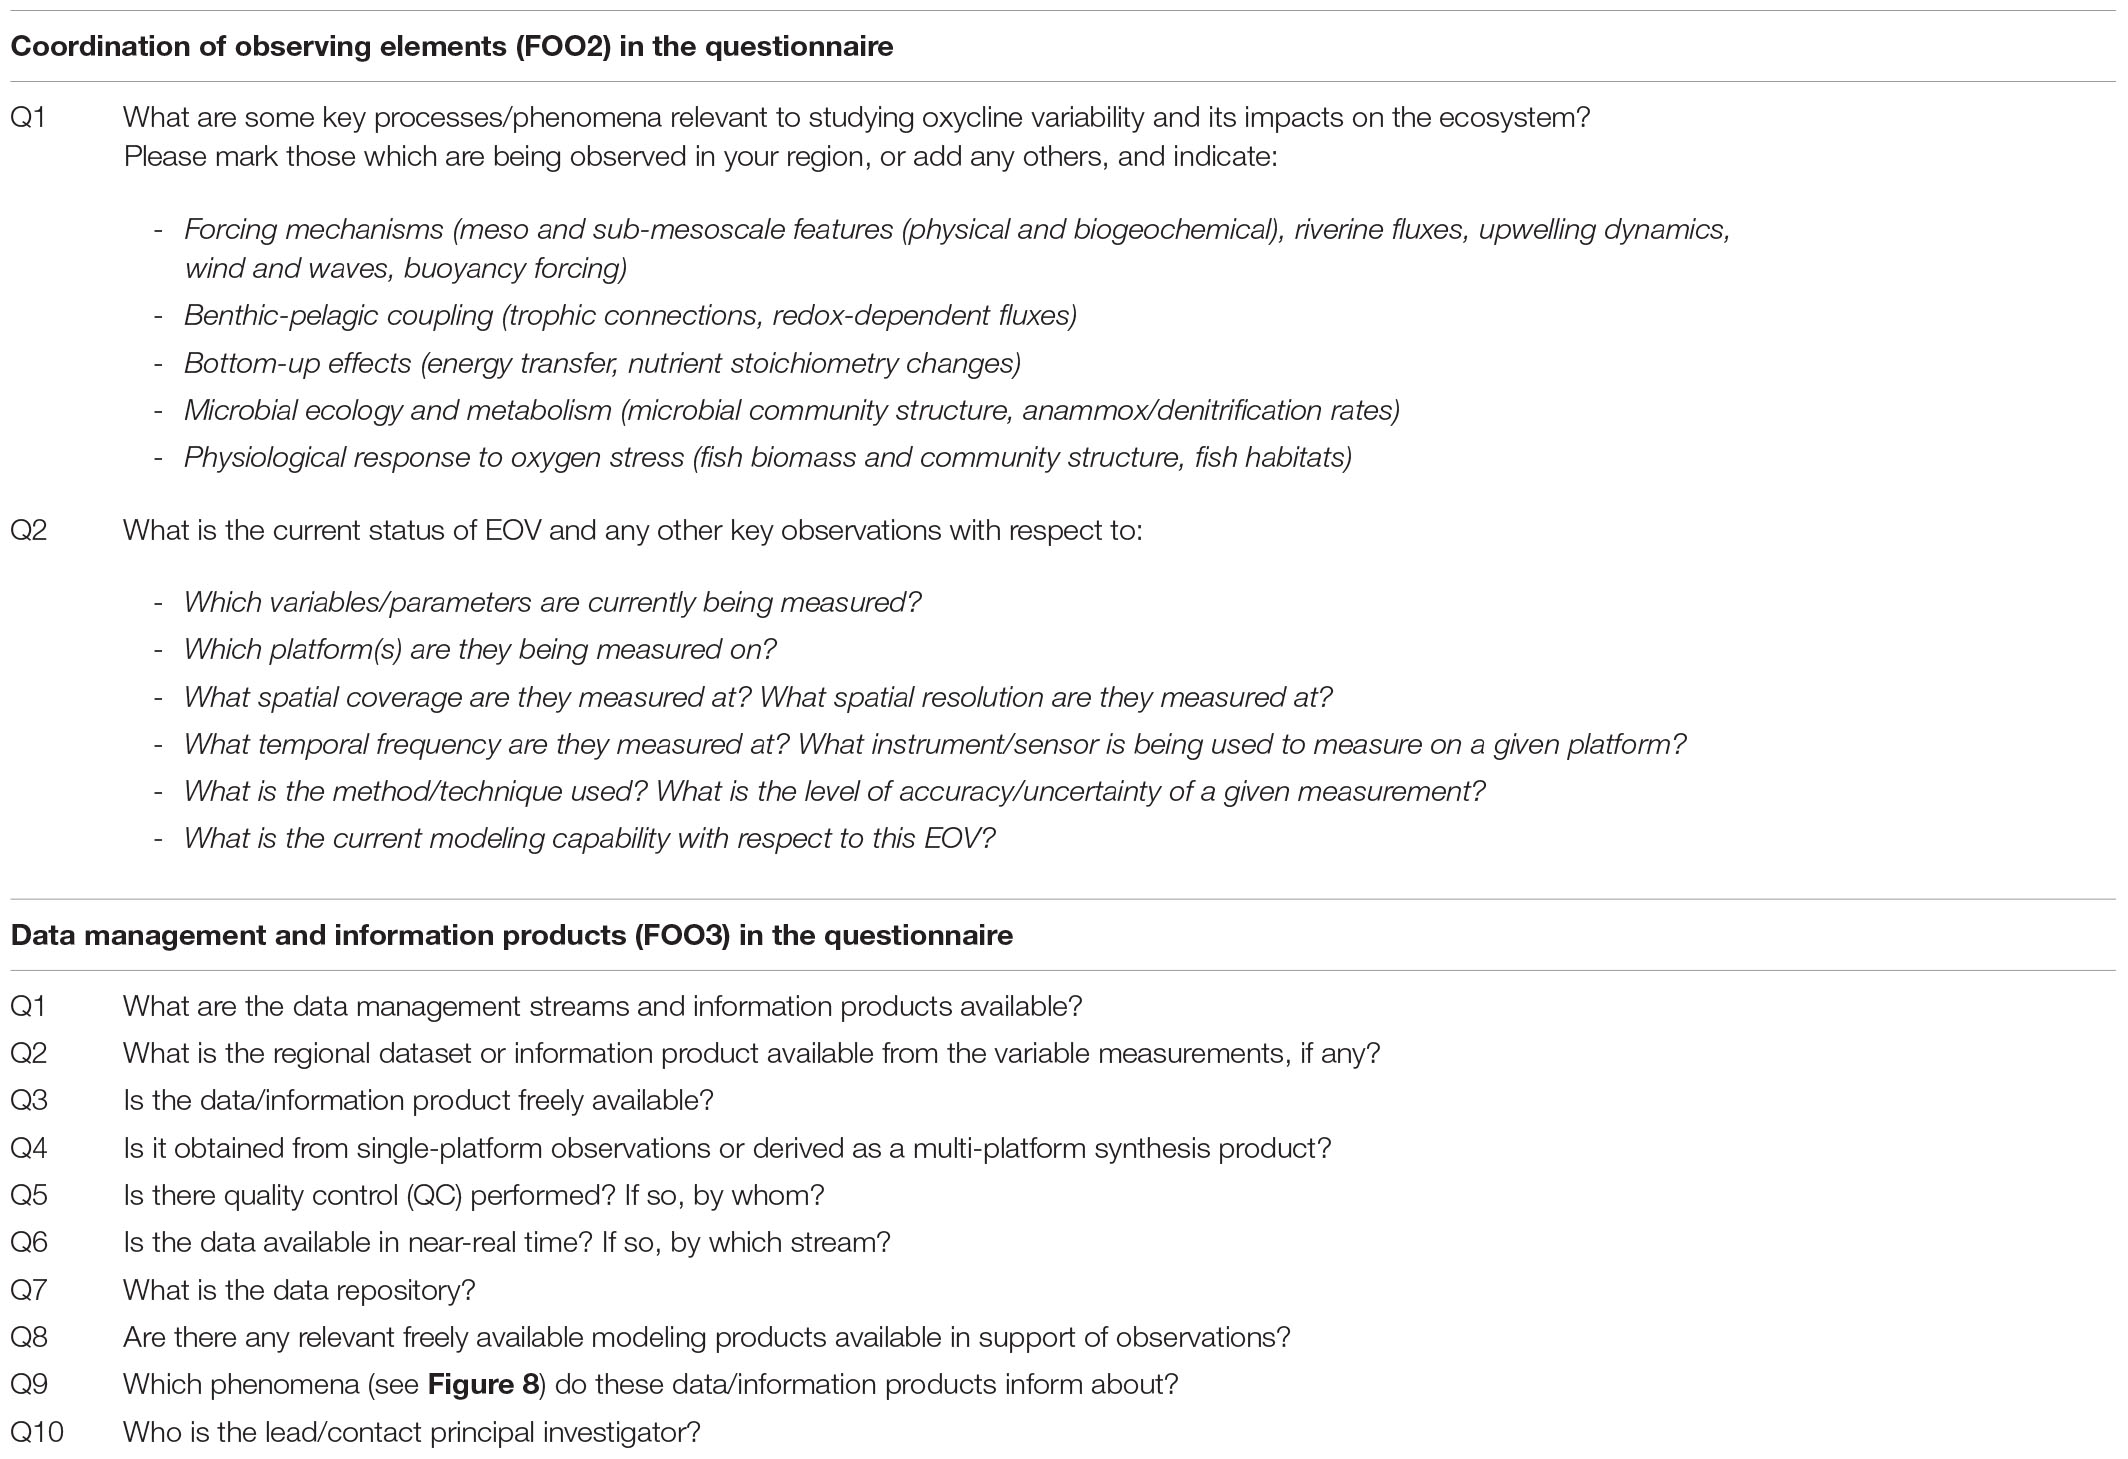
Table 3. List of questions in the questionnaires related to FOO2 and FOO3.
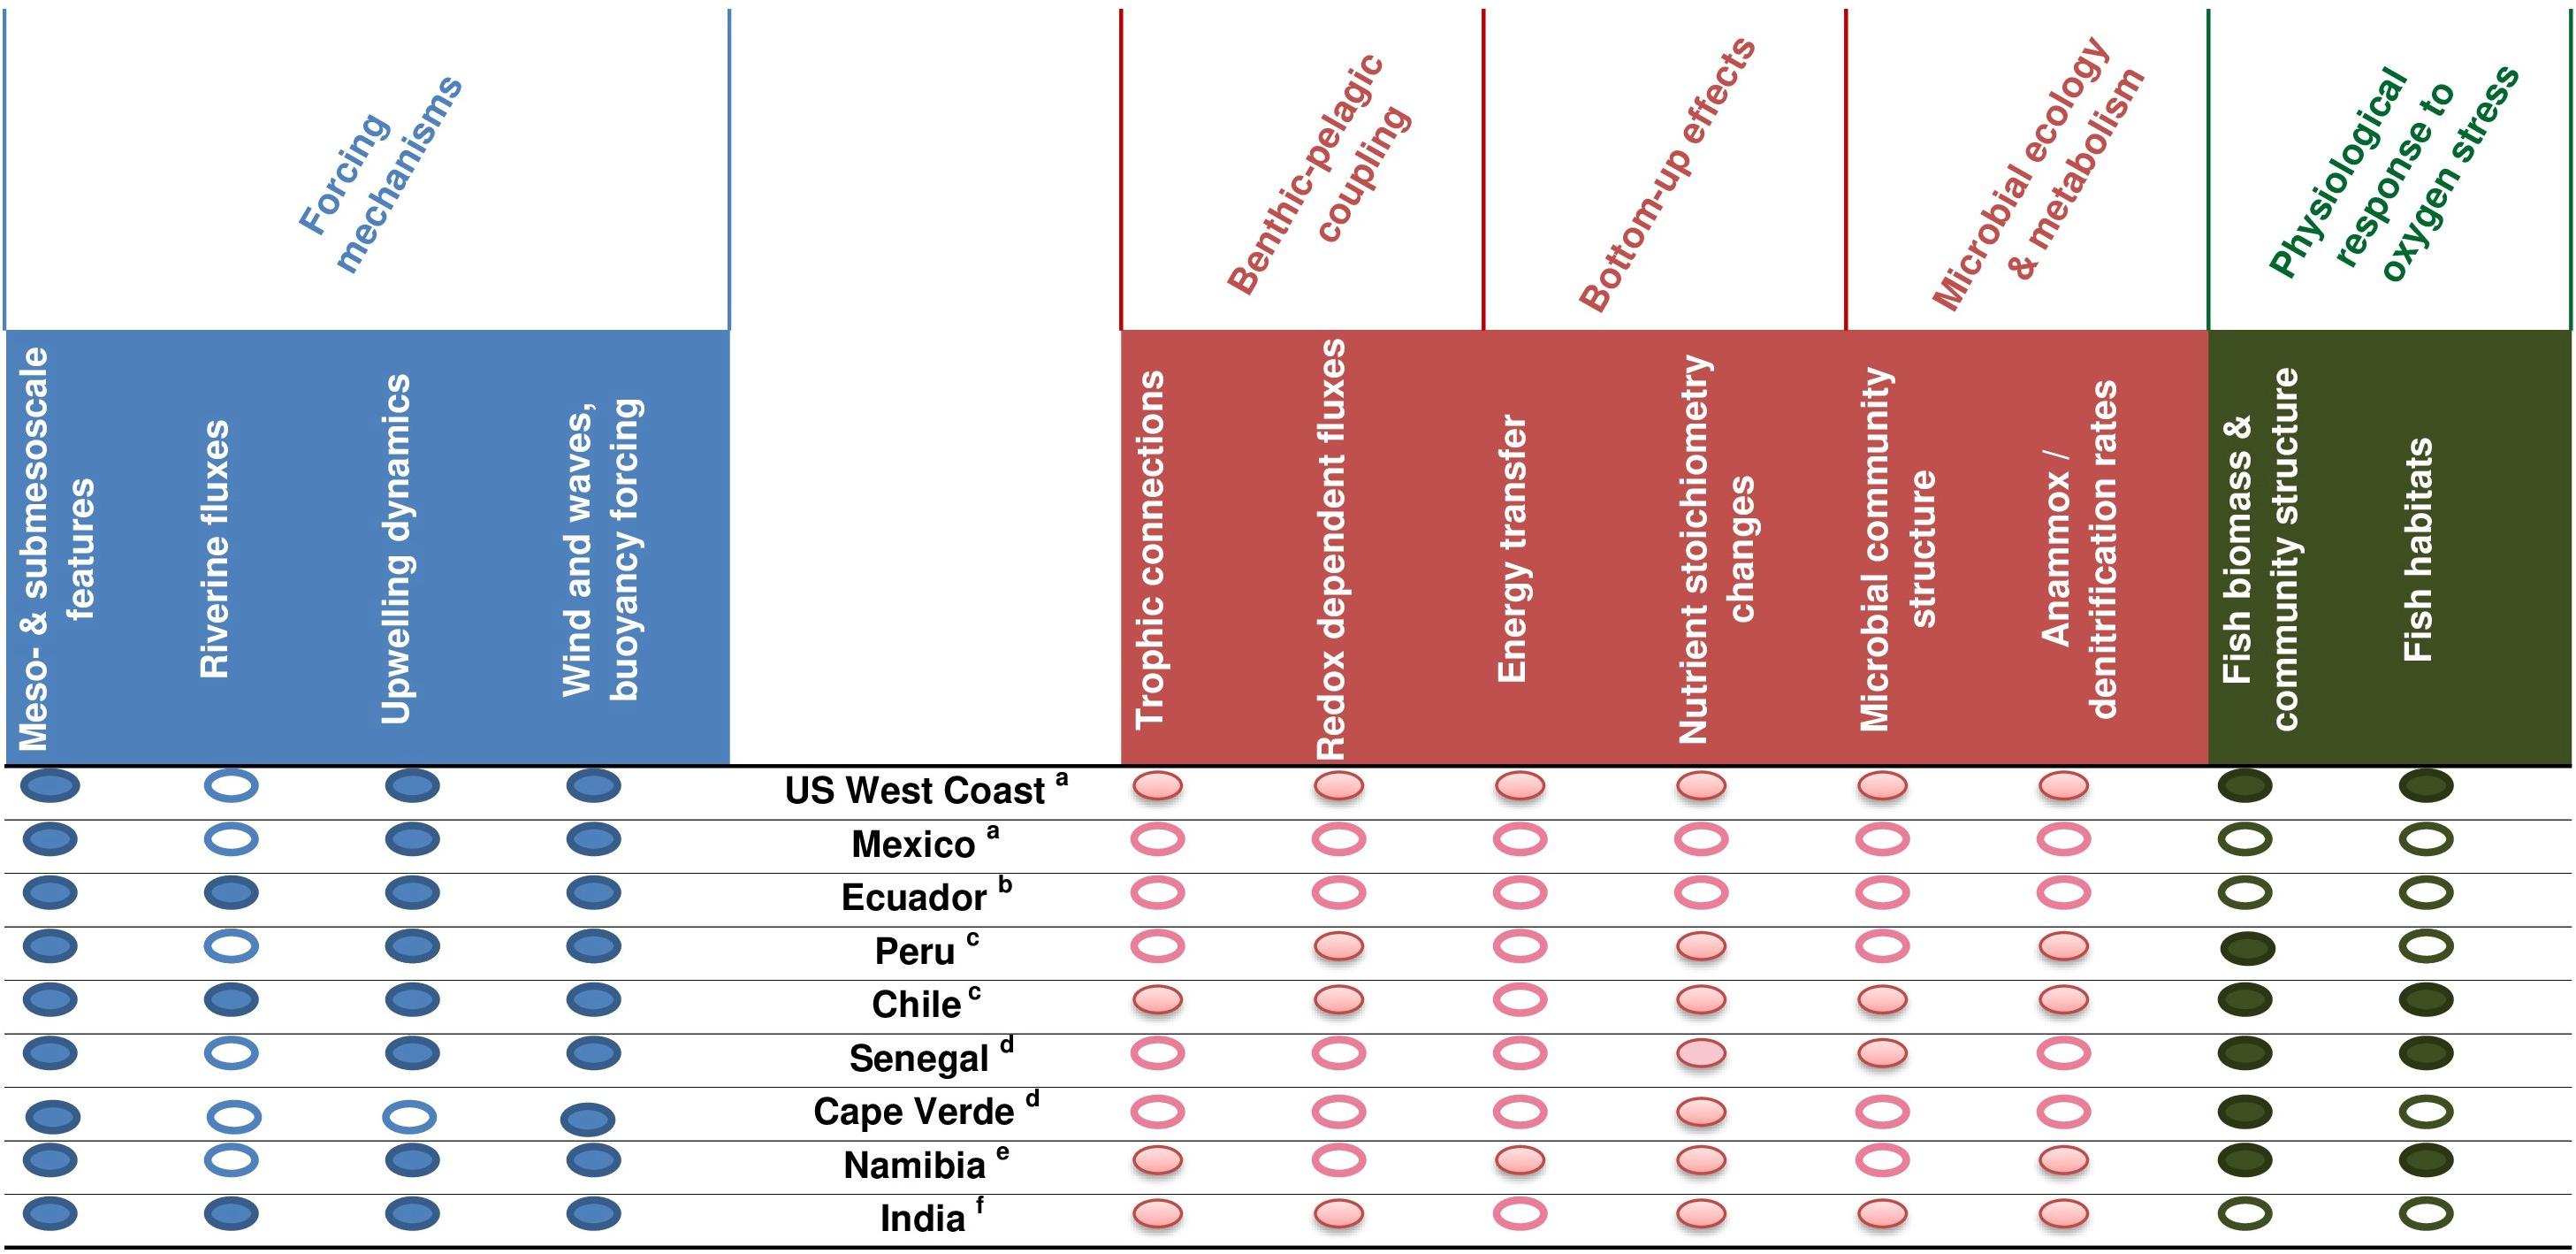
Figure 8. Key phenomena relevant for studying oxycline variability and its impacts on the ecosystem as documented for each oxygen minimum zone (OMZ) selected region, and based on the questionnaire responses. Symbols as in Figure 5.
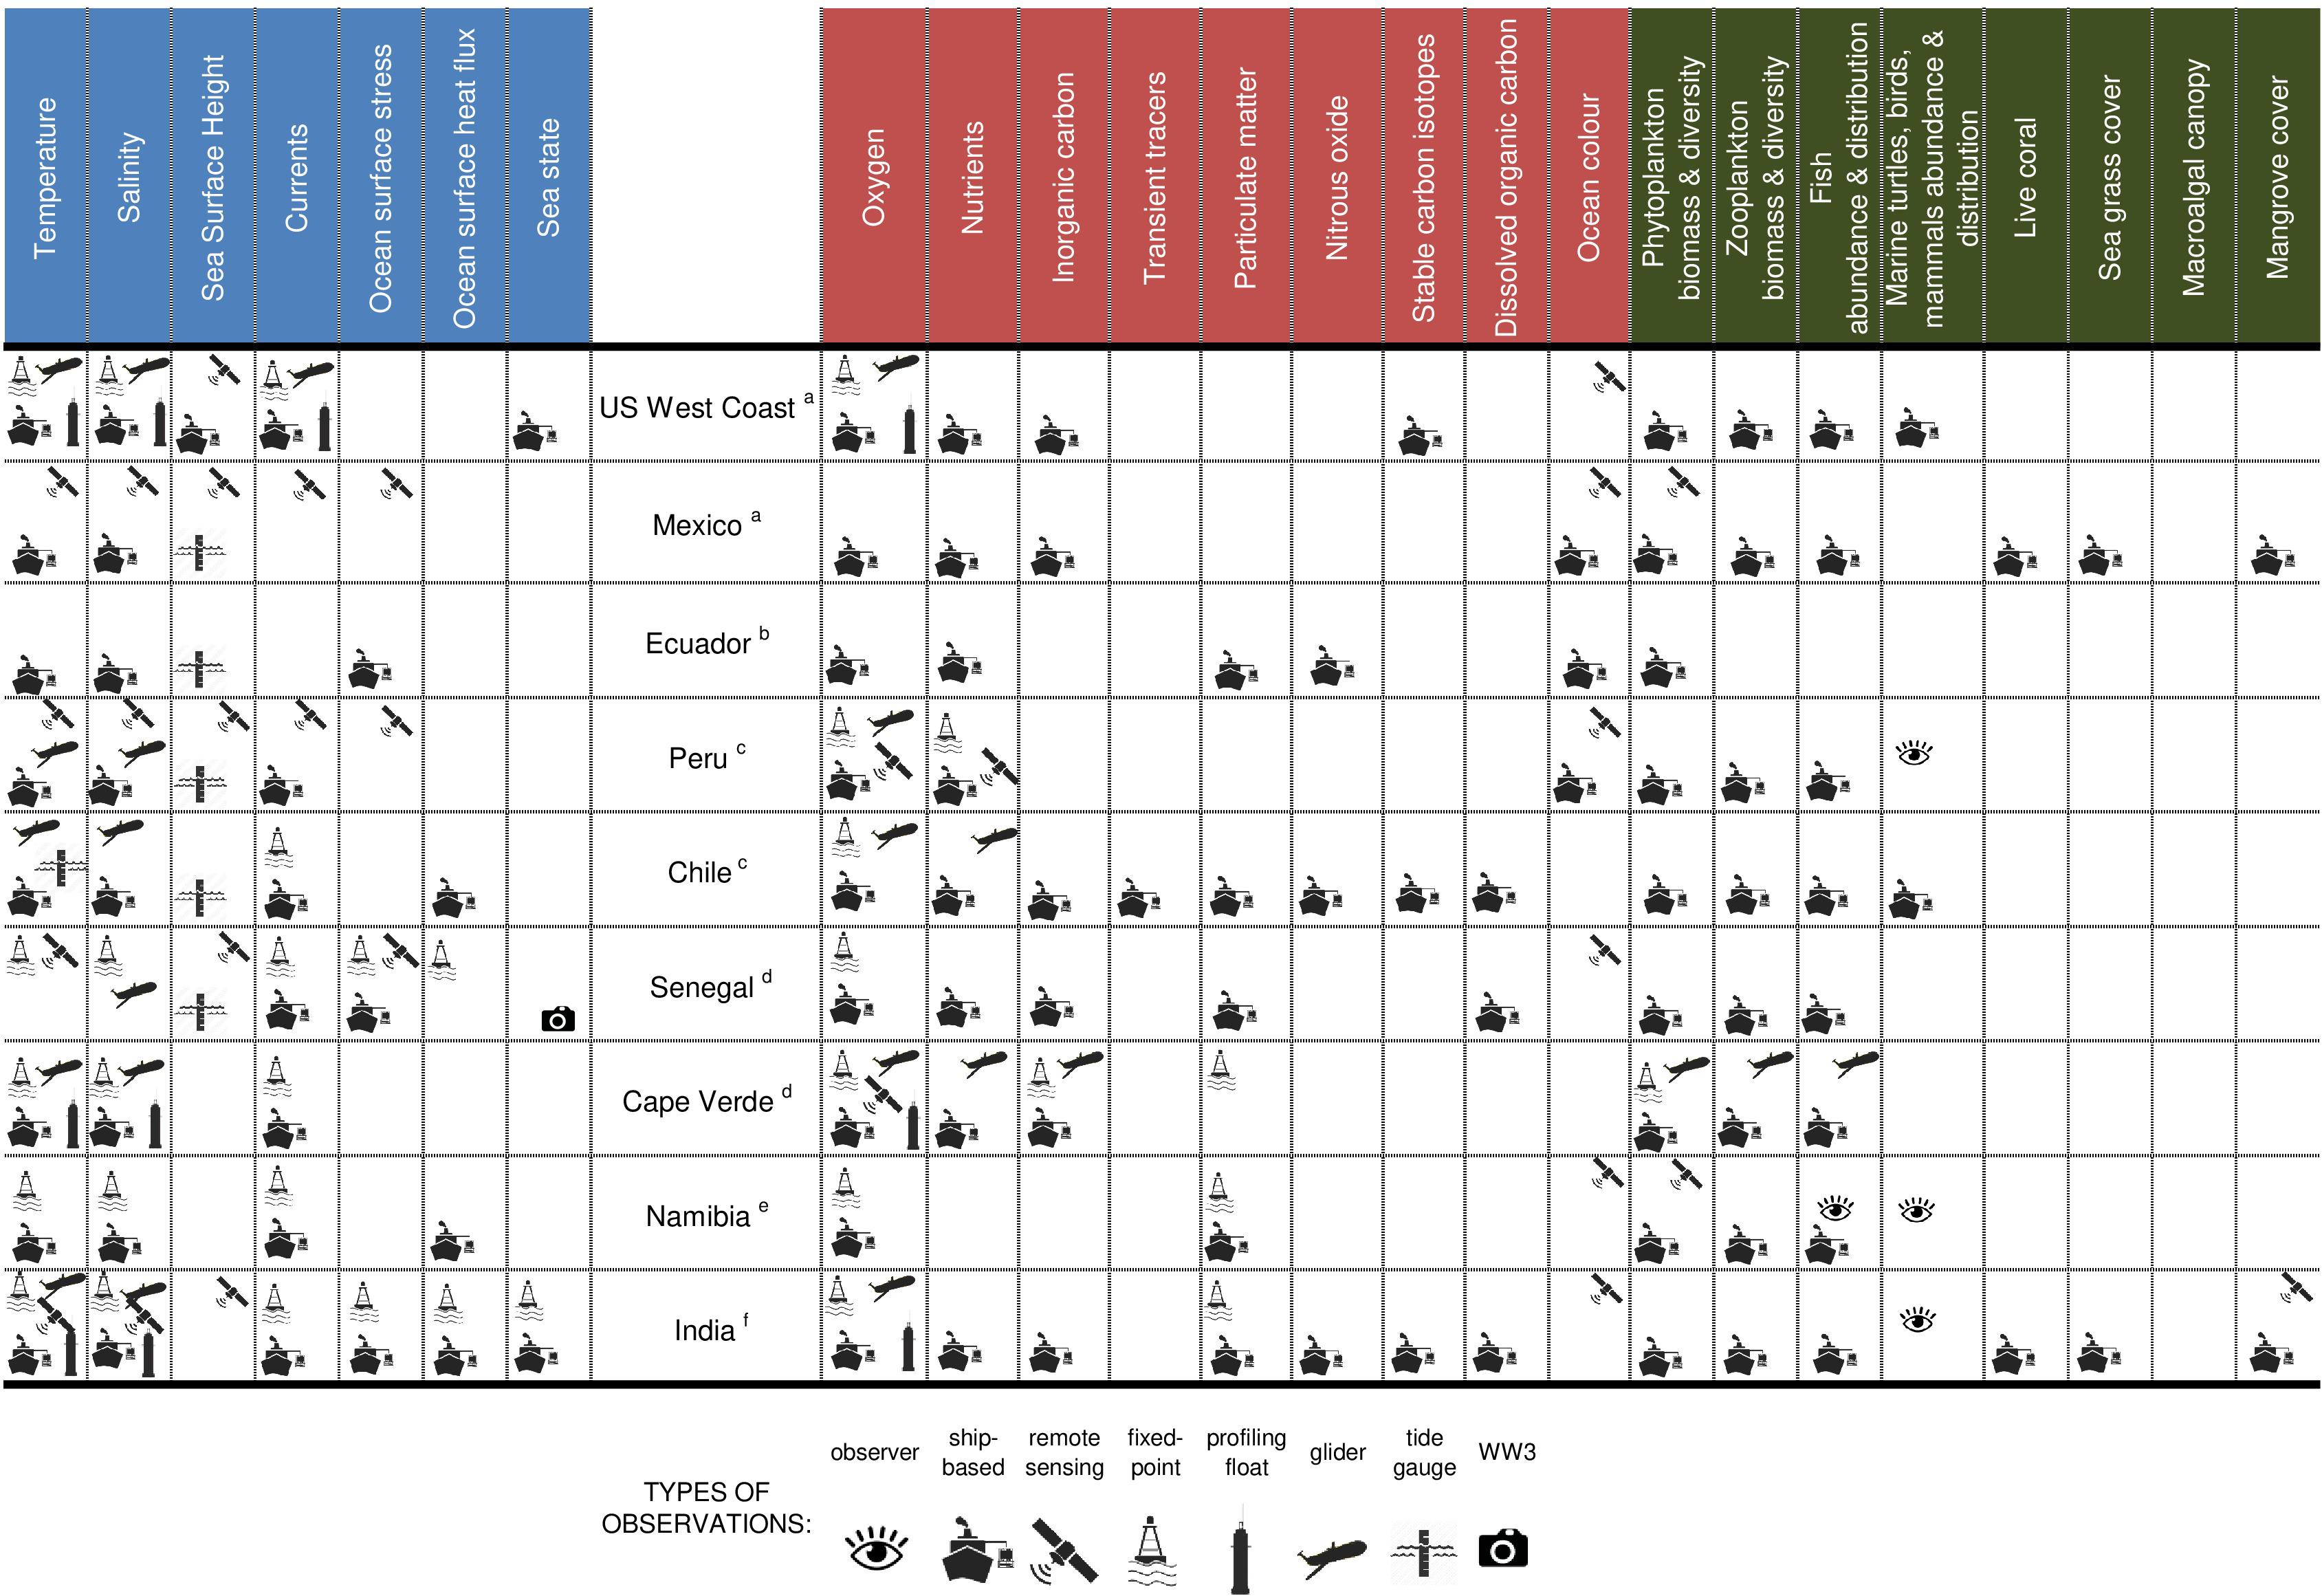
Figure 9. Current status of essential ocean variable (EOV) measurements with respect to phenomena being monitored (see Figure 8) in all oxygen minimum zone (OMZ) regions. Different icons represent different observing approaches. Please note that the same symbol is used for hydrographic surveys and ships of opportunity lines (grouped under “ship-based”), one symbol for all: “fixed-point” observations (buoys, moorings), and one symbol for all “remote sensing” (airborne, satellite, etc.).
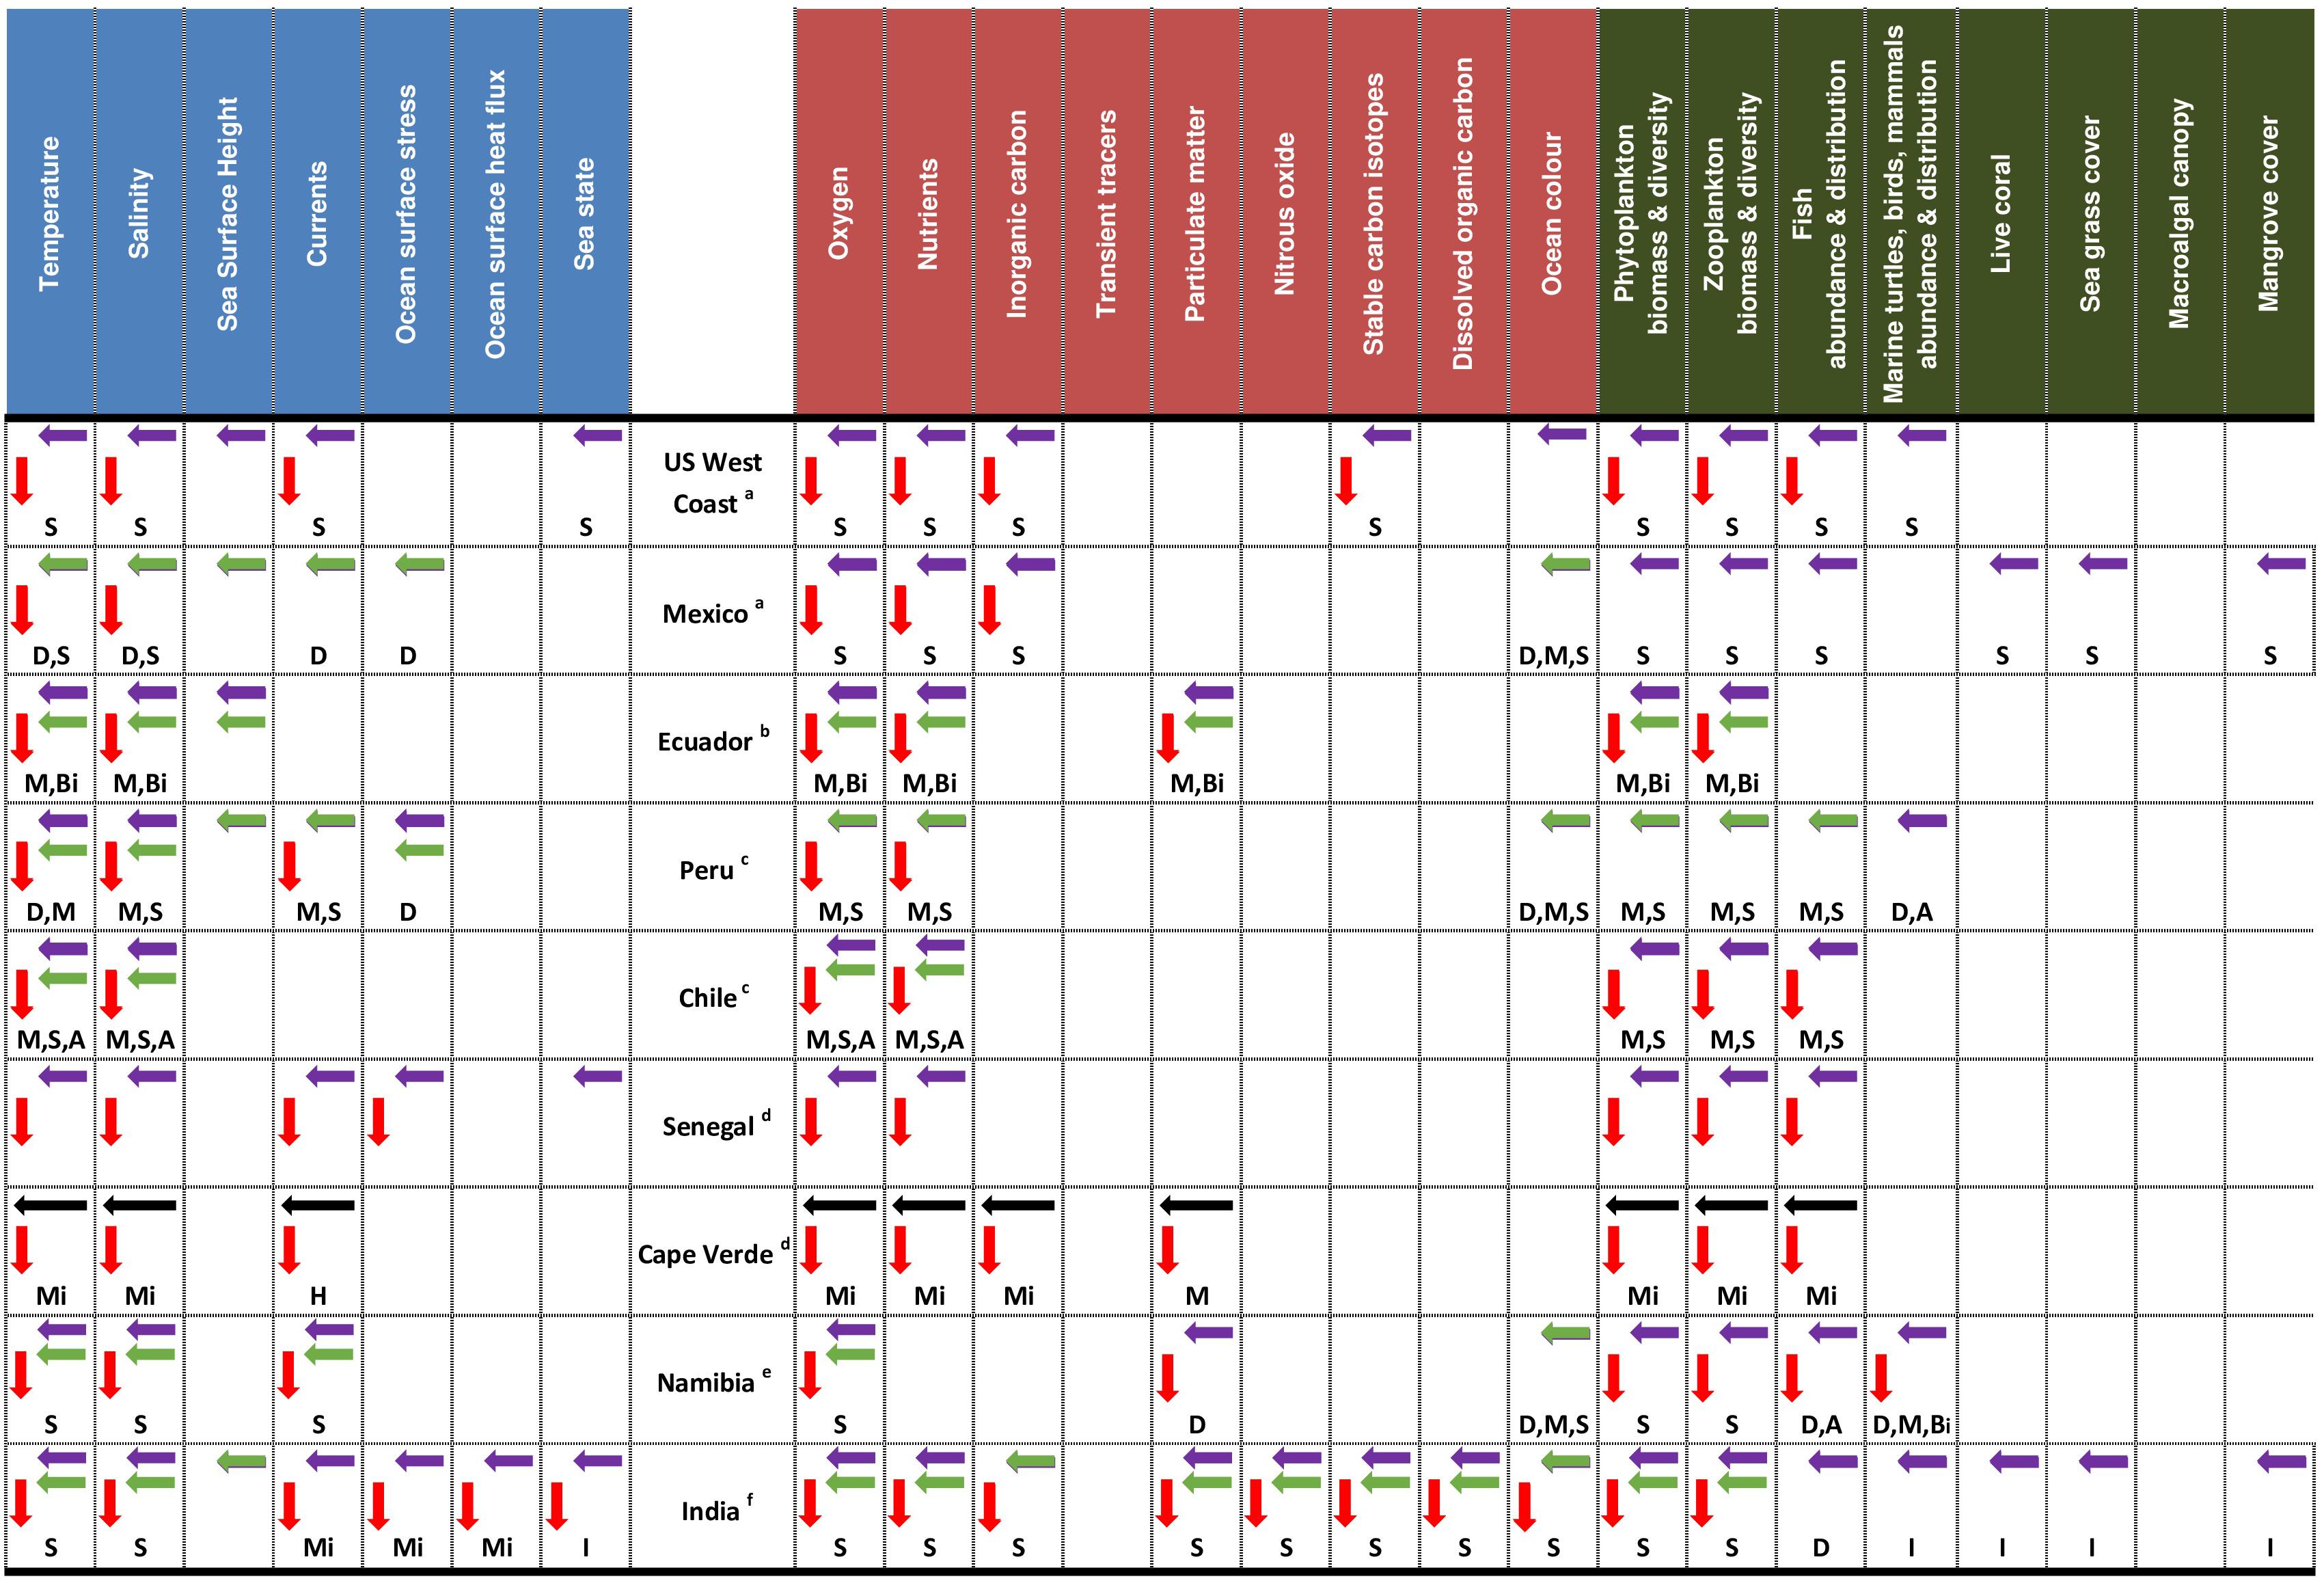
Figure 10. Spatiotemporal resolution and geographical coverage of all essential ocean variables (EOVs) in the oxygen minimum zone (OMZ) regions. Definition of symbols used: A annual, Bi biannual, S seasonal, M monthly, W weekly, D daily, H hourly, Mi minutes, and I irregular. Arrows indicate: mesoscale (black), regional (green), coastal (purple), depth (red).
It is important to note that answers to FOO2 questionnaires include observations which are project based (short lived) and national based (long term). Even if the sequence of project-based observing is almost continuous in some regions, this is still a gap in the system design because of all the contingencies (funding, asset sharing, etc.). It is then difficult from our questionnaires to firmly conclude on continuity of measurements over a decade or so for the selected OMZ regions.
Figure 8 provides a synthesis of all answers for the OMZ regions keeping in mind the mentioned caveats. What stands out is that the forcing mechanisms are well monitored using many of the physical EOVs, namely, temperature, salinity, wind stress, currents, sea surface height, and sea state, as are some of the biogeochemical EOVs (oxygen, nutrients). Riverine fluxes are addressed by three out of the nine OMZ regions. Regions offered quite distinct answers for biogeochemical and ecological phenomena. The US West coast documents all phenomena listed using many of the biogeochemistry, biology, and ecosystem EOVs. Many phenomena are covered in the Peru–Chile Current system, West Africa, and the Northern Indian Ocean, utilizing the basic EOVs, i.e., oxygen, nutrients, plankton, and fish biomass. Stable isotope work is used for trophic interactions investigations in the Northern Benguela Current System. Modeling work for food web studies and fish biomass and community structure is also carried out in the Northern Benguela and off West Africa.
Although fisheries rank first in the list of priorities of societal drivers, not all regions answered positively to fish habitat mapping with respect to oxygen levels and fish biomass and community structure.
Our challenge, and one of the objectives of VOICE, is to use ongoing and planned EOVs from ocean observing to characterize the oxycline in EBS regions and related changes in the temporal and spatial dynamics of the neighboring OMZ, with additional analyses and postprocessing to provide relevant information easily taken up by fisheries management. This will require both the ocean observing and fisheries science communities to change their ways of doing business. The ocean observing community will need to think about “looking up from beyond conventional EOVs to physical and biological features relevant to fish” as they pursue the analysis of observing data and merging it with other data streams (e.g., fish/fisheries monitoring data). The fisheries scientific community will need to be willing and receptive to “look down the food web to physics” to incorporate these new ocean observing products into their analyses that can then relate to management-relevant metrics. Such interdisciplinary analyses are feasible but will require a high degree of collaboration between the two scientific communities.
The second list of questions for the FOO2 intended to gather more detailed information on the observing platforms being used, which are a response to the spatiotemporal frequency of acquisition, coverage, etc., that are the result of the scientific approach selected in the FOO1. They are given in Table 3.
Figure 9 provides a list of platforms used in EBS regions. Some countries do not maintain moorings in their coastal or open ocean waters nor do they make use of autonomous vehicles. They use ship surveys, tide gauge networks, remote sensing, and ships of opportunity for monitoring the classical physical, biogeochemical, and biological EOVs. A few regions use a wide variety of platforms, including moorings, ships, and autonomous vehicles such as buoys, gliders, and floats, and remotely sensed data for covering a large number of EOVs. Some regions have multidisciplinary moorings addressing physical and biogeochemical EOVs and use autonomous technologies for both physical and biogeochemical EOVs. Almost all regions mention the use of satellite information.
All Pacific regions and Senegal off West Africa deploy and maintain tide gauges. Senegal uses cameras on their shores to document sea state. Ecuador is systematically using ships of opportunity. Overall, the physical EOVs are well documented; the situation is slightly different for biogeochemical EOVs: oxygen, nutrients, inorganic carbon, particulate matter, and ocean color are the most covered, but for biology and ecosystem EOVs, only plankton biomass and diversity as well as fish abundance and distribution are covered. Our questionnaire results suggest that top marine predators are less surveyed, and live coral, mangrove, and sea grass cover are rarely surveyed; however, additional surveys may be ongoing that are not known to the participants of the VOICE group.
Regions employ different strategies for observation of EOVs in space and time providing varying resolutions (Figure 10). Some regions perform regular seasonal surveys for many of the physical, biogeochemical, and ecological EOVs. Others tend to show higher frequency in monitoring; some physical EOVs are measured daily or even more frequently on moorings. Other regions go down to a monthly frequency, for physical, biogeochemical (oxygen, nutrients, inorganic carbon, particulate matter), and biological (phytoplankton, zooplankton, and fish) EOVs. Some countries perform only coastal surveys, whereas others combine coastal and open ocean surveys. Figure 10 cannot be considered as a reliable picture of national sustained observations in all EBS regions due to the limitations of the questionnaire design mentioned earlier. Project-based observing may be designed to address specific scientific questions on a couple of year time scale, setting, for instance, the choice of platforms/sensors and spatiotemporal resolution. Observing efforts in some regions include international capabilities so the overall picture might not entirely reflect the national potential for truly sustained multidisciplinary observations set to address the original requirement. This variability points to the needs to understand the observing system methodologies and uncertainties. Where “Best Practices” (Pearlman et al., 2017, 2019) can be used, the comparability of measurements can be significantly improved. Broad propagation and adaption of best practices methodologies can address this.
Considering the synthesis of information regarding this FOO pillar on coordination of observation elements as illustrated in Figures 8–10 and the master information, we can then empirically attribute a range of levels within the mature, pilot, or concept readiness levels, considering the detailed description of each readiness level (UNESCO, 2012; Table 1). For instance, all regions exceeded the concept level, with six of them at levels 4 and 5, two at level 4, and one at level 8. Figure 7 presents the suggested allocation of readiness level assessment for all selected EBS regions.
Data Management and Information Products: The Third FOO Pillar
The third FOO pillar (FOO3) “Data management and information products” seeks to summarize “How are the data managed, integrated, and converted into ocean products?” This entails stating raw data and information product availability to the public, quality control (QC) protocols, data repositories, etc. As the outputs of the framework, data and information products will be the interface for most users. Ocean information products are required to support decision making in diverse areas such as climate studies and adaptation, disaster warning and mitigation, commerce, and ecosystem-based management. Although the product-based verification of how well the initial requirements are met is theoretically a good approach, we cannot assess this feedback here for lack of sufficient information on the information products or how comprehensively they were treated in the questionnaire. Here, we simply synthesize the listed information products (fish stock assessments, model forecasts, climatologies, etc.) mentioned in the EBS regions keeping in mind that we are not closing the loop from scientific outputs to ecosystem services and that such a product-based verification should be the next step to be carried out within the regions.
The participants were asked to identify the existing raw data collected and/or information products derived from data and used by stakeholders in connection with the issue of changing OMZs and the impact on EBS in the VOICE context, grouped by EOVs or other key measurements performed in the region. For each product, it was requested that the availability to the public, QC protocols, and data repositories be identified. Only EOVs and their data products that exist in the region and which are (or could be) of relevance to VOICE are to be mentioned.
Figure 11 depicts the main answers to the list of questions in Table 3 for FOO3. The low number of database repositories with free access and, in some cases, the inadequate application of standardized QC procedures for data management of certain EOVs should be noted. Some regions offer data availability upon request for many EOVs, either physical, biogeochemical, or related to biology and ecosystems. Few regions measure all EOVs, apply the appropriate QCs, and make the data freely accessible. For physical EOVs such as temperature and salinity, almost all regions perform QC exercises. Currents, wind stress, and sea state are rarely quality controlled, and very few databases exist. About half of EBS regions apply QC measures on biogeochemical, biological, and ecosystems EOVs. Remotely sensed data such as sea surface height and ocean color are usually well utilized since these databases are open access. Upper trophic levels, live coral, macroalgal canopy, seagrass, and mangrove covers are the least monitored and seem not to be archived in any database. However, there are likely more activities related to variables that our questionnaire did not capture, for instance, the fisheries databases for large pelagic fish compiled by several regional fisheries management organizations (RFMOs) whose areas of competence encompass the EEZ part of the OMZ in studied EBS regions.
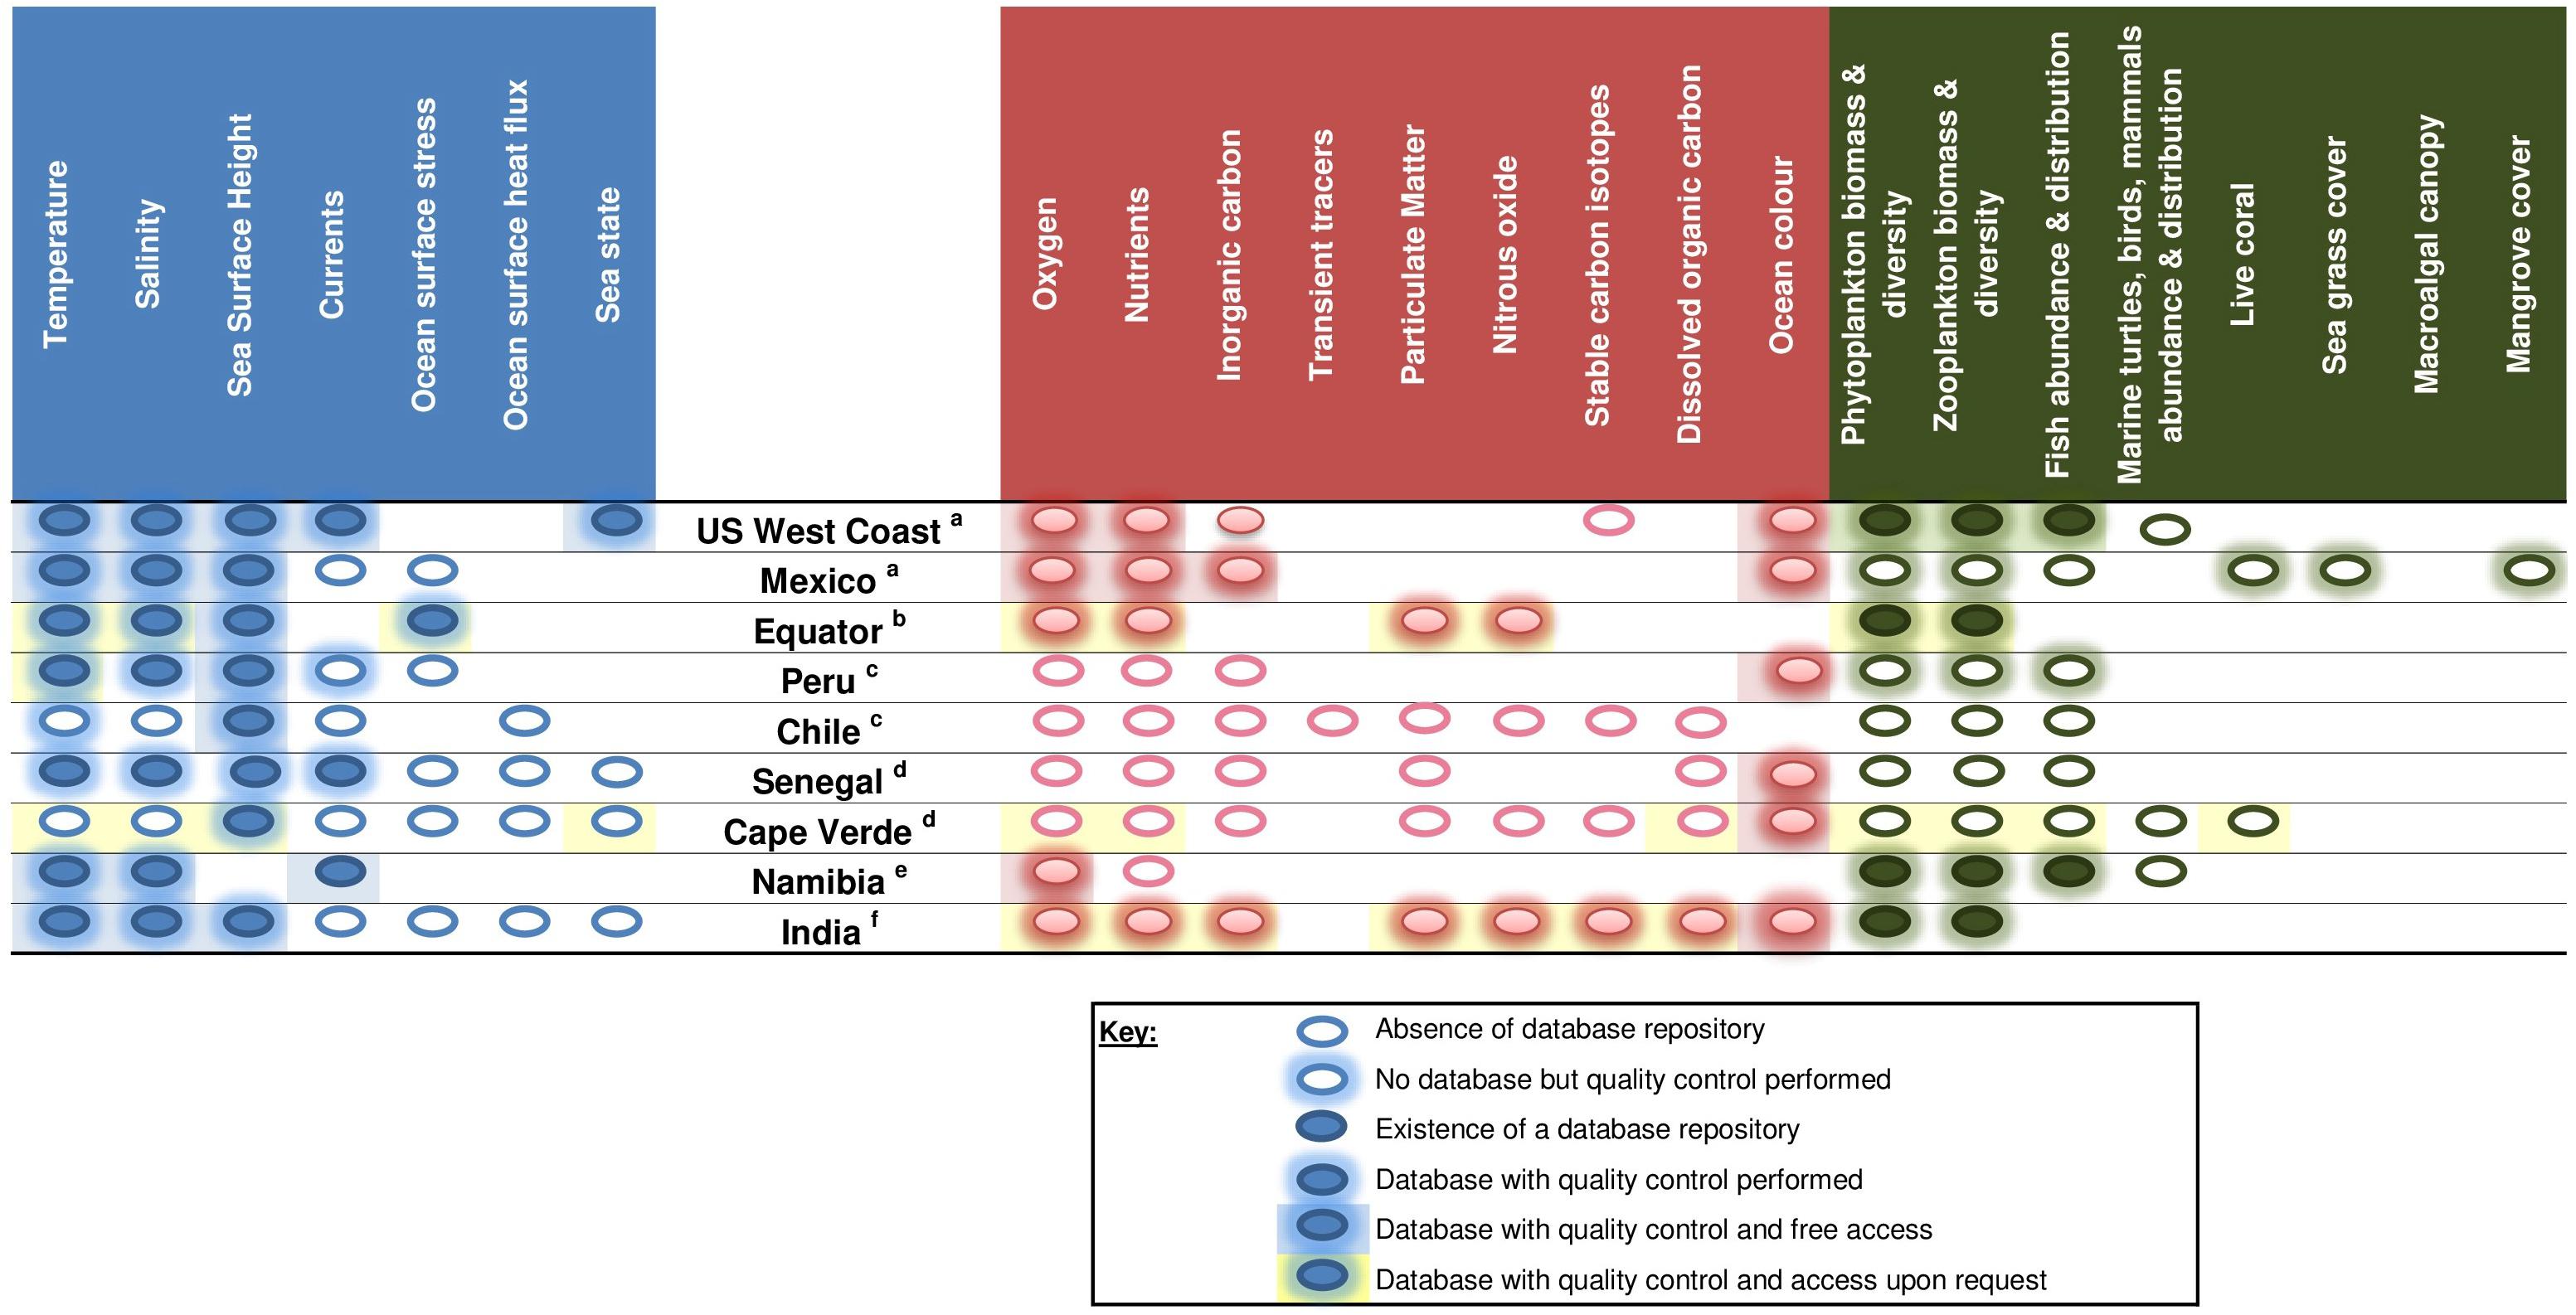
Figure 11. Current status of data management and information product delivery with respect to essential ocean variables (EOVs) in the oxygen minimum zone (OMZ) regions participating in the readiness level assessment.
With respect to information products listed in the questionnaires, some regions have produced either data climatologies (Peru, Namibia), parameter maps, data visualization tools, time series or parameter sections and figures, and indices (US West Coast, Peru, Cape Verde, and Namibia) and make modeling results available (Senegal, Namibia).
Considering the synthesis of information regarding the FOO3 on data management and information products as illustrated in Figure 11 and the master information, we can then empirically assign a range of levels within the mature, pilot, or concept readiness levels, considering the detailed description of each readiness level (UNESCO, 2012; Table 1). For this FOO3 pillar, all regions were spread from levels 3–8. Figure 7 presents the suggested attributed readiness level assessment for all EBS selected regions. Considering the three broad categories of FOO pillars (concept, pilot, and mature), our EBS regions fall into either the pilot or mature categories for the first two pillars, whereas for pillar FOO3, the distribution of EBS regions ranges from concept to pilot to mature categories. These assessments are tentative because they were based on the information provided by targeted individuals and not based on any comprehensive survey of all observing system managers and stakeholders.
Recognition of Gaps
We undertook the first readiness level assessment of ocean observing for OMZ/EBS guided by the observing strategy as outlined in the FOO. Our assessment is an initial step toward recommendations for a fit-for-purpose ocean observing system capable of providing key information products and informing society about various observing objectives related to the variability of the oxycline and its impact on the marine ecosystem in EBS. Some caveats and precautions have been put forward in FOO Readiness Level Assessments in VOICE Regions related to the task of defining and assigning the readiness level for the FOO pillars.
Our questionnaire process likely presents a disciplinary bias, in that insufficient attention was paid to the monitoring of certain biology and ecosystem EOVs. These include turtle, bird, mammal abundance, and distribution EOVs, fish EOVs, or habitat type EOVs, in which cases regional champions often did not manage to consult with specialists in the field. This is true despite the fact that all regions identified fisheries as their primary ocean observing objective. This bias is particularly important to note in the case of higher trophic level species as they constitute key indicators of marine ecosystem health. Future assessments should ensure wider consultation with local experts, RFMOs, and international networks, such as the Climate Impacts on Oceanic Top Predators—a regional program of the Integrated Marine Biosphere Research.
The selected OMZ regions responded individually to the questionnaire for fish abundance and distribution EOV. For large pelagic fisheries, the Secretariats of the tuna RFMOs, namely, WCPFC (West Pacific), IATTC (East Pacific), ICCAT (Atlantic), and IOTC (Indian) compile catch, effort, and size data provided by the national administrations on the basis of scientific sampling. Commercial fisheries data are available in aggregated format (1° or 5° spatial grid) through these RFMOs. High-resolution information is held in national databases but is not available for public use. Exchange agreements may have to be negotiated for access to these data. This may explain the lack of integration of oceanographic data from oceanographic programs with fisheries including biological and environmental data. These RFMOs may lack the purely oceanographic and biogeochemical expertise. Initiatives are under development in ICCAT and IOTC toward ecosystem assessments incorporating biophysical interactions (Juan-Jorda et al., 2018a, b). Added expertise based on the integration of relevant sustained oceanographic observations would be very welcome by these stakeholders.
The issue of linkages between the three FOO pillars appeared to be a major weakness of the overall FOO concept making the readiness level assessment individually for each pillar a challenging task.
The gaps identified during this study varied but included gaps in the design of the questionnaire and survey itself, the observing network itself, a lack of communication between national agencies, or limitations in the use of data for public distribution and the lack of public distribution of important data; all of these contribute to not fulfilling elements of the overall ocean observing value chain. Certainly, our ad hoc designed questionnaire (Tables 2, 3) and likewise the execution of the survey would very much be improved by following strict protocols (Burns and Kho, 2015; Krosnick, 2018) and consulting with social science experts not represented in the VOICE group.
Gaps in Questionnaire/Survey Design and Analysis
The accuracy of a questionnaire depends on the quality of questions chosen and distributed to the respondents, namely, structured versus open questions, instructions with the survey questionnaire, short and concise questions, unbiased questions, questionnaire should undergo pilot testing, limitation of both response and non-response bias, unbiased and representative sample of the respondents population, and assessment of the clarity and transparency of the reporting of the survey results. We acknowledge that our approach has inherent weaknesses since it did not comply with the previously cited protocols. All authors decided to merge the analysis that could be done on each region. This might be an additional weakness of the analysis since maturity levels vary depending on regional capabilities and including differences or similarities across regions and how these gaps affect the readiness levels within FOO pillars for OMZ regions could improve the process for the development of the VOICE network.
Gaps in Requirement Processes
Fisheries and ecosystem management were identified as a highly relevant ecosystem service and societal impact of (changing) EBS in all of the study regions surveyed, as was biodiversity and ecosystem conservation. These activities often occur together and, in some situations, can interfere with each other when their activities overlap with shared species or in space.
Gaps in Coordination of Observation Elements
A lack of secured funding for observations impairs the sustainability of observing systems. It was recognized by the responses to questionnaires that a large uncertainty about ship access exists, the most important observing platform according to the questionnaire. This uncertainty varies of course according to regions, but it seems a robust risk. Currently, research ships are often not properly maintained or too costly to rent by research institutions and there are issues with ship management and sometimes ship equipment.
Wind stress is important in EBS and also a critical factor in oxygen dynamics, but it is not monitored everywhere. However, satellite information could be more widely used as wind stress products tailored for coastal applications now exist. The wind products are able to provide information on coastal winds, including the wind drop off close to the coast in upwelling regions.
The observing capacity for the particulate matter EOV is not fully developed. Ships of opportunity are only considered a valuable platform by Ecuador. Another major gap is the lack of sampling efforts on the seafloor/benthos compared to the pelagic zone. Benthic processes are also important in considering the oxycline. For example, the oxycline frequently shoals nearshore, and in areas with shallow OMZs, inner shelf dynamics may affect the oxycline.
As pointed out above, further integration of fisheries-related observations with oceanographic data from oceanographic programs is needed and planned. A pathway for information flow to link OMZs to EBS fisheries has yet to be developed to allow appropriate measurements of oxycline variability to be integrated with existing fish monitoring data (fishery-independent surveys that include biological, acoustic, and oceanographic observations), with fisheries data (catch, vessel trips), fishing vessel logs and acoustics data, and available process data (e.g., behavior from tagging, laboratory experiments on effects of low oxygen) for fish species of interest.
The observing networks that coordinate the technical and data aspects of the observing platforms promote and encourage the creation of standard operation procedures (SOPs) and manuals that are considered “Best Practices” in the respective community. Many SOP/manuals are available for almost all platforms, variables, and sensors,7 but a community-accepted recommendation is often missing. Because the observing networks best know their technology, they are tasked with providing the QC and quality assurance (QA) of the data. However, it should be mentioned that even in cases where no QA/QC has been applied to data, the integration process can enable a second QA/QC from the intercomparison of data, which is part of the third FOO pillar.
There is also a significant gap in the interoperability of data and its processing. The identification of best practices and methodologies that can be offered to and then adopted by the regional observing programs will impact both the observation quality and end products. Consistent QA/QC will also help to understand the uncertainty and real variability of observation data. Best practices in QA/QC, and more generally in observation and archiving techniques, are “available” but not easily accessible because they are scattered across the web or in diverse repositories.
Gaps in “Data Management and Information Products”
The third FOO pillar requires the largest human resources input to increase readiness levels in EBS regions (Figure 7). For the Angolan EBS, Tchipalanga et al. (2018) demonstrate how capacity development combined with a release of observational data can create new ocean observing products. The existence of databases, application of standardized QC procedures for real-time data, and development of data repositories or increased accessibility of data repositories are critical issues. Routes to be followed in addressing these issues will have to be discussed and agreed upon, considering national budget and staff constraints and varying policies but also international opportunities and cooperation.
There is presently no simple and direct connection between the Food and Agriculture Organization and GOOS databases. Fisheries management can be complicated and is typically species and region specific, but there are several metrics that widely resonate with fisheries management (Hilborn and Walters, 2013). These include weight at age (reflects growth), fecundity (egg per individual by age or size), recruitment (annual number surviving from eggs and larvae to a predetermined size, age, or date), natural mortality rate, and a quantity termed “catchability” that relates sampled densities of individuals (e.g., number per tow) to the number of individuals in the stock. Although there are several encouraging examples of OMZs (e.g., US West coast, Northern Benguela, Peru–Chile Current system) information being linked to fisheries and fisheries management processes (Rose et al., 2019), oxycline variability, along with other environmental parameters, is not quantitatively used for developing stock assessment estimations and for the management decision-making process, for most of the VOICE regions.
The lack of standard procedures and best practices for data methods and QC is a barrier to releasing and integrating data for many regions.
Marine aquaculture was also among the top societal drivers in the responses to our questionnaires. It is a rapidly growing sector responding to the need to feed a growing global population. Sea ranching techniques range from fattening tuna in pens off Mexico to growing scallops in Tongoy Bay, Chile. Since aquaculture relies on raising animals in fixed locations, and often deals with high densities of animals, oxycline variability, affecting oxygen and pH conditions, can be an important concern. As aquaculture continues to grow, there will be opportunities to further incorporate data collection on EOVs relating to the oxycline in EBS regions, as well as developing management strategies that make use of data products from existing observational systems. This is a good example of an important societal impact of our work.
Conclusion and Recommendations
Building on the FOO strategy, we present a readiness level assessment for multidisciplinary ocean observing to monitor a key parameter, the upper oxycline, in highly productive and economically important EBS that neighbor the major OMZ of the world ocean, namely, the US West coast, the Southern California Current system off Mexico, the Equatorial Eastern Pacific off Ecuador, the Peru–Chile Current system, West Africa off Senegal and Cape Verde Islands, the northern Benguela off Namibia, and the Northern Indian Ocean (Bay of Bengal, Arabian Sea).
The assessment was executed as a major contribution to an anticipated end product of the VOICE initiative—a blueprint for a multidisciplinary and sustained ocean observing system in economically important EBS regions. A prerequisite for optimization is the disclosure of the observing efforts and other elements of the ocean observing value chains in the EBS regions. An ad hoc questionnaire was designed and distributed to scientists and stakeholders of selected EBS regions. Both the design of the questionnaire and the selection of stakeholders are open to substantial improvement, e.g., by consulting experts in survey design and execution. Regional champions were identified for the VOICE regions that provided input addressing all the value chain/FOO elements: requirement processes, coordination of observational elements, data management, and information products. The questionnaire responses revealed a variety of observing requirements linked to the variability of the oxycline and its impacts on the ecosystem in EBS regions. An assessment of readiness level for existing observing, data availability, and integration is provided and synthesized to inform local, regional, and even global stakeholders. We found that an observing strategy for fisheries and ecosystem management exists in all EBS regions, but maturity levels and observation capabilities differ. The readiness level for the VOICE elements is derived for the regions and points at system weaknesses. A major weakness is the difficulty to easily connect fisheries-related data and oceanographic databases. Potential routes for developing strategies for readiness level improvements include the need to provide interoperable oxygen and other environmental data that are colocated with fisheries data in space and time so they can be easily taken up in the fisheries management process and also by the marine aquaculture sector. The feasibility of such interdisciplinary analyses will be key to the optimization of the ocean observing value chains in the upwelling EBS regions.
Some immediate recommendations based on the assessment that will enhance ocean observing value chains in OMZ neighboring EBS regions include (in no particular order):
• Develop strategies to connect ocean observing design to social scientists, economists, industry, and other groups at regional (up to EEZ of respective EBS) and global scales to perform proper readiness level assessments. In an ideal world in each region, this could be achieved through a carefully designed survey, dedicated regional workshops with all key actors present (including scientists from the physical, biological, biogeochemical oceanography and biodiversity sectors, fisheries scientists, relevant stakeholders) and in defining either a target population of respondents or selecting a sample representative of the respondent population. The key is to bring together multiple end users of the ocean to make informed and coordinated decisions about identifying where and how an ocean area is to be used for which goal and which resources.
• Greatly enhance capacity building development in EBS regions to unlock new opportunities for data use and data integration, such as the use of remote sensing as an easy way to foster the use of satellite data.
• Provide access to and training for customized regional ocean products for the obvious benefits of regional ecosystem analysis but likewise to increase the acceptance and willingness to support and engage in ocean observing (e.g., ocean observation devices on fishing boats).
• Modify fish surveys to account for possible effects of the oxycline and ensure that fish surveys include measurements of other parameters typically measured for EBS observing. The vertical discontinuity of echotraces as recorded by research echosounders onboard scientific and fishing vessels can serve as a proxy of the oxycline depth providing high-resolution data of fish school abundances and habitat compression by the oxycline (Bertrand et al., 2011). If one can merge all available datasets together, more knowledge can be gleaned for the system under study. Oxygen and other environmental conditions can then be considered in the stock assessments in EBS regions and the information taken up to inform fisheries management.
• Enhance the observing capacity for the particulate matter EOV by deploying more sediment traps on moorings. However, these require regular servicing and tend to integrate observations over time. Other options are to record particulate backscattering or beam attenuation with sensors implemented on the Biogeochemical Argo floats and/or to measure particulate organic carbon concentrations using Niskin bottles during ship surveys. Remote sensing algorithms for measuring particulate organic carbon perform poorly in upwelling regions and greater attention should be focused on improving them.
• Encourage all EBS regions to consider ships of opportunity as a valuable platform as is done by Ecuador. All regions could benefit from deployment of Expendable Bathythermographs on commercial shipping lanes to obtain temperature profiles of the top 400, 800, or 1500 m of the water column. Since some commercial lanes follow the South American and African coast lines, some regions, e.g., Peru and Chile, and Senegal and Namibia could share the instrumentation to be set up on board. This will feed predictive coupled models with regular observations, thus improving their forecast capacities.
• Sustain and constantly improve routine observing efforts (e.g., satellite missions) and downstream services, e.g., as provided in Europe by the “Copernicus Marine Environment Monitoring Service.”8
• Foster more international collaboration, especially when crossing EEZ waters. For instance, within the auspices of the GOOS Regional Alliance for the South-East Pacific region, scientist exchanges occur, but the sharing of methodologies, protocols and best practices, raw data, and the intercalibration of sensors remains to be done. The first step would be to link the scientists to the globally coordinated observing networks and to encourage use of the IODE OceanBestPractices System9 (Pearlman et al., 2019).
• Include in future VOICE-type multidisciplinary ocean observing assessment a wider community of scientific experts (higher trophic level species as key indicators of marine ecosystem health to fully account for Biology and Ecosystems EOV observing efforts in the EBS regions).
• Improve the interoperability of data by adopting the Findable, Accessible, Interoperable, Reusable10 data principles and motivate for the exchange and implementation of common methods in observations and data processing. It is recommended that best practices for the OMZ/EBS be contributed to the OceanBestPractices System.
• Launch a pilot implementation project motivated by the local observing objectives, with a partnership of EBS neighboring countries and relevant service providers and capacity developers, and considering VOICE recommendations.
• Initiate and support routine review of the ocean observing value chain activities in the EBS regions by evaluating primary activities: (i) requirement setting process, (ii) coordination of observation elements, and (iii) data management and information products; and secondary activities: research and development, and human resources. Such an evaluation process could include a science and implementation committee that oversees the adequacy of the scientific approaches used and ensures a seamless link between scientific assessment and information product delivery (e.g., as in the case of the large marine ecosystems or the International Council for the Exploration of the Sea).
Author Contributions
VG, JK, AP, MT, JP, FC, TK, LL, WN, KR, KW, and FM conceived the VOICE initiative. VG, JK, AP, and MT designed and conducted the questionnaires and analyzed the results. TA participated in the responses to questionnaires analysis. DG, LL, NG, BM, IM, WN, GP, DS, EP, MV, BF, HM, MH-A, AV, OP, and MC-D’O provided information in response to the questionnaires. All authors discussed about the questionnaires results and reviewed the manuscript.
Conflict of Interest
The authors declare that the research was conducted in the absence of any commercial or financial relationships that could be construed as a potential conflict of interest.
Funding
All authors would like to thank GOOS Biogeochemistry Panel, OceanObs Research Coordination Network, and the International Ocean Carbon Coordination Project for funding support to the IMSOO-OMZ and VOICE workshops. VG acknowledged support from INSU/CNRS through the SOLAS Global Research Project. JK and AP acknowledged support from European Union’s Horizon 2020 Research and Innovation Program under grant agreement 63321 (AtlantOS). MT acknowledges support from the US National Science Foundation grant OCE-1840868 to the Scientific Committee on Oceanic Research (SCOR, United States). LL acknowledges support from the US National Science Foundation grant N° OCE-1829623.
Acknowledgments
We thank all the IMSOO-OMZ group for engagement and input that was invaluable in conceiving the idea of VOICE. We are grateful to the Monterey Bay Aquarium Research Institute (MBARI) in Monterey, CA, United States, for hosting the first VOICE Science Plan Workshop, and to GEOMAR in Kiel, Germany, for hosting the second VOICE Science Plan Workshop. We thank the questionnaire respondents for their important contributions to the VOICE study. We also thank the two reviewers and the editor, LL, for their constructive comments which helped to improve the manuscript.
Supplementary Material
The Supplementary Material for this article can be found online at: https://www.frontiersin.org/articles/10.3389/fmars.2019.00722/full#supplementary-material
Footnotes
- ^ https://www.seadatanet.org/Metadata
- ^ https://swot.jpl.nasa.gov/mission.htm
- ^ 3Implementation of Multidisciplinary Sustained Ocean Observations
- ^ www.goosocean.org/eov
- ^ http://www.goosocean.org/index.php?option=com_content&view=article&id=14&Itemid=114
- ^ See https://www.oceanbestpractices.net/.
- ^ http://copernicus.eu/main/marine-monitoring
- ^ https://www.oceanbestpractices.org/
- ^ https://www.go-fair.org/fair-principles/
References
Albert, A., Echevin, V., Lévy, M., and Aumont, O. (2010). Impact of nearshore wind stress curl on coastal circulation and primary productivity in the Peru upwelling system. J. Geophys. Res. 115:C12033. doi: 10.1029/2010JC006569
Alegre, A., Bertrand, A., Espino, M., Espinoza, P., Dioses, T., Ñiquen, M., et al. (2015). Diet diversity of jack and chub mackerels and ecosystem changes in the northern Humboldt current system: a long-term study. Prog. Oceanogr. 137, 299–313. doi: 10.1016/j.pocean.2015.07.010
Allison, E. H., Perry, A. L., Badjeck, M.-C., Neil Adger, W., Brown, K., Conway, D., et al. (2009). Vulnerability of national economies to the impacts of climate changes on fisheries. Fish Fish. 10, 173–196. doi: 10.1111/j.1467-2979.2008.00310.x
Astudillo, O., Dewitte, B., Mallet, M., Frappart, F., Rutllant, J. A., Ramos, M., et al. (2017). Surface winds off Peru-Chile: observing closer to the coast from radar altimetry. Remote Sens. Environ. 191, 179–196. doi: 10.1016/j.rse.2017.01.010
Bakun, A., and Nelson, C. S. (1991). The seasonal cycle of wind-stress curl in subtropical eastern boundary current regions. J. Phys. Oceanogr. 21, 1815–1834.
Banse, K., Naqvi, S. W. A., Narvekar, P. V., Postel, J. R., and Jayakumar, D. A. (2014). Oxygen minimum zone of the open Arabian Sea: variability of oxygen and nitrite from daily to decadal timescales. Biogeosciences 11, 2237–2261 doi: 10.5194/bg-11-2237-2014
Barton, A., Hales, B., Waldbusser, G. G., Langdon, C., and Feely, R. A. (2012). The Pacific oyster, Crassostrea gigas, shows negative correlation to naturally elevated carbon dioxide levels: implications for near-term ocean acidification effects. Limnol. Oceanogr. 57:698 doi: 10.4319/lo.2012.57.3.0698
Bednaršek, N., Feely, R. A., Reum, J. C., Peterson, B, Menkel, J., Alin, S. R., et al. (2014). Limacina helicina shell dissolution as an indicator of declining habitat suitability owing to ocean acidification in the California current ecosystem. Proc. R. Soc. B 281:20140123. doi: 10.1098/rspb.2014.0123
Bertrand, A., Chaigneau, A., Peraltilla, S., Ledesma, J., Graco, M., Monetti, F., et al. (2011). Oxygen: a fundamental property regulating pelagic ecosystem structure in the coastal southeastern tropical Pacific. PLoS One 6:e29558. doi: 10.1371/journal.pone.0029558
Bograd, S. J., Buil, M. P., Di Lorenzo, E., Castro, C. G., Schroeder, I. D., et al. (2015). Changes in source waters to the Southern California Bight. Deep Sea Res. Part II 112, 42–52. doi: 10.1016/j.dsr2.2014.04.009
Bograd, S. J., Castro, C. G., Di Lorenzo, E., Palacios, D. M., Bailey, H., Gilly, W., et al. (2008). Oxygen declines and the shoaling of the hypoxic boundary in the California Current. Geophys. Res. Lett. 35:L12607.
Breitburg, D., Levin, L., Oschlies, A., Grégoire, M., Chavez, F., Conley, D., et al. (2018). Declining oxygen in the global ocean and coastal waters. Science 359:6371. doi: 10.1126/science.aam7240
Bristow, L. A., Callbeck, C. M., Larsen, M., Altabet, M. A., Dekaezemacker, J., Forth, M., et al. (2017). N2 production rates limited by nitrite availability in the Bay of Bengal oxygen minimum zone. Nat. Geosci. 10, 24–29 doi: 10.1038/ngeo2847
Burns, K. E. A., and Kho, M. E. (2015). How to assess a survey report: a guide for readers and peer reviewers. Can. Med. Assoc. J. 187, E198–E205.
Chavez, F. P., Bertrand, A., Guevara-Carrasco, R., Soler, P., and Csirke, J. (2008). The northern Humboldt current system: brief history, present status and a view towards the future. (editorial). Prog. Oceanogr. 79, 95–105. doi: 10.1016/j.pocean.2008.10.012
Chavez, F. P., Ryan, J., Lluch-Cota, S. E., and Ñiquen, M. (2003). From anchovies to sardines and back: multidecadal change in the Pacific Ocean. Science 299, 217–221. doi: 10.1126/science.1075880
Craig, J. K. (2012). Aggregation on the edge: effects of hypoxia avoidance on the spatial distribution of brown shrimp and demersal fishes in the Northern Gulf of Mexico. Mar. Ecol. Prog. Ser. 445, 75–95. doi: 10.3354/meps09437
Desbiolles, F., Blanke, B., Bentamy, A., and Roy, C. (2016). Response of the Southern Benguela upwelling system to fine-scale modifications of the coastal wind. J. Mar. Syst. 156, 46–55. doi: 10.1016/j.jmarsys.2015.12.002
Feely, R. A., Sabine, C. L., Martin Hernandez Ayon, J., Ianson, D., and Hales, B. (2008). Evidence for upwelling of corrosive “acidified” water onto the Continental Shelf. Science 320, 1490–1492. doi: 10.1126/science.1155676
Gallo, N. D., and Levin, L. A. (2016). Fish ecology and evolution in the world’s oxygen minimum zones and implications of ocean deoxygenation. Adv. Mar. Biol. 74, 117–198. doi: 10.1016/bs.amb.2016.04.001
Gibbs, M. T., Middleton, J. H., and Marchesiello, P. (1998). Baroclinic response of Sydney shelf waters to local wind and deep ocean forcing. J. Phys. Oceanogr. 28, 178–190. doi: 10.1175/1520-0485(1998)028<0178:brossw>2.0.co;2
Graco, M., Purca, S., Dewitte, B., Castro, C. G., Morón, O., Ledesma, J., et al. (2017). The OMZ and nutrient features as a signature of interannual and low-frequency variability in the Peruvian upwelling system. Biogeosciences 14, 4601–4617. doi: 10.5194/bg-14-4601-2017
Gregory, M. R. (2009). Environmental implications of plastic debris in marine settings –entanglement, ingestion, smothering, hangers-on, hitch-hiking, and alien invasions. Phil. Trans. R. Soc. B 364, 2013–2025. doi: 10.1098/rstb.2008.0265
Gutiérrez, D., Enríquez, E., Purca, S., Quipúzcoa, L., Marquina, R., Flores, G., et al. (2008). Oxygenation episodes on the continental shelf of central Peru: remote forcing and benthic ecosystem response. Prog. Oceanogr. 79, 177–189. doi: 10.1016/j.pocean.2008.10.025
Gutiérrez, D., Akester, M., and Naranjo, L. (2016). Productivity and sustainable management of the Humboldt current large marine ecosystem under climate change. Environ. Dev. 17(Suppl. 1): 126–144. doi: 10.1016/j.envdev.2015.11.004
Hayes, K. R., Clifford, D., Moeseneder, C., Palmer, M., and Taranto, T. (2012). National Indicators of Marine Ecosystem Health: Mapping Project. A Report Prepared for the Australian Government Department of Sustainability, Environment, Water, Population and Communities. Hobart: CSIRO Wealth from Oceans Flagship.
Hilborn, R., and Walters, C. J. (2013). Quantitative Fisheries Stock Assessment: Choice, Dynamics and Uncertainty. Dordrecht: Springer Science and Business Media.
Juan-Jorda, M. J., Murua, H., Arrizabalaga, H., and Hanke, A. (2018a). A template for an indicator-based ecosystem report card for ICCAT. Collect. Vol. Sci. Pap. ICCAT 74, 3639–3670.
Juan-Jorda, M. J., Murua, H., and Andonegi, E. (2018b). An indicator-based ecosystem report card for IOTC – An evolving process. in Proceedings of the 14th Session of the Working Arty on Ecosystem and Bycatch. IOTC–2018–WPEB14–20. 17. Cape Town.
Karstensen, J., Stramma, L., and Visbeck, M. (2008). Oxygen minimum zones in the eastern tropical Atlantic and Pacific Oceans. Prog. Oceanogr. 77, 331–350. doi: 10.1016/j.pocean.2007.05.009
Keller, A. A., Ciannelli, L., Wakefield, W. W., Simon, V., Barth, J. A., and Pierce, S. (2017). Species-specific responses of demersal fish to near-bottom oxygen levels within the California current large marine ecosystems. Mar. Ecol. Prog. Ser. 568, 151–173. doi: 10.3354/meps12066
Keller, A. A., Ciannelli, L., Wakefield, W. W., Simon, V., Barth, J. A., and Pierce, S. D. (2015). Occurrence of demersal fishes in relation to near-bottom oxygen levels within the California current large marine ecosystem. Fish. Oceanogr. 24, 162–176. doi: 10.1111/fog.12100
Keller, A. A., Simon, V. H., Chan, F., Waldo Wakefield, W., Clarke, M. E., and Barth, J A., et al. (2010). Demersal fish and invertebrate biomass in relation to an offshore hypoxic zone along the U.S. West Coast. Fish. Oceanogr. 19, 76–87. doi: 10.1111/j.1365-2419.2009.00529.x
Koslow, J. A., Goericke, R., Lara-Lopez, A., and Watson, W. (2011). Impact of declining intermediate-water oxygen on deepwater fishes in the California current. Mar. Ecol. Prog. Ser. 436, 207–218. doi: 10.3354/meps09270
Koslow, J. A., Goericke, R., and Watson, W. (2013). Fish assemblages in the Southern California current: relationships with climate, 1951–2008. Fish. Oceanogr. 22, 207–219. doi: 10.1111/fog.12018
Koslow, J. A., McMonagle, H., and Watson, W. (2017). Influence of climate on the biodiversity and community structure of fishes in the southern California current. Mar. Ecol. Prog. Ser. 571,, 193–206. doi: 10.3354/meps12095
Krosnick, J. A. (2018). Assessing the accuracy of survey research in D. Vannette, and J. Krosnick, (eds) The Palgrave Handbook of Survey Research. Cham: Palgrave Macmillan. doi: 10.1007/978-3-319-54395-6_1
Levin, L. A. (2003). Oxygen minimum zone benthos: adaptation and community response to hypoxia. Oceanogr. Mar. Biol. 41, 1–45.
Luyten, J. R., Pedlosky, J., and Stommel, H. (1983). The ventilated thermocline. J. Phys. Oceanogr. 13, 292–309. doi: 10.1175/1520-0485(1983)013<0292:tvt>2.0.co;2
McNatt, R. A., and Rice, J. A. (2004). Hypoxia-induced growth rate reduction in two juvenile estuary-dependent fishes. J. Exp. Mar. Biol. Ecol. 311, 147–156. doi: 10.1016/j.jembe.2004.05.006
Naqvi, S. W. A., Jayakumar, D. A., Narvekar, P. V., Naik, H., Sarma, V. V. S. S., D’Souza, W., Joseph, S., and Georg, M. D. (2000). Increased marine production of N2O due to intensifying anoxia on the Indian continental shelf. Nature 408, 346–349. doi: 10.1038/35042551
Naqvi, S. W. A., Naik, H., Jayakumar, D. A., Pratihary, A. K., Narvenkar, G., Kurian, S., et al. (2009). Seasonal anoxia over the western Indian continental shelf. Geophys. Monogr. Ser. 185, 333–345. doi: 10.1029/2008gm000745
Naqvi, S. W. A., Naik, H., Jayakumar, D. A., Shailaja, M. S., and Narvekar, P. V. (2006). Seasonal oxygen deficiency over the western continental shelf of India. in Past and Present Water Column Anoxia, ed LN Neretin, 195–224. (Dordrecht: Springer). doi: 10.1007/1-4020-4297-3_08
Neilan, R. M., and Rose, K. (2014). Simulating the effects of fluctuating dissolved oxygen on growth, reproduction, and survival of fish and shrimp. J. Theoret. Biol. 343, 54–68. doi: 10.1016/j.jtbi.2013.11.004
Palacz, A. P., Pearlman, J., Simmons, S., Hill, K., Miloslavich, P., Telszewski, M., et al. (2017a). Report of the Workshop on the Implementation of Multi-Disciplinary Sustained Ocean Observations (IMSOO). Global Ocean Observing System (GOOS) Report No. 223. Available at: www.goosocean.org/imsoo-report (accessed October 1, 2018).
Palacz, A. P., Telszewski, M., Garçon, V., and Karstensen, J. (2017b). Report of the Variability in the Oxycline and Its Impacts on the Ecosystem (VOICE) Science Plan Workshop. GOOS Report No. 224. Available at: www.goosocean.org/voice-mbari-report (accessed October 1, 2018).
Palóczy, A., Silveira, I., Castro, B. M., and Calado, L. (2014). Coastal upwelling off Cape São Tomé (22°S, Brazil): the supporting role of deep ocean processes. Continental Shelf Res. 89, 38–50. doi: 10.1016/j.csr.2013.09.005
Paulmier, A., and Ruiz-Pino, D. (2009). Oxygen minimum zones in the modern ocean. Prog. Oceanogr. 80, 113–128. doi: 10.1016/j.pocean.2008.08.001
Pauly, D., and Christensen, V. (1995). Primary production required to sustain global fisheries. Nature 374: 255–257. doi: 10.1038/374255a0
Pearlman, J., Buttigieg, P. L., Simpson, P., MunЬoz, C., Hesop, E., and Hermes, J. (2017). Accessing existing and emerging best practices for ocean observation, a new approach for end-to-end management of best practices. in Proceedings of the Oceans’17, Anchorage: Conference, MTS/IEEE, Anchorage, AK. 1–7.
Pearlman, J., Bushnell, M., Coppola, L., Karstensen, J., Buttigieg, P. L., Pearlman, F., et al. (2019). Evolving and sustaining ocean best practices and standards for the next decade. Front. Mar. Sci. 6:277. doi: 10.3389/fmars.2019.00277
Porter, M. E. (1985). Competitive Advantage: Creating and Sustaining Superior Performance. New York, NY: Simon and Schuster.
Prakash, S., Balakrishnan Nair, T. M., Udaya Bhaskar, T. V. S., Prakash, P., and Gilbert, D. (2012). Oxycline variability in the Central Arabian Sea: an ARGO oxygen study. J. Sea Res. 71, 1–8. doi: 10.1016/j.seares.2012.03.003
Prince, E. D., and Goodyear, C. P. (2006). Hypoxia-based habitat compression of tropical pelagic fishes. Fish. Oceanog. 15, 451–464. doi: 10.1111/j.1365-2419.2005.00393.x
Purca, S., Graco, M., Gutiérrez, D., Dewitte, B., Tam, J., Bertrand, A., et al. (2010). Relación entre anchoveta y ambiente a diferentes escalas temporales. Bol. Inst. Mar Perú 25, 13–22.
Rose, K. A., Adamack, A. T., Murphy, C. A., Sable, S. E., Kolesar, S. E., Craig, J. K., et al. (2009). Does hypoxia have population-level effects on coastal fish? Musings from the virtual world. J. Exp. Mar. Biol. Ecol. 381, S188–S203.
Rose, K. A., Cowan, J. H., Winemiller, K. O., Myers, R. A., and Hilborn, R. (2001). Compensatory density dependence in fish populations: importance, controversy, understanding and prognosis. Fish Fish. 2, 293–327. doi: 10.1046/j.1467-2960.2001.00056.x
Rose, K. A., Gutierrez Aguilar, D., Breitburg, D., Conley, D., Craig, J. K., Froehlich, H. E., et al. (2019). Impacts of ocean deoxygenation on ecosystem services: fisheries. in D. Laffoley, and J.M. Baxter, (eds.) Ocean Deoxygenation: Everyone’s Problem - Causes, Impacts, Consequences and Solutions. Gland: IUCN. 519–544.
Salvanes, A. G. V., Christiansen, H., Tahaa, Y., Henselera, C., Seivåg, M. L., Kjesbu, O. S., Folkvord, A., et al. (2018). Variation in growth, morphology and reproduction of the bearded goby (Sufflogobius bibarbatus) in varying oxygen environments of northern Benguela. J. Mar. Syst. 188, 81–97. doi: 10.1016/j.jmarsys.2018.04.003
Sato, K. N., Levin, L. A., and Schiff, K. (2017). Habitat compression and expansion of sea urchins in response to changing climate conditions on the California continental shelf and slope (1994-2013). Deep Sea Res. Part II 137, 377–389. doi: 10.1016/j.dsr2.2016.08.012
Schmidtko, S., Stramma, L., and Visbeck, M. (2017). Decline in global oceanic oxygen content during the past five decades. Nature 542, 335–339. doi: 10.1038/nature21399
Stramma, L., Prince, E. D., Schmidtko, S., Luo, J., Hoolihan, J. P., Visbeck, M., et al. (2011). Expansion of oxygen minimum zones may reduce available habitat for tropical pelagic fishes. Nat. Clim. Change 2, 33–37. doi: 10.1038/nclimate1304
Tchipalanga, P., Dengler, M., Brandt, P., Kopte, R., Macuéria, M., Coelho, P., Ostrowski, M., and Keenlyside, N. S. (2018). Eastern boundary circulation and hydrography off angola: building angolan oceanographic capacities. Bull. Am. Meteor. Soc. 99, 1589–1605. doi: 10.1175/BAMS-D-17-0197.1
Thomas, P., Rahman, M. S., Picha, M. E., and Tan, W. (2015). Impaired gamete production and viability in Atlantic croaker collected throughout the 20,000 km2 hypoxic region in the northern Gulf of Mexico. Mar. Pollut. Bull. 101, 182–192. doi: 10.1016/j.marpolbul.2015.11.001
Ulloa, O., Canfield, D. E., DeLong, E. F., Letelier, R. M., and Stewart, F. J. (2012). Microbial oceanography of anoxic oxygen minimum zones. Proc. Natl. Acad. Sci. U.S.A. 109,, 15996–16003. doi: 10.1073/pnas.1205009109
Ulloa, O., and Pantoja, S. (2009). The oxygen minimum zone of the eastern South Pacific, Deep Sea Res. Part II 56, 987–991Google Scholar
UNESCO (2012). FOO: Framework for Ocean Observing By the Task Team for an Integrated Framework for Sustained Ocean Observing, UNESCO 2012, IOC/INF-1284. Paris: UNESCO. doi: 10.5270/OceanObs09-FOO
Vaquer-Sunyer, R., and Duarte, C. M. (2008). Thresholds of hypoxia for marine biodiversity. Proc. Natl. Acad. Sci. U.S.A. 105, 15452–15457. doi: 10.1073/pnas.0803833105
Wu, R. S. (2002). Hypoxia: from molecular responses to ecosystem responses. Mar. Pollut. Bull. 45, 35–45 doi: 10.1016/s0025-326x(02)00061-9
Keywords: oxygen minimum zones, oxycline, ocean observing system, multidisciplinary, readiness level, ecosystem
Citation: Garçon V, Karstensen J, Palacz A, Telszewski M, Aparco Lara T, Breitburg D, Chavez F, Coelho P, Cornejo-D’Ottone M, Santos C, Fiedler B, Gallo ND, Grégoire M, Gutierrez D, Hernandez-Ayon M, Isensee K, Koslow T, Levin L, Marsac F, Maske H, Mbaye BC, Montes I, Naqvi W, Pearlman J, Pinto E, Pitcher G, Pizarro O, Rose K, Shenoy D, Van der Plas A, Vito MR and Weng K (2019) Multidisciplinary Observing in the World Ocean’s Oxygen Minimum Zone Regions: From Climate to Fish — The VOICE Initiative. Front. Mar. Sci. 6:722. doi: 10.3389/fmars.2019.00722
Received: 15 November 2018; Accepted: 07 November 2019;
Published: 05 December 2019.
Edited by:
Laura Lorenzoni, University of South Florida, United StatesReviewed by:
Scott Doney, University of Virginia, United StatesSennai Habtes, University of the Virgin Islands, US Virgin Islands
Copyright © 2019 Garçon, Karstensen, Palacz, Telszewski, Aparco Lara, Breitburg, Chavez, Coelho, Cornejo-D’Ottone, Santos, Fiedler, Gallo, Grégoire, Gutierrez, Hernandez-Ayon, Isensee, Koslow, Levin, Marsac, Maske, Mbaye, Montes, Naqvi, Pearlman, Pinto, Pitcher, Pizarro, Rose, Shenoy, Van der Plas, Vito and Weng. This is an open-access article distributed under the terms of the Creative Commons Attribution License (CC BY). The use, distribution or reproduction in other forums is permitted, provided the original author(s) and the copyright owner(s) are credited and that the original publication in this journal is cited, in accordance with accepted academic practice. No use, distribution or reproduction is permitted which does not comply with these terms.
*Correspondence: Véronique Garçon, veronique.garcon@legos.obs-mip.fr; Johannes Karstensen, jkarstensen@geomar.de