
Modelling the Distribution of the Red Macroalgae Asparagopsis to Support Sustainable Aquaculture Development


1
Department of Geography, University College Cork, T12 K8AF Cork, Ireland
2
Centre for Marine & Renewable Energy Institute, University College Cork, P43 C573 Cork, Ireland
3
Environmental Research Institute, University College Cork, T23 XE10 Cork, Ireland
*
Author to whom correspondence should be addressed.
AgriEngineering 2021, 3(2), 251-265; https://doi.org/10.3390/agriengineering3020017
Submission received: 8 March 2021
/
Revised: 30 April 2021
/
Accepted: 7 May 2021
/
Published: 12 May 2021
Abstract
:Fermentative digestion by ruminant livestock is one of the main ways enteric methane enters the atmosphere, although recent studies have identified that including red macroalgae as a feed ingredient can drastically reduce methane produced by cattle. Here, we utilize ecological modelling to identify suitable sites for establishing aquaculture development to support sustainable agriculture and Sustainable Development Goals 1 and 2. We used species distributions models (SDMs) parameterized using an ensemble of multiple statistical and machine learning methods, accounting for novel methodological and ecological artefacts that arise from using such approaches on non-native and cultivated species. We predicted the current distribution of two Asparagopsis species to high accuracy around the coast of Ireland. The environmental drivers of each species differed depending on where the response data was sourced from (i.e., native vs. non-native), suggesting that the length of time A. armata has been present in Ireland may mean it has undergone a niche shift. Subsequently, researchers looking to adopt SDMs to support aquaculture development need to acknowledge emerging conceptual issues, and here we provide the code needed to implement such research, which should support efforts to effectively choose suitable sites for aquaculture development that account for the unique methodological steps identified in this research.
1. Introduction
Globally, agriculture contributes ~11% of total anthropogenic Green House Gas (GHG) emissions [1], with the production systems of cattle and sheep responsible for up to 18% of this [2]. Around 43% of GHG emissions are made up of enteric methane (CH4) [3], which has a higher global warming potential than carbon dioxide (CO2—approximately 28-fold [4]), meaning targets for reducing global warming will prove difficult if reductions in methane emissions are not as actively addressed as CO2 emissions [5]. Fermentative digestion by ruminant livestock is one of the main ways enteric methane is produced as a by-product of anaerobic fermentation of organic feed matter [6,7]. Multiple challenges therefore exist to facilitate feeding an increasing global population in a more sustainable manner, with agriculture needing to identify methods to improve efficiencies [8], as well as aligning with Sustainable Development Goals (SDG) 1 and 2. Decreasing enteric CH4 from ruminants consequently poses a unique opportunity to support resilience in response to climate change, with several strategies currently being explored to reduce CH4 emissions [9,10,11].
Natural feed ingredients, notably those that sustainably decrease the environmental impact of food production, are increasingly becoming more important to consumers and producers [7]. The seaweed genus Asparagopsis is emerging as an active, innovative, and regenerative cleaner production feed for the wider agriculture sector [12]. Recent studies have shown that enteric CH4 could be virtually eliminated using this genus as a feed ingredient [7,13,14,15]. For example, Kinley et al. [7], investigated the effects of including Asparagopsis in feedlot beef cattle, demonstrating that when included in the high grain diet at 0.05%, 0.10%, and 0.20%, there was a decrease of CH4 production of 9%, 38%, and 98%, respectively. Moreover, its inclusion enhanced growth rate in the steers, did not affect meat quality, and the anti-methanogenic compound bromoform was not detected in meat, fat, organs, or faeces of any of the steers.
This is particularly pertinent in the Republic of Ireland, where the agriculture sector is the most significant contributor to overall GHG emissions at 33.9% (~60.93 million tonnes carbon dioxide equivalent—MtCO2 eq), with methane being the largest contributor of that figure at 64.5% [16]. When coupled with responses to recent fodder crises, the Republic of Ireland has seen an increase of dairy cow numbers by 27% and milk production by 40% in the last five years alone [16]. This increasing herd size can increase GHG emissions, notably, the release of significant amounts of CH4. Subsequently, the value of Asparagopsis additions to cattle feed is increasingly being explored by policy experts, land managers, and government agencies, meaning research into identifying sustainable and suitable sites for aquaculture development is needed to support any climate change mitigation efforts.
Species distribution models (SDMs) are a powerful spatial analytical tool for studying the geographic distribution of a range of taxa [17,18], providing a methodological framework for researchers and practitioners to quantitatively assess the relationship between species distributions and environmental factors. SDMs project relationships in both environmental and geographic space using a variety of statistical methods and machine learning algorithms [19], and have been widely used for various applications, including aquaculture [20,21,22]. For example, Westmeijer et al. [22] used SDMs to assess the habitat suitability of nine temperate macroalgae species in Europe, identifying that temperature made the largest contribution to determining distributions, with the authors concluding that such analysis can support the selection of target species for seaweed aquaculture and support optimal growth conditions.
However, a challenge with identifying suitable cultivation sites for Asparagopsis is the complex and cryptic lineages of the different species, meaning any models developed could be compounded by uncertainty related to their native and non-native distributions [23]. A central assumption of SDMs is that species are in equilibrium with their environment, which may be violated for introduced or cultivated species [21]. During model parameterisation, it is therefore essential to the consider invasion (or cultivation) stage and the absence of equilibrium of the species in its new environment [24,25]. Moreover, distribution projections assume that species retain their niche [26], known as niche conservatism (i.e., where a species is only able to invade areas of similar ecological conditions that are found in their native range [27]). However, many species can shift their niche after introduction to a new environment. For example, the seaweed Caulerpa taxifola lives at different depths in its native and invaded areas [28,29]. The rapid evolution in several traits has been observed in many non-native species, making it possible for their fundamental niche to be modified [30].
Solutions to modelling the distribution of non-native species are not straightforward [25], but several methods can be adopted to overcome such limitations to model the distribution of non-native species more effectively and accurately [31]. For example, Verbruggen et al. [20] developed an SDM for the highly invasive species Caulerpa cylindracea, using training data from both the native and non-native range, identifying that at a global scale large parts of the coasts of Australia (native region) and the Mediterranean Sea (non-native region) had conditions suitable for macroecology, with the models for the non-native range predicting the species beyond the extension of the presently known range. To-date, little research has been conducted towards exploring whether the environmental and subsequent geographic distributions of Asparagopsis differ among their native and non-native ranges, which could have implications for any aquaculture developments stemming from such analytical models.
With the potential for the red algae genus Asparagopsis to be used in the mitigation of methane across a global agriculture sector, a vital part of any sustainable aquaculture process will be to identify suitable sites for its distribution for optimal growth, cultivation, and harvesting, with SDMs a primary analytical tool that can be used to achieve this. However, such models are complicated by challenges associated with niche conservatism and an absence of equilibrium in the non-native range, meaning research is needed to explore robust methods for parameterisation to inform agriculture. Here, we explore four main research questions with the overall aim of identifying suitable and sustainable cultivation sites for Asparagopsis for the island of Ireland: (1) What is the current suitable habitat for Asparagopsis spp.? (2) What are the most important environmental variables determining Asparagopsis spp. distributions? (3) Are Asparagopsis spp. in equilibrium in their non-native Irish range? and (4) What are the most suitable cultivation sites?
2. Materials and Methods
2.1. Study Species and Area
The genus Asparagopsis contains two accepted species taxonomically, Asparagopsis armata and Asparagopsis taxiformis. The species are morphologically and ecologically distinct: A. armata is an epiphyte attaching to other seaweed utilising barbs [32], while A. taxiformis is associated with sand-covered habitats, having a well-developed rhizomatous system for anchorage and lack barbs [33]. A. armata and A. taxiformis have a distinct geographical distribution and can overlap in some areas. A. armata is endemic to the southern hemisphere in cool-temperate waters. The species consists of two cryptic lineages, one where it is naturally distributed along western and southern Australia and New Zealand and the other in the north-east Atlantic and Mediterranean coasts where it is non-indigenous [23,34]. A. taxiformis is cosmopolitan in warm-temperate to tropical areas where it is widely distributed [35]. Within Europe, there are differences in the date of arrival of these species. A. armata is considered a Lessepsian immigrant, first reported in 1923 on the Algerian coast [36]. In 1925 it was recorded in France, then arriving in Ireland at Galway in 1941 [32]. It is now well established in open sandy pools of lower intertidal and subtidal zones, found on rocks or attached to other macroalgae (mainly Ulva spp.) [32]. In contrast, A. taxiformis is considered a pre-Lessepsian immigrant or native to the Mediterranean [37], since it was first recorded in the Mediterranean in 1813 in Egypt (Delile, 1813). According to the phylogeographic study by Andreakis et al. [37], the first lineage of A. taxiformis into the Mediterranean (Atlantic lineage 3) is confined to the south-east perhaps due to its low sensitivity to low winter seawater temperatures. The Indo-Pacific lineage 2 expanded the range of A. taxiformis into the north-eastern part of the Mediterranean during the second half of the 20th Century due to its lower minimum need of temperature for survival. The appearance of this lineage, especially on the south coast of Portugal, shows that the lineage has now been established in the north-eastern Atlantic [34]. A. taxiformis’ fast dispersal rate and prolific vegetative reproduction, coupled with the effects of climate change, might result in expansion of its range into areas of the north-east Atlantic where it is currently not found [38,39].
Ireland is situated in the North Atlantic in north-west Europe (Figure 1), hosting a temperate maritime climate [40]. Large areas of the western, south-western, and northern coastlines are dominated by rocks, large bays, and estuaries, while the eastern and south-eastern coastlines are low-lying and soft sedimentary areas [41,42,43]. In 1996, a commercial cultivation farm for A. armata was set up in Ard Bay, Co. Galway. This site was chosen because A. armata had been found there since 1941. In 1998, a 1 ha farm was constructed and first cultivation trials took place. On this site, A. armata was cultivated using vegetative propagation of the gametophyte, where it is cultivated by connecting it to rope made of discarded twisted monofilament netting [44].
2.2. Data Collection
Presence data for A. armata and A. taxiformis were obtained from the Global Biodiversity Information Facility using the rgbif package [45] in R studio [46]. Following data cleaning, 53 records of A. armata were obtained in the non-native Irish range and 103 records in the native New Zealand range [47]. Similarly, 75 records of A. taxiformis were obtained in the non-native Portuguese (Azores and Madeira) range and 699 records in the native Australian range [48]. Environmental data were obtained from Bio-ORACLE [49,50] and MARSPEC [51] databases using the sdmpredictors package [52]. All variables had a spatial resolution of 5 arc minutes, approximately 9 km. To avoid any potential multicollinearity problems, a Principal Component Analysis (PCA) was initially carried out on all variables to visualize the correlation between the environmental variables and identify the main environmental gradients in the region to be used in the modelling process. Using a PCA, environmental variables that were not collineated and significantly contributed to the overall environmental variation were selected. The ade4 package [53] was used to perform this pre-analysis, and these results are presented in Supplementary Information 1. The variables used in subsequent data analysis are presented in Table 1, along with ecological justification for their inclusion.
2.3. Data Analysis
All code is presented in Supplementary Information 2. Two models for each species were built, one that accounted for presence data from the non-native range only and one that accounted for presence data from both the native and non-native ranges. As no absence data were available for the species, 10,000 pseudo-absences were randomly drawn (following [31]). For models using data from only the non-native range, pseudo-absences were also drawn only from the non-native range, whereas for models parameterised on both the native and non-native occurrence data, 5000 pseudo-absences were drawn from both the native and non-native ranges, totalling 10,000, with equal weighting given regardless of location. Table 2 summarises these different models. The choice of pseudo-absence has been found to impact the results of SDM projections [31,56], so we decided to replicate data analysis three times with different pseudo-absences selections.
PCA was again undertaken for the variables presented in Table 1 prior to fitting the analytical models. We implemented two models for A. armata, one that included a proxy for biotic interactions and one that did not. The former would allow for identification of sites that could be harvested naturally, while the latter would allow for identification of sites for vegetative propagation of the gametophyte. The species distribution of A. armata and A. taxiformis were modelled by running six different SDM methodologies implemented within the biomod2 package [57]. The six SDM methodologies included one regression method: Generalized Linear Model (GLM); two classification methods: Classification Tree Analyses (CTA) and Flexible Discriminant Analysis (FDA); and three machine learning methods: Generalized Boosting Model (GBM), Random Forest (RF) and Artificial Neural Networks (ANN). Studies have shown that different modelling techniques can produce different results for the same species and datasets [58,59], meaning to obtain a consensus distribution, an ensemble forecast distribution was calculated as the average of all distributions across all modelling techniques and pseudo-absences replicates. The predictions from individual models were ensembled in four ways: the mean, median, confidence interval (upper) and confidence interval (lower) of habitat suitability.
Models were evaluated after parameterisation to justify the acceptance of projections for their intended purpose [60], in this case identifying suitable cultivation sites. We performed 3-fold cross-validation of the data by splitting the occurrence records 70:30 into training and testing data following best practice in the species distribution literature when independent test data are not available [18,61,62]. The model’s discriminatory power between presence and absence was assessed using two different metrics to provide an accurate assessment of the models. The area under the curve (AUC) statistic of a receiver operating characteristic (ROC) [63] is a threshold-independent metric and widely used in SDM research [17]. It has a value range between 0 and 1, with a value below 0.5 deemed no better than a random selection and a value of 1 representing a highly accurate model. True Skill Statistic (TSS) measures the performance of models generating presence-absence predictions, with values of 0 indicating no agreement and 1 indicating perfect agreement [64].
3. Results
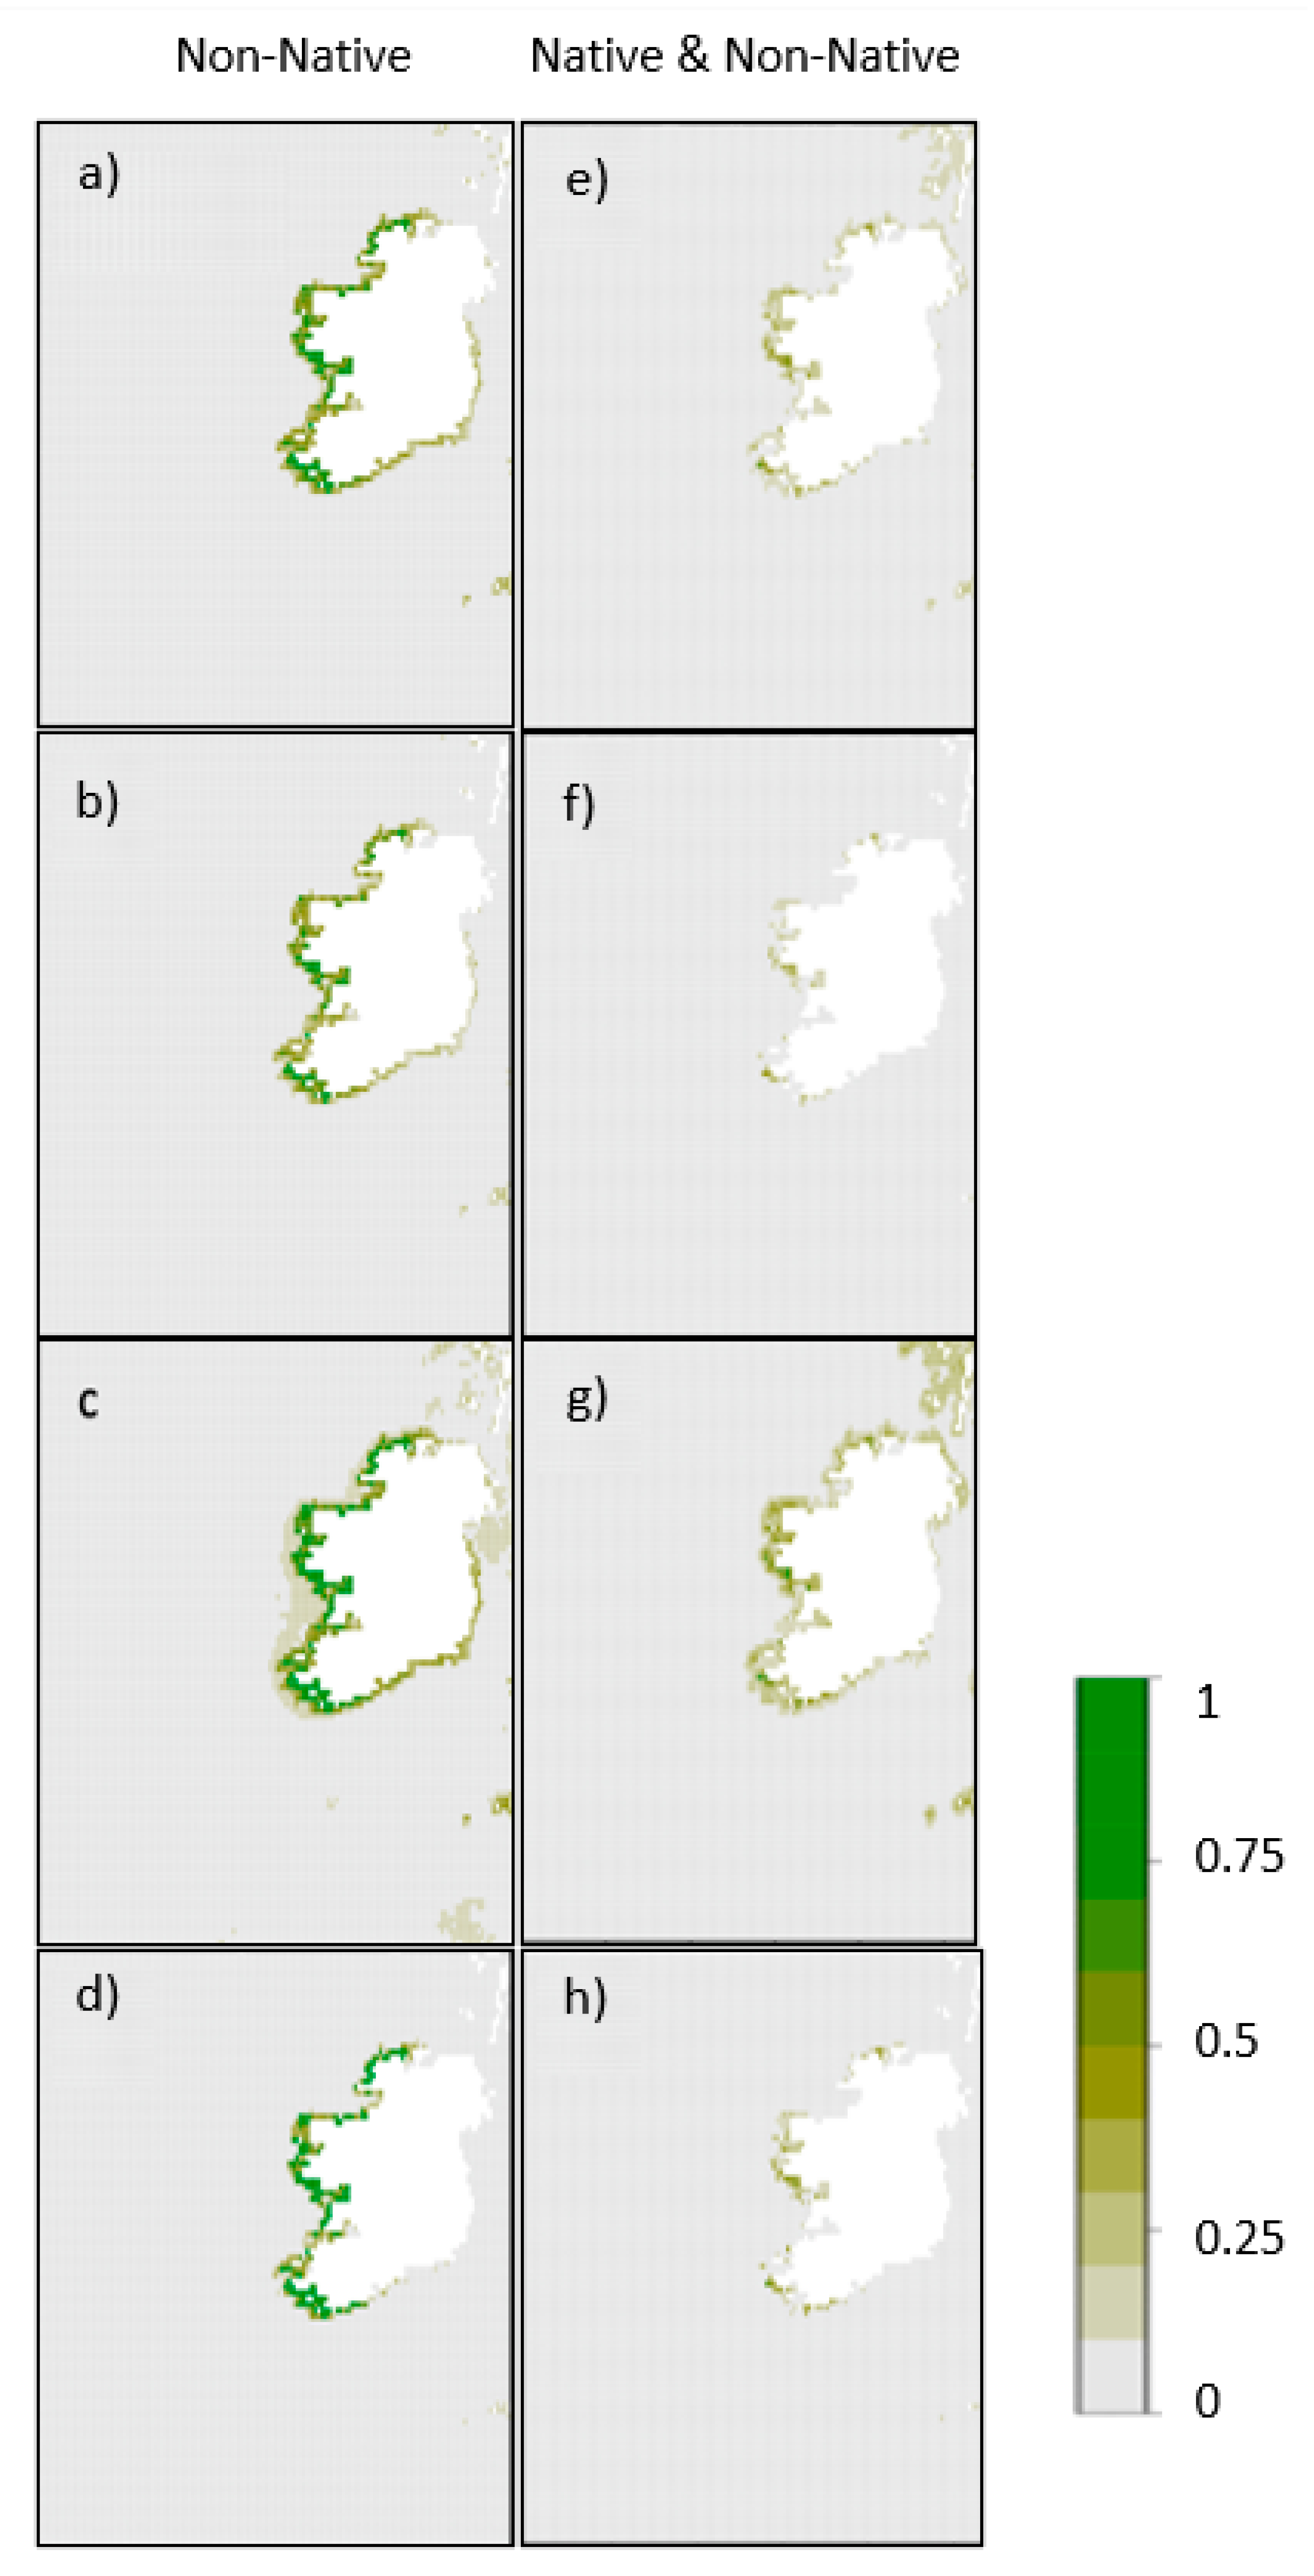
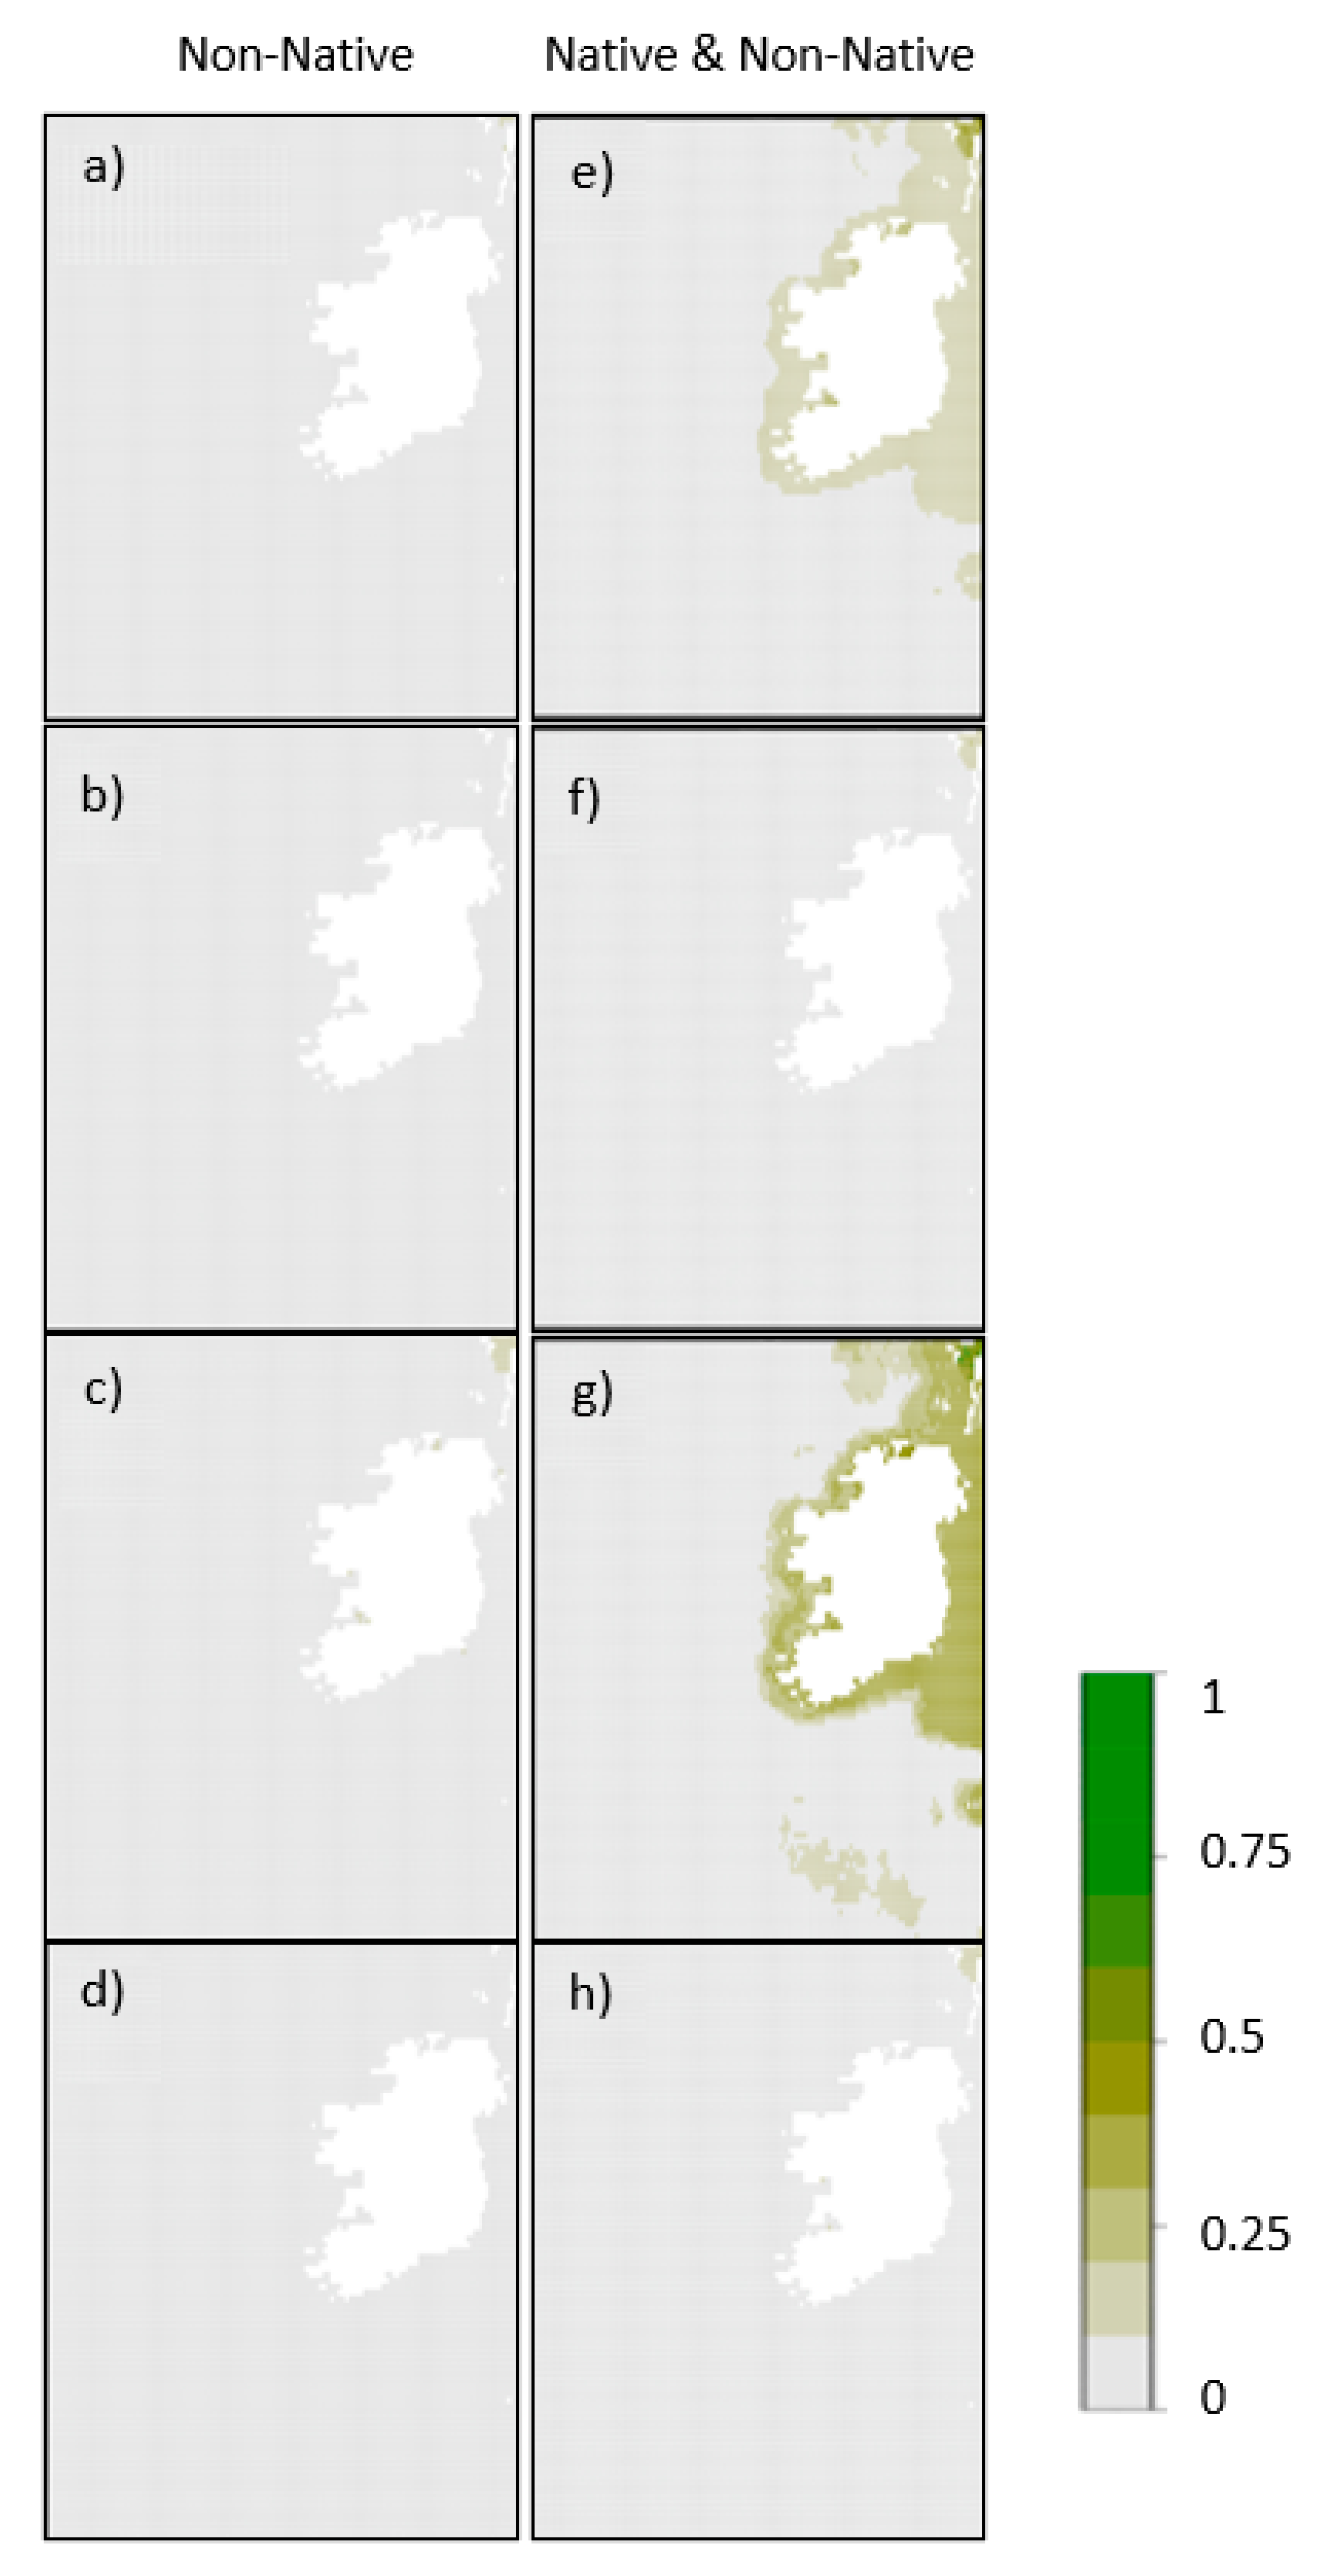
We identified large geographic variations in Asparagopsis spp. distributions within the coastal zone of Ireland (Figure 2 and Figure 3; Table 3; Supplementary Information 3). When A. armata models were parameterised using the non-native range only and a proxy for biotic interactions (Figure 2a–d), we identified medium (>0.5) to high (>0.75) habitat suitability along the west coast of Ireland from Dungloe (co. Donegal) in the north to Cork in the south; however, when models were parameterised using both the native and non-native ranges (Figure 2e–h), the suitable environmental conditions were predicted in much smaller areas. Areas of medium (>0.5) to high (>0.75) suitability were still projected predominantly in the west of the country, mainly near Galway and in north west Kerry near Tralee, as well as near the Iveragh peninsula in south west Kerry and Cork. When modelled without biotic proxies (Supplementary Information 3), distributions of A. armata extended further out from the coast, suggesting there are suitable abiotic conditions for aquaculture through vegetative propagation of the gametophyte. No locations were projected as suitable for A. taxiformis using only the non-native Portuguese range as training data (Figure 3a–d), and only the median ensemble model using both native and non-native occurrence data (Figure 3e–h) identified two small areas with low habitat suitability (>0.25) in Galway Bay and the Shannon estuary near Limerick. Such results suggest that the absence of A. taxiformis from Irish waters is most likely a factor of limiting environmental conditions rather than dispersal ability.
This is supported when we consider the importance of the environmental variables to distribution projections (Table 4). PCA identified a range of environmental variables to include in the different combinations of our final models (Supplementary Information 4). Temperature was important in determining the distribution of A. taxiformis, with temperature of the warmest month (0.6 ± 0.06) the second highest variable when only the non-native range was considered, after nitrate (0.74 ± 0.09). However, when A. taxiformis was parameterised with occurrences from both the native and non-native range, mean diffuse attenuation (0.47 ± 0.05), nitrate (0.30 ± 0.06) and pH (0.20 ± 0.05) were considered the most important variables in determining the distribution, with temperature (0.14 ± 0.01) less important but still retained in final models after PCA. For A. armata, the distribution of Ulva lactuca (0.61 ± 0.09) was the most important variable in determining habitat suitability, followed by distance from the shore (0.2 ± 0.08) and bathymetry (0.2 ± 0.07) when models parameterised only on the non-native occurrence data were utilised. When both native and non-native occurrences were used, distance from shore (0.62 ± 0.01), bathymetry (0.33 ± 0.04) and U. lactuca distribution (0.19 ± 0.04) remained important. The varying importance of environmental variables to the final model suggests that either species in the non-native ranges are not yet at equilibrium with the environment or that some niche shift has occurred.
4. Discussion
The overarching aim of this research was to assess the ability of analytical models to identify current suitable habitat for Asparagopsis spp. in Ireland for potential cultivation to support mitigation efforts at reducing enteric CH4. Through this process, we explored how considerations, such as species equilibrium and non-native ranges, impacted results from an ecological and methodological perspective. Results indicated a large area of suitable habitat for A. armata, across all model iterations (Figure 2), but results for A. taxiformis were more restricted (Figure 3). When the model for A. armata was built with occurrence data from both native and non-native ranges, smaller areas of suitable habitats were identified (Figure 2), suggesting that this species is not yet at equilibrium with its environment. Moreover, when modelled without a proxy for biotic interactions, we identified a larger suitable area for A. armata suggesting the potential for vegetative propagation of the gametophyte would be suitable (Supplementary Information 3). The impact of methodological decisions on the overall results had a substantial impact (Figure 2 and Figure 3, Table 3 and Table 4), meaning the results and methodology of this study should be of interest to parties involved in mapping potential sites to support aquaculture development.
The mean of diffuse attenuation was one of the most important variables in determining habitat suitability for A. taxiformis (Table 4), with variables associated with temperature (e.g., SST range and temperature of the warmest month) also being important. This confirms the general recognition that temperature is the primary abiotic condition that shapes the geographic boundaries of seaweeds [65,66] and corroborates the findings of Guiry and Dawes [33] identifying temperature as a primary range limiting factor of A. armata distributions. However, we found that the distribution of U. lactuca was the most important variable in determining the habitat suitability of A. armata (Table 4). This biotic interaction of facilitation is a positive interaction for A. armata as it is an epiphyte that attaches to other seaweeds utilising its barbs [32]. This result supports the recent findings by Kraan and Barrington [44], where they identified A. armata growing on U. lactuca. However, when the model was parameterised with native and non-native occurrences, distance to shore was the most important variable in determining habitat suitability not U. lactuca. We believe that distance to shore is acting as a proxy for biotic interactions with other potential facilitator species within its native range, as closer to the shore there is a higher abundance of fast-growing kelp and other macroalgae to attach to [44]. The importance of incorporating biotic interactions within SDM is well-established [67,68,69]; however, abiotic factors often supersede biotic interactions within SDM due to their influence at a broader spatial scale [70,71]. Our results suggest there is a need to incorporate biotic interactions when determining cultivation sites, particularly as vegetative propagation of the gametophyte is needed, which could be received from wild populations; however, biotic interactions should be parameterised very differently depending on the source of the response data (i.e., native vs. non-native ranges).
To our knowledge, this is the first instance of Asparagopsis spp. being modelled using SDM. We found large areas of potentially suitable habitat (Figure 1 and Figure 2); however, as these species are non-native to the study area, they may not be in equilibrium with the environment and subsequently violating key algorithm and modelling assumptions. The incorporation of occurrence records from both the native and non-native range simultaneously to build the model is one possible solution [25]. This process incorporates records that are likely to be in equilibrium with the environment in the native range while also including samples from the non-native range, which provides information about the expansion of the realised niche and the non-native area, which may provide valuable information about the species tolerance to climatic conditions that may not be present in the native range [21]. When both native and non-native data were used, projections were smaller for A. armata but larger for A. taxiformis. The rule of parsimony suggests that for habitat suitability models, a good projection will predict a potential area that is as small as possible [72], suggesting that the incorporation of native data in projecting A. armata was central to an effective modelling procedure. Subsequently, we identified three potential cultivation sites for A. armata, off the west coast of Galway, the north-west Kerry coast near Tralee and the south-west coast of the Iveragh peninsula (Figure 2). One of these smaller areas identified is the area near Ard Bay in Galway, which was identified by Kraan and Barrington [44] as a possible source pool for A. armata in Ireland, corroborating their study that highlighted the role the seaweed aquaculture facility may play, acting as a possible local source pool maintaining the gametophytic populations on the west coast of vegetative reproduction.
We noted the opposite relationship with A. taxiformis, with a larger predicted range when both non-native and native data were used (Figure 3). Currently, there are no occurrences of this species in Ireland, meaning we chose occurrences from Portugal because the occurrences found there have a lower minimum need of temperature and are the only occurrences that have been established in the north-eastern Atlantic [34]. There is an argument that A. taxiformis is considered either a pre-Lessepsian immigrant or native to the Mediterranean [37], so therefore occurrences from a southern hemisphere lineage were used where it may be native. When the model was built for A. taxiformis with occurrences from Portugal and Australia, the results for this model show that there are small areas of low habitat suitability identified in the Galway Bay and the Shannon estuary area near Limerick. When coupled with the abiotic drivers presented in Table 4, we posit that such results suggest that the absence of A. taxiformis from Irish waters is most likely a factor of limiting environmental conditions rather than dispersal ability.
All the models for A. armata, when accounting for the non-native data, had a broader predicted range compared to using both native and non-native data (Figure 2). This could suggest a niche shift. The rapid evolution in several traits has been observed in introduced species, which makes it possible for their fundamental niche to be modified [30]. The possible shift of niche can be seen when looking at the importance of environmental variables for determining habitat suitability (Table 4). For example, for the models looking at possible cultivation areas, those fit with non-native data infer that Ulva lactuca, pH, diffuse attenuation and dissolved oxygen were the most important in determining habitat suitability compared to the model fit with native and non-native data, where the distance to the shore, bathymetry, diffuse attenuation and phosphate were more important. Our findings suggest that future research is warranted to explicitly test the niche conservatism and shifts in this species, particularly as A. armata has been present in Irish waters for almost a century.
5. Conclusions
It is estimated that if just 10% of global ruminant producers adopted Asparagopsis as an additive to feed their livestock, it would have the same impact for the climate as removing 50 million cars from the world’s roads [14]. Therefore, there is a pressing need to investigate new methods and analytical tools to support agriculture in line with carbon mitigation strategies, as well as supporting SDGs 1 and 2 to support feeding a growing population. Here, we utilised SDM to assess the habitat suitability of Asparagopsis spp. We parameterised models using both data from the native and non-native ranges to control for ecological artefacts that may occur when projecting species distributions in a non-native range. We found a large geographic area of suitable habitat for A. armata (Figure 2), but notably less for A. taxiformis (Figure 3). For all species, our models had good validation statistics (Table 3), but the environmental drivers of each species differed depending on where the response data was sourced from (i.e., native v non-native—Table 4). This suggests that the length of time A. armata has been present in Ireland may mean it has undergone a niche shift. Finally, we provide all the source code needed to undertake such research, which should support efforts to effectively choose suitable sites for aquaculture that account for the unique methodological steps identified in this research.
Supplementary Materials
The following are available online at https://www.mdpi.com/article/10.3390/agriengineering3020017/s1, SI1: Information and results of initial principal components analysis. SI2: Code to run the models. SI3: Results for A. armata without a biotic proxy. SI4: Results from principal components analysis. Additional references in SI [73,74].
Author Contributions
Conceptualization, J.O. and P.H.; methodology, J.O. and P.H.; formal analysis, J.O.; writing—original draft preparation, J.O., R.d.l.T.C. and P.H.; writing—review and editing, J.O., R.d.l.T.C. and P.H. All authors have read and agreed to the published version of the manuscript.
Funding
This research received no external funding.
Institutional Review Board Statement
Not applicable.
Informed Consent Statement
Not applicable.
Data Availability Statement
All data used are currently in open data repositories. Please see methods and SI2 for details.
Acknowledgments
We would like to thank the reviewers and editors for their constuctive comments.
Conflicts of Interest
The authors declare no conflict of interest.
References
- Smith, P.; Bustamante, M.; Ahammad, H.; Clark, H.; Dong, E.A.; Elsiddig, H.; Haberl, R.; Harper, J.; House, M.; Jafari, O.; et al. Agriculture, forestry and other land use (AFOLU). In Climate Change 2014: Mitigation of Climate Change. Contribution of Working Group III to the Fifth Assessment Report of the Intergovernmental Panel on Climate Change; Edenhofer, O., Pichs-Madruga, R., Sokona, Y., Farahani, S., Kadner, K., Seyboth, A., Adler, I., Baum, S., Brunner, P., Eickemeier, B., et al., Eds.; Cambridge University Press: Cambridge, UK, 2014; pp. 811–922. [Google Scholar]
- Herrero, M.; Thornton, P. Livestock and global change: Emerging issues for sustainable food systems. Proc. Natl. Acad. Sci. USA 2013, 110, 20878–20881. [Google Scholar] [CrossRef] [PubMed] [Green Version]
- Herrero, M.; Henderson, B.; Havlík, P.; Thornton, P.K.; Conant, R.T.; Smith, P.; Wirsenius, S.; Hristov, A.N.; Gerber, P.; Gill, M.; et al. Greenhouse gas mitigation potentials in the livestock sector. Nat. Clim. Chang. 2016, 6, 452–461. [Google Scholar] [CrossRef] [Green Version]
- Myhre, G.; Shindell, D.; Bréon, F.M.; Collins, W.; Fuglestvedt, J.; Huang, J.; Koch, D.; Lamarque, J.F.; Lee, D.; Mendoza, B.; et al. Anthropogenic and natural radiative forcing. In Climate Change 2013: The Physical Science Basis. Contribution of Working Group I to the Fifth Assessment Report of the Intergovernmental Panel on Climate Change; Cambridge University Press: Cambridge, UK, 2013. [Google Scholar]
- Saunois, M.; Jackson, R.; Bousquet, P.; Poulter, B.; Canadell, J. The growing role of methane in anthropogenic climate change. Environ. Res. Lett. 2016, 11, 120207. [Google Scholar] [CrossRef] [Green Version]
- Smith, P.; Olesen, J. Synergies between the mitigation of, and adaptation to, climate change in agriculture. J. Agric. Sci. 2010, 148, 543–552. [Google Scholar] [CrossRef] [Green Version]
- Kinley, R.; Martinez-Fernandez, G.; Matthews, M.; de Nys, R.; Magnusson, M.; Tomkins, N. Mitigating the carbon footprint and improving productivity of ruminant livestock agriculture using a red seaweed. J. Clean. Prod. 2020, 259, 120836. [Google Scholar] [CrossRef]
- Crosson, P.; Shalloo, L.; O’Brien, D.; Lanigan, G.; Foley, P.; Boland, T.; Kenny, D. A review of whole farm systems models of greenhouse gas emissions from beef and dairy cattle production systems. Anim. Feed Sci. Technol. 2011, 166–167, 29–45. [Google Scholar] [CrossRef]
- Pickering, N.K.; Oddy, V.H.; Basarab, J.; Cammack, K.; Hayes, B.; Hegarty, R.S.; Lassen, J.; McEwan, J.C.; Miller, S.; Pinares-Patiño, C.S.; et al. Animal board invited review: Genetic possibilities to reduce enteric methane emissions from ruminants. Animal 2015, 9, 1431–1440. [Google Scholar] [CrossRef] [Green Version]
- Lassen, J.; Løvendahl, P. Heritability estimates for enteric methane emissions from Holstein cattle measured using noninvasive methods. J. Dairy Sci. 2016, 99, 1959–1967. [Google Scholar] [CrossRef] [Green Version]
- González-Recio, O.; López-Paredes, J.; Ouatahar, L.; Charfeddine, N.; Ugarte, E.; Alenda, R.; Jiménez-Montero, J.A. Mitigation of greenhouse gases in dairy cattle via genetic selection: 2. Incorporating methane emissions into the breeding goal. J. Dairy Sci. 2020, 103, 7210–7221. [Google Scholar] [CrossRef]
- Mayberry, D.; Bartlett, H.; Moss, J.; Davison, T.; Herrero, M. Pathways to carbon-neutrality for the Australian red meat sector. Agric. Syst. 2019, 175, 13–21. [Google Scholar] [CrossRef]
- Machado, L.; Magnusson, M.; Paul, N.; de Nys, R.; Tomkins, N. Effects of Marine and Freshwater Macroalgae on In Vitro Total Gas and Methane Production. PLoS ONE 2014, 9, e85289. [Google Scholar] [CrossRef] [PubMed] [Green Version]
- Kinley, R.; Vucko, M.; Machado, L.; Tomkins, N. In Vitro: Evaluation of the Antimethanogenic Potency and Effects on Fermentation of Individual and Combinations of Marine Macroalgae. Am. J. Plant Sci. 2016, 7, 2038–2054. [Google Scholar] [CrossRef] [Green Version]
- Kinley, R.; de Nys, R.; Vucko, M.; Machado, L.; Tomkins, N. The red macroalgae Asparagopsis taxiformis is a potent natural anti-methanogenic that reduces methane production during in vitro fermentation with rumen fluid. Anim. Prod. Sci. 2016, 56, 282. [Google Scholar] [CrossRef]
- Environmental Protection Agency (EPA). Irelands Final Greenhouse Gas Emissions 1990–2018; Environmental Protection Agency (EPA): Wexford, Ireland, 2020.
- Franklin, J. Mapping Species Distributions: Spatial Inference and Prediction; Cambridge University Press: Cambridge, UK, 2010. [Google Scholar]
- Peterson, A.T.; Soberon, J.; Pearson, R.G.; Anderson, R.P.; Martinez-Meyer, E.; Nakamura, M.; Araujo, M.B. Ecological Niches and Geographic Distributions; Princeton University Press: Princeton, NJ, USA, 2011; p. 315. [Google Scholar]
- Miller, J.A.; Holloway, P. Niche theory and models. In International Encyclopedia of Geography: People, the Earth, Environment and Technology; John Wiley & Sons: Hoboken, NJ, USA, 2017; pp. 1–10. [Google Scholar]
- Verbruggen, H.; Tyberghein, L.; Belton, G.S.; Mineur, F.; Jueter-Bock, A.; Hoarau, G.; Gurgel, C.F.D.; De Clerck, O. Improving transferability of introduced species’ distribution models: New tools to forecast the spread of a highly invasive seaweed. PLoS ONE 2013, 8, e68337. [Google Scholar] [CrossRef] [Green Version]
- Marcelino, V.R.; Verbruggen, H. Ecological Niche Models of invasive seaweeds. J. Phycol. 2015, 51, 606–620. [Google Scholar] [CrossRef] [PubMed]
- Westmeijer, G.; Everaert, G.; Pirlet, H.; De Clerck, O.; Vandegehuchte, M. Mechanistic niche modelling to identify favourable growth sites of temperate macroalgae. Algal Res. 2019, 41, 101529. [Google Scholar] [CrossRef]
- Dijoux, L.; Viard, F.; Payri, C. The more we search, the more we find: Discovery of a new lineage and a new species complex in the genus Asparagopsis. PLoS ONE 2014, 9, e103826. [Google Scholar] [CrossRef] [Green Version]
- Elith, J.; Kearney, M.; Phillips, S. The art of modelling range-shifting species. Methods Ecology Evolution Novel methods improve prediction of species’ distributions from occurrence data. Methods Ecol. Evol. 2020, 1, 330–342. [Google Scholar] [CrossRef]
- Jimenez-Valverde, A.; Lobo, J.M.; Hortal, J.; Jimenez-Valverde, A. Not as good as they seem: The importance of concepts in species distribution modelling. Divers. Distrib. 2008, 14, 885–890. [Google Scholar] [CrossRef]
- Peterson, A.T.; Soberon, J.; Sanchez-Cordero, V. Conservatism of ecological niches in evolutionary time. Science 1999, 285, 1265–1267. [Google Scholar] [CrossRef]
- Peterson, A.T. Predicting the geography of species’ invasions via ecological niche modeling. Quant. Reverse Biol. 2003, 78, 419–433. [Google Scholar] [CrossRef] [PubMed] [Green Version]
- Klein, J.; Verlaque, M. The Caulerpa racemosa invasion: A critical review. Mar. Pollut. Bull. 2008, 56, 205–225. [Google Scholar] [CrossRef]
- Katsanevakis, S.; Salomidi, M.; Panou, A. Modelling distribution patterns and habitat preference of the invasive green alga Caulerpa racemosa in the Saronikos Gulf (Eastern Mediterranean). Aquat. Biol. 2010, 10, 57–67. [Google Scholar] [CrossRef]
- Whitney, K.D.; Gabler, C.A. Rapid evolution in introduced species, “invasive traits” and recipient communities: Challenges for predicting invasive potential. Divers. Distrib. 2008, 14, 569–580. [Google Scholar] [CrossRef]
- Barbet-Massin, M.; Jiguet, F.; Albert, C.; Thuiller, W. Selecting pseudo-absences for species distribution models: How, where and how many? Methods Ecol. Evol. 2012, 3, 327–338. [Google Scholar] [CrossRef]
- Guiry, M.; Guiry, G. AlgaeBase [Internet]; National University of Ireland: Galway, Ireland, 2020. [Google Scholar]
- Guiry, M.D.; Dawes, C.J. Daylength, temperature and nutrient control of tetrasporogenesis in Asparagopsis armata (Rhodophyta). J. Exp. Mar. Biol. Ecol. 1992, 158, 197–219. [Google Scholar] [CrossRef]
- Andreakis, N.; Procanni, G.; Maggs, C.; Kooistra, W. Phylogeography of the invasive seaweed Asparagopsis (Bonnemaisoniales, Rhodophyta) reveals cryptic diversity. Mol. Ecol. 2007, 16, 2285–2299. [Google Scholar] [CrossRef]
- Bonin, D.R.; Hawkes, M.W. Systematics and life histories of New Zealand Bonnemaisoniaceae (Bonnemaisoniales, Rhodophyta): I. The genus Asparagopsis. N. Z. J. Bot. 1987, 25, 577–590. [Google Scholar] [CrossRef] [Green Version]
- Feldmann, J.; Feldmann, G. Sur le d éveloppement des carpospores et l’alternance de gènérations de l’Asparagopsis armata Harvey. C. R. Hebd. Séanc. Acad. Sci. Paris 1939, 208, 1240–1242. [Google Scholar]
- Andreakis, N.; Procaccini, G.; Kooistra, W.H.C.F. Asparagopsis taxiformis and Asparagopsis armata (Bonnemaisoniales, Rhodophyta): Genetic and morphological identification of Mediterranean populations. Eur. J. Phycol. 2004, 39, 273–283. [Google Scholar] [CrossRef]
- Womersley, H.B.S. The Marine Benthic Flora of Southern Australia. Rhodophyta -Part IIIB. Gracilariales, Rhodymeniales, Corallinales and Bonnemaisoniales; Australian Biological Resources Study: Camberra, Australia, 1996; p. 392. [Google Scholar]
- Altamirano, M.; Muñoz, A.; De la Rosa, J.; Barrajón-Mínguez, A.; Barrajón-Domenech, A.; Moreno-Robledo, C.; Arroyo, M. The invasive species Asparagopsis taxiformis (Bonnemaisoniales, Rhodophyta) on Andalusian coast (Southern Spain): Reproductive stages, new records and invaded communities. Acta Bot. Malacit. 2020, 33, 5. [Google Scholar] [CrossRef]
- McCarthy, G.D.; Gleeson, E.; Walsh, S. The influence of ocean variations on the climate of Ireland. Weather 2015, 70, 242–245. [Google Scholar] [CrossRef] [Green Version]
- Guiry, M.D.; Hession, C. Eat up your seaweed! Ireland of the Welcomes. Glob. Ecol. Biogeogr. Lett. 1996, 45, 22–25. [Google Scholar]
- Devoy, R.J.N. Coastal Vulnerability and the implications of Sea-Level Rise for Ireland. J. Coast. Res. 2008, 24, 325–341. [Google Scholar] [CrossRef]
- Cronin, K.M.; Devoy, R.J.N.; Gault, J. Modelling Estuarine Morphodynamics on the South Coast of Ireland. J. Coast. Res. 2007, 50, 474–479. [Google Scholar]
- Kraan, S.; Barrington, K. Commercial farming of Asparagopsis armata (Bonnemaisoniceae, Rhodophyta) in Ireland, maintenance of an introduced species? J. Appl. Phycol. 2005, 17, 103–110. [Google Scholar] [CrossRef]
- Chamberlain, S.; Barve, V.; Mcglinn, D.; Oldoni, D.; Desmet, P.; Geffert, L.; Ram, K. rgbif: Interface to the Global Biodiversity Information Facility API. R Package Version 3.5.2. Available online: https://CRAN.R-project.org/package=rgbif (accessed on 1 June 2020).
- R Core Team. R: A Language and Environment for Statistical Computing. R Foundation for Statistical Computing. Available online: https://www.R-project.org (accessed on 1 June 2020).
- GBIF. GBIF Occurrence Download. 2020. Available online: https://doi.org/10.15468/dl.extoyj (accessed on 20 February 2020).
- GBIF. GBIF Occurrence Download. 2020. Available online: https://doi.org/10.15468/dl.tvxp24 (accessed on 13 September 2020).
- Assis, J.; Tyberghein, L.; Bosch, S.; Verbruggen, H.; Serrão, E.; De Clerck, O. Bio-ORACLE v2.0: Extending marine data layers for bioclimatic modelling. Glob. Ecol. Biogeogr. 2017, 27, 277–284. [Google Scholar] [CrossRef]
- Tyberghein, L.; Verbruggen, H.; Pauly, K.; Troupin, C.; Mineur, F.; De Clerck, O. Bio-ORACLE: A global environmental dataset for marine species distribution modelling. Glob. Ecol. Biogeogr. 2012, 21, 272–281. [Google Scholar] [CrossRef]
- Sbrocco, E.; Barber, P. MARSPEC: Ocean climate layers for marine spatial ecology. Ecology 2013, 94, 979. [Google Scholar] [CrossRef]
- Bosch, S.; Tyberghein, L.; De Clerck, O.; Fernandez, S.; Schepers, L. sdmpredictors: Species Distribution Modelling Predictor Datasets. R Package Version 0.2.9. Available online: https://CRAN.R-project.org/package=sdmpredictors (accessed on 1 June 2020).
- Dray, S.; Dufour, A.; Thioulouse, J. ade4: Analysis of Ecological Data: Exploratory and Euclidean Methods in Environmental Sciences. R Package Version 1.7-16. Available online: https://CRAN.R-project.org/package=ade4 (accessed on 1 June 2020).
- Wilson, K.; Skinner, M.; Lotze, H. Projected 21st-century distribution of canopy-forming seaweeds in the Northwest Atlantic with climate change. Divers. Distrib. 2018, 25, 582–602. [Google Scholar] [CrossRef] [Green Version]
- Roleda, M.; Hurd, C. Seaweed nutrient physiology: Application of concepts to aquaculture and bioremediation. Phycologia 2019, 58, 552–562. [Google Scholar] [CrossRef] [Green Version]
- Barbet-Massin, M.; Rome, Q.; Villemant, C.; Courchamp, F. Can species distribution models really predict the expansion of invasive species? PLoS ONE 2018, 13, e0193085. [Google Scholar] [CrossRef] [Green Version]
- Thuiller, W.; Georges, D.; Engler, R.; Breiner, F.; Georges, M.D.; Thuiller, C.W. Biomod2: Ensemble Platform for Species Distribution Modelling. R Package Version 3.4.6. Available online: https://CRAN.R-project.org/package=biomod2 (accessed on 26 February 2020).
- Thuiller, W. Patterns and uncertainties of species’ range shifts under climate change. Glob. Chang. Biol. 2004, 10, 2020–2027. [Google Scholar] [CrossRef]
- Araujo, M.; Pearson, R.; Thuiller, W.; Erhard, M. Validation of species-climate impact models under climate change. Glob. Chang. Biol. 2005, 11, 1504–1513. [Google Scholar] [CrossRef] [Green Version]
- Araujo, M.B.; Guisan, A. Five (or so) challenges for species distribution modelling. J. Biogeogr. 2006, 33, 1677–1688. [Google Scholar] [CrossRef]
- Hijmans, R.J. Cross-validation of species distribution models: Removing spatial sorting bias and calibration with a null model. Ecology 2012, 93, 679–688. [Google Scholar] [CrossRef] [PubMed]
- Hastings, R.; Cummins, V.; Holloway, P. Assessing the Impact of Physical and Anthropogenic Environmental Factors in Determining the Habitat Suitability of Seagrass Ecosystems. Sustainability 2020, 12, 8302. [Google Scholar] [CrossRef]
- Hanley, J.A.; McNeil, B.J. The meaning and use of the area under a receiver operating characteristic (ROC) curve. distributions and projecting potential future shifts under. Radiology 1982, 143, 29–33. [Google Scholar] [CrossRef] [Green Version]
- McHugh, M. Interrater reliability: The kappa statistic. Biochem. Med. 2012, 15, 276–282. [Google Scholar] [CrossRef]
- Lüning, K.; Yarish, C.; Kirkman, H. Seaweeds: Their Environment, Biogeography, and Ecophysiology; John and Wiley & Sons: Hoboken, NJ, USA, 1990. [Google Scholar]
- Eggert, A. Seaweed responses to temperature. In Seaweed Biology: Novel Insights into Eco-Physiology, Ecology and Utilization; Wiencke, C., Bischof, K., Eds.; Springer: Heidelberg/Berlin, Germany, 2012; pp. 47–66. [Google Scholar]
- Dormann, C.F.; Bobrowski, M.; Dehling, D.M.; Harris, D.J.; Hartig, F.; Lischke, H.; Moretti, M.D.; Pagel, J.; Pinkert, S.; Schleuning, M.; et al. Biotic interactions in species distribution modelling: 10 questions to guide interpretation and avoid false conclusions. Glob. Ecol. Biogeogr. 2018, 27, 1004–1016. [Google Scholar] [CrossRef] [Green Version]
- Peterson, A.T.; Soberón, J.; Ramsey, J.; Osorio-Olvera, L. Co-occurrence networks do not support identification of biotic interactions. Biodivers. Inform. 2020, 15, 1–10. [Google Scholar] [CrossRef]
- De la Torre Cerro, R.; Holloway, P. A review of the methods for studying biotic interactions in phenological analyses. Methods Ecol. Evol. 2021, 12, 227–244. [Google Scholar] [CrossRef]
- Wisz, M.S.; Pottier, J.; Kissling, W.D.; Pellissier, L.; Lenoir, J.; Damgaard, C.F.; Dormann, C.F.; Forchhammer, M.C.; Grytnes, J.A.; Guisan, A.; et al. The role of biotic interactions in shaping distributions and realised assemblages of species: Implications for species distribution modelling. Biol. Rev. 2013, 88, 15–30. [Google Scholar] [CrossRef] [PubMed] [Green Version]
- Miller, J.A.; Holloway, P. Incorporating movement in species distribution models. Prog. Phys. Geogr. 2015, 39, 837–849. [Google Scholar] [CrossRef]
- Engler, R.; Guisan, A.; Rechsteiner, L. An improved approach for predicting the distribution of rare and endangered species from occurrence and pseudo-absence data. J. Appl. Ecol. 2004, 41, 263–274. [Google Scholar] [CrossRef]
- Guisan, A.; Thuiller, W.; Zimmerman, N.E. Habitat Suitability and Distribution Models: With Applications in R; Cambridge University Press: Cambridge, UK, 2017. [Google Scholar]
- Flanders Marine Institute. Maritime Boundaries Geodatabase: Maritime Boundaries and Exclusive Economic Zones (200NM), Version 11. Available online: https://www.marineregions.org (accessed on 1 June 2020).
Figure 1.
Map of the study sites (a) the Republic of Ireland situated within Ireland and (b) The Republic of Ireland with locations mentioned in the text documented.
Figure 1.
Map of the study sites (a) the Republic of Ireland situated within Ireland and (b) The Republic of Ireland with locations mentioned in the text documented.

Figure 2.
Plot showing the geographic projection of Asparagopsis armata parameterized using non-native data only represented as (a) the mean of ensembled habitat suitability across all iterations, (b) the median, (c) the upper confidence interval and (d) the lower confidence interval, as well as Asparagopsis armata parameterized using native and non-native data represented as (e) the mean of ensembled habitat suitability across all iterations, (f) the median, (g) the upper confidence interval and (h) the lower confidence interval.

Figure 3.
Plot showing the geographic projection of Asparagopsis taxiformis parameterized using non-native data only represented as (a) the mean of ensembled habitat suitability across all iterations, (b) the median, (c) the upper confidence interval and (d) the lower confidence interval, as well as Asparagopsis taxiformis parameterized using native and non-native data represented as (e) the mean of ensembled habitat suitability across all iterations, (f) the median, (g) the upper confidence interval and (h) the lower confidence interval.


Table 1.
Information on the geospatial environmental layers used in the modelling framework, along with justification for their inclusion.
Table 1.
Information on the geospatial environmental layers used in the modelling framework, along with justification for their inclusion.
| Layer | Justification |
|---|---|
| Mean of diffuse attenuation | Diffuse attenuation, which is an indicator of light availability [54]; this light availability is important as it drives photosynthesis and growth of seaweeds [55]. |
| Dissolved oxygen | Significant contributor in PCA analysis (Supplementary Information 1). |
| Nitrate | The nutrient Nitrogen limits seaweed growth [55]. |
| pH | Significant contributor in PCA analysis (Supplementary Information 1). |
| Phosphate | The nutrient phosphorous limits seaweed growth (Roleda and Hurd, 2019). |
| Sea surface temperature range | Temperature is a primary range limiting factor [33]. |
| Temperature of warmest month | Temperature is a primary range limiting factor [33]. |
| Mean sea surface salinity | Significant contributor in PCA analysis (Supplementary Information 1). |
| Distance from shore | Distance to shore as A.armata is mainly found in the sublittoral zone [44]. |
| Bathymetry | Bathymetry as A.armata is mainly found in the sublittoral zone [44]. |
| Ulva lactuca species distribution | A.armata is an epiphyte that attaches to other seaweeds utilising its barbs [32]. |
Table 2.
Information on the models with source of the response data and pseudo-absence data.
| Model | Presence | Pseudo-Absence |
|---|---|---|
| A. armata (non-native only) | Ireland | Ireland (10,000) |
| A. armata (native and non-native) | Ireland New Zealand | Ireland (5000) New Zealand (5000) |
| A. taxiformis (non-native only) | Portugal | Portugal (10,000) |
| A. taxiformis (native and non-native) | Portugal Australia | Portugal (5000) Australia (5000) |
Table 3.
Accuracy metrics for the different models. CI = confidence interval. AUC = area under the curve. TSS = true skill statistics.
Table 3.
Accuracy metrics for the different models. CI = confidence interval. AUC = area under the curve. TSS = true skill statistics.
| Model | Metric | Mean Ensemble | CI (Lower) Ensemble | CI (Upper) Ensemble | Median Ensemble |
|---|---|---|---|---|---|
| A. armata (non-native) | AUC | 0.999 | 0.999 | 0.999 | 0.998 |
| A. armata (non-native) | TSS | 0.985 | 0.985 | 0.984 | 0.984 |
| A. armata (non-native and native) | AUC | 0.998 | 0.994 | 0.998 | 0.995 |
| A. armata (non-native and native) | TSS | 0.968 | 0.961 | 0.971 | 0.957 |
| A. taxiformis (non-native) | AUC | 1.000 | 1.000 | 1.000 | 0.999 |
| A. taxiformis (non-native) | TSS | 0.994 | 0.994 | 0.994 | 0.994 |
| A. taxiformis (non-native and native) | AUC | 0.998 | 0.979 | 0.998 | 0.994 |
| A. taxiformis (non-native and native) | TSS | 0.978 | 0.947 | 0.975 | 0.918 |
Table 4.
Variable impact on habitat suitability for the Asparagopsis spp. Values refer to mean and standard deviation across all cross validation runs and difference pseudo-absence combinations. No values are returned when variables were not included in final model parameterisation. SST = sea surface temperature.
| Environmental Variables | A. armata (Non-Native Only) | A. armata (Native and Non-Native) | A. taxiformis (Non-Native Only) | A. taxiformis (Native and Non-Native) |
|---|---|---|---|---|
| Mean of diffuse attenuation | 0.08(±0.02) | 0.16(±0.04) | 0.59(±0.06) | 0.47(±0.05) |
| Dissolved oxygen | 0.08(±0.02) | 0.10(±0.05) | ||
| Nitrate | 0.05(±0.02) | 0.08(±0.04) | 0.74(±0.09) | 0.30(±0.06) |
| pH | 0.09(±0.05) | 0.07(±0.03) | 0.21(±0.06) | 0.20(±0.05) |
| Phosphate | 0.1(±0.06) | 0.13(±0.06) | ||
| SST range | 0.1(±0.05) | 0.03(±0.01) | 0.33(±0.03) | 0.07(±0.02) |
| Temperature of warmest month | 0.06(±0.05) | 0.06(±0.02) | 0.60(±0.06) | 0.14(±0.01) |
| Mean sea surface salinity | 0.1(±0.03) | 0.07(±0.02) | 0.43(±0.06) | 0.06(±0.06) |
| Distance from shore | 0.2(±0.07) | 0.62(±0.01) | ||
| Bathymetry | 0.2(±0.08) | 0.33(±0.04) | ||
| Ulva lactuca species distribution | 0.61(±0.09) | 0.19(±0.04) |
Publisher’s Note: MDPI stays neutral with regard to jurisdictional claims in published maps and institutional affiliations. |
© 2021 by the authors. Licensee MDPI, Basel, Switzerland. This article is an open access article distributed under the terms and conditions of the Creative Commons Attribution (CC BY) license (https://creativecommons.org/licenses/by/4.0/).
Share and Cite
MDPI and ACS Style
O’Mahony, J.; de la Torre Cerro, R.; Holloway, P. Modelling the Distribution of the Red Macroalgae Asparagopsis to Support Sustainable Aquaculture Development. AgriEngineering 2021, 3, 251-265. https://doi.org/10.3390/agriengineering3020017
AMA Style
O’Mahony J, de la Torre Cerro R, Holloway P. Modelling the Distribution of the Red Macroalgae Asparagopsis to Support Sustainable Aquaculture Development. AgriEngineering. 2021; 3(2):251-265. https://doi.org/10.3390/agriengineering3020017
Chicago/Turabian StyleO’Mahony, James, Rubén de la Torre Cerro, and Paul Holloway. 2021. "Modelling the Distribution of the Red Macroalgae Asparagopsis to Support Sustainable Aquaculture Development" AgriEngineering 3, no. 2: 251-265. https://doi.org/10.3390/agriengineering3020017