New Conceptual Model for the Magma-Hydrothermal-Tectonic System of Krafla, NE Iceland


ÍSOR, Iceland GeoSurvey, 108 Reykjavík, Iceland
Geosciences 2020, 10(1), 34; https://doi.org/10.3390/geosciences10010034
Submission received: 11 December 2019
/
Revised: 8 January 2020
/
Accepted: 16 January 2020
/
Published: 19 January 2020
(This article belongs to the Special Issue Exploring and Modeling the Magma-Hydrothermal Regime)
Abstract
:The complexity of the Krafla volcano and its geothermal system(s) has puzzled geoscientists for decades. New and old geoscientific studies are reviewed in order to shed some light on this complexity. The geological structure and history of the volcano is more complex than hitherto believed. The visible 110 ka caldera hosts, now buried, an 80 ka inner caldera. Both calderas are bisected by an ESE-WNW transverse low-density structure. Resistivity surveys show that geothermal activity has mainly been within the inner caldera but cut through by the ESE-WNW structure. The complexity of the geothermal system in the main drill field can be understood by considering the tectonic history. Isotope composition of the thermal fluids strongly suggests at least three different geothermal systems. Silicic magma encountered in wells K-39 and IDDP-1 indicates a hitherto overlooked heat transport mechanism in evolved volcanos. Basaltic intrusions into subsided hydrothermally altered basalt melt the hydrated parts, producing a buoyant silicic melt which migrates upwards forming sills at shallow crustal levels which are heat sources for the geothermal system above. This can explain the bimodal behavior of evolved volcanos like Krafla and Askja, with occasional silicic, often phreatic, eruptions but purely basaltic in-between. When substantial amounts of silicic intrusions/magma have accumulated, major basalt intrusion(s) may “ignite” them causing a silicic eruption.
1. Introduction
The Krafla volcano is the most studied volcano in Iceland. The onset of the Krafla Fires 1975–1984, often referred to as the Krafla Rifting Episode, initiated intensive volcanological research which greatly increased the understanding of volcanism in extensional rift settings. The Krafla volcano has been closely monitored since the Krafla Fires. Geothermal exploration and drilling have also built-up extensive knowledge on the volcano and its geothermal system(s).
The Krafla region has long been known for its geothermal activity. The first geothermal exploration was conducted in 1969 and was continued the following years [1,2]. The first two exploration wells were drilled in 1974. Based on the findings, it was decided to build the first major geothermal power plant in Iceland in Krafla. The construction of a 60 MWe power plant and production drilling started in 1975 and were continued concurrently with the Krafla Fires that started in December 1975. It soon became apparent that the Krafla Fires caused contamination by magmatic gases, CO2 and H2S [3,4,5]. In the deeper part of the wellfield at that time, to the west and south-west of Mt. Krafla, the volcanic gases increased dramatically in the deeper part of the reservoir and massive precipitation of pyrite and pyrrhotite clogged the wells. The shallower colder part of the reservoir was, however, not affected. Drilling activities were therefore shifted to the southern slopes of Mt. Krafla and Hvíthólar and in 1978, the power plant started the production of 7 MWe. Production drilling continued and, in 1984, the production was up to 30 MWe. In 1990, a new exploration and drilling phase started. The contamination of magmatic gases was diminishing and, by 1999, the power plant was fully operational and producing 60 MWe.
The complexity of the Krafla volcano and its geothermal activity has puzzled geoscientists for a long time and a convincing conceptual model of the volcano and geothermal activity has, in the opinion of the author, been lacking. In this paper, an attempt is made to shed some light on this complexity. A review of old and new information and data and numerical modelling are used to put forward a new, hopefully sensible, conceptual model for the Krafla volcano and its geothermal systems.
2. Tectonic Setting and Geology
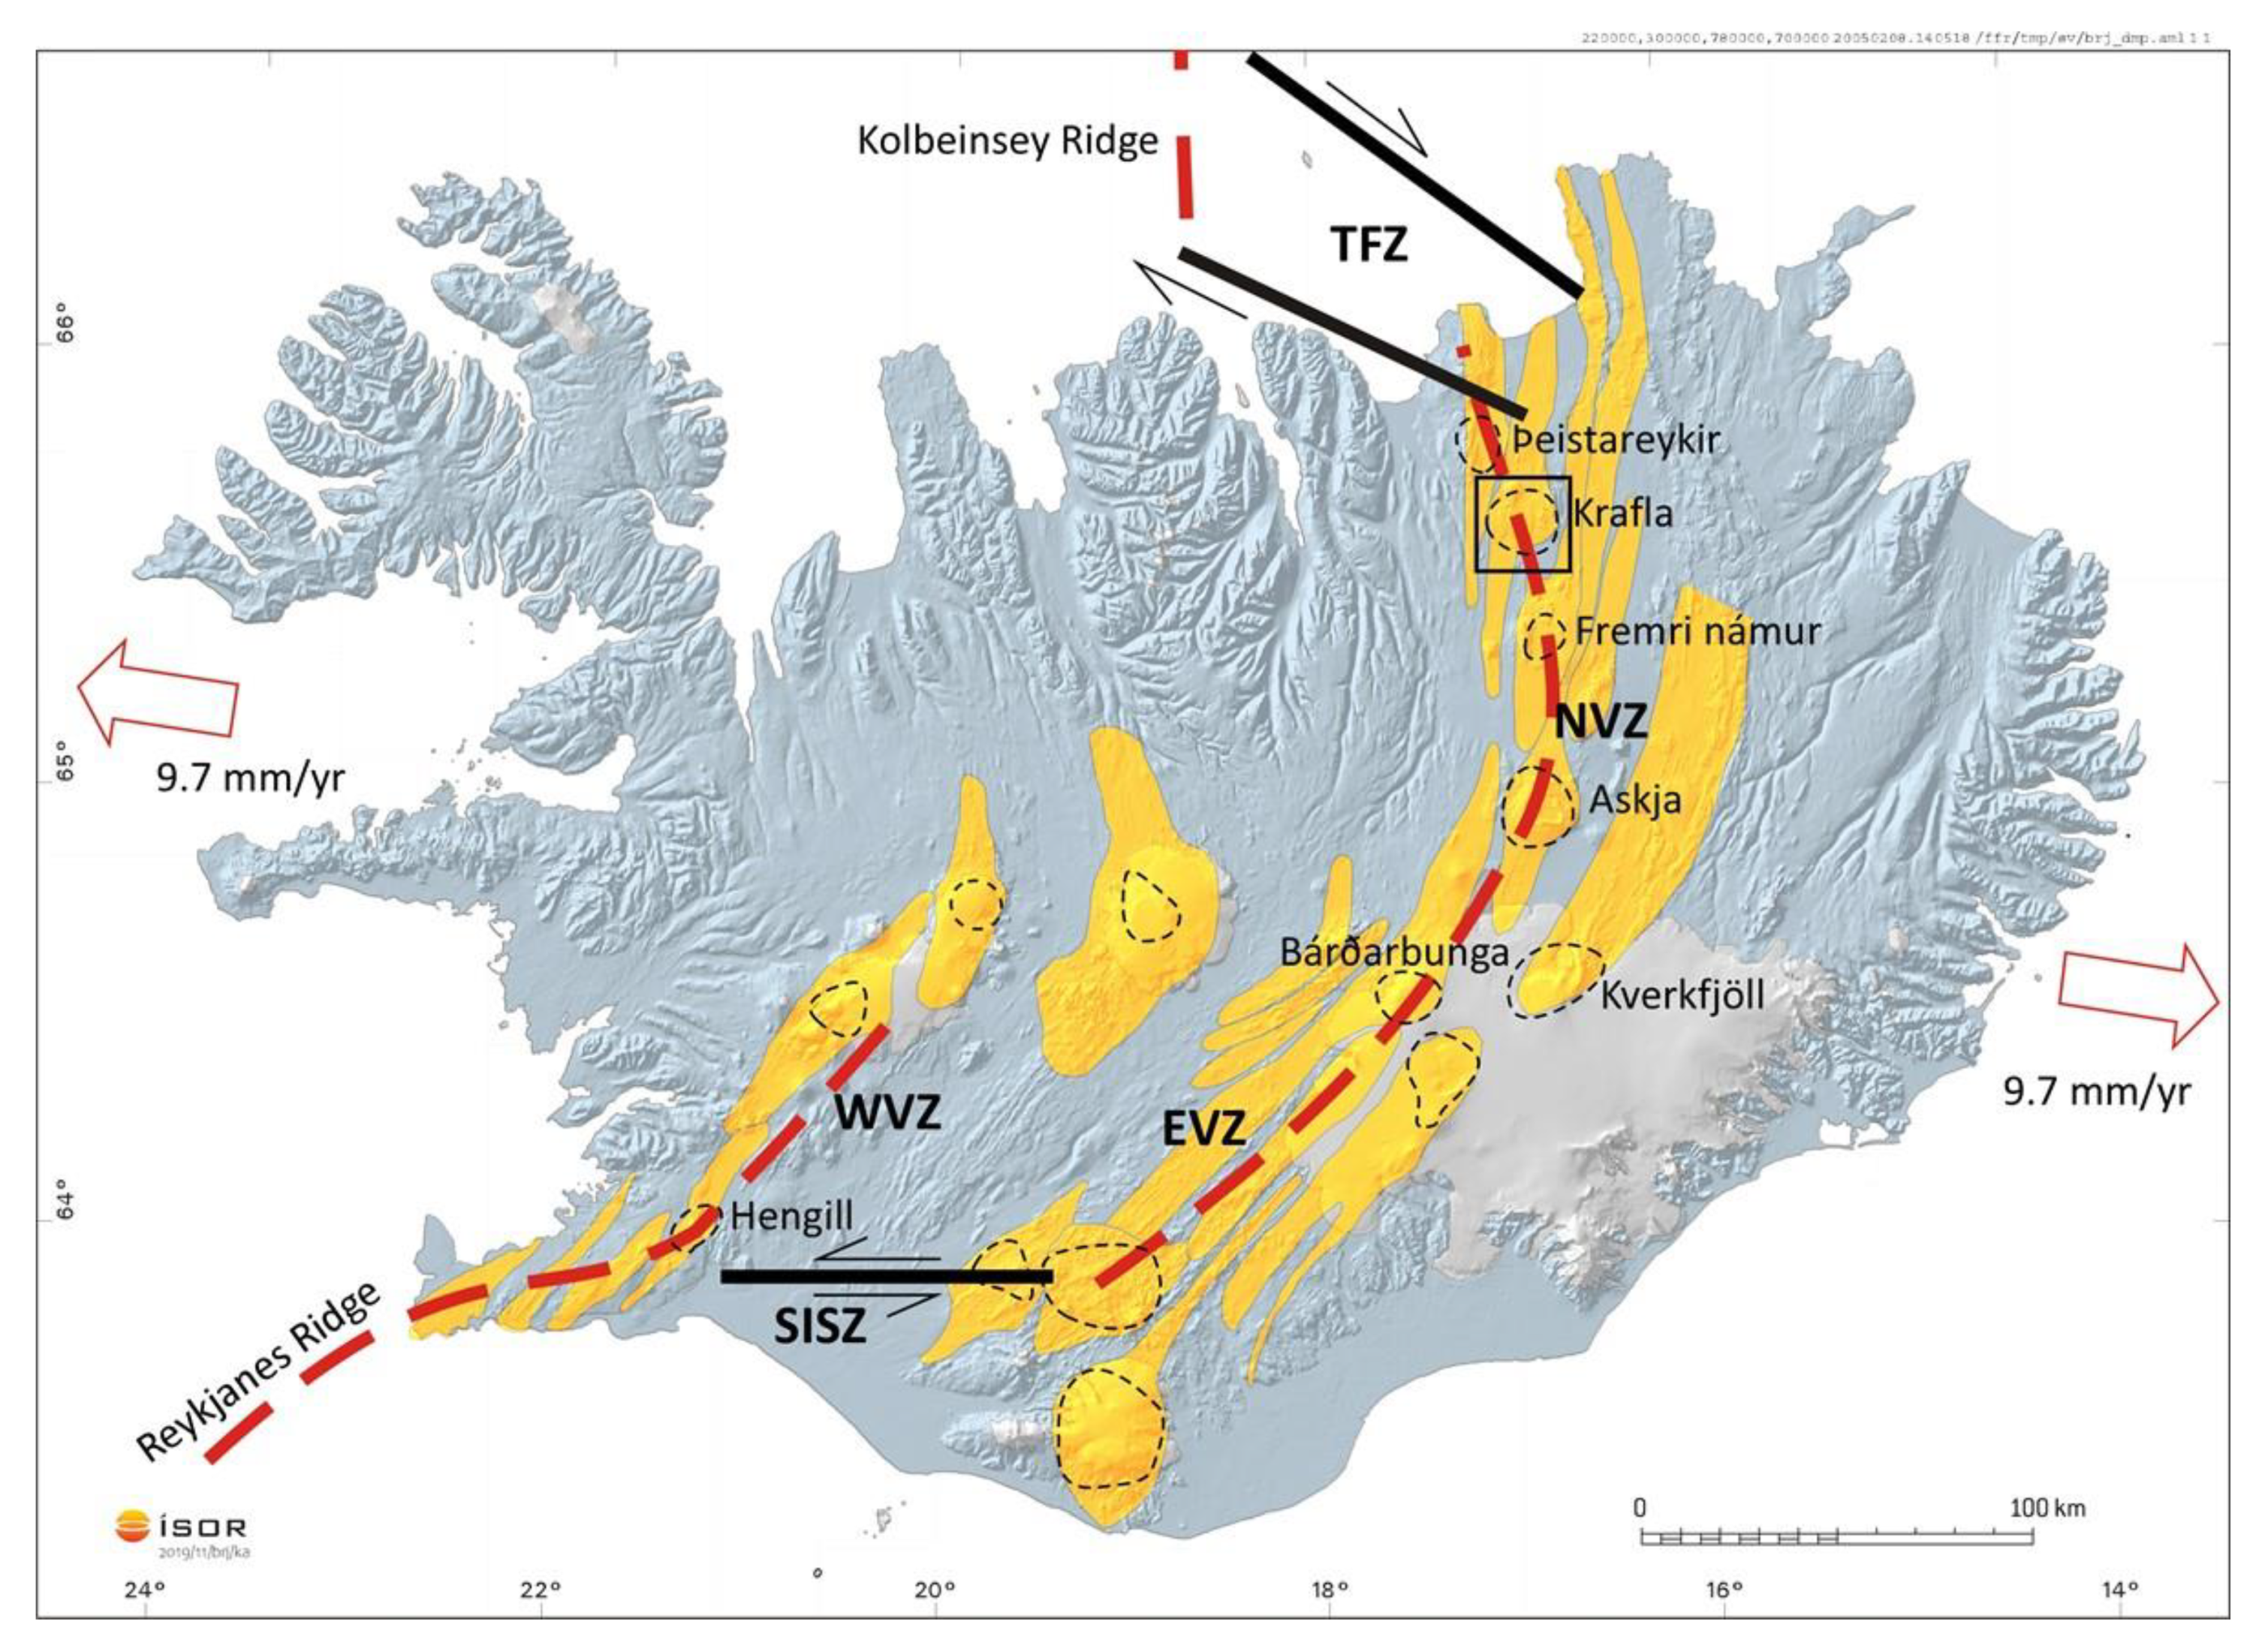
The Krafla volcano is located within the Northern Volcanic Zone of Iceland (Figure 1). The Reykjanes Ridge (Mid-Atlantic Ridge) comes on shore at the tip of the Reykjanes peninsula, SW Iceland. Crustal spreading veers to the northeast because of an interaction with a mantle plume under central Iceland. The plate boundary coincides with the Reykjanes peninsula with a mixed strike–slip and extensional motion [6] to the Hengill volcano, which is a triple point with the Western Volcanic Zone (WVZ) and the South Iceland Seismic Zone (SISZ). The SISZ is a left lateral strike–slip zone that conveys most of the crustal spreading to the Eastern Volcanic Zone (EVZ) and connects to the Northern Volcanic Zone (NVZ). The spreading then veers north-westward to the Kolbeinsey Ridge, north of Iceland, through a right lateral transform zone, the Tjörnes Fracture Zone (TFZ).
Figure 1 shows that the NVZ is arc-shaped towards the transform zones in the north. It hosts five volcanic centres, from south to north, Kverkfjöll, Askja, Fremri Námur, Krafla and Þeistareykir. Each volcanic centre has its own fissure swarm. The fissure swarms overlap and are arranged in a westward stepping en-echelon fashion.
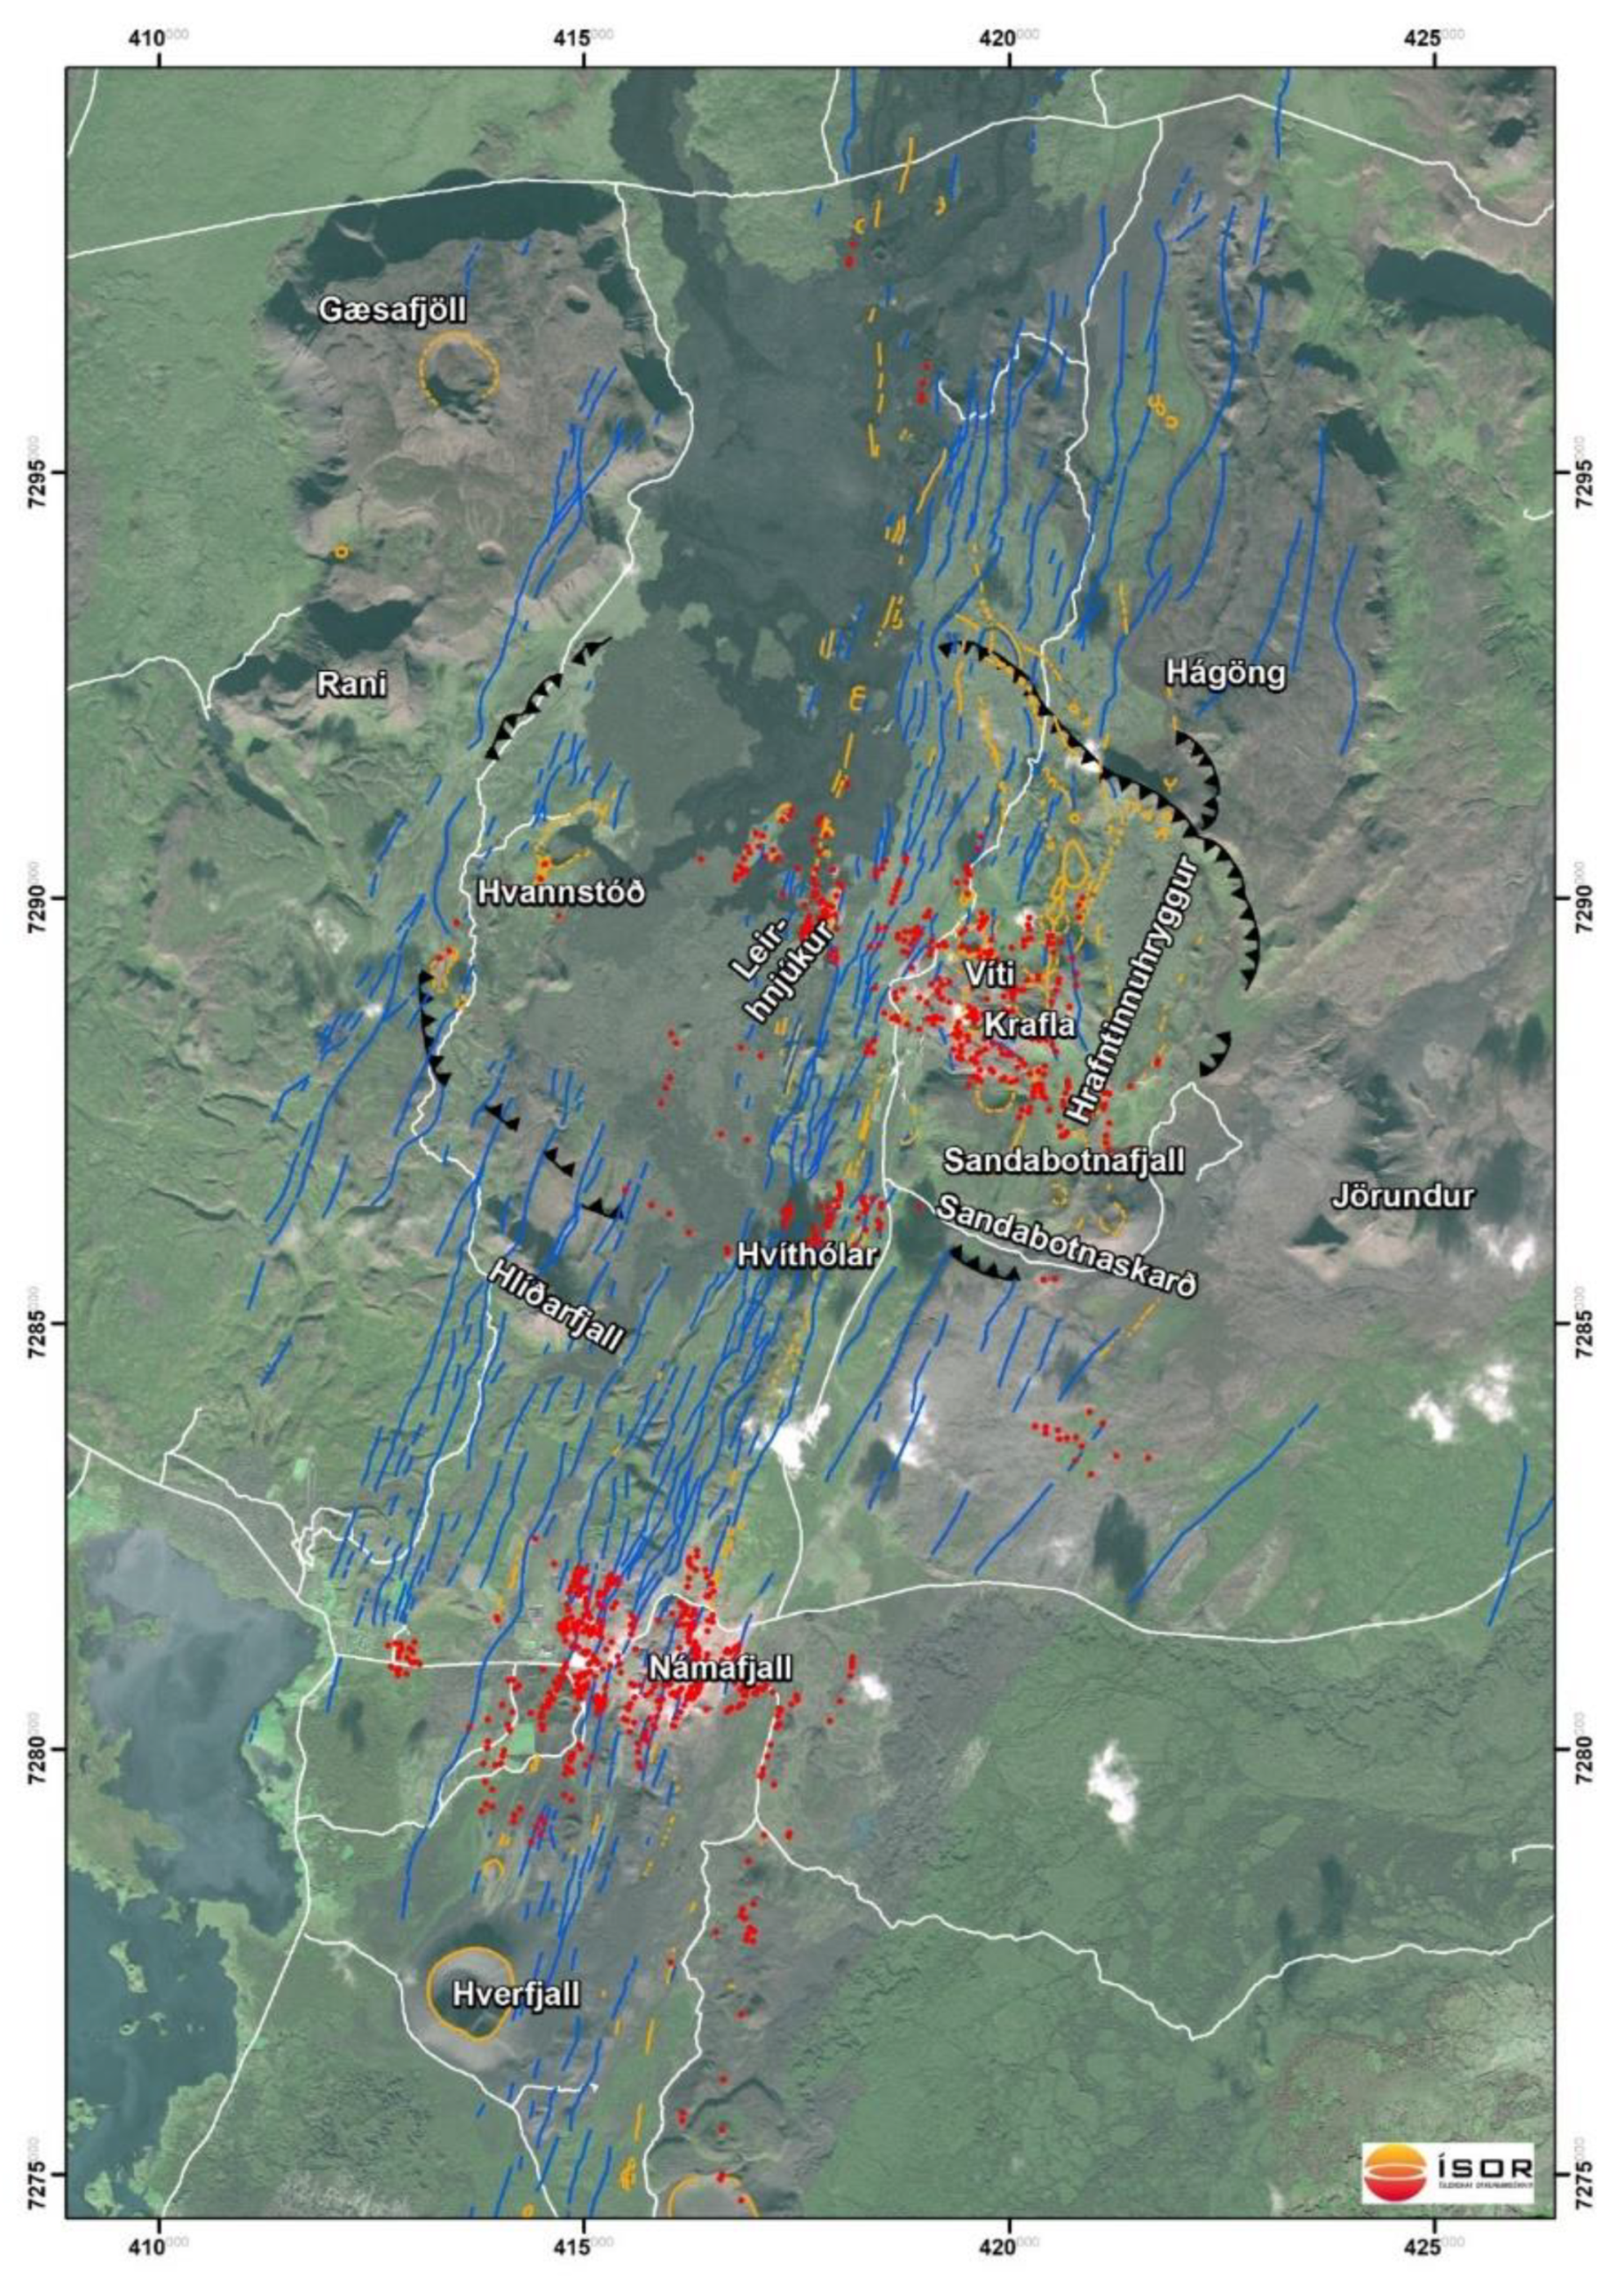
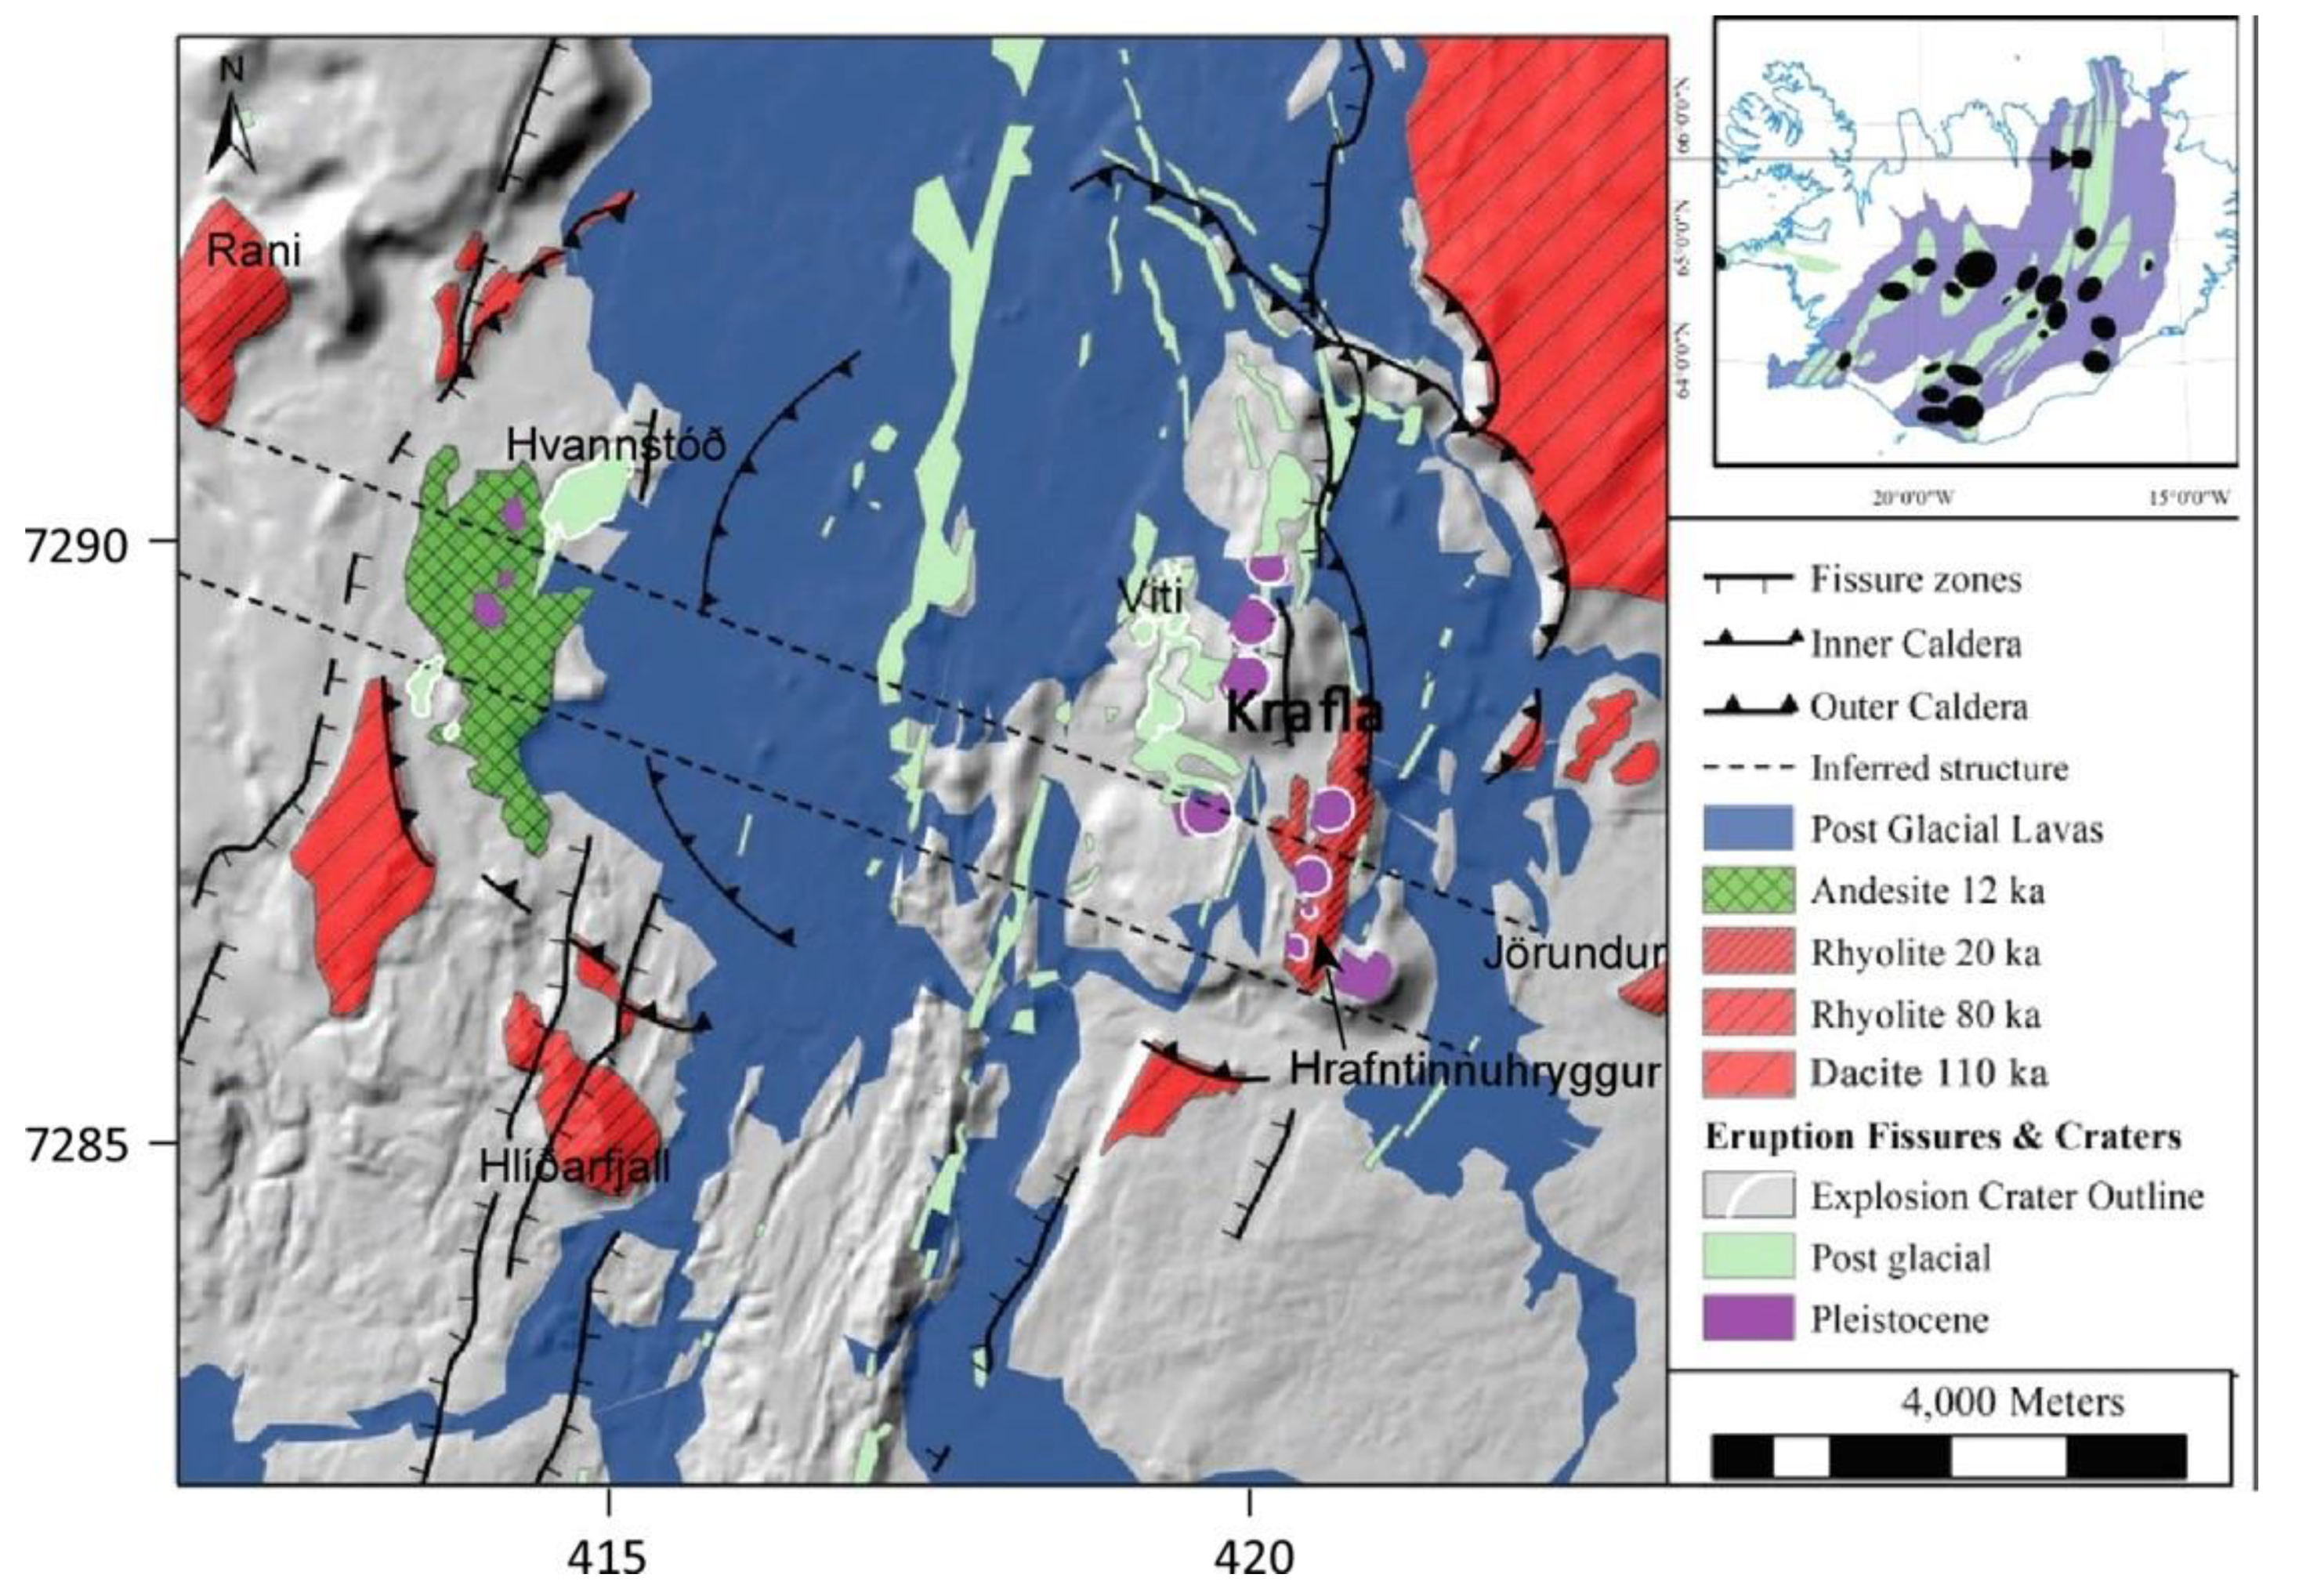
The Krafla volcanic system is believed to have been active for about 200,000 years [7]. The volcanic system consists of a central volcano, approximately 20 km in diameter, bisected by an about 90 km long NNE-SSW trending fissure swarm (Figure 2). The fissure swarm takes up and accommodates most of the crustal spreading in the part of the northern volcanic zone around it. The central volcano is, generally speaking, characterised by gently sloping topographic high with a caldera in the middle. The caldera is about 8 to 10 km in diameter (W–E elongated) and is partly filled with volcanic products. It developed from an explosive eruption producing dacitic welded tuff about 110 ka ago [7]. The volcano remains active with recurring volcanic episodes. Krafla has a bimodal volcanic character: for long periods, it produces mainly basaltic fissure eruptions and dike injections into the fissure swarm, but intermittently, it erupts semi-silicic to silicic magma or tephra. Three such eruptions have been identified and dated [7,8]. The oldest is the phreatic eruption 110 ka ago forming the visible caldera, then subglacial lava eruptions about 80 ka old forming Hlíðarfjall SW of the caldera, Jörundur ESE of the caldera and Rani NW of the caldera and a 24 ka subglacial fissure eruption forming Hrafntinnuhryggur, an obsidian ridge south east of mount Mt. Krafla (for locations, see Figure 2 and Figure 3). Since the occurrence of the 80 ka silicic formations outside the caldera, volcanism has mainly been centred in the eastern part of the fissure swarm. A simplified geological map of Krafla is shown in Figure 3.
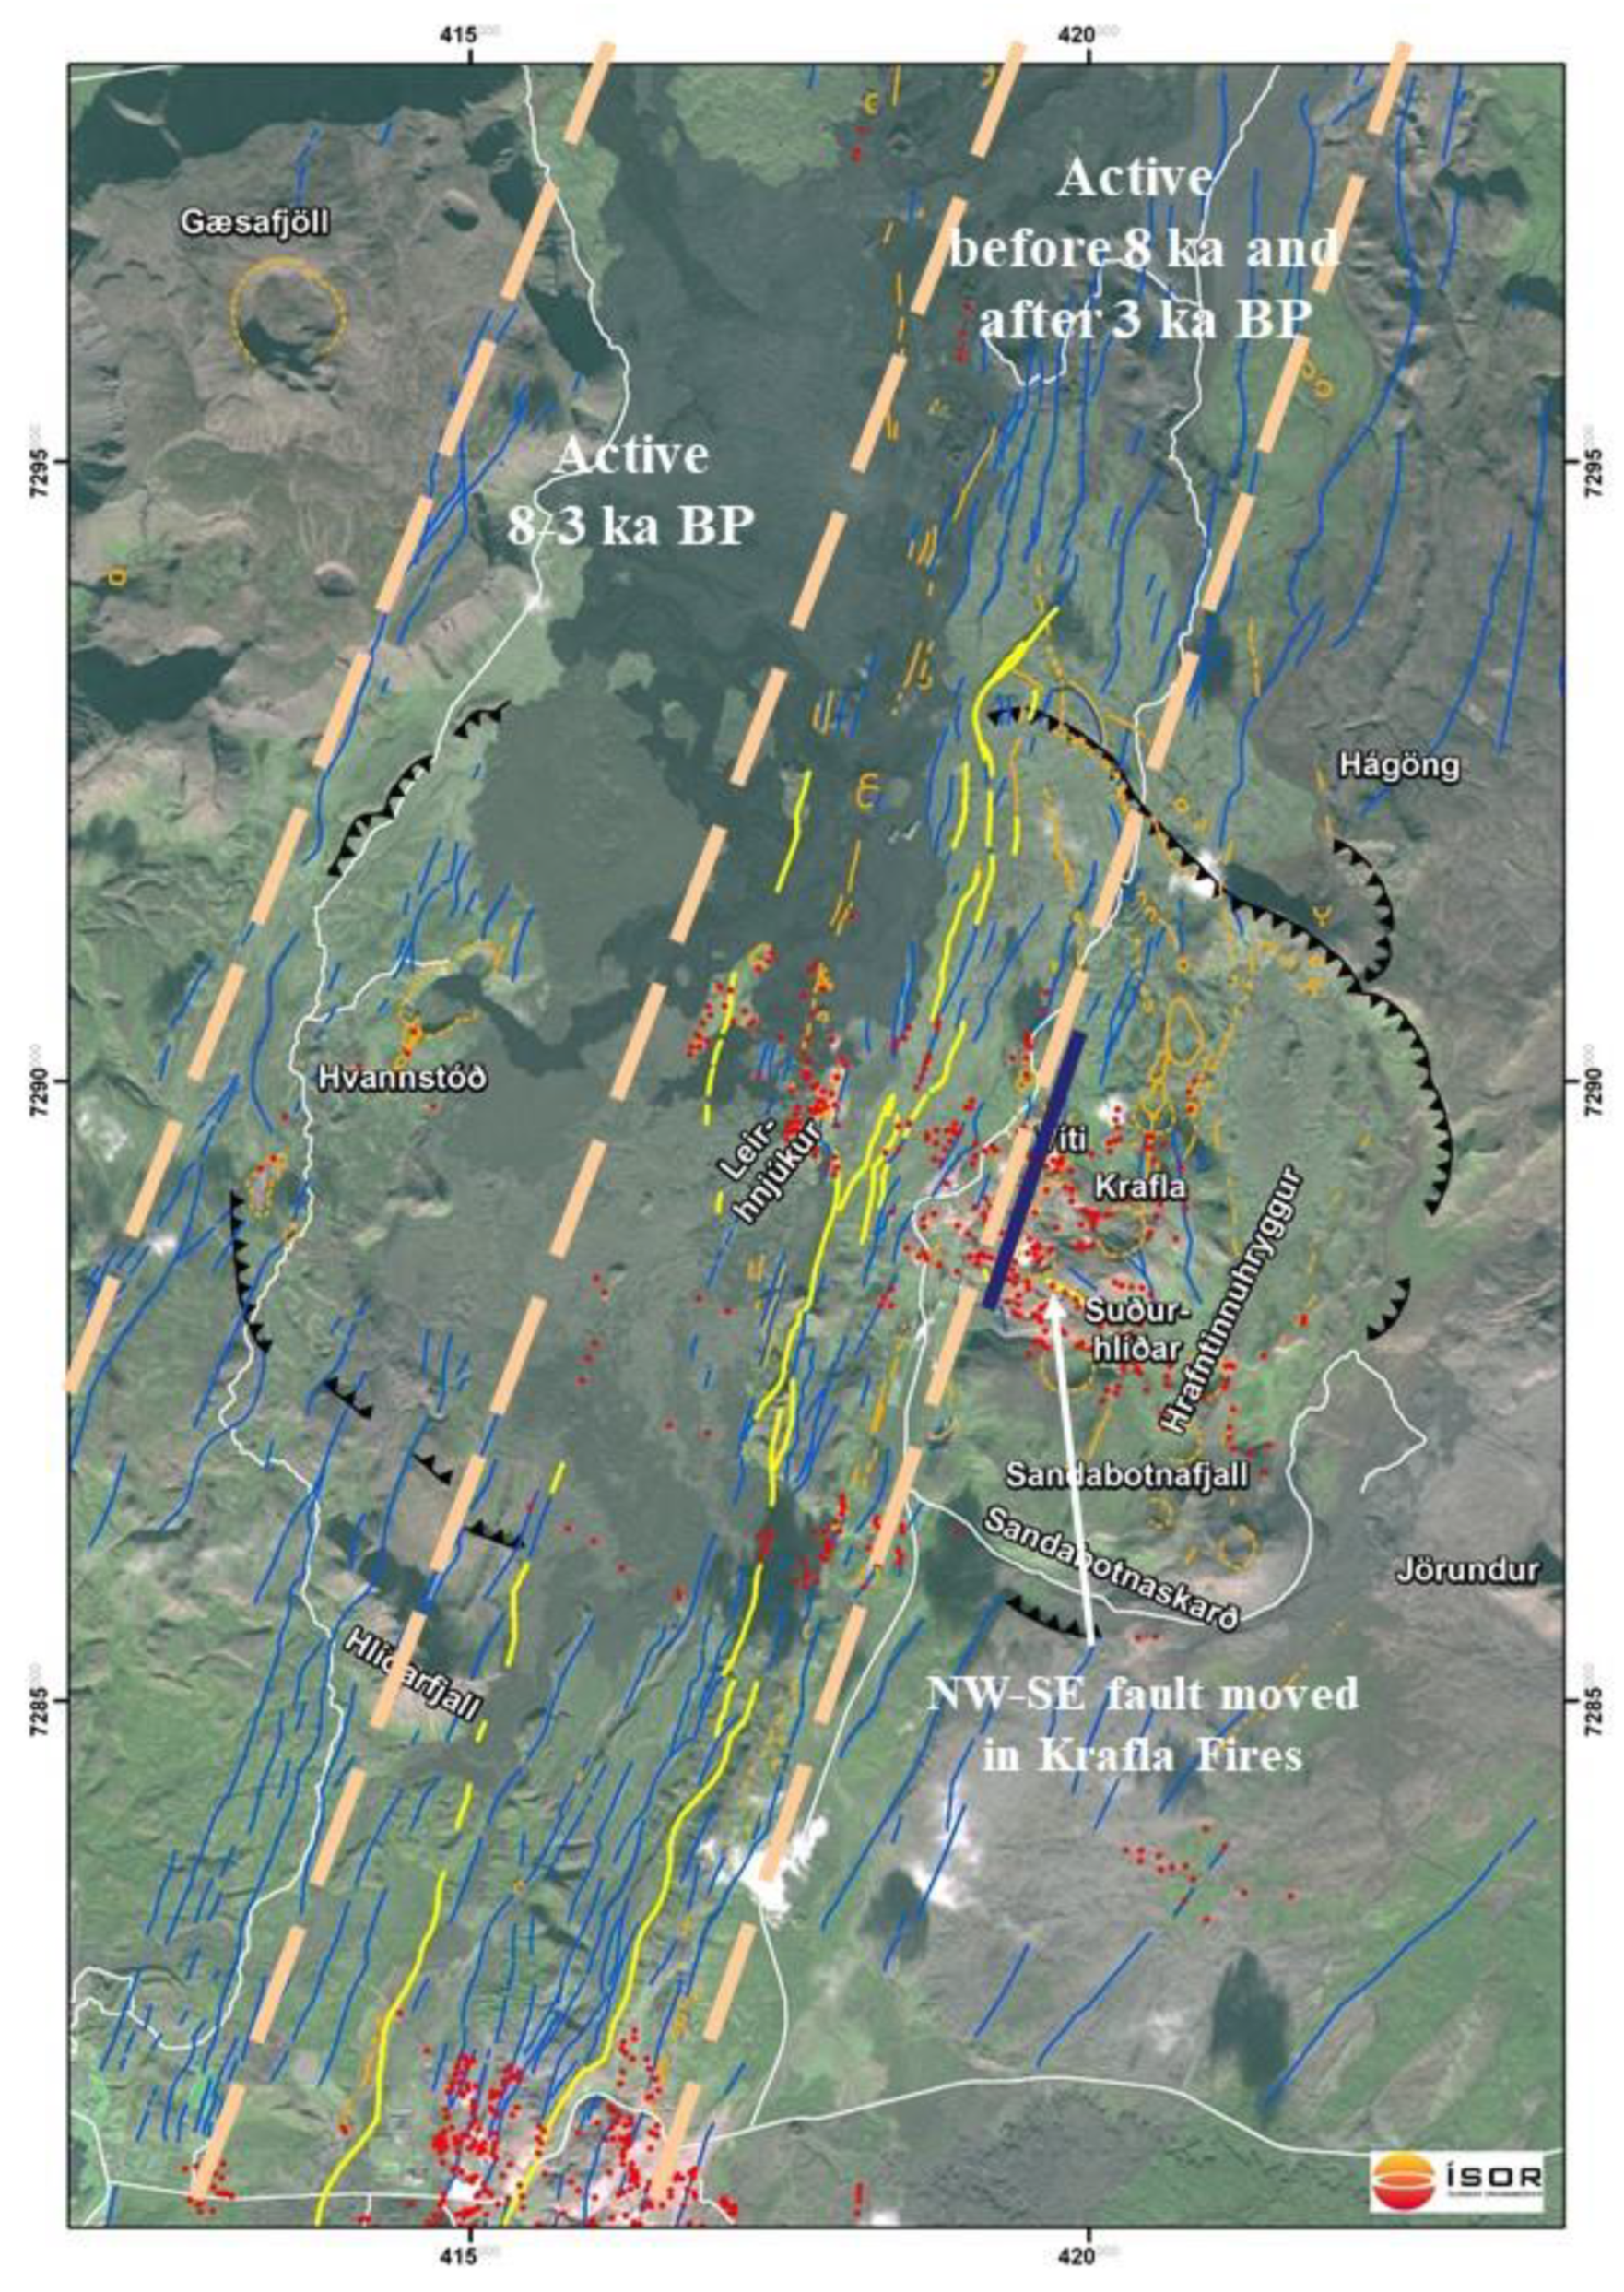
The Krafla volcanic system has also shown bimodal behaviour in tectonics and crustal spreading. About 8 ka ago, the spreading moved from the eastern part of the fissure swarm to the western part and back again about 3 ka ago [7] (Figure 4). The shifting of the spreading to the west did not result in increased volcanic activity in the western part of the caldera, only one eruption has been identified in Hvannstóð, which is about 5 ka old [7] (Figure 4). Resistivity survey shows that a mature high-temperature geothermal system never developed in the western part of the caldera (see Section 3.3 below) and only minor extinct geothermal manifestations south of Hvannstóð (Figure 4). Extrusive volcanism is almost exclusively found in the eastern part, before and after the western part of the fissure swarm was active [7], and a high-temperature geothermal system with extensive surface manifestations was developed in the eastern part (see Figure 2). The shifting back of the spreading from the western to the eastern part 3 ka ago had a profound influence on the geothermal system, as discussed below.
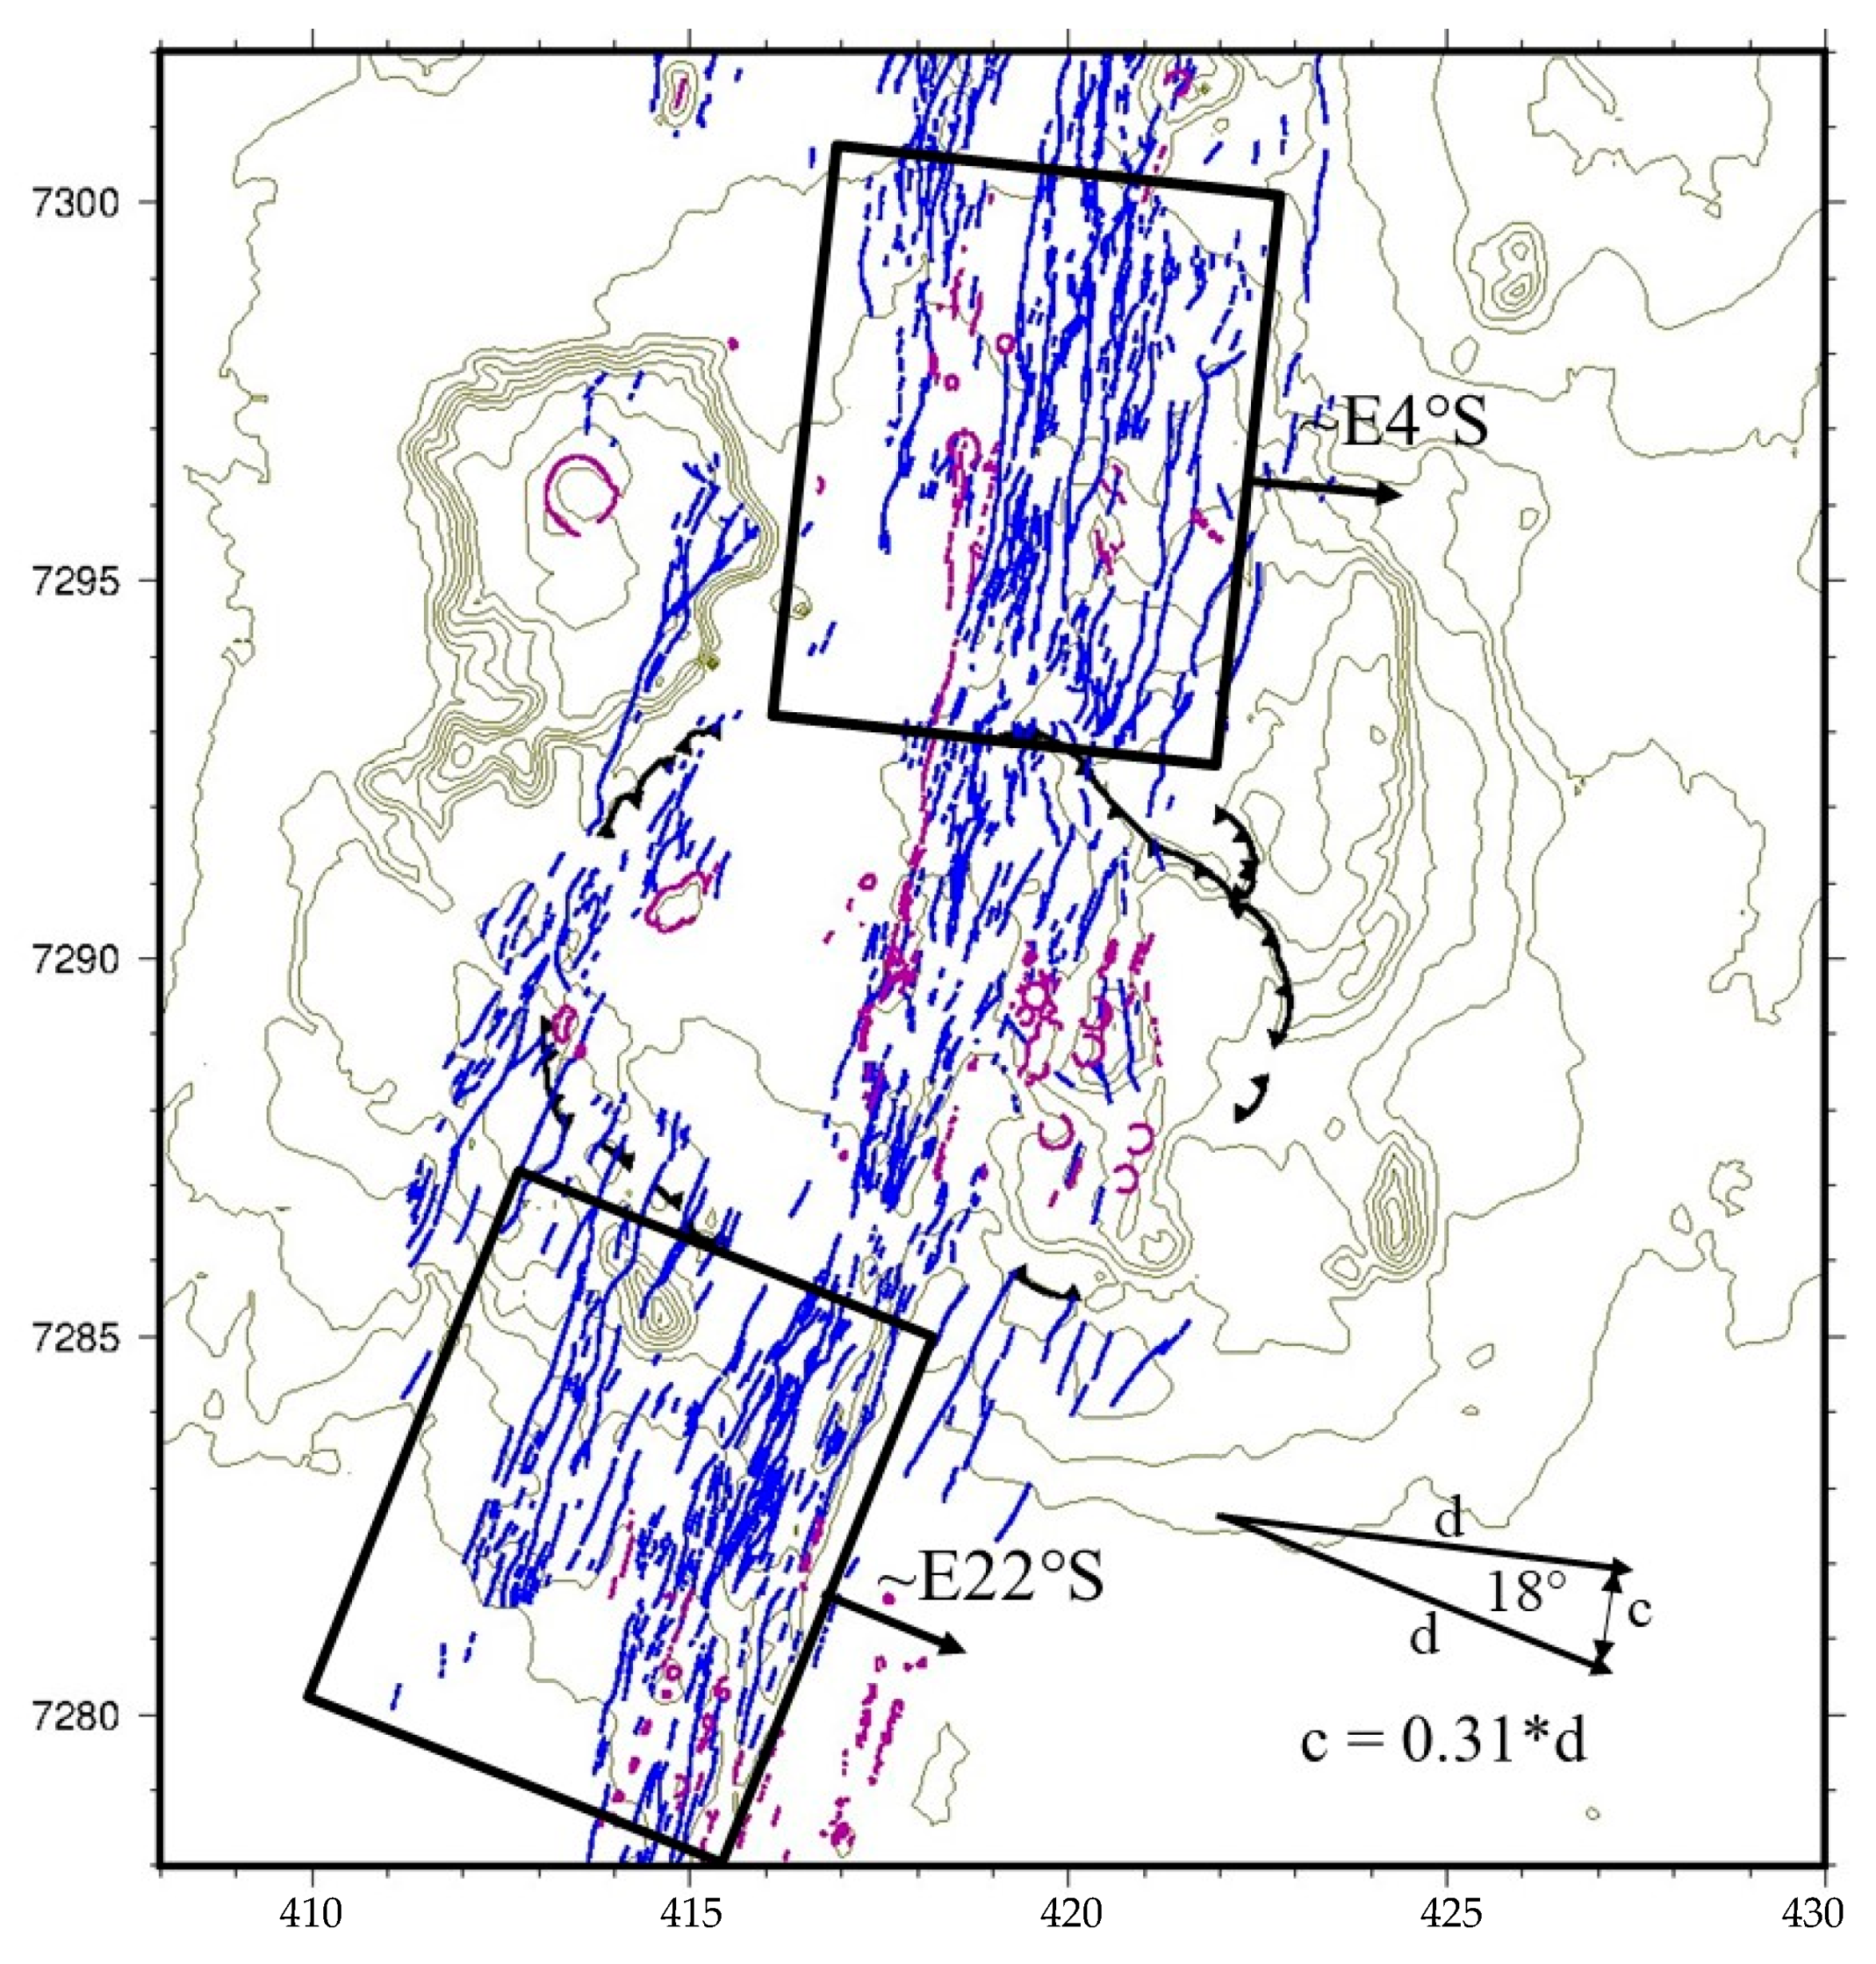
The fact that volcanic activity takes place dominantly in the eastern part of the 110 ka caldera could be explained by considering some details of the fissure swarm. Figure 5 shows that south of the Krafla caldera, the crust east of the fissure swarm is moving in an approximate direction of 22° south-east, while to the north it is moving approximately 4° south-east. These different spreading directions have been confirmed by GPS measurements [10]. The difference is about 18°, leading to a N–S opening component in the eastern part of the volcano of about one-third of the spreading motion. This opening component favours the ascent of mantle-derived magma and volcanism manifested by subglacial extrusives: Mt. Krafla, Dalfjall and Sandabotnafjall south of Mt. Krafla, abundant explosion craters in the western slopes of and south-east of Mt. Krafla (Figure 3) and post-glacial eruptions and dike injections centred at Leirhnjúkur.
During the past 3000 years, eruptions in Krafla have taken place every 300–1000 years [7]. Geothermal drilling in the central eastern and southern parts of the visible caldera has shown a pile of alternating extrusive hyaloclastites and lavas, underlain by intrusive rocks with similar bimodal compositional distribution of the volcanic and plutonic rocks in the substrata [11,12]. The depth to the intrusive rocks varies from about 800–1100 m in the central part of the caldera to about 1500–1600 m in the southern part (see discussion below).
The two latest eruptive phases of the Krafla volcano were the Mývatn Fires in 1724 to 1729 and the Krafla Fires in 1975 to 1984. The Mývatn Fires started with a phreatomagmatic eruption in the Viti crater (Figure 3) emitting glassy rhyolitic bombs and minor basaltic, felsite and gabbroic lithics, representing intrusive rocks at depth [13]. Repeated dike injections into the fissure swarm, centred at Leirhnjúkur about 2 km west of Víti, started after the initial explosion. Two main basaltic fissure eruptions took place in 1727 and 1729, mainly within the caldera but with a small eruption west of Námafjall, about 5 km south of the caldera [7].
The Krafla Fires started by a small basaltic fissure eruption within the caldera. Repeated dike injections, occasionally with small eruptions, took place until 1980. From 1981 to 1984, the four main fissure eruptions took place. All the eruptions and most of the dike injections were into the northern part of the caldera and fissure swarm, but a few were towards south, one all the way to Bjarnarflag, west of Námafjall [7,14]. During the Krafla Fires, the active fissure swarm widened by about 9 m close to the caldera and subsided by up to about 1–2 m, while the rift flanks were uplifted [15,16,17].
During the Krafla Fires, periodic uplift and subsidence took place in the caldera which were closely monitored by levelling and tilt metres [14,18,19,20,21]. In quiet periods, the ground was up-lifted by about 5 mm/day with a centre of up-lift shown approximately by the red star in Figure 6. During dike injections (and eruptions), a rapid subsidence took place and then up-lift again at the end of injection. Modelling of the deformation due to a single Mogi source indicated the centre of inflation/deflation at the depth interval of 3.9–7.5 km. Detailed study of ground deformation during and after a Krafla Fires eruption in September 1984 [18] and multiple magma reservoirs were suggested, where deeper reservoirs feed a shallow reservoir at about 2.6 km depth. This is an interesting idea and will be taken up below.
A study of seismic wave propagation from earthquakes during the Krafla Fires [22] revealed volumes within the caldera where seismic S-waves were highly attenuated or could not pass through. The estimated areal extent of these S-wave “shadows” is shown in Figure 6. The upper boundaries of the shadows were estimated to be at about 3 km depth and the lower boundaries, though poorly constrained, at about 7 km depth. These volumes have been interpreted to contain magma. This will be further discussed below.
3. Geophysics
3.1. Geodesy
During and after the Krafla Fires, crustal movements have been monitored by levelling and GPS measurements and later by Interferometric Synthetic Aperture Radar (InSAR). Inflation continued until 1989, when a deflation started. In the beginning, the subsidence was about 7 cm/year but decreased exponentially with time and by 2008 it was practically over [23]. After that, crustal deformation (subsidence) has been attributed mainly to pressure draw-down in the geothermal reservoir. From recent InSAR and GPS measurements, it appears that the deflation of the Krafla caldera since 1989 has reverted to a minor inflation at a rate of 10–15 mm/year in 2018–2019 [24]. Whether this is due to magma transport or re-injection of fluids into the geothermal reservoir needs to be worked out.
3.2. Gravity
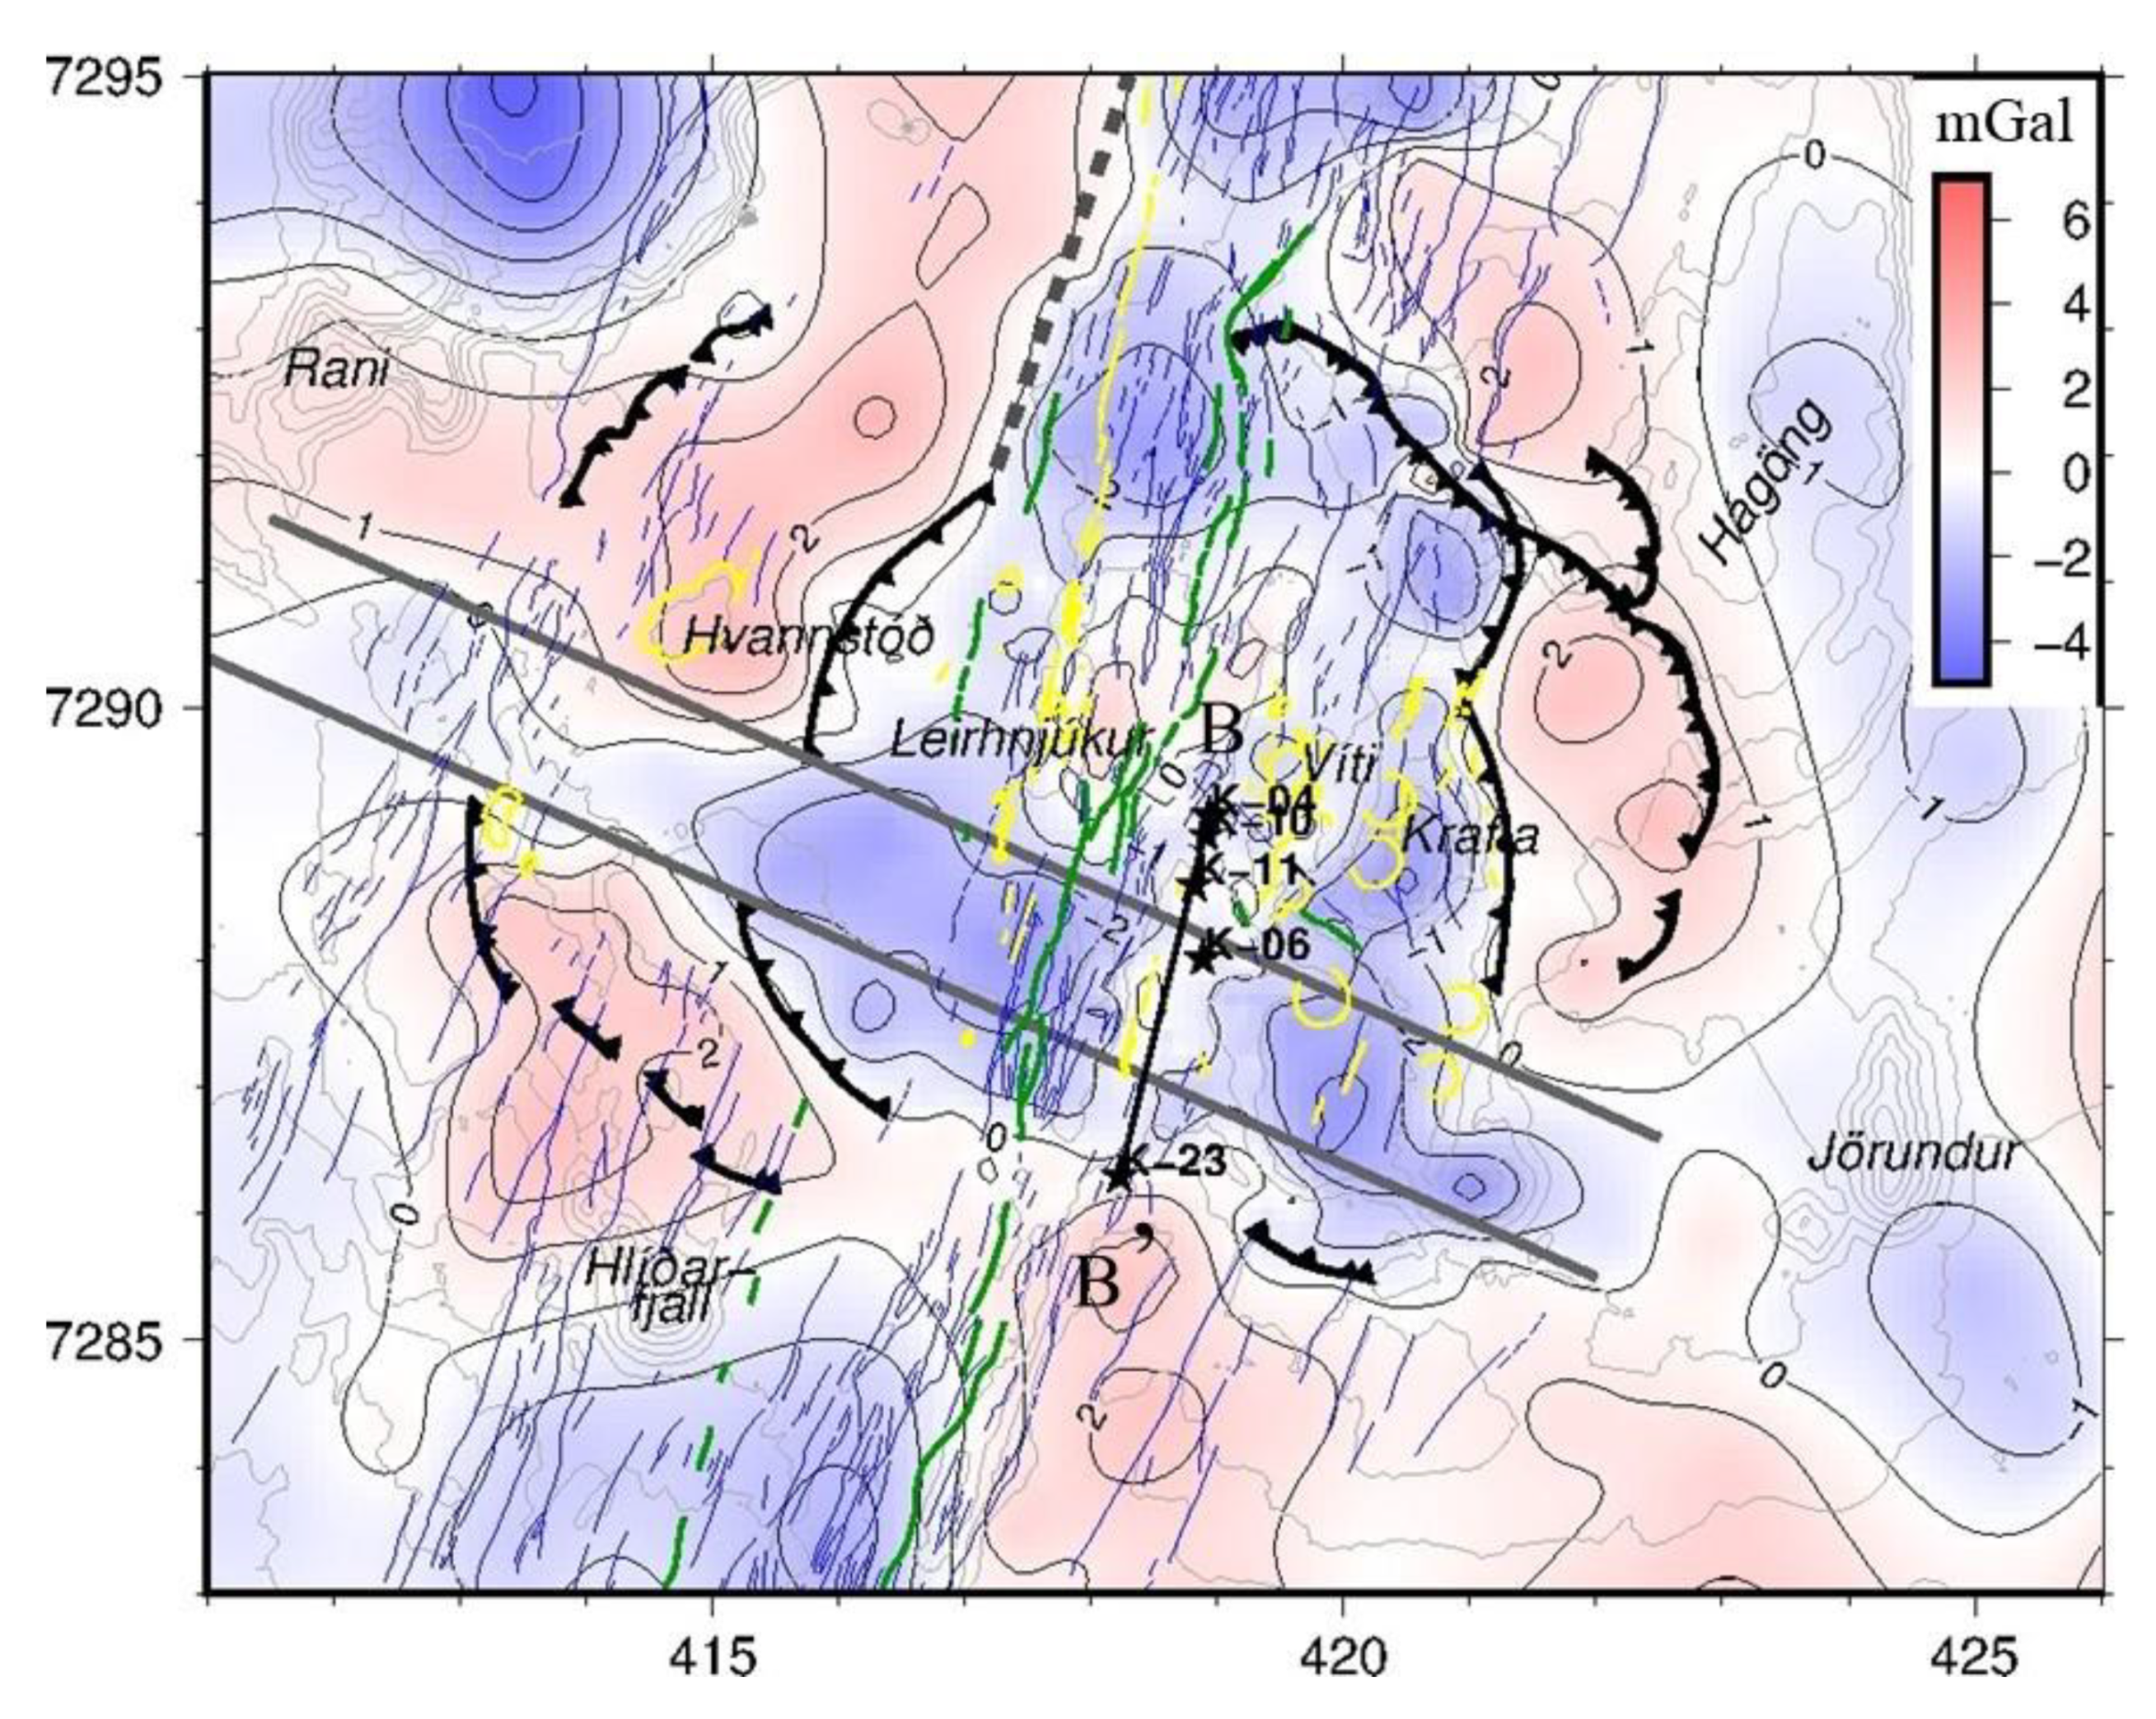
An extensive gravity survey was carried out from 1967 to 1984, covering the Krafla area and its surroundings [25]. Figure 7 shows a de-trended residual Bouguer gravity map based on these data. The map shows a relative gravity high at and within the rims of the visible 110 ka caldera. This gravity high, more or less surrounds a gravity low inside the caldera. Superimposed on this gravity low is a relative gravity high at and east of Leirhnjúkur.
Figure 7 shows other interesting features. The caldera is bisected by two more or less linear gravity lows. One is along the part of the fissure swarm that was active in the Krafla Fires (bounded by green lines in Figure 7). The other is an ESE-WNW trending gravity low from west of Mt. Jörundur in the SE and to the valley Gæsadalur (south of Gæsafjöll) in the NW. Where these anomalies would cut through the caldera rim, the rim is not visible.
If the spreading rate is assumed to be about 1.8–2.0 cm/year [26], the total spreading distance since the formation of the 110 ka caldera is about 2 to 2.2 km. By assuming that 75%–100% of the spreading has taken place in the fissure swarm through the caldera, it should be torn apart by some 1.5–2.2 km. The gaps in the southern and northern caldera rims (as seen on surface) are about 3.5 to 4 km, therefore, parts of the rims are subsided and buried. The same might partly apply to the gaps in the visible eastern and western parts of the caldera rim, but the fact that they are cut through by a low-gravity anomaly suggests that the caldera might be torn apart by an ESE-WNW trending transverse structure with rocks of relatively low density.
The origin of the ESE-WNW gravity low is not clear. It is likely to be due to some transform tectonics where the spreading is gradually migrating westwards, towards the oceanic ridge north of Iceland. Similar structures or trenches are known in transform zones further to the north, where the crustal spreading is migrating westwards. The transverse structure could be of similar origin as Lake Botnsvatn in the Húsavík transform zone, i.e., a pull-apart-basin. The transverse structure in Krafla has almost exactly the same strike as the Husavík–Flatey transform at the southern margin of the TFZ.
There is a clue of the nature of the ESE-WNW low-gravity anomaly from drilling. Figure 8 shows a lithological section from the centre and towards the southern rim of the caldera [11]. The wells on which the section is based, and the location of the section are shown in Figure 7. North of the transverse structure the section shows an about 900–1100 m thick pile of hyaloclastite with interbedded lava flows and dominant intrusions below (wells K-11, K-10 and K-04). In well K-6, within the structure, the intrusions come at about 600–700 m greater depth and with correspondingly thicker extrusive less dense rocks. The higher gravity north of the structure, therefore, reflects intrusions at a shallower depth.
As stated earlier, the gravity is relatively high at and inside the visible caldera rims in the southwest, northwest and east (Figure 7). These high gravity anomalies are bounded by steep gravity gradients towards a gravity low in the centre of the caldera, reflecting less dense rocks. In the eastern part of the caldera, the gradient coincides with arc-shaped eruptive fissures from Hólseldar, about 2 ka old [11] (Figure 7). It might be tempting to argue that the high gravity at and inside the caldera rim is due to dense intrusions, but the steep gradients towards lower gravity show that the density contrasts are at shallow depth. This gravity low can be explained by that there is another caldera with low-density rocks buried inside the visible caldera. The estimated rims of this inferred inner caldera and the bisecting ESE-WNW transverse low-density structure are shown in Figure 7.
Even though the last glacial stage is normally considered to have started at about 110 ka BP, the results of geological studies show that the Krafla area was not glaciated until about 80 ka ago [27]. In the 30 ka between the formation of the outer caldera and until glaciation, it has been mostly filled with subaerial lava flows, up to the lowest parts of its rims in the rift graben. The inner caldera was probably formed shortly after the area was glaciated. It is suggested here that the inner caldera was formed 80 ka ago in sub-glacial eruption(s) forming the rhyolitic mountains Hlíðarfjall, Jörundur and Rani outside the 110 ka caldera (Figure 2 and Figure 7). In [9], several examples of caldera formation are discussed where drained rhyolitic magma is erupted far outside the caldera subsidence. The caldera was later filled with subglacial hyaloclastite of considerably lower density than the subaerial lavas filling the outer caldera, resulting in the gravity low. Any visible signs of the inner caldera are now completely masked by Holocene lavas. The presence of this buried inner caldera and the ESE-WNW transverse structure get support from a resistivity survey discussed below. Some bounds can be put on the age of the transverse structure. It cuts through the inner caldera, so it is younger than 80 ka. It is, however, not seen cutting through Sandabotnafjall, just south of Mt. Krafla, which is estimated to be 35–40 ka old [7], so the age of the transverse structure is somewhere between 80 and 35–40 ka.
The Bouguer gravity map in Figure 7 shows yet another feature worth mentioning. There is a sharp gravity change at a line in, and parallel to the fissure swarm to the north (grey broken line in Figure 7). The fissure swarm hosts less dense rocks east of this line than to the west. This indicates that after the glaciation, the spreading and subsidence have mainly taken place in the eastern part of the fissure swarm.
3.3. Resistivity
Extensive resistivity surveys for geothermal exploration (dating back to the early 1970’s) have been carried out in Krafla. High-temperature geothermal systems have a characteristic resistivity structure due to geothermal alteration [28,29]. Below resistive near-surface unaltered rocks, they have a shallow low-resistivity “cap” (clay cap) with conductive smectite and zeolite alteration minerals formed in the temperature range of 50–230 °C. The low-resistivity cap is underlain by a resistive “core” with resistive chlorite and epidote alteration minerals formed at temperatures above 230 °C.
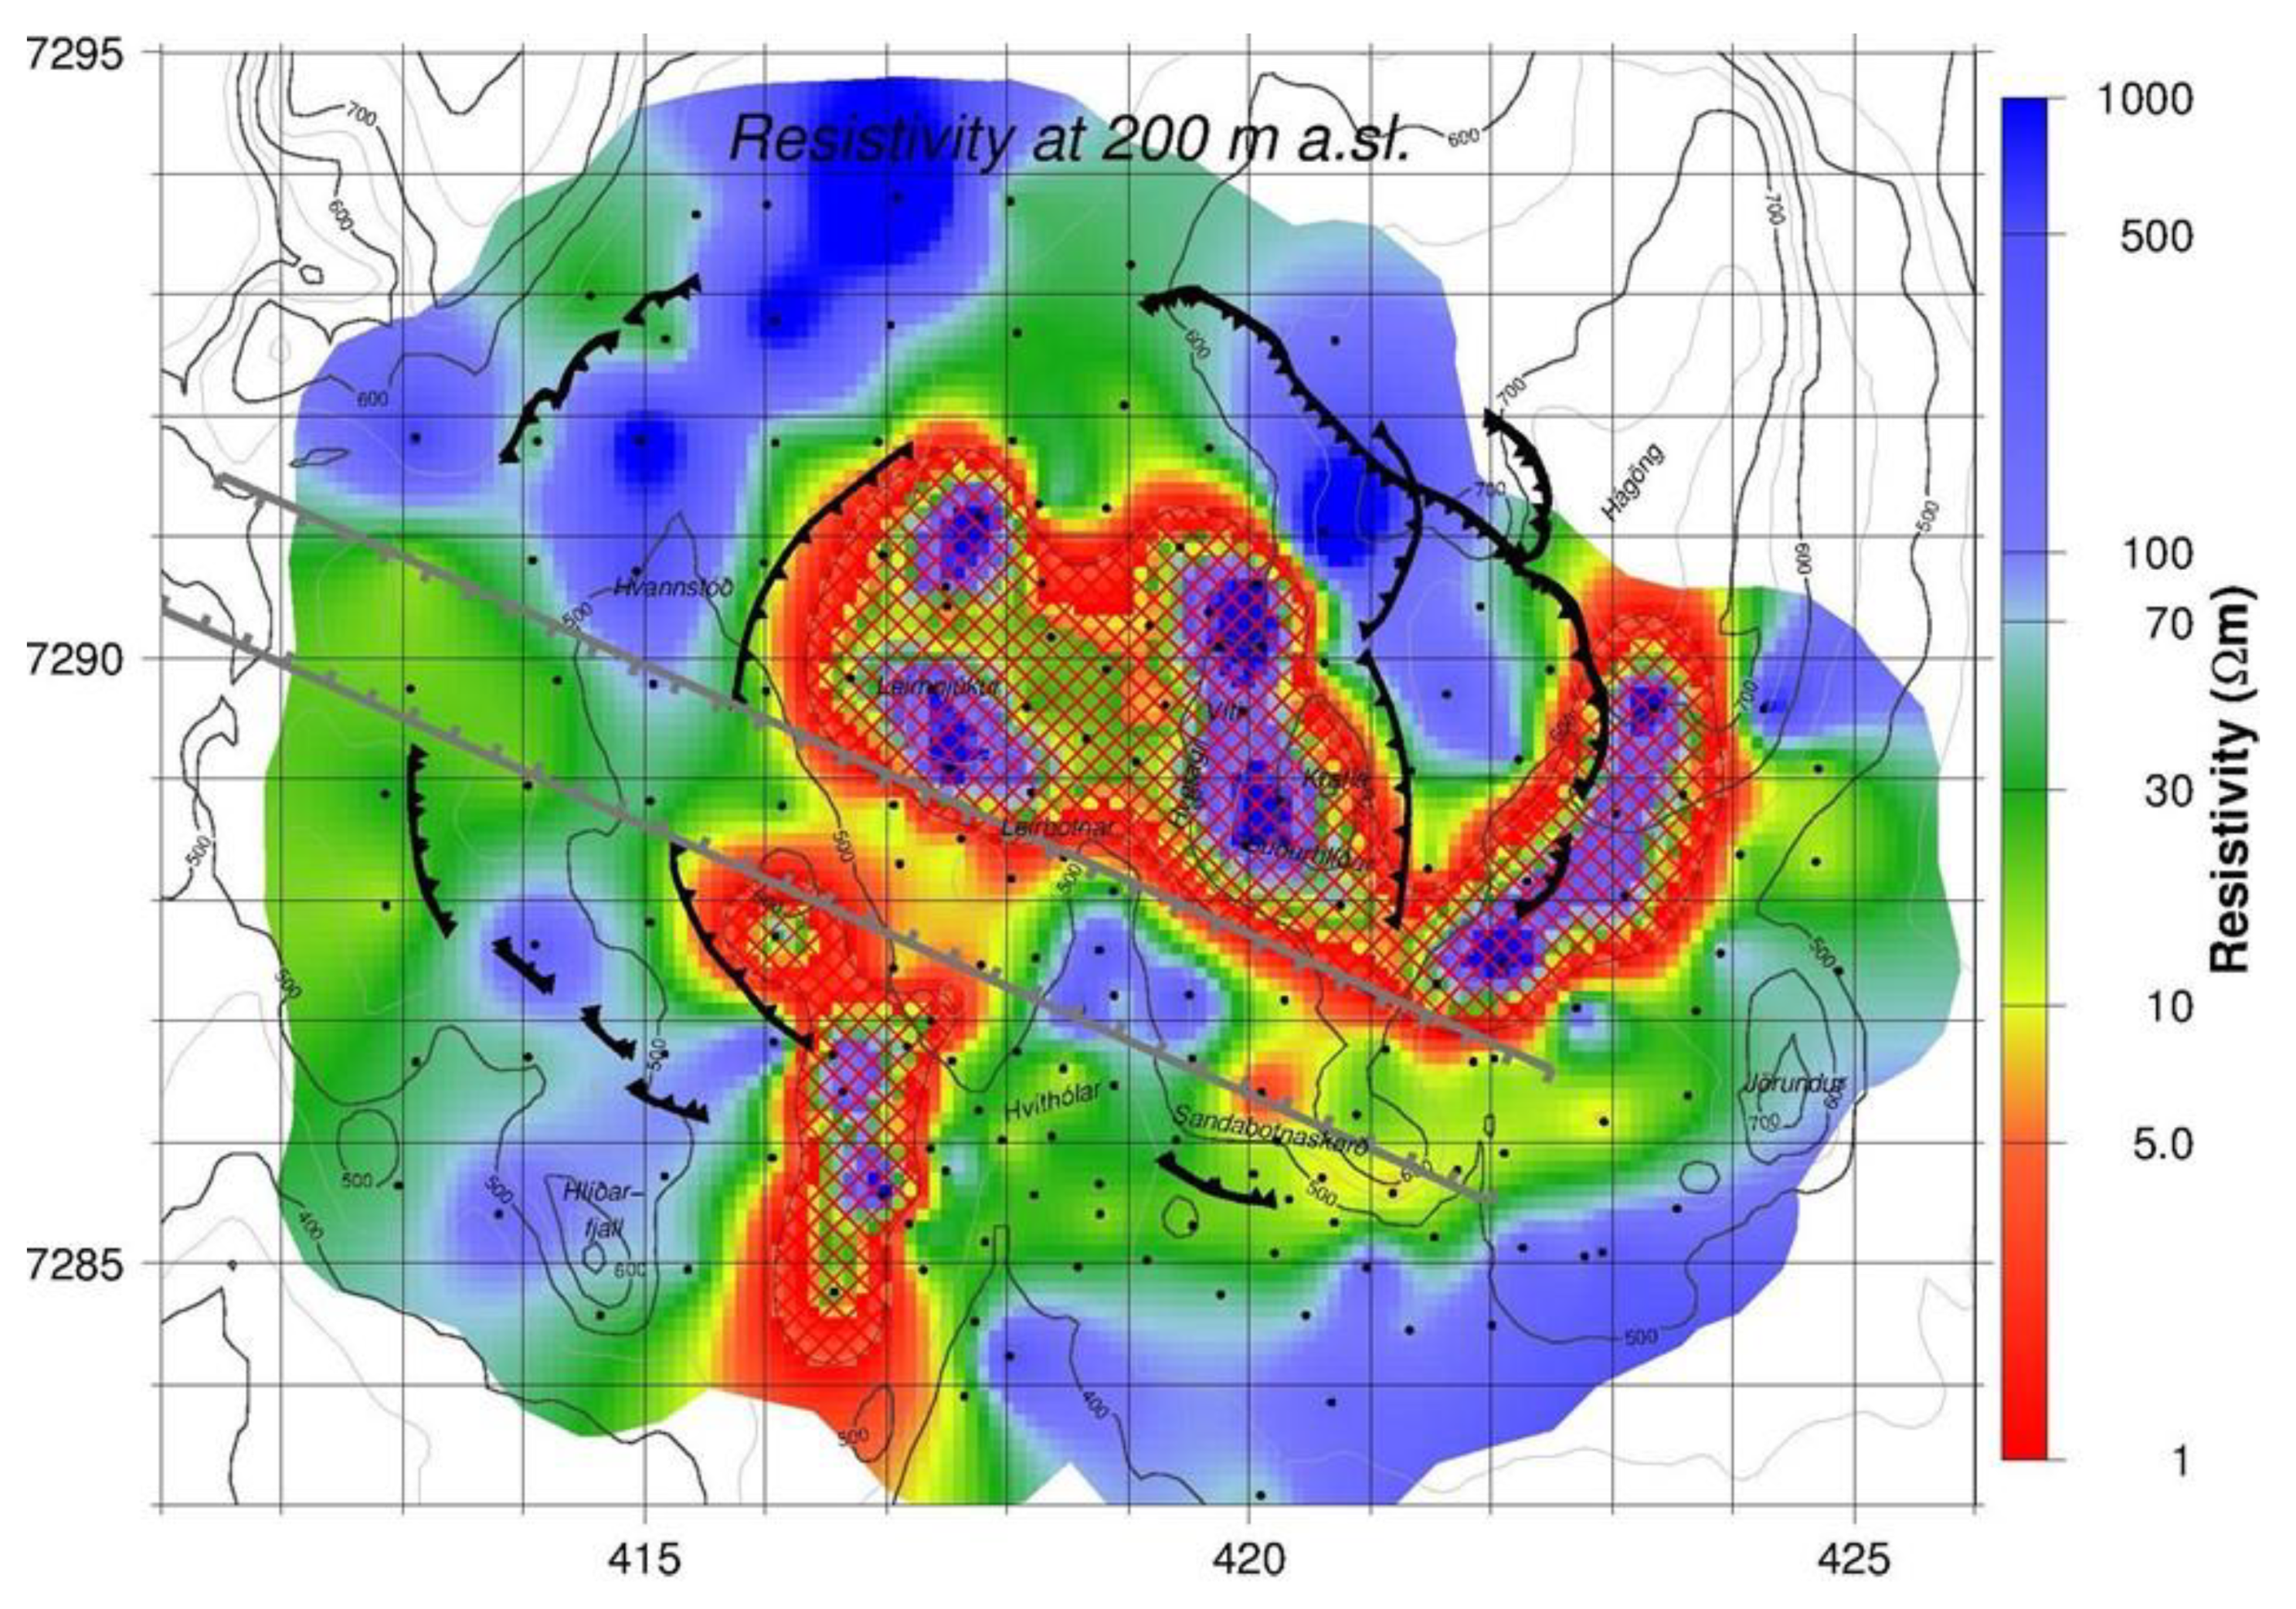
Figure 9 shows a resistivity map at 200 m a.sl. (at a depth of about 300 m) based on 1D inversion of central-loop TEM soundings [30]. Areas where high resistivity (resistive core) has appeared below the conductive clay cap are gridded red. The figure also shows the 110 ka caldera, the inferred inner caldera and the transverse low-density structure.
Figure 9 shows that high-temperature geothermal alteration is confined within the inner caldera, except in the western part of the southern arm of the fissure swarm and at the rim of the outer caldera in the southern end of Hágöng, east of Mt. Krafla. Both of these anomalies have been drilled into and geothermal alteration was found in accordance with the resistivity, but the present temperature is far below that responsible for the alteration. Therefore, cooling has occurred at these places outside the inner caldera. Figure 9 shows that no mature high-temperature geothermal system has developed outside the inner caldera except for those mentioned. It also shows that, at this depth, high-temperature alteration is absent in the transverse structure, which means a lower temperature.
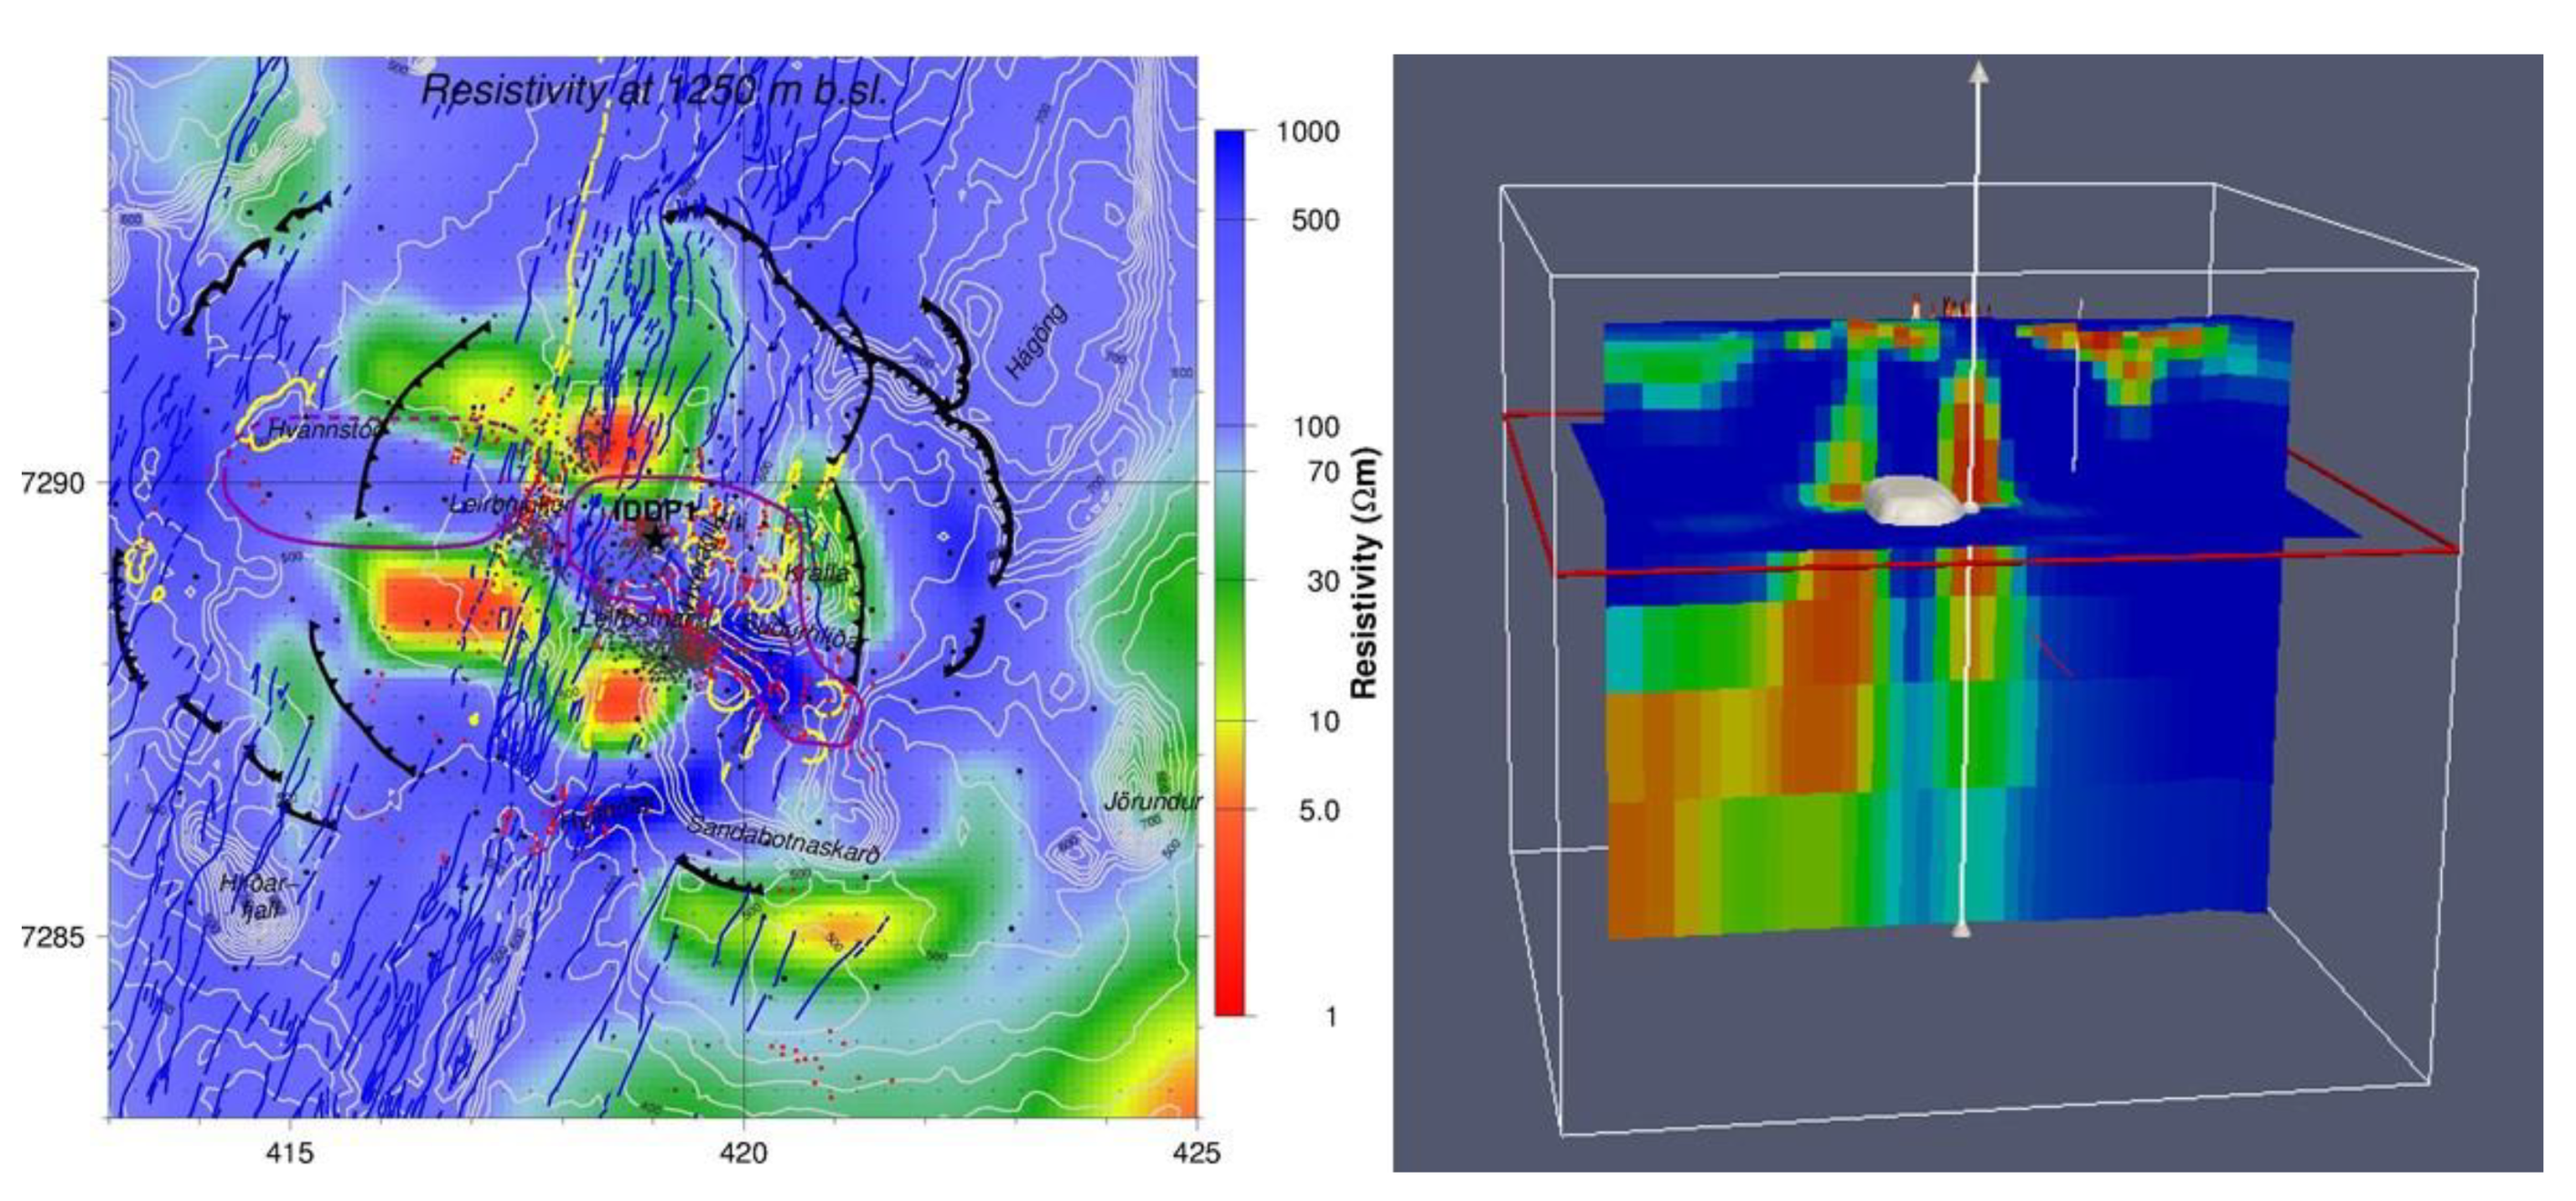
To study the deeper resistivity structure, most of the TEM sounding sites (black dots in Figure 9) were later visited for MT soundings. Figure 10 shows slices through a resistivity model resulting from 3D inversion the MT soundings (static shift corrected by the TEM).
The figure to the left, shows the resistivity at −1250 m a.sl. (about 1700–1800 m depth). It shows deep, low-resistivity bodies, mainly within the inner caldera except for a relatively low resistivity at the south-east rim of the outer caldera. The low-resistivity bodies within the inner caldera border an ESE-WNW high-resistivity structure, which roughly coincides with the S-wave shadows. This high-resistivity structure hosts most of the seismicity and the main production field is in its central and eastern part. The figure to the right shows the shallow conductive clay cap is fairly well in agreement with the 1D inversion of TEM and drilling, and that the two low-resistivity bodies extend down to about 6 km depth. Around that depth, the northern one seems to start to deviate to the north.
3.4. Seismic Studies
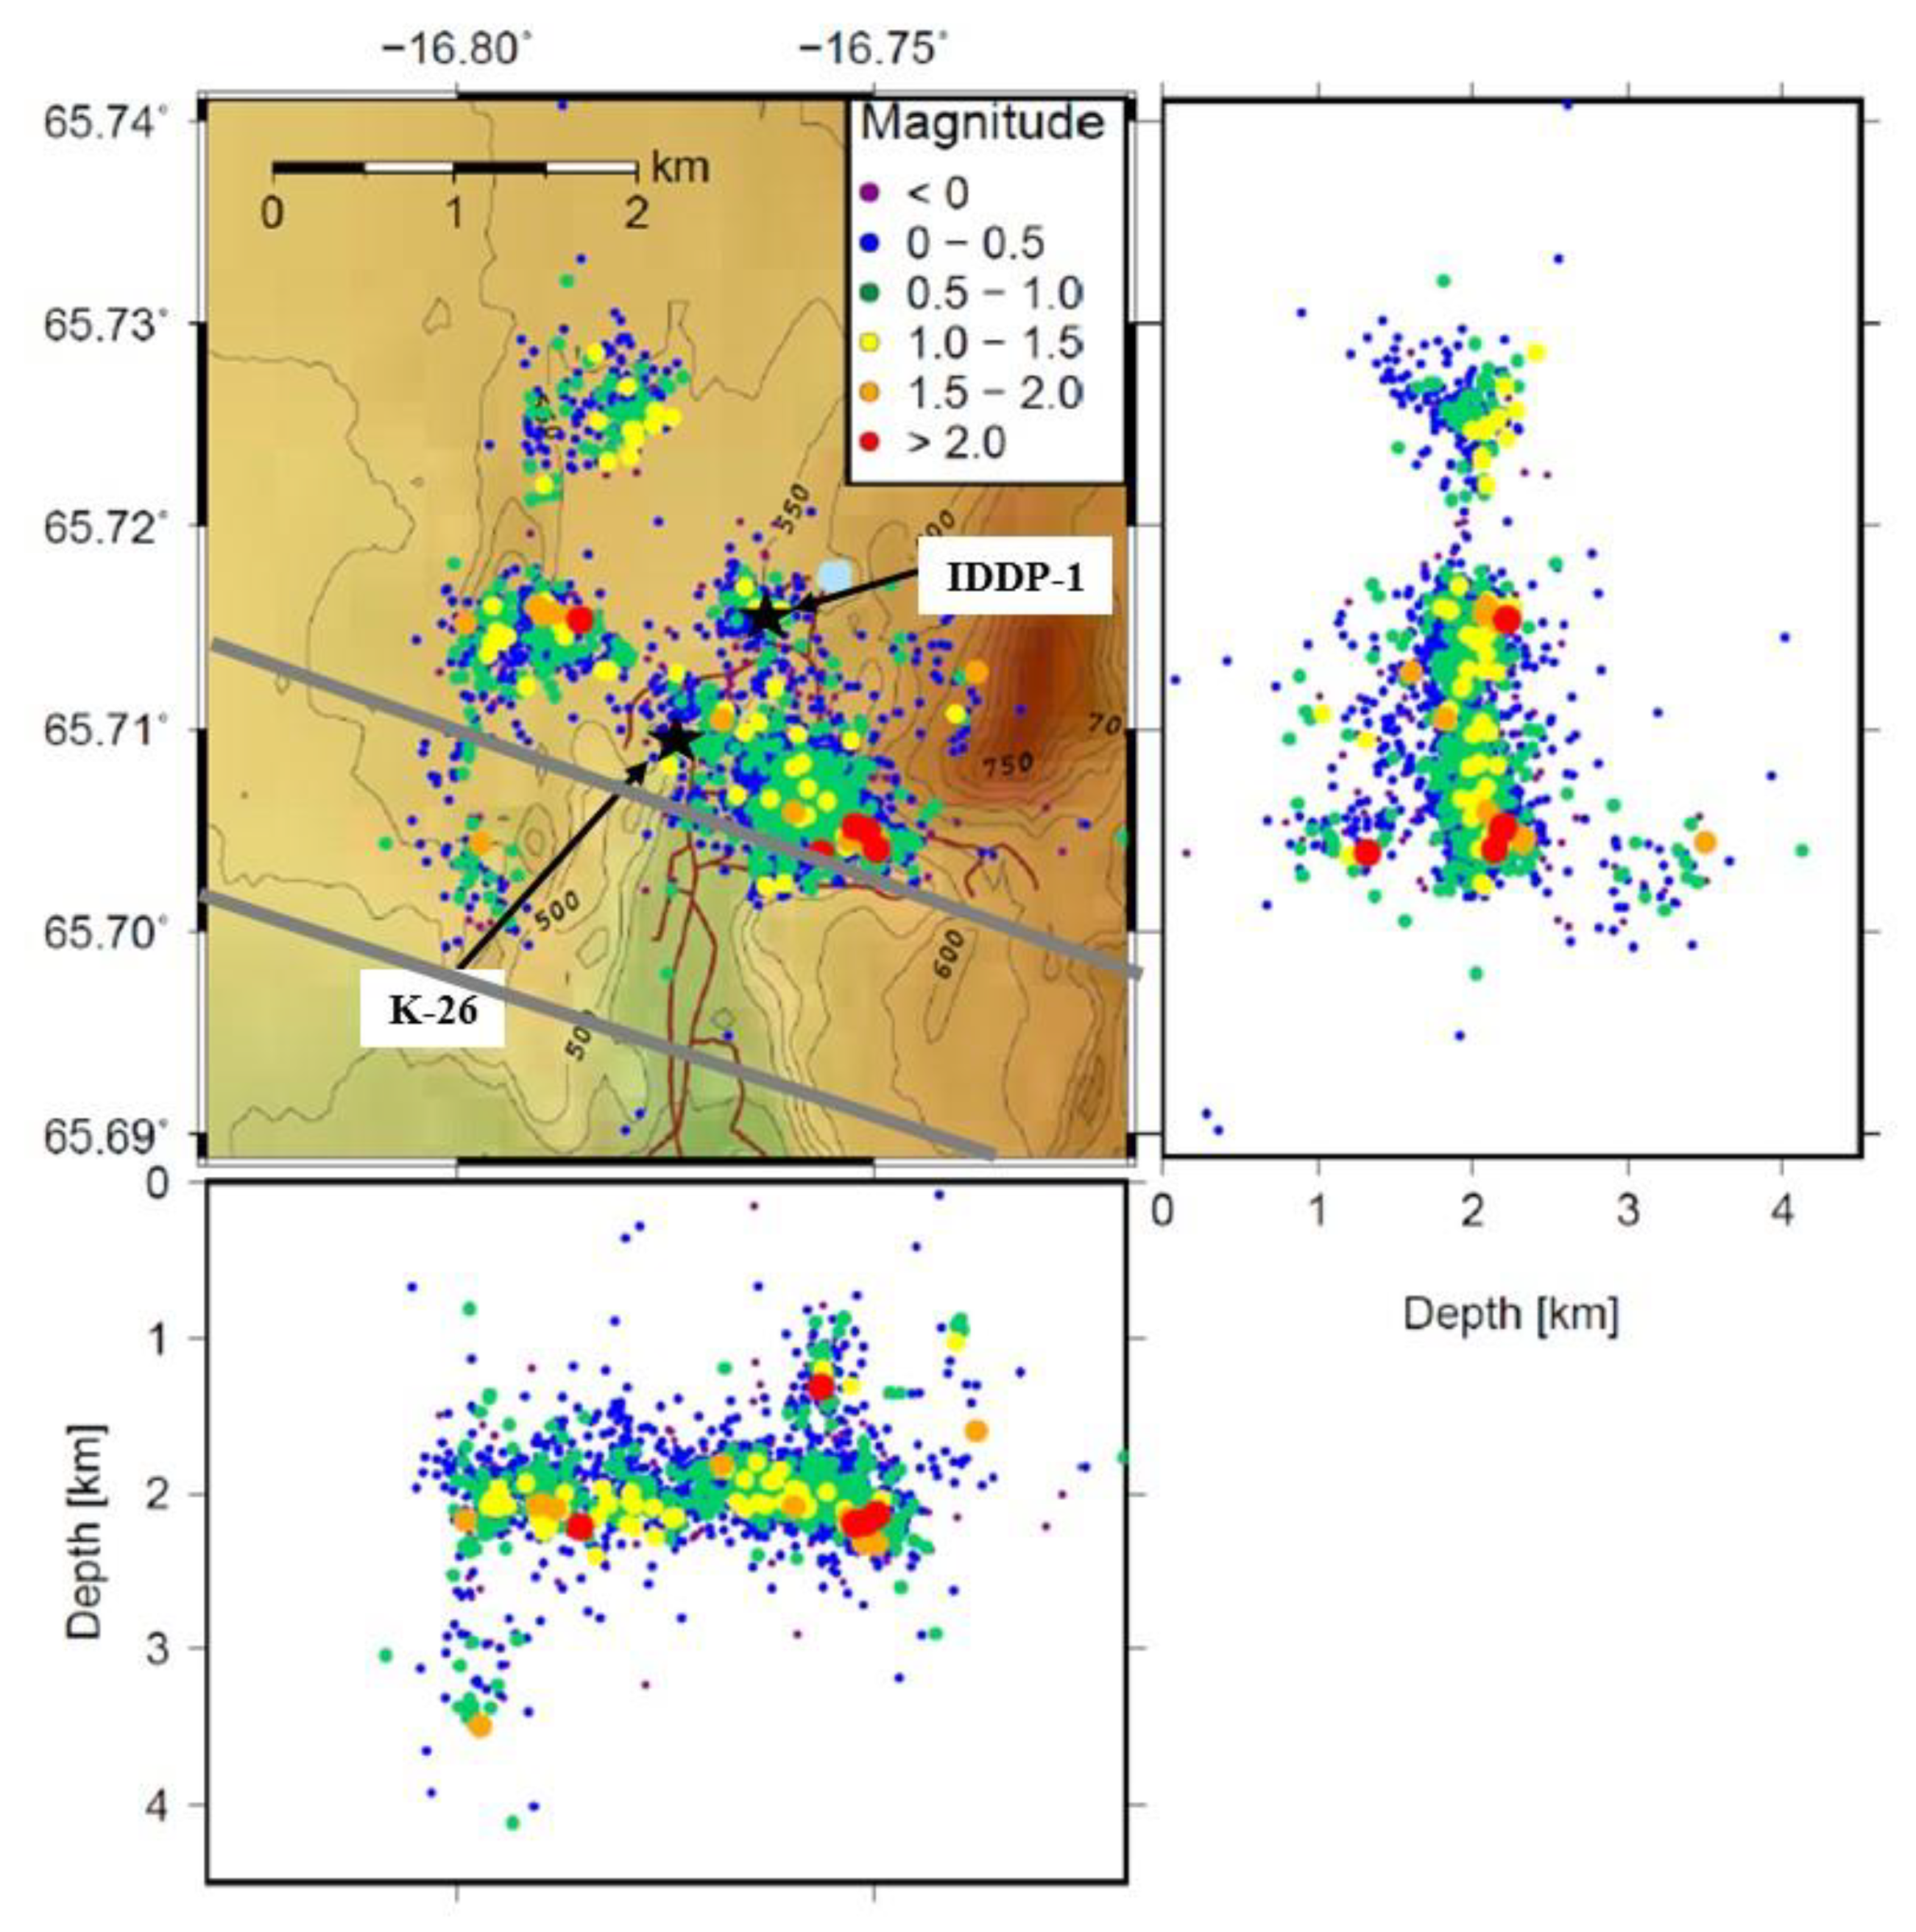
ÍSOR operates a local seismic monitoring network in Krafla for Landsvirkjun (National Power Company), which operates the Krafla power plant. Even though there have been no signs of volcanic unrest since the end of Krafla Fires, Krafla turns out to be very seismically active in the central part of the inner caldera. Figure 11 shows earthquakes located in Krafla from November 2015 to November 2016 [32], a rather typical annual seimicity. There are five main clusters, one just SW of Mt. Krafla, just north of the transverse structure, two at injection wells K-26 and IDDP-1 (probably mostly due to injection) and two at and north of Leirhnjúkur. The depth sections show that maximum depth of the earthquakes, i.e., the brittle/ductile boundary, which for basalt, is estimated in the range of 600–800 °C [33], is at about a 2–2.3 km depth north of the transverse structure. There is also a small cluster within the transverse structure south of Leirhnjúkur. The depth sections show that seismicity there extends much deeper than in the north or to about 3.5 km. This indicates lower upper crustal temperatures within the transverse structure. This is in agreement with the distribution of high-temperature alteration at a 300 m depth shown in Figure 9, i.e., a lack of high-temperature alteration within the transverse structure.
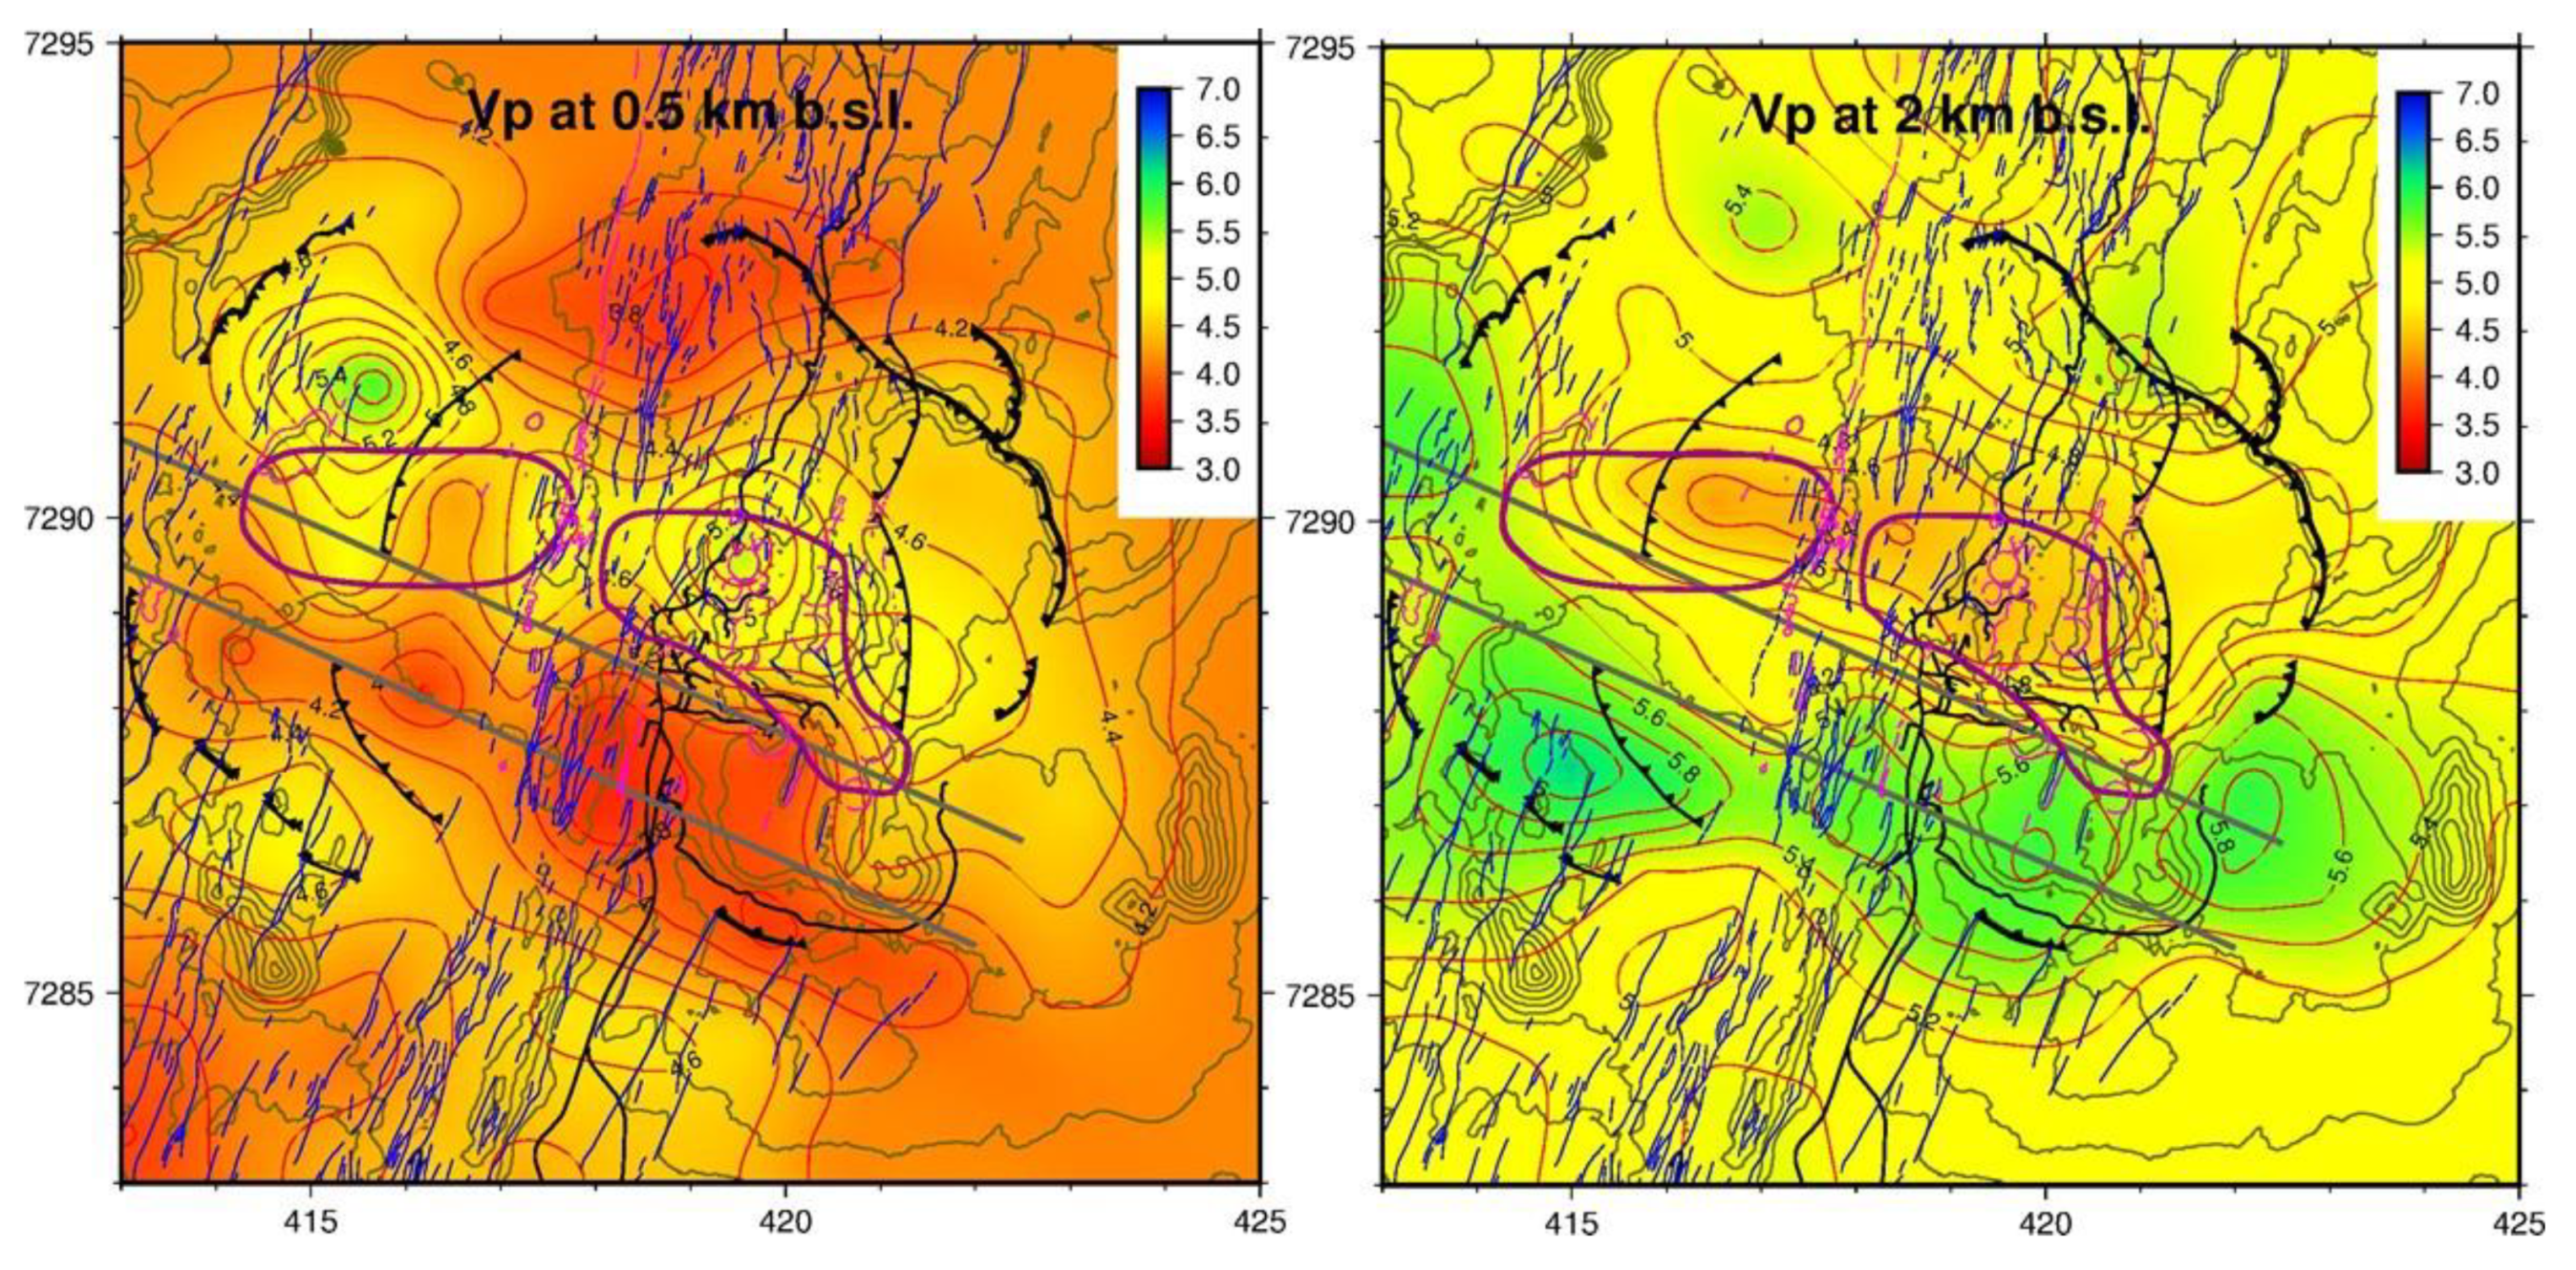
Recent seismic tomography study of the Krafla area [34] shows some interesting results. Figure 12 (left) shows the estimated P-wave velocity (Vp) at 0.5 km bl.sl. (at about 1 km depth) and (right) at 2 km depth below sea level (about 2.5 km depth). At 0.5 km bl.sl., the tomography indicates low Vp within the transverse structure and higher Vp north of it. At 2 km bl.sl., the situation is the opposite, i.e., high Vp in the southern part of the calderas, but low Vp and low Vp/Vs ratio within the inner caldera north of the transverse structure and above the S-wave shadows. Schuler et al. (2015) suggest that this anomaly reflects rocks containing superheated steam.
4. The Geothermal System(s)
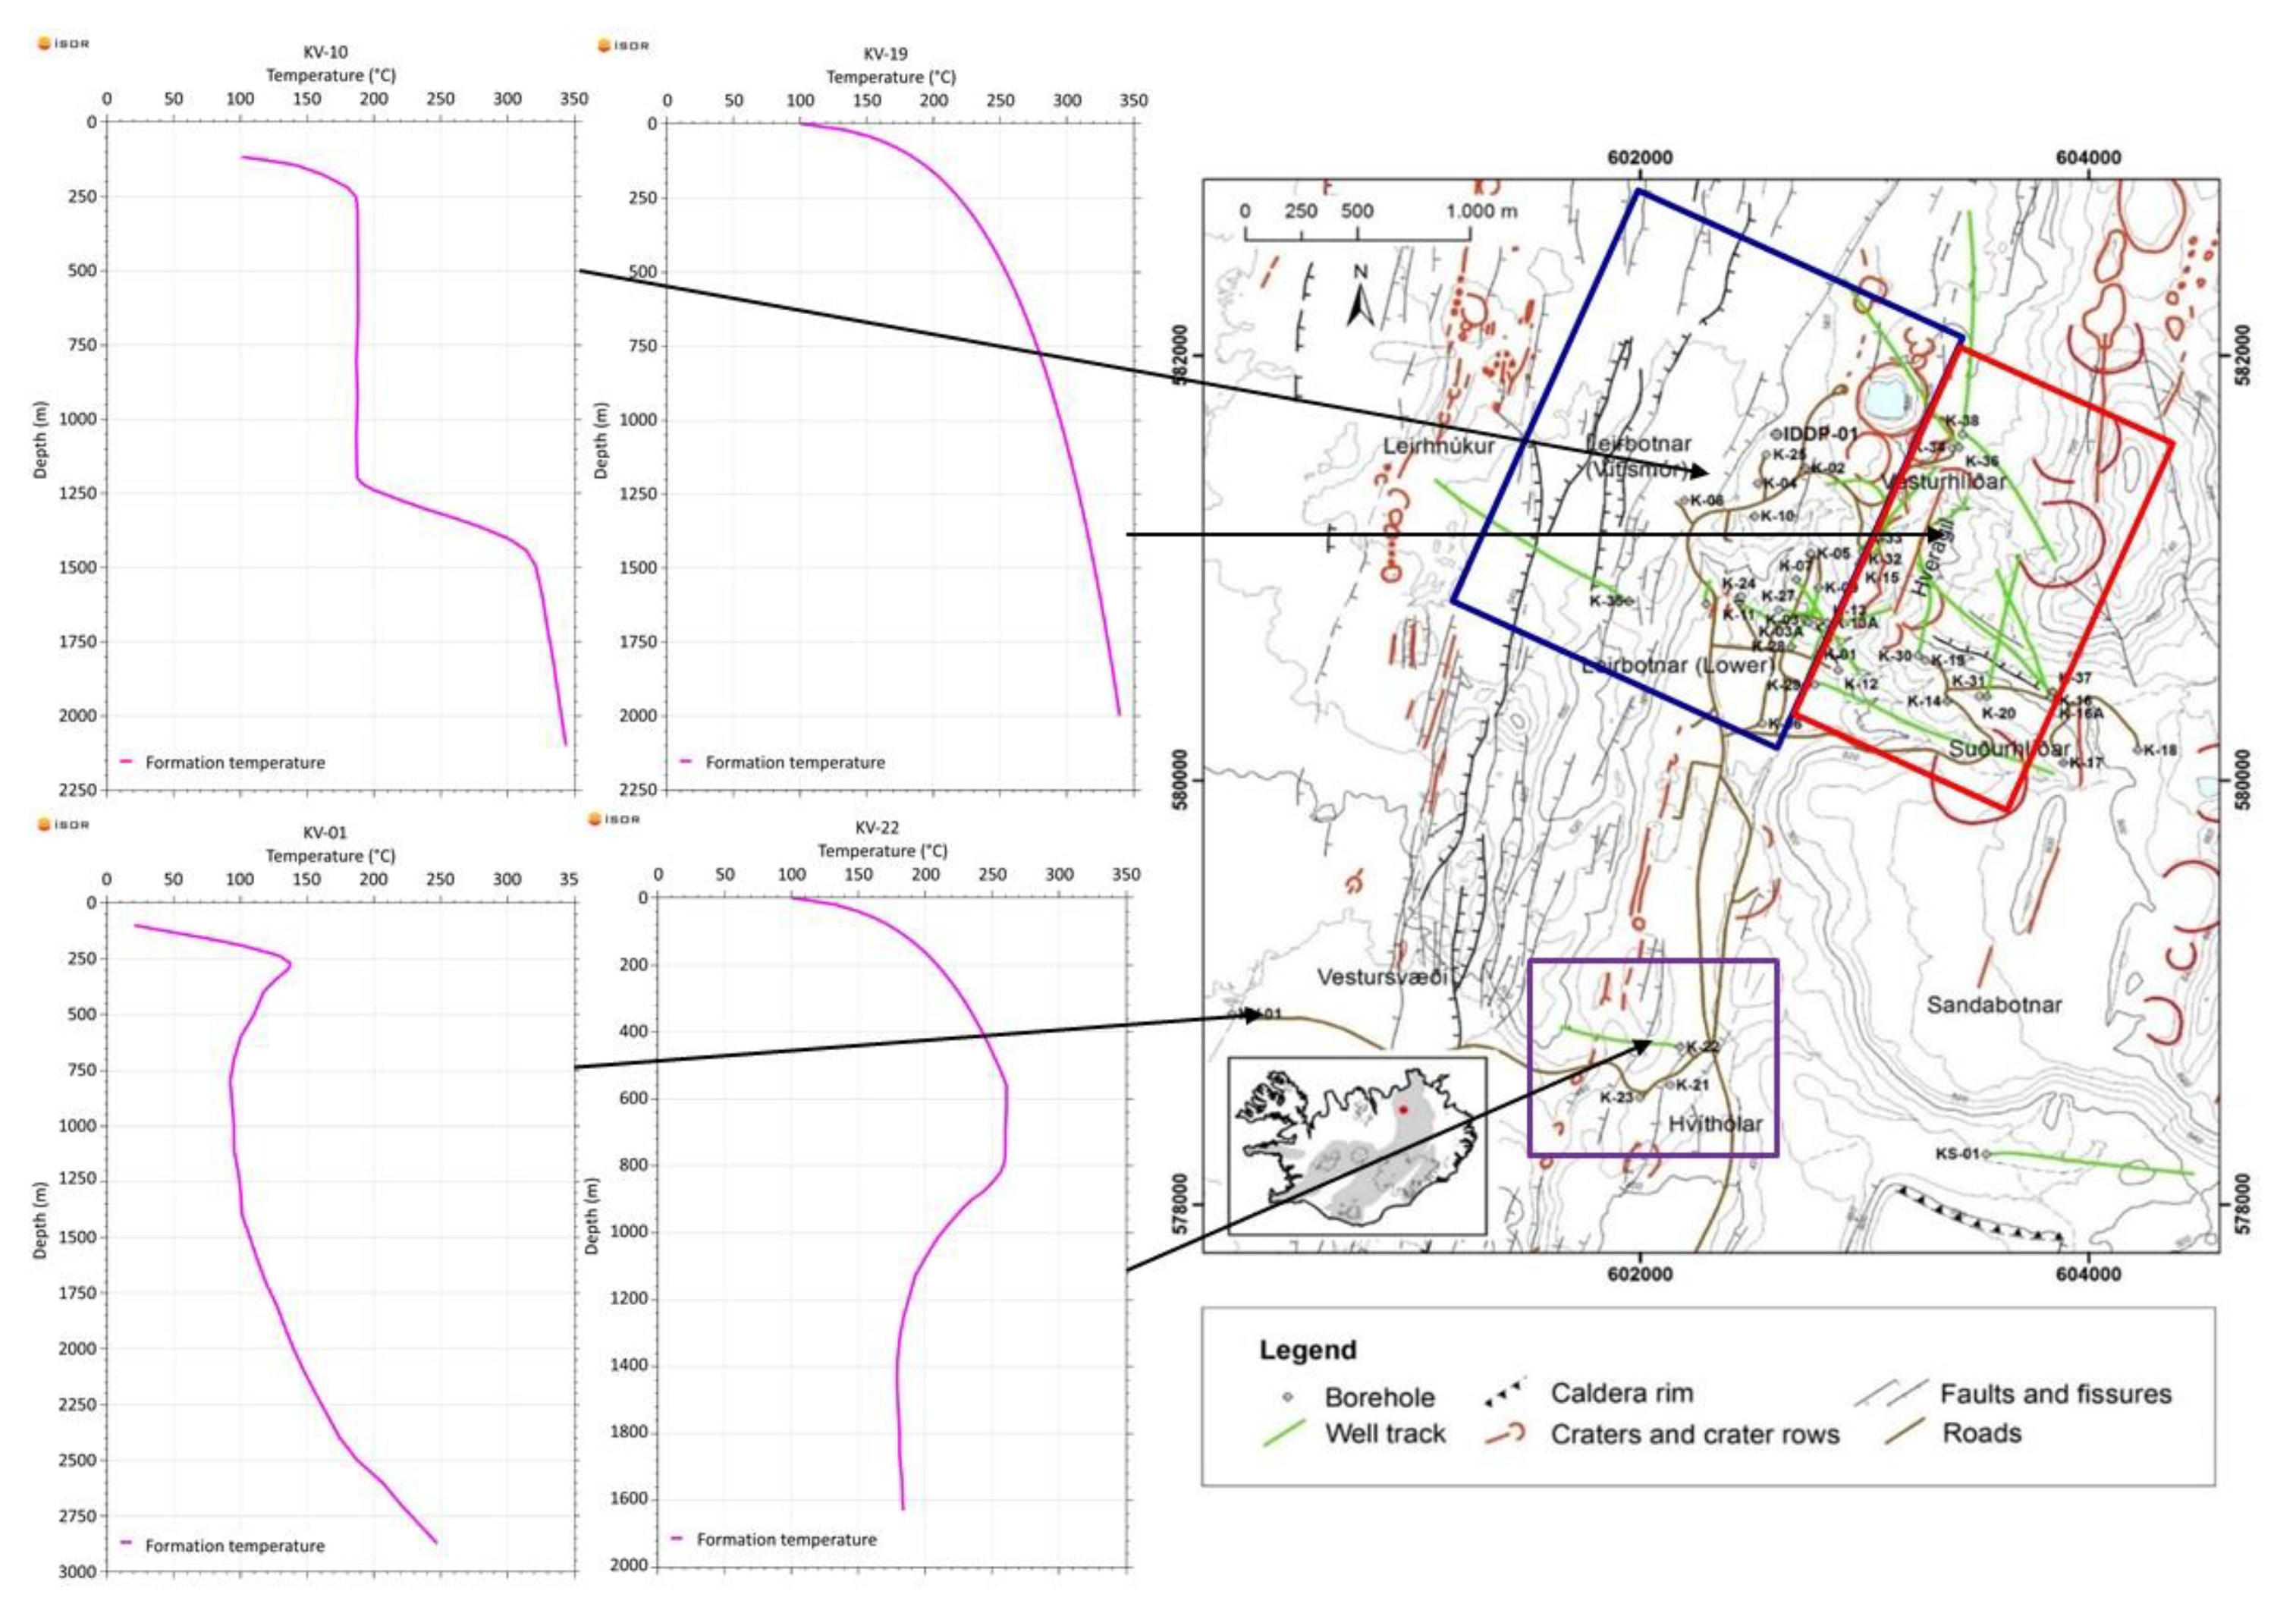
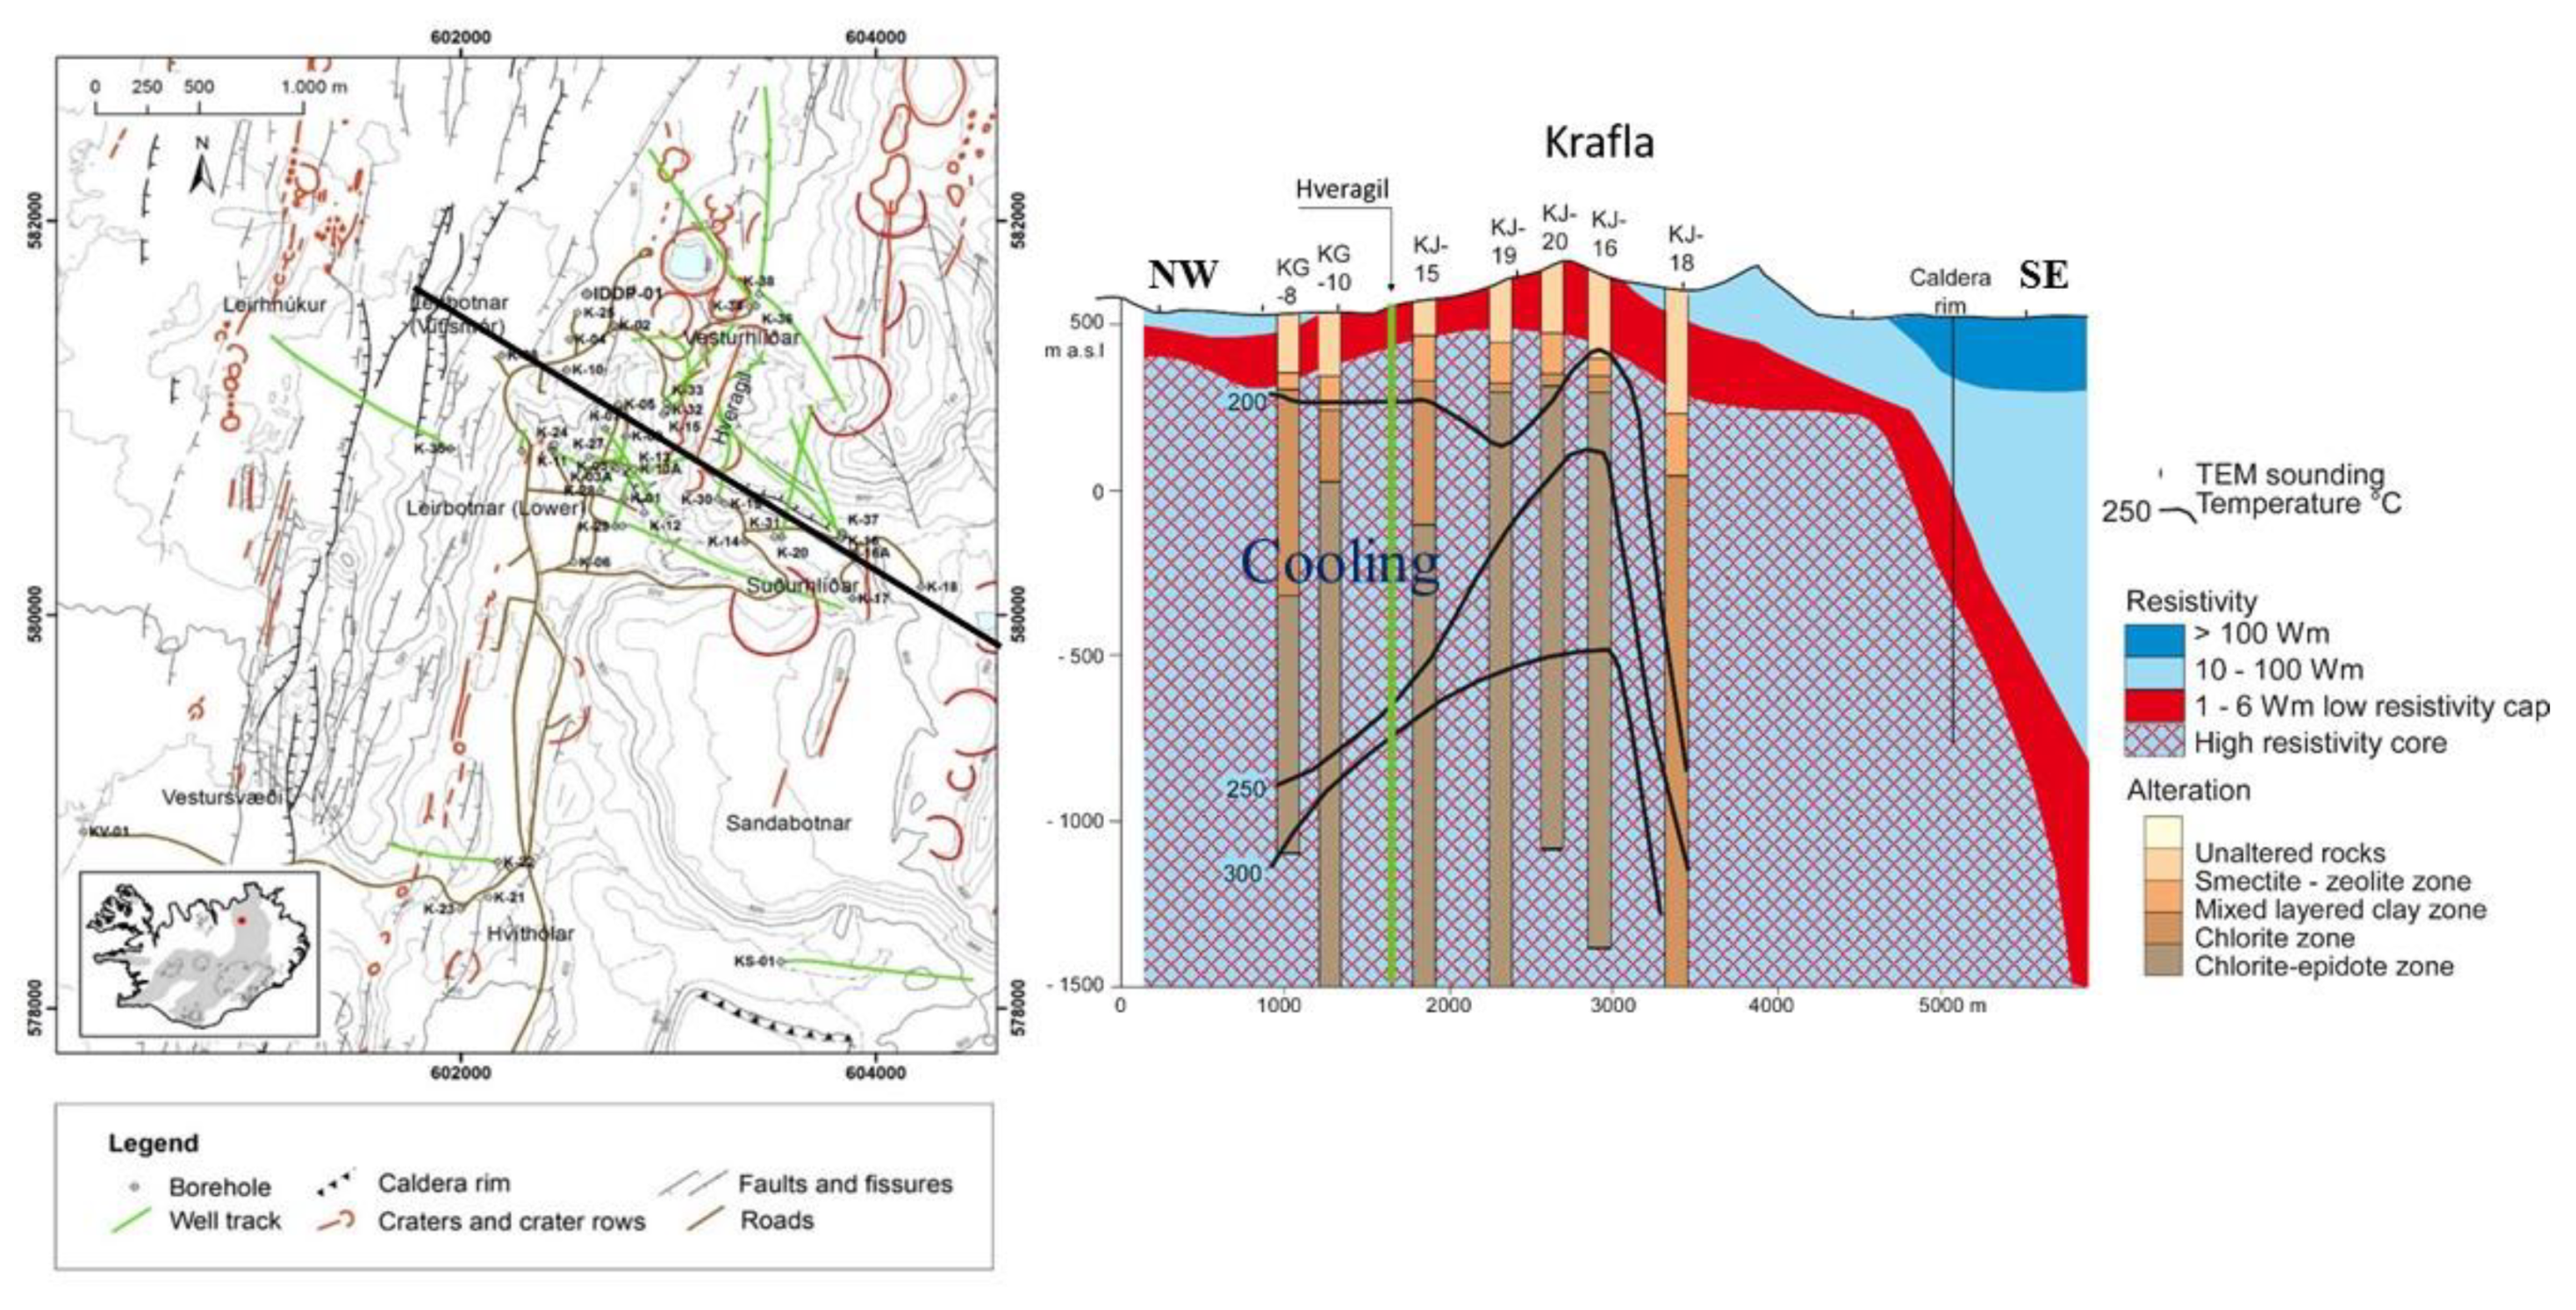
Through the years, a total of 43 deep exploration and production wells have been drilled in Krafla, some of which are (or have been) used for injection. Figure 13 and Figure 14 show their location and well tracks of deviated wells. The main well field is located in the eastern part of the inner caldera. Through drilling, the stratigraphic structure at depth has been outlined as well as the physical conditions of the geothermal system [11,12,35,36].
The drilling has revealed that different “subfields” in Krafla have quite different thermo-hydraulic characteristics (Figure 13). In part of the production area, Leirbotnar and Vítismór (blue frame in Figure 13), the geothermal system has two different thermo-hydraulic characters at different depths. Temperature profiles show that above 1000–1200 m in depth, there is a system with two phase (boiling) conditions close to the surface but then almost isothermal with depth, at about 200 °C. Below the isothermal part, the temperature rises almost linearly up to the boiling point curve (boiling point versus depth curve) in an underlying two-phase system. Wells in the southern and western slopes of Mt. Krafla (red frame in Figure 13) show two phase conditions from maximum drilled depth (2–2.5 km) to the surface and wells at Hvíthólar (purple frame in Figure 13) show a temperature inversion. Well KS-01 in Sandabotnaskarð, east of Hvíthólar, has a temperature profile (not shown) following the boiling point curve from the bottom (2500 m depth) and up to about 1000 m in depth, but temperatures below the boiling point curve at shallower depths (ÍSOR database). Finally, well KV-1, in the active fissure swarm west of Hvíthólar, shows extensive cooling. Resistivity surveys show high-temperature alteration there (Figure 9) and the alteration mineralogy of the well showed that temperatures there had been much higher than the current measured temperature.
Figure 14 shows a resistivity cross-section from Vítismór in the NW to the southern slopes of Mt. Krafla. Superimposed on the section is the alteration mineralogy and estimated formation temperature in wells close to the section. The figure shows an excellent correlation between resistivity and alteration, i.e., low resistivity at shallow depth in the smectite and zeolite alteration and increasing resistivity in the chlorite and chlorite/amphibole alteration [28,29]. The isotherms in the wells in the western part, west of Hveragil (a purple line in Figure 4), and also in the eastern most well (K-18), show much lower temperatures than the ones causing the alteration, so cooling has taken place.
5. New Conceptual Model
The complexity of the Krafla volcano and its geothermal system(s) has puzzled geoscientists for decades. Here, an attempt is made to shed some light on this complexity by putting it in context with the geological structures, tectonics and geological history discussed above. The first conceptual model of the geothermal system in Krafla was presented in 1977 [37]. It was based on limited data, mainly surface studies and the results for the first eleven wells in the area [35,38]. In that model, it was assumed that the shallow and the deep thermal regimes in the Vítismór-Leirbotnar area are separated by an impermeable cap-rock. It was assumed that there was a main up-flow from a deep two phase geothermal system through Hveragil (bold purple line in Figure 4) just west of Mt. Krafla and that the near-isothermal upper system in the west was due to a westward lateral flow from the up-flow under Hveragil. The difference in the contamination by volcanic gases during the Krafla Fires, discussed above, was considered to support this conceptual model [5]. This conceptual model has been considered valid until recently [39]. The author did, however, find this hypothesis unlikely and in the most recent review report, on the Krafla geothermal system [12], a quite different scenario was proposed. There is no obvious candidate for an impermeable cap-rock in the lithology in the wells in the Vítismór-Leirbotnar area, but the change in thermal character occurs at depths where intrusive rocks start to dominate. The area is within the presently active part of the fissure swarm and is likely to have very anisotropic permeability, i.e., high permeability along the fissure swarm but much lower permeability perpendicular to the faults and fissures. It is, therefore, unlikely that lateral flow, above a cap-rock from an up-flow in the east, would be to the west, perpendicular to the high permeability. An alternative explanation of the two thermo-hydraulic regimes is given below.
5.1. The Role of Permeability
Permeability plays a crucial role in the existence and development of volcanic high-temperature geothermal systems. Model calculations show that, in order for a magma intruded into the shallow crust to produce a two-phase geothermal system, permeability has to be within the rather narrow range of 0.5–5 mD (1 mD = 10−15 m2) [40]. If the permeability is lower, the intrusion cools over a long time by heat conduction, but if the permeability is higher, the intrusion cools rapidly by vigorous one-phase (water) convection.
Model calculations show that if a magma intrusion is emplaced in rocks with permeability in the above range, a two-phase convective geothermal system is formed in time of the order of 1000 years and, if no further intrusions occur, the lifetime of such as system is of the order of 10 ka [40] (though depending on the size of the intrusion).
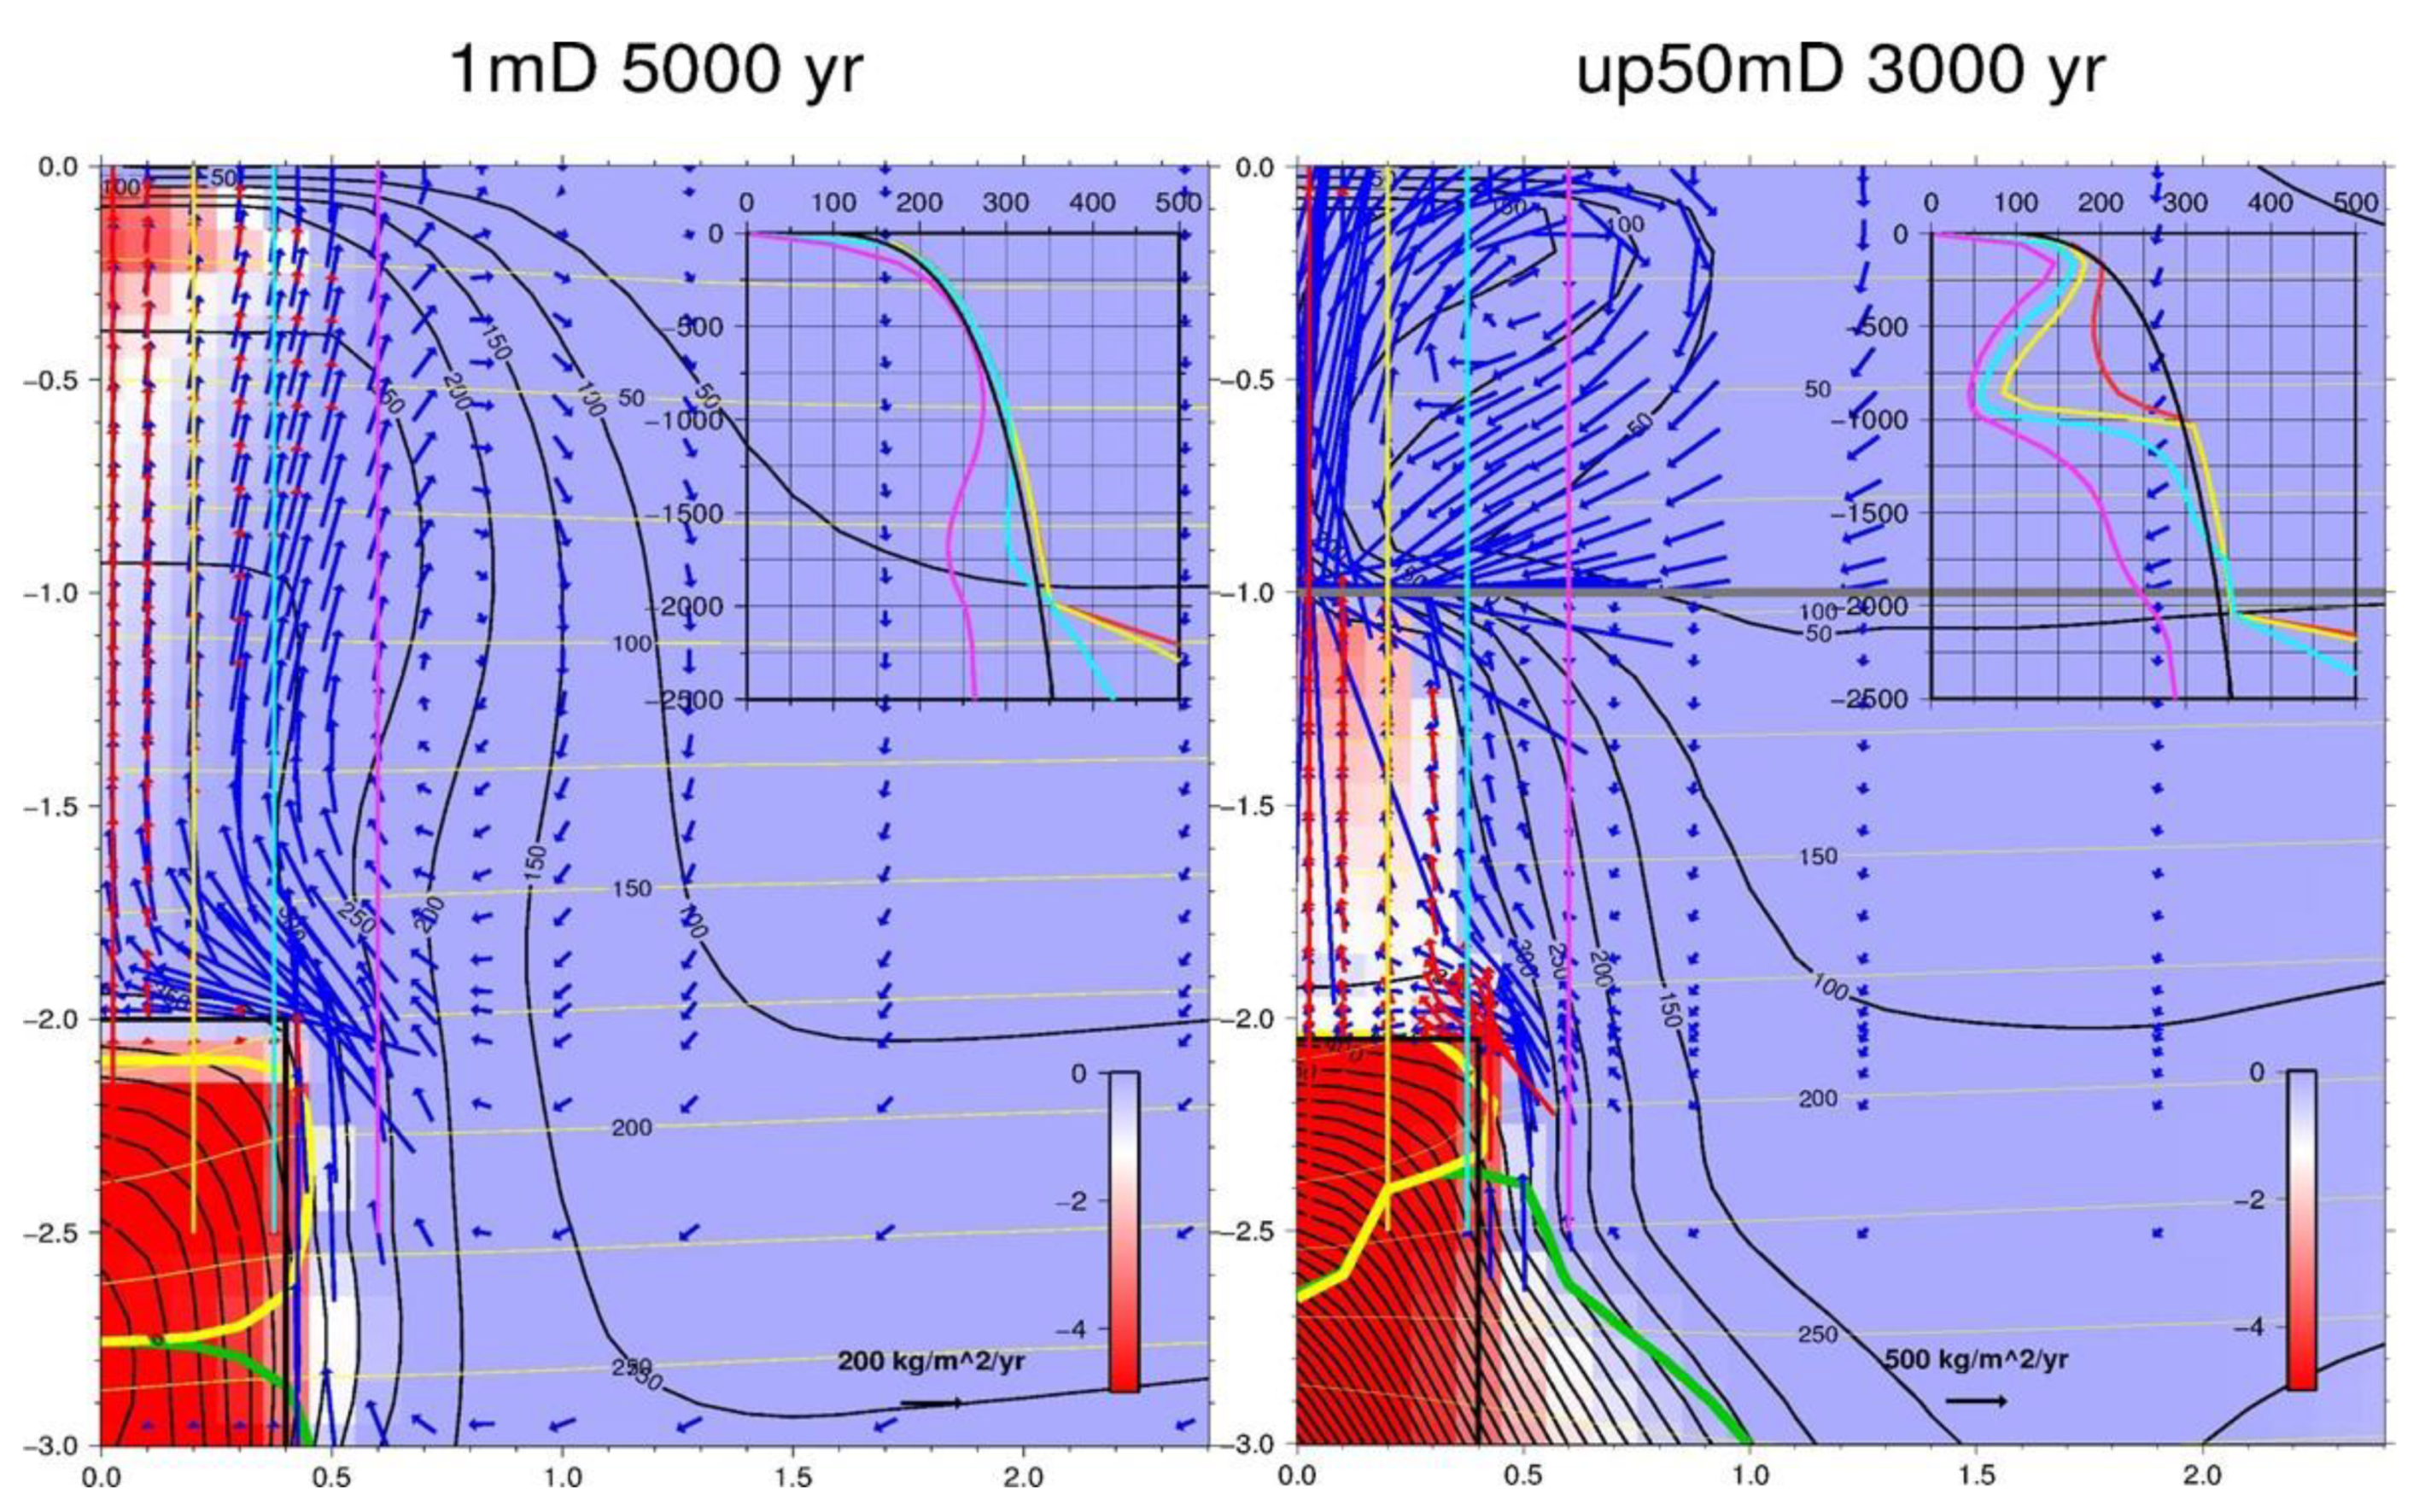
Figure 15 shows the results of two-dimensional (2D) numerical modelling using the HYDROTHERM programme [41,42]. The figure shows the thermo-hydraulic states of a geothermal system developed after the emplacement of an 800 m wide (infinitely long) “dike” intrusion with a temperature of 1100 °C, extending up to 2 km below the surface into rocks with a temperature gradient of 100 °C/km. The modelling takes into account the latent heat of the magma and the permeability created when the magma solidifies and contracts.
The figure to the left shows the developed geothermal system 5 ka after the dike injection into a host rock with a permeability of 1 mD. The figure shows a convecting two-phase geothermal system with up-flowing water and steam above the intrusion and a down flow of colder water to the sides down to the heat source. The panel in the upper-right corner shows calculated temperature profiles for hypothetical wells. Wells within the range of the dike (red and yellow) have temperature profiles corresponding to the boiling point curve (boiling point temperature vs. depth curve), while wells at the edge of or outside the dike (light blue and purple) roughly follow the boiling point curve at shallow depths but show temperature inversion at greater depths due to the in-flow of colder water towards the heat source.
Near the end of the lifetime of the system (of the order of 10 ka, if the heat source is not renewed), the heat source has lost most of its heat, and cold downwards flowing water can no longer gain enough heat to sustain two-phase conditions and the system cools down at depth. Two-phase conditions will, however, still prevail (for some hundreds to thousand years) at a shallower depth in a slowly upwards migrating “bubble”, leading to temperature inversion with depth above the cooled heat source. Similar results, using different modelling software have been reported [43].
The right part of Figure 15 shows the thermo-hydraulic situation 3 ka after a similar dyke is emplaced in a host rock of permeability 1 mD, underlying a 1 km thick pile of a much higher permeability (50 mD in this case). The figure shows a two-phase system in the 1 mD host-rock but in the more permeable rocks above, a second and vigorous convection cell develops. The temperature profiles in the upper-right corner show that above the centre of the dike, the temperature follows the boiling point curve near the surface and then becomes almost isothermal until just above the permeability contrast, where it rises sharply towards the boiling point curve. It is, therefore, suggested that the two different thermal regimes in the Vítismór-Leirbotnar field are not due to cap-rock and lateral flow from east, but due to a much higher permeability in the fissure swarm above the intrusions at about 1 km depth. The model can also explain the difference in contamination by volcanic gases in the upper isothermal and the deeper two-phase part during the Krafla Fires, discussed above. The vigorous convection in the high permeability isothermal part above the deeper two-phase part would dilute the gases in fluids coming from below.
It may be questioned whether the simple 2D modelling shown here is justified in this case. However, it will be argued below that the main heat sources powering the geothermal system in Krafla are ESE-WNW trending intrusions and a dike complex in the inner caldera north of the low-density transverse structure, nearly perpendicular to the fissure swarm. Since permeability above the intrusions is mainly along faults and fissures perpendicular to the heat source(s), a 2D modelling is considered as a valid approximation.
A permeability of 50 mD in the upper 1000 m may seem unrealistically high. The Svartsengi geothermal system in the Reykjanes peninsula SW Iceland, has a wide spread confined nearly isothermal reservoir of about 235–240 °C from about 700 to 2000 m depth [44]. In numerical reservoir modelling of the system a permeability of about 220 mD is needed to simulate this isothermal system [45].
What, from resistivity, appears as one system in the northern part of the inner caldera is actually divided into two very different parts. East of Hveragil, in Vesturhlíðar and Suðurhlíðar, there are, generally speaking, two-phase conditions from the depth of drilling and to shallow depths, except in the easternmost well (K-18), which shows cooling in the upper parts although hot near the bottom. West of Hveragil (bold purple line in Figure 4), the geothermal system is divided into two very different parts, a deep two-phase system, below 1 km, and an upper, almost-isothermal, one-phase condition of about 200 °C, except for in the near-surface, where two-phase conditions are reached. Alteration shows, however, that sometime in the past, two-phase conditions existed in the upper part.
As discussed above, until about 8 ka ago, the rifting was in the presently active eastern part of the fissure swarm with considerable volcanism, mainly within the caldera (Mt. Krafla) and to the south. Then, the rifting was shifted to the west for about 5 ka. There seems to have been amazingly little extrusive volcanic activity during that period, the main event being a phreatic eruption from the explosion crater Hvannstóð, about 5 ka ago [7] and resistivity (Figure 9 and Figure 10) shows that no pronounced geothermal system was formed in the western part of the 110 ka caldera.
Here, it is proposed that during the 5 ka, when the rifting was in the western part, intrusions continued to be emplaced in the eastern part and a two-phase geothermal system was formed and sustained there. About 3 ka ago, the spreading shifted back to the presently active part of the fissure swarm. This greatly increased the permeability in the upper part, west of Hveragil, leading to a vigorously convecting isothermal system. At greater depth, continuing intrusions maintained lower permeability with two-phase conditions. Fissures and faults east of Hveragil were not activated when the spreading moved back to the east and two-phase conditions still prevail there.
During the time when the spreading took place in the western part of the 110 ka caldera, intrusions did probably take place in the southwestern part of the inner caldera, south of the transverse low-density structure, and a geothermal system developed. When the rifting turned back east, the permeability increased drastically and cooling took place. Intrusions have not been frequent enough to maintain the heat source(s) and an active geothermal system there. The temperature profile of KV-1 (Figure 13) shows a temperature maximum at a shallow depth and lower temperatures below. This temperature maximum is likely due to a lateral flow in shallow permeable layers. It could be that a small geothermal system still exists further to the west inside the inner caldera and south of the transverse structure.
Hvíthólar (a purple frame in Figure 13) is a small production field with three deep wells, but only one of them is productive. All three wells have temperature profiles showing inversion with depth. Hvíthólar is a small geothermal system just east of the presently active fissure swarm. It is probably isolated from the main system(s) to the north, as indicated by stable isotope ratios (see below). It is suggested that the geothermal system in Hvíthólar is near the end of its lifetime with two-phase conditions at a shallow depth but lower temperature below because the heat sources have run out of heat. Similar conditions are found in the Krýsuvík geothermal area on the Reykjanes peninsula, SW Iceland (ÍSOR database). The geological settings are similar, i.e., hyaloclastite ridges from the end of glaciation. It is suggested that at the end of the glaciation, the rapid pressure drop in the crust did initiate extensive intrusions and eruptions, which generated geothermal systems still present today, but fading out, because their heat sources have not been maintained.
Finally, well KS-1 in Sandabotnaskarð, east of Hvíthólar, encountered a deep geothermal system. The well is deviated to the east, under a fossil alteration on the surface, showing that, recently, there has been geothermal surface activity there. Shallow holes indicate lower temperatures between KS-1 and Hvíthólar (ÍSOR database). Both 1D and 3D inversion MT soundings show a deep low resistivity there (Figure 10). The system encountered in KS-01 seems to be isolated from the systems to the north and Hvíthólar because its fluids have a quite different isotope signature than the others (see below).
5.2. Heat Sources, Magma Ascent and Volcanism
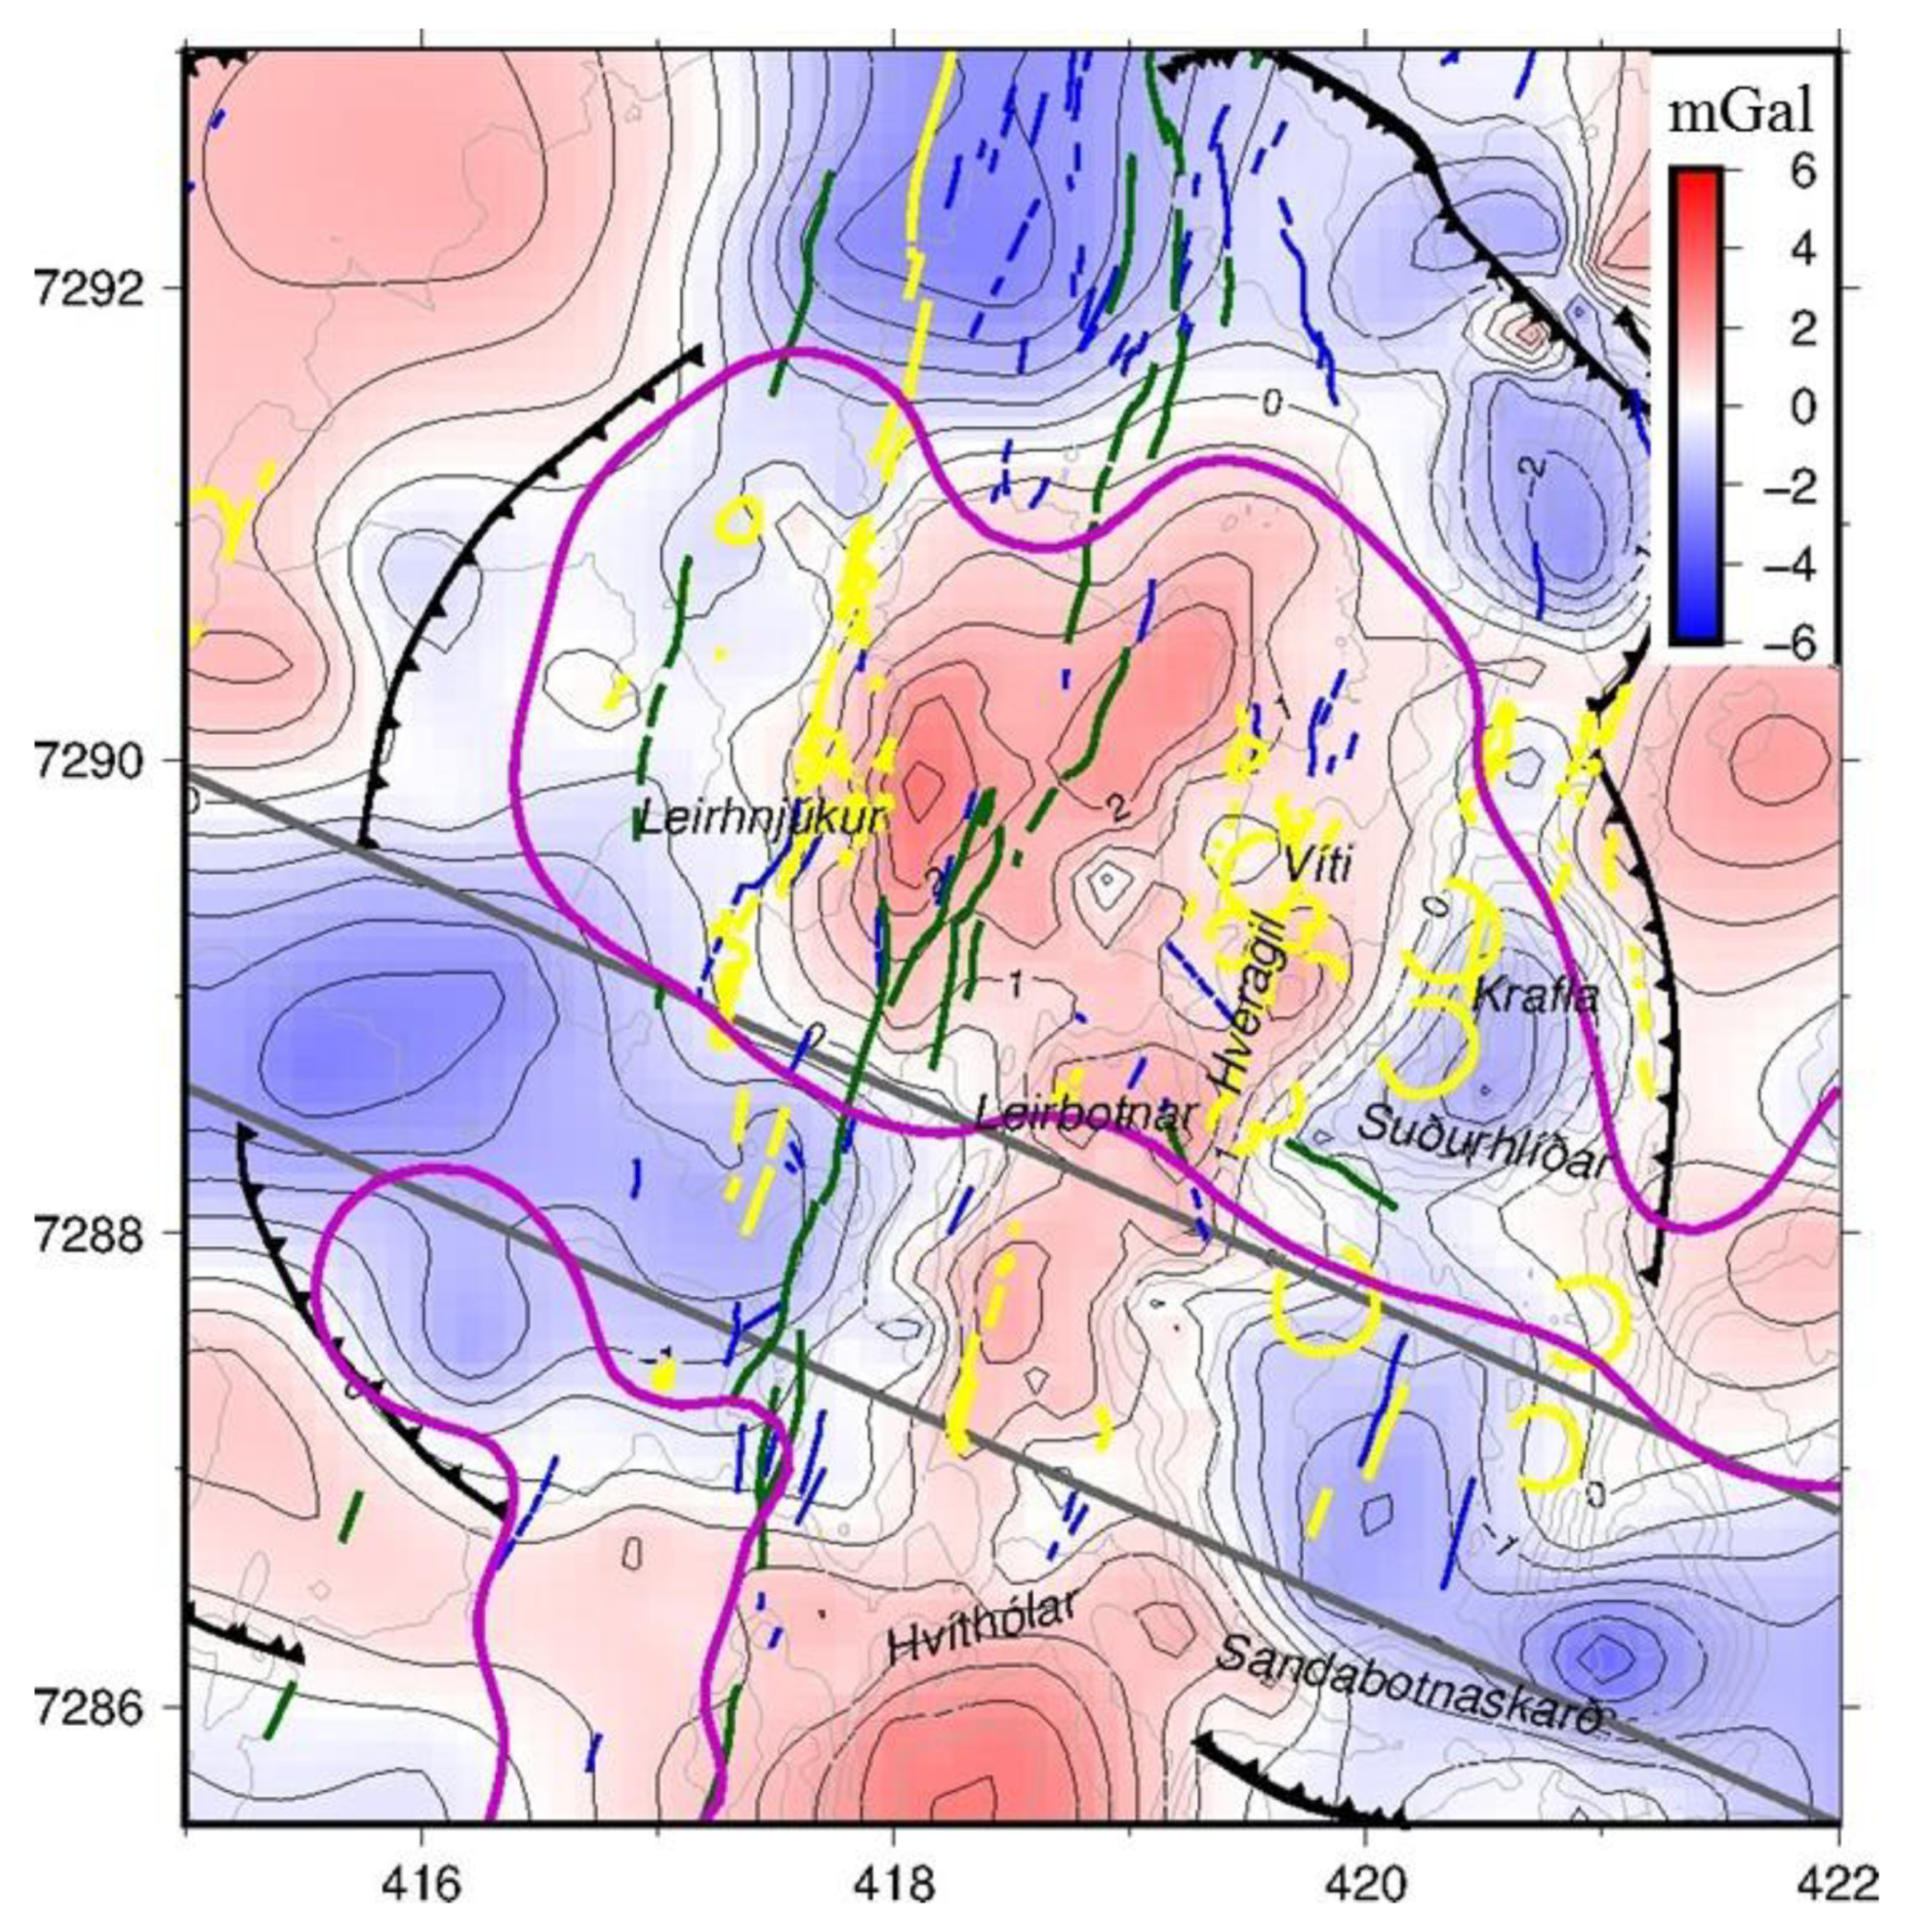
Figure 16 shows a zoom-in of the residual Bouguer gravity in and around the inner caldera. The figure shows a local gravity high within the general gravity low in the inner caldera, mainly north of the transverse structure, but also across it, from Leirbotnar and towards a gravity high at Hvíthólar. These gravity highs show the same general NNE-SSW trends as the fissure swarm. The gravity highs north of the transverse structure extend from Mt. Krafla in the east and to Leirhnjúkur in the west. They are confined within the area where high-temperature alteration is found north of the transverse structure (purple lines in Figure 16, from Figure 9). It is, therefore, natural to assume that they reflect intrusions which are (and have been) heat sources for the main geothermal system within the norther part of the inner caldera.
As mentioned above, there is a local gravity high through the transverse structure from Leirbotnar to Hvíthólar. It roughly coincides with an eruptive fissure from Daleldar, about 1.1 ka old [7]. Resistivity does, however, not show shallow high-temperature alteration there. This gravity high could be due to shallow dikes that have not managed to generate a high-temperature geothermal system. The high gravity crossing the transverse structure connects to a clear gravity high south of Hvíthólar. This gravity high is a part of a more regional gravity high SE of the 110 ka caldera (Figure 7). The gravity map in Figure 16 does not show any gravity anomalies that could be associated to heat sources in Sandabotnaskarð and in the SW part of the inner caldera.
The gravity highs north of the transverse structure reflect the heat sources of the main geothermal system there. These are probably dikes. The opening component discussed above (Figure 5) makes a pathway for basaltic magma in the deeper eastern part of the calderas from the mantle. At depth, these intrusions/dikes probably have an ESE-WNW orientation, but at shallower levels, some of the magma probably migrates into the faults and fissures between Mt. Krafla and Leirhnjúkur, resulting in the NNE-SSW pattern of the gravity highs seen in Figure 16. For some reason, dike injections to the south into the transverse structure seems limited except for the gravity high extending towards Hvíthólar, discussed above. The ESE-WNW dike complex seems to be delineated in the resistivity model from a 3D inversion of MT data (Figure 10). It appears as a high-resistivity zone bordered by low-resistivity, both to the south and north. The resistive central part of the dike complex probably reflects fully crystalized rocks, while the conductive margins might be a partial melt and hence explaining the S-wave shadows (see discussion below).
The main pathway of ascending basaltic magma from the mantle is probably offset to the east of the presently active spreading as manifested by the abundant explosive craters in the western slope and south of Mt. Krafla (Figure 16). In between rifting events, basaltic intrusions may enter east of the fissure swarm without reaching surface but triggering explosions/eruptions (Figure 16) ejecting silicic tephra (see discussion below). In major rifting events with long dike injections and fissure eruptions like the Mývatn and Krafla Fires, the magma flows up and to the west towards Leirhnjúkur in the presently active fissure swarm which, on surface, looked as the centre of activity. This idea gets support from the fact that the Mývatn Fires started with an explosive eruption in Víti, just west of Mt. Krafla and about 2 km east of Leirhnjúkur and the fact that at the beginning of the Krafla Fires, fumaroles SE of Víti had large increase in volcanic gases, even larger than fumaroles in Leirhnjúkur [11]. It also gets support from the fact that an ESE-WNW trending fault in the southern part of Mt. Krafla moved in the Krafla Fires (Figure 4 and Figure 16). As the magma ascends, it starts to degas, causing the severe gas contamination in the deeper two-phase part of the geothermal system west of Mt. Krafla. As mentioned earlier, it has been suggested [18] that there are several magma reservoirs in the volcano, based on detailed crustal deformation during an eruption in Krafla Fires. These might be the magma plumbing system conveying magma from a deep up-flow in the east and towards the fissure swarm at Leirhnjúkur.
5.3. Origin of the Geothermal Fluids
The origin of the geothermal fluids in Krafla has been studied and debated for many years. The origin of geothermal fluids is normally estimated on the bases of the deviation of ratios of stable isotopes of oxygen, δ18O, and hydrogen, δD, from that of Standard Mean Oceanic Water (SMOW) [46] and comparison with local meteoric values [47]. There can be a significant oxygen isotope exchange due to water-rock interaction but δD is assumed to be better preserved and a better indicator of the original fluid.
The δD of local rainfall in the Krafla area is about −86‰ [48]. The δD of well discharge in the Vítismór-Leirbotnar area is about −87‰ but about −92‰ in the southern slopes of Mt. Krafla east of Hveragil and in Hvíthólar [47]. This is considered a significant difference. In the discharge from well KS-1 in Sandabotnaskarð, δD is even lower or about −115‰ (ÍSOR database), similar to wells in Námafjall geothermal system south of Krafla. In [47], it is concluded that the geothermal system under Vítismór-Leirbotnar is recharged by local meteoric water and state that the geothermal systems east of Hveragil and Hvíthólar seem to have “the same source of recharge” of water from higher elevation.
In a recent study [49], it is argued that the isotope composition of the discharged fluids from the high/excess enthalpy wells east of Hveragil is distorted from that of the actual reservoir fluid towards a lower δD due to phase segregation and that the reservoir fluids in the geothermal system(s) in the inner caldera, north of the transverse structure, are of the same origin, i.e., local rainfall. This supports the idea put forward above, that what looks like two different geothermal systems east and west of Hveragil, are actually one system, the only difference being different permeability in the upper part.
The low δD in Hvíthólar and in KS-01 in Sandabotnaskarð cannot be attributed to phase segregation like in the flanks of Mt. Krafla. The enthalpy there is about 2500 kJ/kg while the enthalpy in Hvíthólar is about 1200 kJ/kg [12] and about 1500 kJ/kg in KS-01 (ÍSOR database). The geothermal fluids in KS-01 seem to originate from the general groundwater flow from higher elevation in the south with a similar δD as the fluids in Námagjall and local groundwater south of Námafjall [47]. The geothermal fluids in Hvíthólar might be a mixture of local rainwater and groundwater from south. It, therefore, seems that there is no (or very little) hydrological connection across the transverse low-density structure between the geothermal system in the northern part of the inner caldera and Hvíthólar and the system encountered by KS-01 in the southern part. Furthermore, as mentioned above, geophysical data and the results of temperature measurements in boreholes indicate that the geothermal activity in Hvíthólar and Sandabotnaskarð are separate systems.
6. The Role of Melting
Two wells in Krafla have encountered silicic melt, K-39 and IDDP-1. K-39, which was drilled directionally towards east under the southern slopes of Krafla (for location see Figure 14), hit melt close to the bottom at about 2600 m below the surface [50]. The stuck drill string, cut loose by blasting, contained fresh rhyolite glass (69.0 to 78.8 wt.% silica). The bottom section of the hole was plugged with cement. The glass was interpreted to be quenched rhyolite magma derived by partial melting of geothermally altered basalt in a contact zone of a gabbroic intrusion [50].
IDDP-1, which was designed to be drilled vertically to 4 to 5 km in depth and into super critical fluids (for location see Figure 14 and Figure 11), surprisingly hit silicic melt at the depth of 2104 m [51]. After drilling about 30 m with total loss of circulation, the penetration rate suddenly increased and the torque on the drilling assembly increased [52]. After pulling the drill string somewhat up and lowering it again, the drill bit got stuck at the depth of 2095 m, so the magma had been squeezed up into the borehole and a large amount of both brown and clear glass was recovered. The drilling was then halted and a cemented casing was installed to 1960 m depth. The well was cooled by injecting cold water into it for a month. After about seven months of heating up, discharge tests started. In the beginning of the flow-test, the well discharged dark water and steam (Figure 17). After the well had discharged for some time, it discharged superheated steam at a temperature of around 450 °C and a pressure of 140 bars at the well head. The maximum flow was around 45–50 kg/sec with an enthalpy of about 3200 kJ/kg giving about 200 MWt and 35 MWe [53].
The fluid discharged from IDDP-1 was enriched in CO2 and H2S as well as chlorine (Cl), fluorine (F) and boron (B) relative to normal geothermal fluids in Krafla [54]. The black colour of the discharge in the beginning was due to corrosion of the casing by hydrochloric acid formed when the chlorine from the superheated steam dissolved in water droplets. Several other wells in Krafla had the same character when discharged, so-called “black death”, and are thought to have hit superheated steam close to magma [55].
The results of the drilling and flow-test of IDDP-1 clearly showed that right above the molten magma there was a permeable layer with superheated steam. Since “black death” has been observed in several other wells, it seems that similar conditions are found to be widespread in the reservoir inside the inner caldera, north of the transverse structure. This is in agreement with the observation and interpretation of the low P-wave velocity around 2.5 km depth within the ESE-WNW dike complex north of the transverse structure [34].
Detailed analysis of the glass from IDDP-1 [52,56] showed that it was quenched, near-liquidus rhyolitic magma (~76.5 wt.% SiO2) but with oxygen and hydrogen isotope values (δ18O = 3.1‰; δ2H = −118‰), depleted relative to mantle values. From this it was concluded that its composition is consistent with the formation by partial melting of basalt which had been hydrothermally altered by meteoric water. They estimate the in-situ temperature to be in the range of 850 to 920 °C and that it had degassed at a pressure of 40 MPa, which is higher than hydrostatic pressure but lower than lithostatic pressure expected at 2100 m depth. Based on crystal zoning, they further infer that the magma originated at a greater depth and migrated upward to its present position.
In a study of silicic rocks in Krafla and in the active volcanic zones in Iceland [13,57], it was concluded, based on chemical and oxygen isotopic composition, that they are derived from partial melting of older basaltic rocks that were hydrated by meteoric water. It was further concluded that the silicic magma is formed in intrusive complexes beneath the volcanoes rather than by differentiation in large long-lived magma chambers.
Krafla is not the only geothermal area where drilling into upper crustal magma has taken place. The first reported incidence was in 2005 in the Puna geothermal field, Big Island Hawaii [58], where a drilling hit dacite magma (67 wt.% SiO2) at the depth of 2488 m. Furthermore, in at least three wells drilled in Menengai caldera in Kenya, trachitic magma (63 wt.% SiO2) at the depth of 2040 to 2180 m was encountered [59]. A detailed petrological study has, so far, not been carried out on the quenched magma from Menengai.
All this suggests that rather shallow partial melting of old, hydrothermally altered volcanic rocks can be an important factor in volcanism and volcanic geothermal systems, at least in extensional tectonic environments. In evolved volcanos, the hydrothermal systems alter the host rocks, forming secondary hydrated minerals that lower the solidus temperature and produce more silicic early melt than the parent un-hydrated rocks. As the volcano builds up, the altered rocks subside to greater depths, particularly, in cases where a caldera structure develops. If a 1200 °C basaltic magma pools in this substrate, dehydration melting takes place, with partial melt segregating and buoyantly ascending. The melt is near liquidus and relatively rich in volatiles and hence with a low viscosity. As the melt migrates up, it cools, degases and the viscosity increases. Finally, it can be stagnated by minor structural obstructions, spreading out as sills. The occurrences discussed above indicate that for some reason, takes place at about 2–3 km depth.
If this is correct, re-melting of geothermally altered rocks and the ascent of the melt to shallower crustal levels can be a hitherto unrecognised but important heat transport mechanism from deep intrusions to the base of the geothermal system above. Therefore, as the volcano evolves, the geothermal system with the ascent of magma from below become a feedback system that facilitates heat flow from the mantle to the surface.
Geothermal drilling has shown that silicic intrusions are common in volcanic geothermal systems in Iceland. An exception is the Reykjanes peninsula, SW Iceland. In fact, no silicic rocks are found on surface west of the Hengill volcano SW-Iceland (this will be addressed below). In Krafla, silicic intrusions are more abundant in the eastern part of the wellfield, north of the transverse structure, where the rhyolitic explosion craters are found, than in the western part [12]. This supports the idea that basaltic intrusions at depth are more common in the eastern part of the inner caldera. Due to the nature of their formation, the silicic intrusions are probably in isolated pockets and, therefore, not detected/resolved by the MT.
IDDP-1 showed that there is a permeable zone with superheated steam above the magma pocket. The steam is probably trapped in ductile rocks. The low P-wave velocity anomaly at depth [34] (Figure 12 right), probably reflects the extent of superheated steam above recent silicic intrusions or magma pockets and could therefore be a proxy of their distribution.
Partial re-melting of hydrothermally altered basalt can explain the bimodal behaviour of evolved volcanos such as Krafla and Askja, i.e., occasionally having large and often phreatic silicic eruptions but erupting only basalt in-between. Over time, silicic intrusions and magma pockets accumulate at shallow crustal levels. When a substantial amount of silicic magma has accumulated, major basaltic intrusion(s) can mobilise the silicic magma triggering an eruption. After they have been erupted, the cycle starts again.
As mentioned above, no silicic rocks are found on the Reykjanes peninsula west of Hengill. The only occurrences are a basalt andesite intrusion encountered at a depth of around 800 m in well SG-12 in Svartsengi [60] and some felsite veins at the depth of 4634.5 m in IDDP-2 at the tip of the peninsula [61]. This is probably because the Reykjanes peninsula is a thin and young, basically oceanic, crust and different from crust further inland. It lacks the central volcanoes that have produced massive lava accumulations and caldera structures, where basalts are buried, hydrothermally altered, and subside to where they can melt.
The results of country-wide MT measurements show a deep, low-resistivity layer under most of Iceland [62], but this layer is absent under the Reykjanes peninsula. The nature of this low-resistivity layer has been a matter of discussion for a long time. It has been proposed [62] that it is partially molten rocks, but results of seismic studies, e.g., [63], show that this cannot be the case. An alternative explanation has been suggested [63] and supported by the author, namely that the deep conductive layer is due to dehydrating alteration minerals (chlorite, epidote and amphibole). Recent laboratory measurements [64,65] show an irreversible and substantial increase in electrical conductivity when rocks containing chlorite and epidote are heated above 600–700 °C under high pressure. This is explained by dehydration of the chlorite and epidote minerals, releasing hydrogen and water and resulting in the oxidation of Fe+2 to Fe+3 [66] and the minerals becoming electron/hole semi-conductors. If this is the correct explanation of the deep conducting layer under most of Iceland, it means that the crust is weathered/hydrothermally altered but the crust under the Reykjnes peninsula is not or at least to lesser extent. It, therefore, seems like the alteration of the crust somehow preconditions partial melting in central volcanos, but this is a subject for a separate study.
7. The S-Wave Shadows
One thing remains to be addressed. The S-wave shadows observed during the Krafla Fires have been interpreted as due to a volume containing magma. They do appear as a high resistivity in the 3D MT model, but bordered by low resistivity, both to the south and north (Figure 10). Recent measurement of resistivity of molten basalt and rhyolite from Krafla [67] give 1.2–0.8 Ωm for rhyolite melt at temperatures from 900 to 1000 °C and 1.7–0.5 Ωm for basalt melt at temperatures from 1170 to 1250 °C. These are really low values and extended volumes of magma, as indicated by the S-wave shadows, should, therefore, be observed by MT as low-resistivity bodies. The most natural explanation of the absence of such a body is that the melt is in unconnected pockets. This seems, however, in contradiction with seismological observations. Seismologists say that in order to have a substantial attenuation of S-waves, connected magma/liquid volumes have to have dimensions of the order of the wavelength of the S-waves, which, in this case, is about 0.5–1 km (e.g., [68,69]). An anonymous reviewer suggests, however, that the “S-wave shadows” could be a manifestation of the radiation pattern and network distribution or that a sufficiently dense distribution of melt pockets may be “seen” by the S-waves as a single viscous body. This needs to be studied by numerical modelling.
Here, the ESE-WNW trending high-resistivity body in the S-wave shadows is considered to be a dike complex. One possible scenario is that the low resistivity bordering it is still-molten dikes. The low resistivity south of the complex could be a dike injected during the Mývatn Fires when diking into the fissure swarm and eruptions were mainly to the south. The low resistivity on the northern side could be due to a dike injected at the northern margin of the dike complex in the Krafla Fires, where dike injections into the fissures swarm and eruptions were manly to the north. This could explain the S-wave shadows, because the S-waves from which it is inferred are mainly traveling perpendicular to such dikes. The low-resistivity bordering the dike complex could also be due to dehydration of alteration minerals as discussed above. However, this contradicting evidence from seismic and resistivity studies still remains un-resolved.
8. Summary and Conclusions
This study indicates that the geological structure of the Krafla volcano is more complex than hitherto believed. The 110 ka caldera hosts, now buried, an 80 ka inner caldera and both calderas are bisected by an ESE-WNW transverse low-density structure. Resistivity surveys show that geothermal activity has mainly been within the inner caldera, but it is cut through by the ESE-WNW structure. A difference in the local crustal spreading directions south and north of the calderas leads to a N–S opening component, favouring the ascent of basaltic magma from the mantle and explaining why most of the volcanic activity is in the eastern part of the calderas.
The present thermo-hydraulic character of the main geothermal system can be understood by considering the geological and tectonic history. When crustal spreading moved back from the western part of the fissure swarm to the eastern part 3 ka ago, permeability above the deeper intrusions increased drastically, resulting in a vigorous almost isothermal convection in the part where faults and fractures where reactivated, but further to the east where fissures were not reactivated and two-phase conditions prevail there. Hydrogen isotope ratios in geothermal fluids in Krafla show that, north of the transverse structure, they are of a local meteoric origin, but the fluids in Sandabotnaskarð and Hvíthólar are from the general groundwater stream from higher altitude in the south. There seems to be little, if any, hydrological connection between the geothermal systems north and south of the low-density transverse structure.
The silicic magma encountered in K-39 and IDDP-1 indicates a hitherto overlooked heat transport mechanism in evolved volcanoes, i.e., an ascending silicic re-melt of altered basaltic rocks by basalt intrusions and getting stagnant magma pockets at shallow crustal levels, producing a superheated steam zone above them. Bimodal volcanic behaviour of evolved volcanos like Krafla and Askja, occasional silicic eruptions, often phreatic, but purely basaltic in-between, can be understood by considering the volcano and its geothermal system(s) as coupled systems, enhancing heat flow from the mantle. The geothermal system produces alteration for “distilling” out silicic magma. When a substantial amount of silicic intrusions/magma has accumulated, major basalt intrusion(s) may “ignite” them causing a silicic eruption and the cycle starts again.
An important conclusion from this work is that a holistic approach, considering different and independent datasets and information, can shed light on complex structures of volcanoes and associated geothermal systems. Of particular importance is to study and take into account tectonics and geological history. Geophysical surveys and monitoring, sensitive to different physical parameters, and geochemistry are also vital. These are inexpensive studies, but their derived models usually need to be checked by much more expensive drilling. Conceptual models, often based on limited data, should not get stagnant for decades like in the case of Krafla. Any new information should constantly be used to reconsider and update the conceptual models. This will make geothermal drilling and utilization more focused and cost-effective.
Funding
This research received no external funding.
Acknowledgments
The author wants to thank Thorbjörg Ágústdóttir and Halldór Ármannsson at ÍSOR and four anonymous reviewers for their valuable and constructive suggestions and corrections that greatly improved this paper.
Conflicts of Interest
The author declares no conflict of interest.
References
- Guðmundsson, G.; Pálmason, G.; Grönvold, K.; Ragnarsson, K.; Sæmundsson, K.; Arnórsson, S.; Námafjall, K. Áfangaskýrsla um Rannsókn Jarðhitasvæðanna (e. Námfjall-Krafla. An Interim Report on Exploration of the Geothermal Areas); Orkustofnun: Reykjavík, Iceland, 1971.
- Karlsdóttir, R.; Johnsen, G.; Björnsson, A.; Sigurðsson, Ó.; Hauksson, E. Jarðhitasvæðið við Kröflu. Áfangaskýrsla um Jarðeðlisfræðilegar Yfirborðsrannsóknir 1976–1978 (e. Krafla Geothermal Area. An Interim Report on Surface Geophysical Studies 1976–1978); Orkustofnun: Reykjavík, Iceland, 1978.
- Gíslason, G.; Ármannsson, H.; Hauksson, T. Krafla Hitaástand og Gastegundir í Jarðhitakerfinu (e. Krafla. Thermal Conditions and Gases in the Geothermal System); Orkustofnun: Reykjavík, Iceland, 1978.
- Ármannsson, H.; Gíslason, G.; Hauksson, T. Magmatic Gases in Well Fluids Aid. The Mapping of the Flow Pattern in a Geothermal System; Orkustofnun: Reykjavík, Iceland, 1981.
- Ármannsson, H.; Benjamínsson, J.; Jeffrey, A.W.A. Gas changes in the Krafla geothermal system, Iceland. Chem. Geol. 1989, 76, 175–196. [Google Scholar]
- Árnadóttir Th Lund, B.; Jiang, W.; Geirsson, H.; Björnsson, H.; Einarsson, P. Glacial rebound and plate spreading: Results from the first countrywide GPS observations in Iceland. Geophys. J. Int. 2009, 177, 691–716. [Google Scholar] [CrossRef] [Green Version]
- Sæmundsson, K. Geology of Krafla Volcanic System; Garðarsson, A., Einarsson, Á., Eds.; Náttúra Myávatns Hið Íslenska Náttúrufræðifélag: Reykjavík, Iceland, 1991; pp. 25–95. [Google Scholar]
- Sæmundsson, K. Krafla, Geological Map, 1:25,000; Landsvirkjun: Reykjavík, Iceland, 2008. [Google Scholar]
- Kennedy, B.M.; Holohan, E.P.; Stix, J.; Gravley, D.M.; Davidson, J.R.J.; Cole, J.W. Magma plumbing beneath collapse caldera volcanic systems. Earth Sci. Rev. 2018, 177, 404–424. [Google Scholar] [CrossRef]
- Drouin, V.; Sigmundsson, F.; Ófeigsson, B.G.; Hreinsdóttir, S.; Sturkell, E.; Einarsson, P. Deformation in the Northern Volcanic Zone of Iceland 2008–2014: An interplay of tectonic, magmatic, and glacial isostatic deformation. J. Geophys. Res. Solid Earth 2017, 122, 3158–3178. [Google Scholar] [CrossRef]
- Ármannsson, H.; Gudmundsson, Á.; Steingrímsson, B.S. Exploration and development of the Krafla geothermal area. Jökull 1987, 37, 13–30. [Google Scholar]
- Weisenberger, T.B.; Axelsson, G.; Arnaldsson, A.; Blischke, A.; Óskarsson, F.; Ármannsson, H.; Blanck, H.; Helgadóttir, H.M.; Berthet, J.C.; Árnason, K.; et al. Revision of the Conceptual Model of the Krafla Geotermal System; ÍSOR: Reykjavík, Iceland, 2015; 111p.
- Jónasson, K. Rhyolite volcanism in the Krafla central volcano, north-east Iceland. Bull. Volcanol. 1994, 56, 516–528. [Google Scholar] [CrossRef]
- Einarsson, P. Umbrotin við Kröflu 1975–1989; Garðarsson, A., Einarsson, Á., Eds.; Náttúra Myávatns Hið íslenska náttúrufræðifélag: Reykjavík, Iceland, 1991; pp. 96–139. [Google Scholar]
- Möller, D.; Ritter, B.; Wendt, K. Geodetic measurements of horizontal deformation in northeast Iceland. Earth Evol. Sci. 1982, 2, 149–154. [Google Scholar]
- Kanngieser, E. Vertical component of ground motion in north Iceland. Ann. Geophys. 1983, 1, 321–328. [Google Scholar]
- Tryggvason, E. Surface deformation at the Krafla volcano, North Iceland. 1982–1989. Bull. Volcanol. 1994, 56, 98–107. [Google Scholar] [CrossRef]
- Tryggvason, E. Multiple magma reservoirs in a rift zone volcano. Ground deformation and magma transport during the September 1984 eruption of Krafla, Iceland. J. Volanol. Res. 1986, 28, 1–44. [Google Scholar] [CrossRef]
- Árnadóttir Th Sigmundsso, F.; Delaney, P.T. Sources of crustal deformation associated with the Krafla, Iceland, eruption of September 1984. Geophys. Res. Lett. 1998, 25, 1043–1046. [Google Scholar] [CrossRef]
- Buck, W.R.; Einarsson, P.; Brandsdóttir, B. Tectonic stress and magma chamber size as controls on dike propagation: Constraints from the 1975–1984 Krafla rifting episode. J. Geophys. Res. Solid Earth 2006, 111. [Google Scholar] [CrossRef]
- Heimisson, E.R.; Einarsson, P.; Sigmundsson, F.; Brandsdóttir, B. Kilometer-scale Kaiser effect identified in Krafla volcano, Iceland. Geophys. Res. Lett. 2015, 42, 7958–7965. [Google Scholar] [CrossRef] [Green Version]
- Einarsson, P. S-wave shadows in the Krafla caldera in NE-Iceland, evidence for a magma chamber in the crust. Bull. Volcanol. 1978, 41, 1–9. [Google Scholar] [CrossRef]
- Sturkell, E.; Sigmundsson, F.; Geirsson, H.; Ólafsson, H.; Theodórsson, T. Multiple volcano deformation sources in a post-rifting period: 1989-2005 behaviour of Krafla, Iceland constrained by levelling and GPS observations. J. Volcanol. Geotherm. Res. 2008, 177, 405–417. [Google Scholar] [CrossRef]
- Drouin, V.; (ISOR and Freistenn Sigmundsson, University of Iceland, Reykjavík, Iceland). Personal communication, 2019.
- Johnsen, G.V. Þyngdarkort af Kröflusvæði (e. GRAVITY Map of the Krafla Area); Hróarsson, B., Jónsson, D., Jónsson, S.S., Eds.; EYJAR Í ELDHAFI: Reykjavík, Iceland, 1995; pp. 93–100. [Google Scholar]
- Árnadóttir Th Geirssom, H.; Jiang, W. Crustal deformation in Iceland: Plate spreading and earthquake deformation. Jökull 2008, 58, 59–74. [Google Scholar]
- Sæmundsson, K.; (ISOR, Reykjavík, Iceland). Personal communication, 2016.
- Árnason, K.; Haraldsson, G.I.; Johnsen, G.V.; Þorbergsson, G.; Hersir, G.P.; Sæmundsson, K.; Georgsson, L.S.; Rögnvaldsson, S.T.; Snorrason, S.P. Nesjavellir-Ölkelduháls. Surface Exploration in 1986; Orkustofnun Report: Reykjavík, Iceland, 1987; 112p.
- Árnason, K.; Karlsdóttir, R.; Eysteinsson, H.; Flóvenz, Ó.G.; Guðlaugsson, S.T. The resistivity structure of high-temperature geothermal systems in Iceland. In Proceedings of the 2000 World Geothermal Congress, Toholu-Kyushu, Japan, 28 May–10 June 2000; pp. 923–928. [Google Scholar]
- Árnason, K.; Magnússon, I.Þ. Niðurstöður Viðnámsmælinga í Kröflu (e. Results of Resistivity Surveys in Krafla); Orkustofnun: Reykjavík, Iceland, 2001.
- Rosenkjaer, G.K.; Gasperikova, E.; Newman, G.A.; Arnason, K.; Lindsey, N.J. Comparison of 3D MT inversions for geothermal exploration: Case studies for Krafla and Hengill geothermal systems in Iceland. Geotherrmics 2015, 57, 258–274. [Google Scholar] [CrossRef] [Green Version]
- Blanck, H.; Ágústsson, K.; Gunnarsson, K. Seismic Monitoring in Krafla; ÍSOR: Reykjavík, Iceland, 2017.
- Ágústsson, K.; Flóvenz, Ó.G. The thickness of the seismogenic crust in Iceland and its implications for geothermal systems in Iceland. In Proceedings of the World Geothermal Congress, Reykjavík, Iceland, 24–30 April 2005. [Google Scholar]
- Schuler, J.T.; Greenfield, R.S.; White, S.W.; Roecker, B.; Brandsdóttir, J.M.; Stock, J.; Tarasewicz, H.; Martens, H.R.; Pugh, D. Seismic imaging of the shallow crust beneath the Krafla central volcano, NE Iceland. J. Geophys. Res. Solid Earth 2015, 120, 7156–7173. [Google Scholar] [CrossRef] [Green Version]
- Stefánsson, V. The Krafla Geothermal Field Northeast ICELAND. In Geothermal Systems: Principles and Case Histories; Rybach, L., Muffler, L.J.P., Eds.; John Wiley and Sons Ltd.: Hoboken, NJ, USA, 1981; pp. 273–294. [Google Scholar]
- Bodvarsson, G.S.; Pruess, K.; Stefansson, V.; Eliasson, E.T. The Krafla geothermal field, Iceland: 2. The natural state of the system. Water Resour. Res. 1984, 20, 1545–1559. [Google Scholar] [CrossRef]
- Stefánsson, V.; Kristannsdóttir, H.; Gíslason, G. (Orkustofnun, Reykjavík, Iceland). Holubréf nr. 7, Orkustofnun; Unpublished work. 1977. [Google Scholar]
- Stefánsson, V. Investigation on the Krafla high temperature geothermal field Náttúrufræðingurinn. Natturufraedingurinn Reykjavik 1980, 50, 333–359. [Google Scholar]
- Mortensen, A.K.; Guðmundsson, Á.; Steingrímsson, B.; Sigmundsson, F.; Axelsson, G.; Ármannsson, H.; Björnsson, H.; Ágústsson, K.; Sæmundsson, K.; Ólafsson, M.; et al. Jarðhitakerfið í Kröflu. Samantekt Rannsókna á Jarðhitakerfinu og Endurskoðað Hugmyndalíkan (e. The Geothermal System in Krafla. An Overview of Studies of the Geothermal System and Revised Conceptual Model); ÍSOR: Reykjavík, Iceland, 2009.
- Haiba, D.O.; Ingebresen, S.E. Multiphase groundwater flow near cooling plutons. J. Geophys. Res. 1997, 102, 12235–12252. [Google Scholar] [CrossRef]
- Haiba, D.O.; Ingebresen, S.E. The Computer Model HYDROTHERM, a Tree-Dimensional Finite-Difference Model to Simulate Ground-Water Flow and Heat Transport in the Temperature range of 0 °C to 1200 °C; USGS: Reston, VA, USA, 1994; pp. 94–4045.
- Kipp, K.L.; Hsieh, P.A.; Charlton, S.C. Revised Ground-Water Flow and Heat Transport Simulator: HYDROTHERM-Version 3; USGS: Reston, VA, USA, 2008.
- Scott, S.; Driesner, T.; Weis, P. The thermal structure and temporal evolution of high-enthalpy geothermal systems. Geothermics 2016, 62, 33–47. [Google Scholar] [CrossRef] [Green Version]
- Björnsson, G.; Steingrímsson, B. Temperature and Pressure in the Geothermal System in Svartsengi. Original Status and Changes Due to Production; Orkustofnun: Reykjavík, Iceland, 1991; p. 6.
- Arnalds, A.; (Vatnaskil ltd., Reykjavík, Iceland). Personal communication, 2018.
- Homberg, G.M. New manuscript guidelines for the reporting of stable hydrogen, carbon, and oxygen isotope ratio data. Water Resour. Res. 1995, 31, 2895–2925. [Google Scholar]
- Darling, W.G.; Ármannsson, H. Stable isotopic aspects of fluid flow in the Krafla, Námafjall and Theistareykir geothermal systems of Northeast Iceland. Chem. Geol. 1989, 76, 175–196. [Google Scholar] [CrossRef]
- Árnason, B. Hydrothermal systems in Iceland traced by deuterium. Geothermics 1977, 5, 125–151. [Google Scholar] [CrossRef]
- Pope, E.C.; Bird, D.K.; Arnórsson, S.; Giroud, N. Hydrology of the Krafla geothermal system, northeast Iceland. Geofluids 2016, 16, 175–197. [Google Scholar] [CrossRef]
- Mortensen, A.K.; Grönvold, K.; Gudmundsson, Á.; Steingrímsson, B.; Egilson, T. Quenched Silicic Glass from Well KJ-39 in Krafla, North-East Iceland. In Proceedings of the World Geothermal Congress 2010, Bali, Indonesia, 25–29 April 2010. [Google Scholar]
- Friðleifsson, G.Ó.; Pálsson, G.; Björnsson, F.; Albertsson, A.; Gunnlaugsson, E.; Ketilssonj, J.; Lamrache, R.; Andersen, P.E. Iceland Deep Drilling Project. The first IDDP Drill Hole Drilled and Completed in 2009. In Proceedings of the World Geothermal Congress 2010, Bali, Indonesia, 25–29 April 2010. [Google Scholar]
- Elders, W.A.; Friðleifsson, G.Ó.; Zierenberg, R.A.; Pope, E.C.; Mortensem, A.K. Origin of a rhyolite that intruded a geothermal well while drilling at the Krafl a volcano, Iceland. Geol. March 2011, 39, 231–234. [Google Scholar] [CrossRef]
- Markússon, S.H.; Einarsson, K.; Pálsson, P. IDDP-1 Flow Tests 2010–2012; Landsvirkjun: Reykjavík, Iceland, 2013. [Google Scholar]
- Stefánsson, A. Geochemical Assessment of the Utilization of IDDP-1, Krafla; Landsvirkjun: Reykjavík, Iceland, 2014; 59p. [Google Scholar]
- Einarsson, K.; Pálsson, B.; Gudmundsson, Á.; Hólmgeirsson, S.; Ingason, K.; Matthíasson, J.; Hauksson, T.; Ármannsson, H. Acid wells in the Krafla geothermal field. In Proceedings of the World Geothermal Congress 2010, Bali, Indonesia, 25–29 April 2010. [Google Scholar]
- Zierenberg, R.A.; Schiffman, P.; Barfod, G.H.; Lesher, C.E.; Marks, N.E.; Lowenstern, J.B.; Mortensen, A.K.; Pope, E.C.; Fridleifsson, G.Ó.; Elders, W.A. Composition and origin of rhyolite melt intersected by drilling in the Krafla geothermal field, Iceland. Contrib. Mineral. Petrol. 2013, 165, 327–347. [Google Scholar] [CrossRef]
- Jónasson, K. Silicic volcanism in Iceland: Composition and distribution within the active volcanic zones. J. Geodin. 2007, 43, 101–117. [Google Scholar] [CrossRef]
- Teplow, W.; Marsh, B.; Hulen, J.; Spielman, P.; Kaleikini, M.; Fitch, D.; Rickard, W. Dacite melt at the Geothermal Venture Wellfield, Big Island of Hawaii. GRC Trans. 2009, 33, 989–1005. [Google Scholar]
- Mibei, G.K. Preliminary Report on Manengai Intrusive Mapping; Geothermal Development Company: Nairobi, Kenya, 2014. [Google Scholar]
- Franzson, H. Svartsengi-Eldvörp, A Conceptual Model of the Geothermal Reservoir; ÍSOR: Reykjavík, Iceland, 2017; 69p.
- Friðleifsson, G.Ó.; Elders, W.A.; Zierenberg, R.A.; Stefánsson, A.; Fowler, A.P.G.; Weisenberger, T.B.; Harðarson, B.S.; Mesfin, K.G. The Iceland Deep Drilling Project 4.5 km deep well, IDDP-2, in the seawater-recharged Reykjanes geothermal field in SW Iceland has successfully reached its supercritical target. Sci. Drill. 2017, 23, 1–12. [Google Scholar]
- Björnsson, A.; Eysteinsson, H.; Beblo, M. Crustal Formation and Magma genesis Beneath Iceland: Magnetotelluric constraints, Plates, Plumes and Paradigms; Geological Society of America: Boulder, CO, USA, 2005; pp. 665–686. [Google Scholar]
- Vilhjálmsson, A.M.; Flóvenz, Ó.G. Geothermal Implications from a Resistivity Survey in the Volcanic Rift Zone of NE-Icelandand Comparison with Seismic Data; ÍSOR: Reykjavík, Iceland, 2017; 46p.
- Manthilake, G.; Casanova, N.B.; Novella, D.; Mookherjee, M.; Andrault, D. Dehydration of chlorite explains anomalously high electrical conductivity in the mantle wedges. Sci. Adv. 2016, 2, e1501631. [Google Scholar] [CrossRef] [PubMed] [Green Version]
- Nono, F.; Gibert, A.; Parat, F.; Loggia, D.; Cichy, S.B.; Violay, M. Electrical onductivity of Icelandic deep geothermal reservoirs up to supercritical conditions: Insight from laboratory experiments. J. Volcanol. Geotherm. Res. 2018, in press. [Google Scholar] [CrossRef]
- Wang, D.; Guo, Y.; Yu, Y.; Karato, S. Electrical Conductivity of Amphibole-Bearing Rocks: Influence of Dehydration. Contrib. Mineral. Petrol. 2012, 164, 17–25. [Google Scholar] [CrossRef]
- Gibert, B.; Levy, L.; Sigmundsson, F.; Hersir, G.P.; Flovenz, Ó.G. Electrical Conductivity of Basaltic and Rhyolitic Melts from Krafla central Volcano, Iceland. In Proceedings of the IMAGE Final Conference, Akureyri, Iceland, 4–6 October 2017. [Google Scholar]
- Jackson, D.D.; Anderson, D.L. Physical mechanisms of seismic-wave attenuation. Rev. Geophys. 1970, 8, 1–63. [Google Scholar] [CrossRef] [Green Version]
- Einarsson, P.; (University of Iceland, Reykjavík, Iceland). Personal communication, 2018.
Figure 1.
A simplified tectonic map of Iceland showing the location of Krafla (black square). Red broken lines represent spreading zones. WVZ is the Western Volcanic Zone, EVZ is the Eastern Volcanic Zone, NVZ is the Northern Volcanic Zone. SISZ is the South Iceland Seismic/Transform Zone and TFZ is the Tjörnes Fracture/Transform Zone. Thin black broken lines show central volcanoes and yellow coloured areas fissure swarms.

Figure 2.
An overview of the Krafla area and the central part of the fissure swarm. The figure shows the visible 110 ka caldera (black), faults and fissures close to Krafla (blue), craters and eruptive fissures (orange) and geothermal manifestations (red). The figure also shows the subsidiary geothermal area in Námafjall, south of Krafla. Coordinates are UTM, WGS84, zone 28 in km.

Figure 3.
A simplified geological map of Krafla. The map also shows inferred structural features discussed in this paper. Note the abundant explosion craters in the western slopes and south of Mt. Krafla. In the upper right inlet, black dots are volcanos and green strips represent fissure swarms. Coordinates are UTM WGS84 in km. (Modified from [9]).

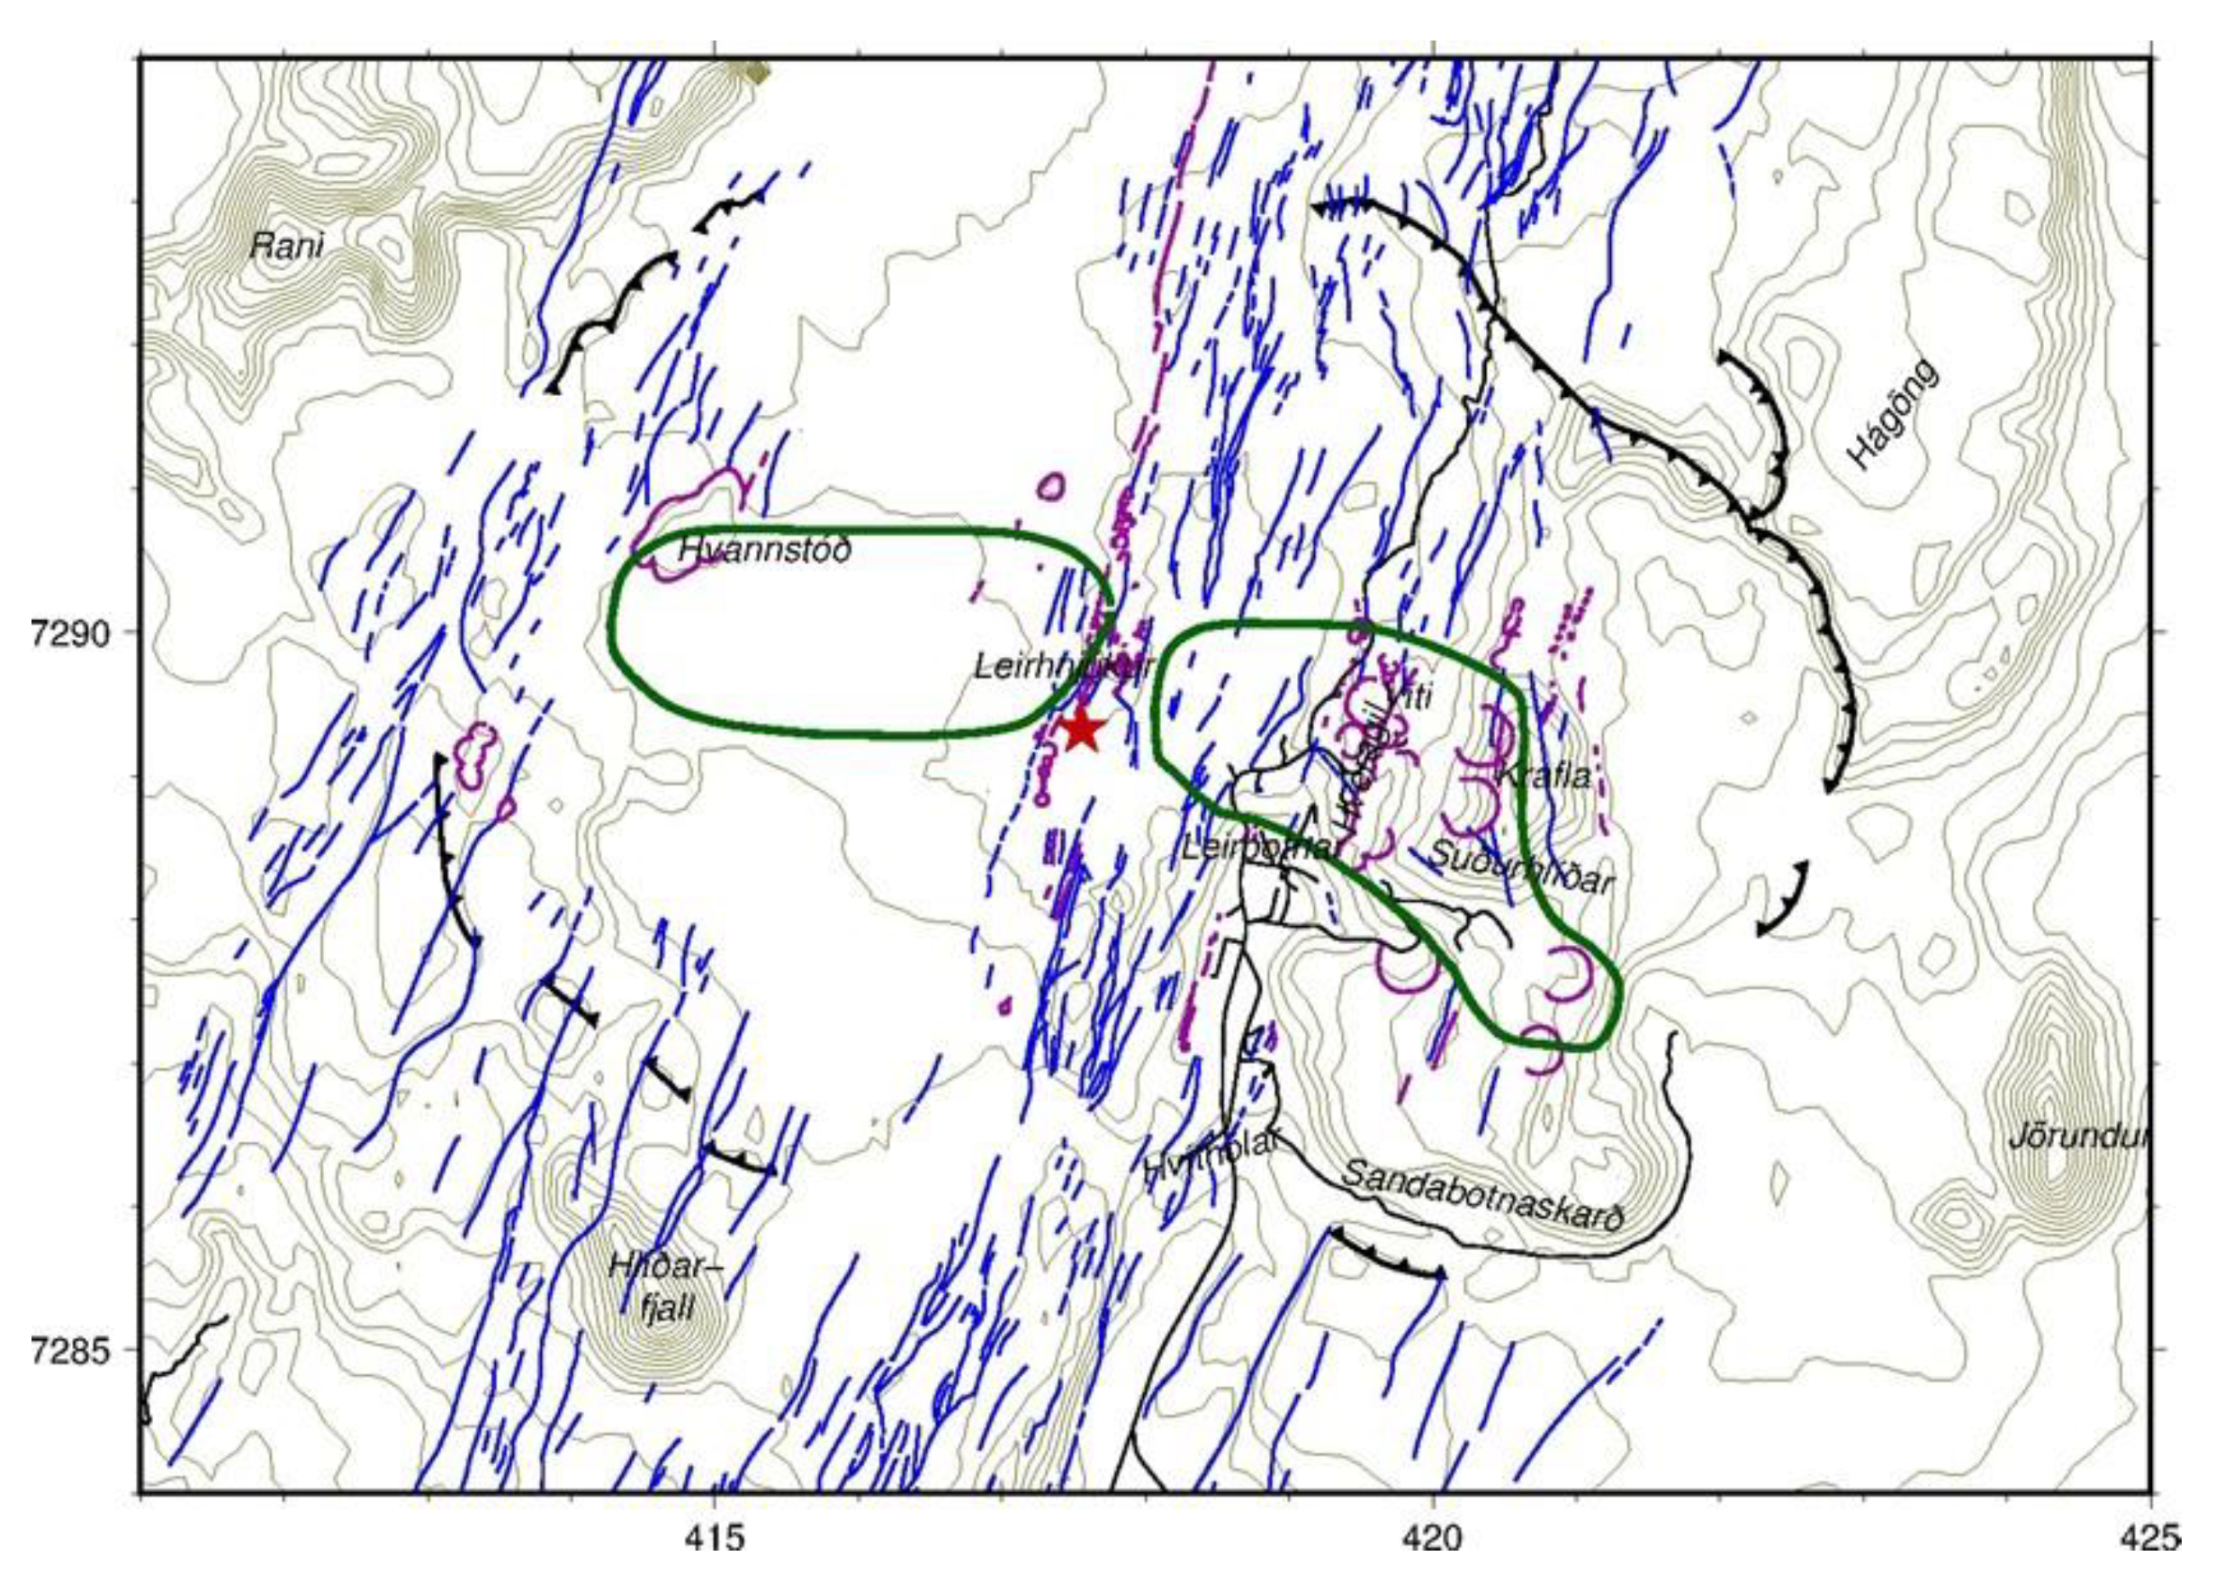
Figure 4.
Different parts of the fissure swarm active at different times. Blue lines are faults and fissures, yellow lines show the eastern- and westernmost faults and fissures activated in the Krafla Fires and NW–SE fault south of Mnt. Krafla that moved in the Krafla Fires. The purple line marks the Hveragil gulley. Orange lines mark eruptive craters and fissures. Coordinates are UTM, WGS84, zone 28 in km.

Figure 5.
Different crustal spreading directions south and north of the Krafla caldera leading to an opening component in the eastern part. The inlet bottom right shows how spreading by, d, leads to opening component, c, in the east. Blue lines represent faults and fissures and purple lines eruptive fissures and craters. Coordinates are UTM WGS84 zone 28 in km.

Figure 6.
The location of S-wave “shadows” observed during the Krafla Fires (green). The red star shows approximate centre of uplift and subsidence [18]. Blue lines are faults and fissures and purple lines are craters and eruptive fissures. Coordinates are UTM, WGS84, zone 28 in km.
Figure 6.
The location of S-wave “shadows” observed during the Krafla Fires (green). The red star shows approximate centre of uplift and subsidence [18]. Blue lines are faults and fissures and purple lines are craters and eruptive fissures. Coordinates are UTM, WGS84, zone 28 in km.

Figure 7.
A de-trended residual Bouguer gravity map (mGals) of Krafla volcano. The visible 110 ka caldera rim is shown with heavy black hatched lines. An inferred buried inner caldera rim is shown with lighter black hatched lines, an inferred lower density transverse structure is shown with grey lines and a clear density boundary to the north is shown as grey broken line. The location of the lithological section in Figure 8 is shown by straight black line (black stars are wells on the section). Blue and green lines show faults and fissures, and craters and eruptive fissures and explosion craters are shown with yellow lines. Coordinates are UTM, WGS84, zone 28 in km.

Figure 8.
A lithological cross-section based on drilled wells on a N–S trending profile in Krafla [11]. The location of the profile is shown in Figure 7.

Figure 9.
Resistivity at 200 m a.sl. (about 300 m depth) based on 1D inversion of TEM soundings. Areas where higher resistivity is observed below low resistivity are shown as red gridded (black dots are TEM soundings (reproduced from [30])). The thick black hachured lines show the 110 ka caldera. Thinner black hachured lines show buried inner caldera and grey lines mark a buried transverse structure inferred from gravity. Coordinates are UTM WGS84 zone 28 in km.

Figure 10.
A resistivity model for Krafla from 3D inversion of MT data. Left: resistivity map at 1250 m bl. sl. The two calderas are shown as black hatched lines, purple lines mark the S-wave shadows, grey dots are earthquake epicentres and blue lines are faults and fissures. The location of the well IDDP-1 is shown as a black star. Right: 3D view from the west. The white surface shows the upper boundary of the western S-wave shadow at 3 km depth (reproduced from [31]). Coordinates are UTM WGS84 zone 28 in km.

Figure 11.
Earthquakes located in Krafla from November 2015 to November 2016. The map also shows the location of reinjection wells (K-26 and IDDP-1) and the transverse gravity low (grey lines) (modified from [32]).
Figure 11.
Earthquakes located in Krafla from November 2015 to November 2016. The map also shows the location of reinjection wells (K-26 and IDDP-1) and the transverse gravity low (grey lines) (modified from [32]).

Figure 12.
P-wave velocity (km/s) at 0.5 km bl.sl. (left) and at 2 km bl.sl. (right) according to recent seismic tomography (reproduced from [34]). Black hatched lines show the two calderas, grey lines mark the low-density transverse structure, blue lines show faults and fissures and the purple lines mark the S-wave shadows. Coordinates are UTM WGS84 zone 28 in km.

Figure 13.
Drilled wells in Krafla (red dot on the little inlet map to the right) and the three main production fields (right) with different thermal character. The fields are: Vtísmór and Leribotnar (blue frame), southern and western slopes of Mt. Krafla (red frame) and Hvíthólar (purple frame). To the left are shown characteristic temperature profiles in wells in each production area and a well drilled in the fissure swarm west of Hvíthólar. For well KS-01, east of Hvíthólar, see text.

Figure 14.
Left; The locations and tracks of wells in Krafla (green lines) and the location of the cross-section to the right (black line). Right; A resistivity cross-section with alteration mineralogy and formation temperature in wells.
Figure 14.
Left; The locations and tracks of wells in Krafla (green lines) and the location of the cross-section to the right (black line). Right; A resistivity cross-section with alteration mineralogy and formation temperature in wells.

Figure 15.
Two-dimensional modelling of thermo-hydraulic states of geothermal systems developed after the emplacement of an 800 m wide “dike” intrusion extending up to 2 km below surface into rocks with a temperature gradient of 100 °C/km (the scale of the horizontal and vertical axis is in km). To the left, is the system 5 ka after emplacement into rocks with the permeability 1 mD. The temperature (°C) is shown by black contours and the pressure (bars) by yellow contours. Phase conditions (water/steam) are shown by colours (light blue is pure water and dark red is almost pure steam, (actual scale 10 times the logarithm of water saturation). Mass flow (kg/m2/year) is shown by arrows (scale at the bottom of the figures), blue for water phase and red for steam phase. The graph shows temperature profiles from hypothetical wells at different distances from the centre of the intrusion (related by colour) in the upper-right corners. The thick yellow line marks region of superheated steam and the green line a region with supercritical conditions. To the right, is shown a thermo-hydraulic situation 3 ka after an intrusion is placed in a host rock of permeability 1 mD, underlying a 1 km thick pile (thick grey line) of much higher permeability (50 mD in this case).

Figure 16.
A zoom-in on residual Bouguer gravity in and around the inner caldera. Blue lines show faults and fissures, green lines mark the boundaries of the part of the fissure swarm that was active in the Krafla Fires and an ESE-WNW fault in the southern slopes of Mt. Krafla that moved in the Krafla Fires. Yellow arcs and lines show explosion craters and eruptive fissures. Note, the abundant explosion craters west and south of Mt. Krafla. Grey lines mark the transverse structure and purple lines mark the extent of high-temperature alteration at 200 m a.sl. (from Figure 9). Coordinates are UTM WGS84 zone 28 in km.

Figure 17.
The beginning of a flow test of IDDP-1 (photo G. Ó. Friðleifsson).

© 2020 by the author. Licensee MDPI, Basel, Switzerland. This article is an open access article distributed under the terms and conditions of the Creative Commons Attribution (CC BY) license (http://creativecommons.org/licenses/by/4.0/).
Share and Cite
MDPI and ACS Style
Árnason, K. New Conceptual Model for the Magma-Hydrothermal-Tectonic System of Krafla, NE Iceland. Geosciences 2020, 10, 34. https://doi.org/10.3390/geosciences10010034
AMA Style
Árnason K. New Conceptual Model for the Magma-Hydrothermal-Tectonic System of Krafla, NE Iceland. Geosciences. 2020; 10(1):34. https://doi.org/10.3390/geosciences10010034
Chicago/Turabian StyleÁrnason, Knútur. 2020. "New Conceptual Model for the Magma-Hydrothermal-Tectonic System of Krafla, NE Iceland" Geosciences 10, no. 1: 34. https://doi.org/10.3390/geosciences10010034
Note that from the first issue of 2016, this journal uses article numbers instead of page numbers. See further details here.