Article

A New Landslide Inventory for the Armenian Lesser Caucasus: Slope Failure Morphologies and Seismotectonic Influences on Large Landslides

1
Renard Centre of Marine Geology, Department of Geology, Ghent University, 9000 Gent, Belgium
2
Institute of Geological Sciences, National Academy of Sciences, 0019 Yerevan, Armenia
3
Department of Geology, Liège University, 4000 Liège, Belgium
*
Author to whom correspondence should be addressed.
Geosciences 2020, 10(3), 111; https://doi.org/10.3390/geosciences10030111
Submission received: 7 February 2020 / Revised: 13 March 2020 / Accepted: 13 March 2020 / Published: 20 March 2020

Abstract

:
Landslide hazard analyses in Armenia require consideration of the seismotectonic context of the Lesser Caucasus. As it is located near the center of the Arab-Eurasian collision, the Lesser Caucasus is characterized by its complex geology, dense fault network and mountainous relief; it is marked by recent volcanic and seismic activity largely influencing slope stability at different scales. We therefore sought to identify all major landslides in the Armenian Lesser Caucasus and to understand the environmental factors contributing to regional landslide susceptibility. We performed spatial and size-frequency analyses using two landslide catalogues as inputs: “Georisk”, provided by the Georisk Scientific Research Company, and “Matossian”, herein. Our spatial analyses show that landslide susceptibility depends on many factors according to the area considered: near faults, a tectonic influence on slope stability is clearly observable, whereas high concentrations of landslides in northern mountain regions, marked by a wetter climate and far from known active faults, show that climatic factors also strongly contribute to slope-failure potential. The influence of volcanoes and volcanic deposits on the development of mass movements is unclear and requires further analysis. The aforementioned inventories do not include any records of volcanic flank collapses, although we expect at least one case in the eastern Lesser Caucasus.

1. Introduction

More than 3500 landslides are known to have occurred across Armenia [1]. Those landslides and their potential impact zones occupy about 4% of the territory of Armenia [2], and more than 10% of all populated places are within or near landslide-prone areas [3]. Landslides are observed in all regions characterized by high and steep slopes; thus, they are less frequent in the western and central parts of Armenia that are characterized by plateau- or basin-like morphologies.
Large-scale rockslides and landslides are frequent due to the high seismicity in Armenia. For example, an earthquake in 1679 triggered several rockslides that formed dams and associated small water bodies, and a landslide dam was formed on Ararat Volcano during an earthquake in 1840 (see Section 2.1). Other earthquake-triggered rockslides in Armenia have created permanent dams and small water bodies that are now used as reservoirs for irrigation [4].
A similar strong dependency of massive rock/slope failures on regional earthquake activity was observed by Strom and Abdrakhmatov [5] and Havenith et al. [6], among others, in Central Asian mountain ranges, particularly the Tien Shan, which formed in a continental collision context. The Lesser Caucasus is also located near the center of the collision between two continental plates: the Arabian and Eurasian plates (see map in Figure 1, by [7,8]). Due to this collision, the Lesser Caucasus is characterized by its complex geology, dense fault network, and mountainous relief (especially in the northeastern part); it is also marked by recent volcanic and seismic activity [9,10,11,12]. The strong correlation of landslides with seismicity in Armenia, and particularly the Lesser Caucasus, therefore emphasizes that landslide hazards in Armenia must be analyzed with consideration for the general seismotectonic context of the Lesser Caucasus.
Although sedimentary, plutonic, volcanic, and metamorphic rocks and deposits of Proterozoic to Quaternary ages are found throughout Armenia, more than 80% of Armenia is covered by volcanic rocks or deposits [13]. Major active regional faults include the North Anatolian Fault (NAF), East Anatolian Fault (EAF), Northeast Anatolian Fault (NEAF), and Zagros Fault (ZF) [14]. These faults and the North Armenian wedge (dashed square in Figure 1) form a northward-bending structural arc mainly comprising active strike–slip reverse faults.
In this paper, we review factors contributing to landslide hazards in the Armenian part of the Lesser Caucasus. We analyzed landslide occurrence based on the presence of faults and volcanic structures and with respect to the local morphology and general climatic context. Most of our analysis is based on a new catalogue of 1036 medium- to large-sized mass movements created by the authors (henceforth the “Matossian” inventory). We also compared our inventory with the more extensive (2257 inputs) “Georisk” catalogue [15] that contains more mapped medium-sized landslides. The landslide distributions recorded in the two catalogues are presented in Figure 2 with respect to rivers, lakes, faults, historical earthquakes, and volcanoes (Figure 2a) and populated areas (Figure 2b). The landslide maps are overlaid on the annual average precipitation map in the Appendix A (Figure A2). As the basis for our morphological analysis, we used the 28 m resolution SRTM (Shuttle Radar Topographic Mission 2000) Digital Elevation Model (DEM, Figure 2) and the 11 m resolution TanDEM-X (TerraSAR-X add-on for Digital Elevation Measurement, since 2010) model.

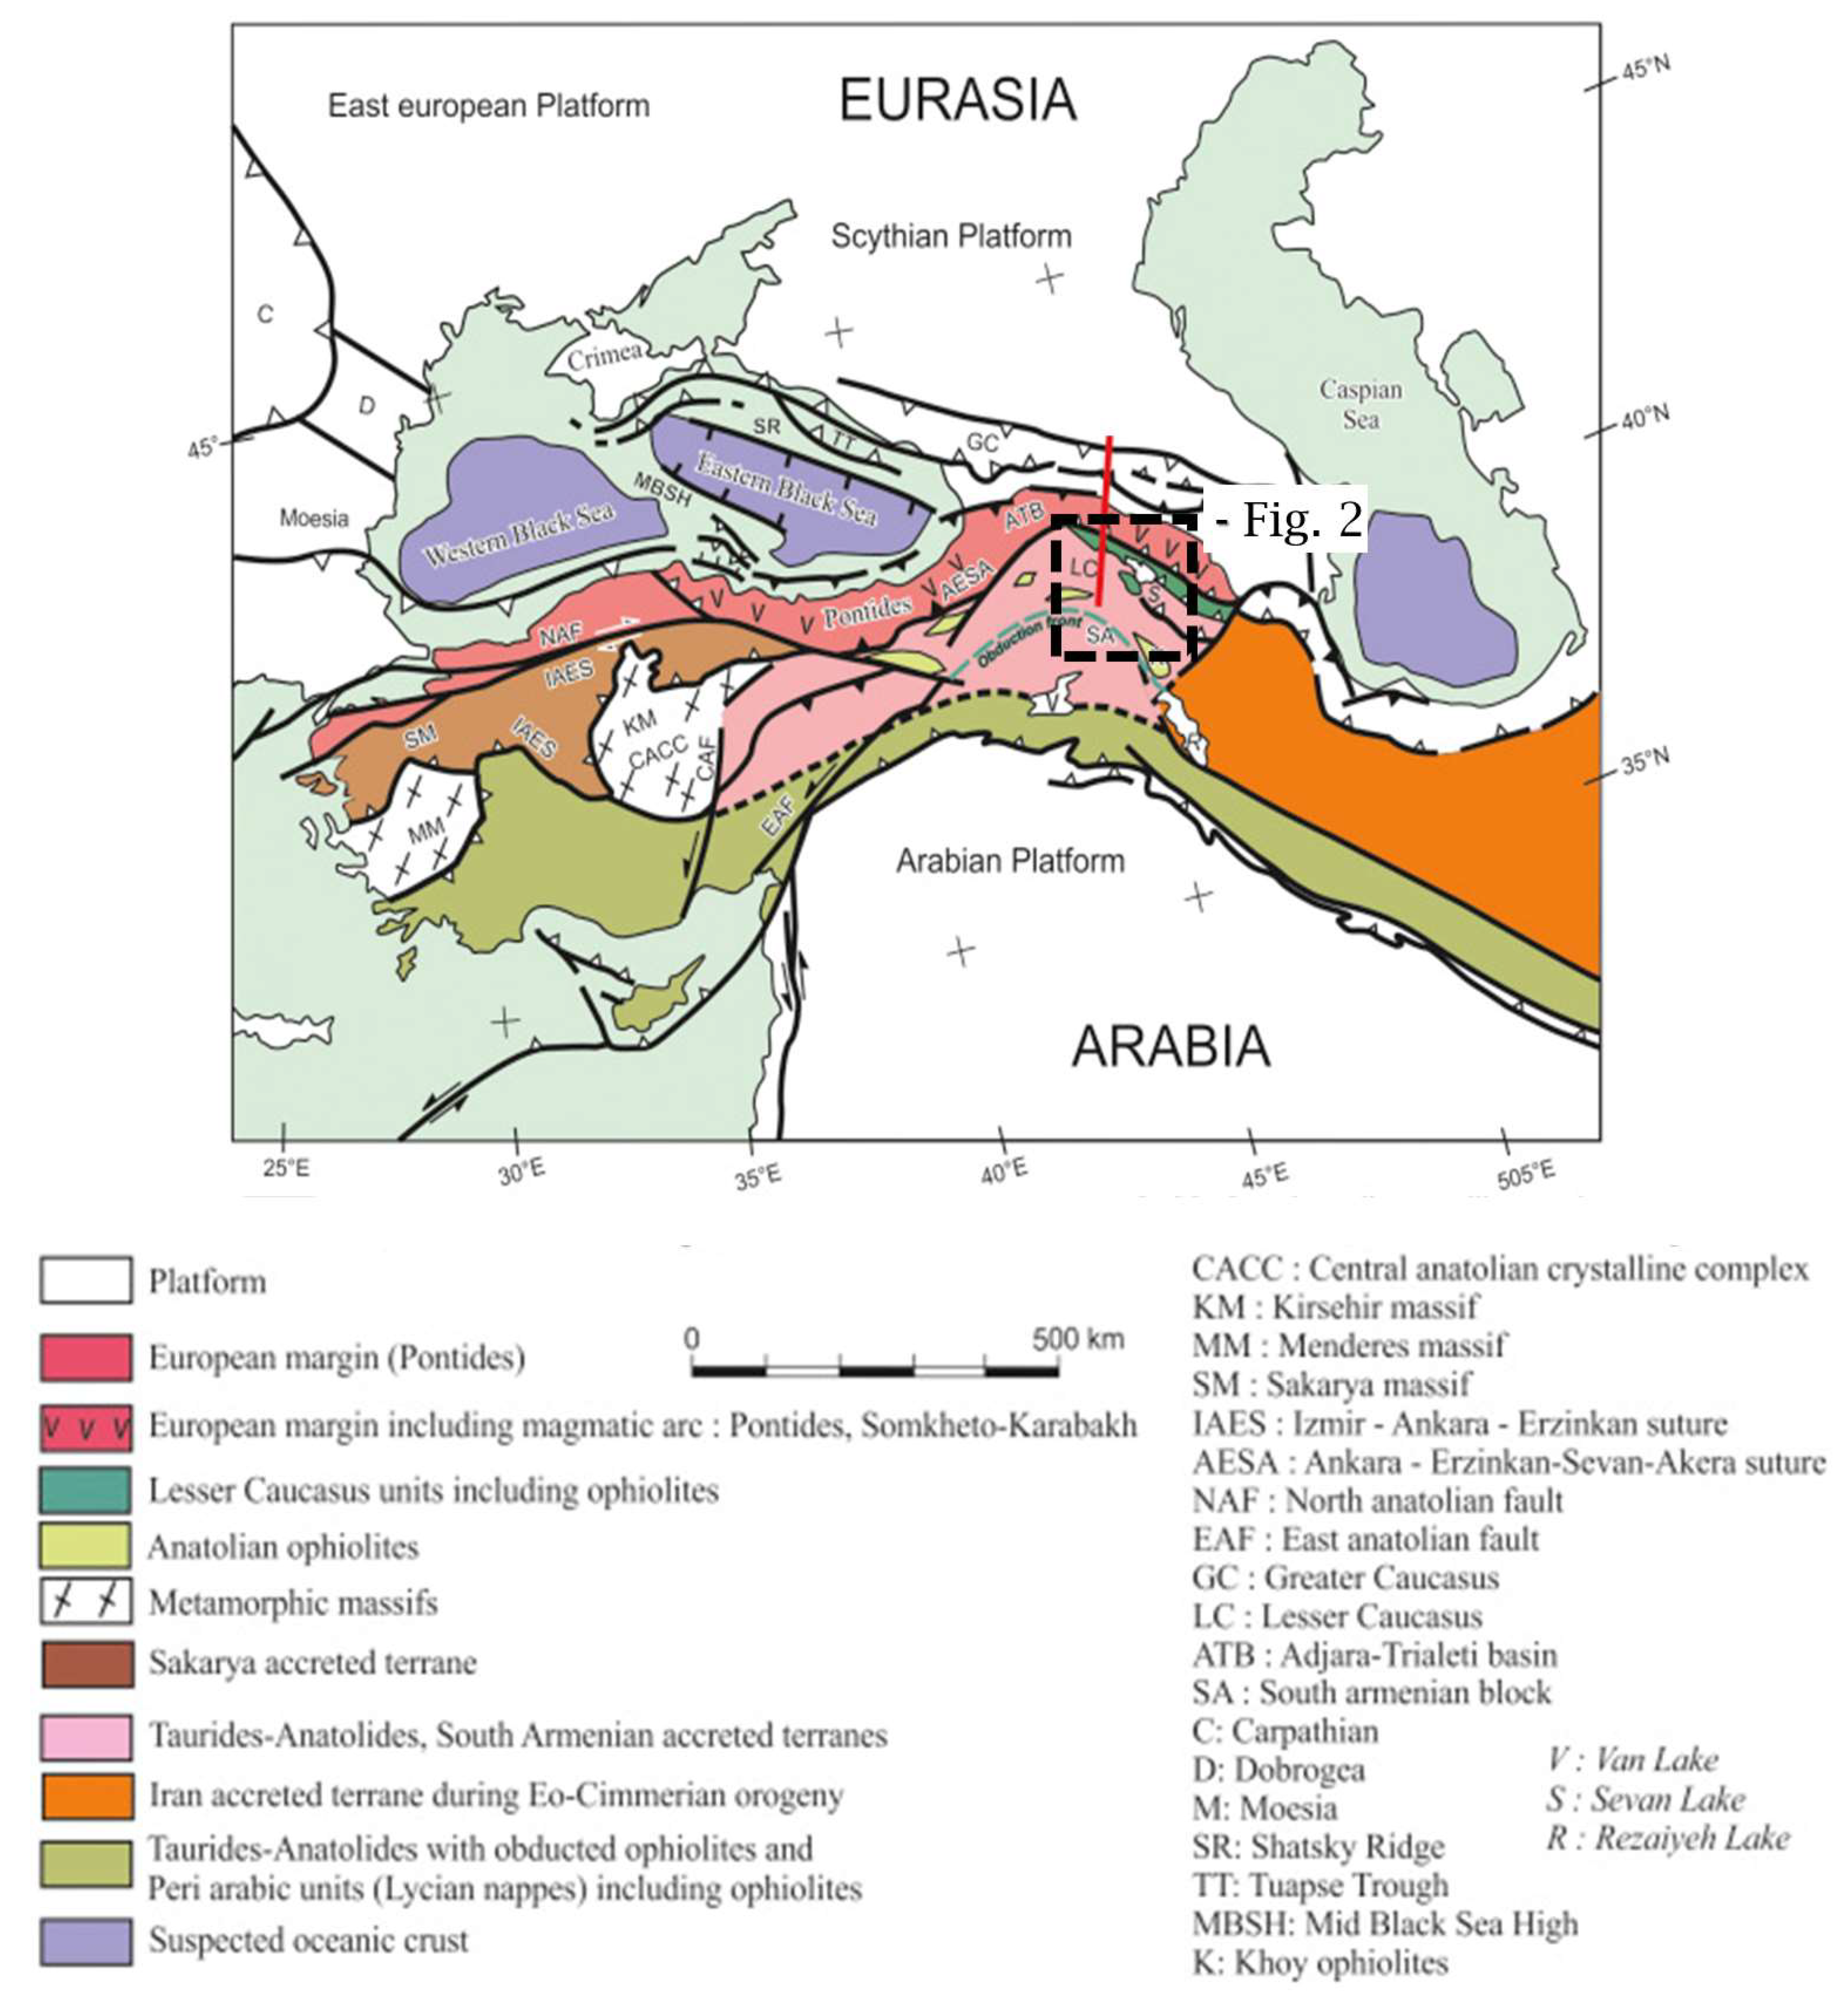
2. Geohazard Context of the Lesser Caucasus

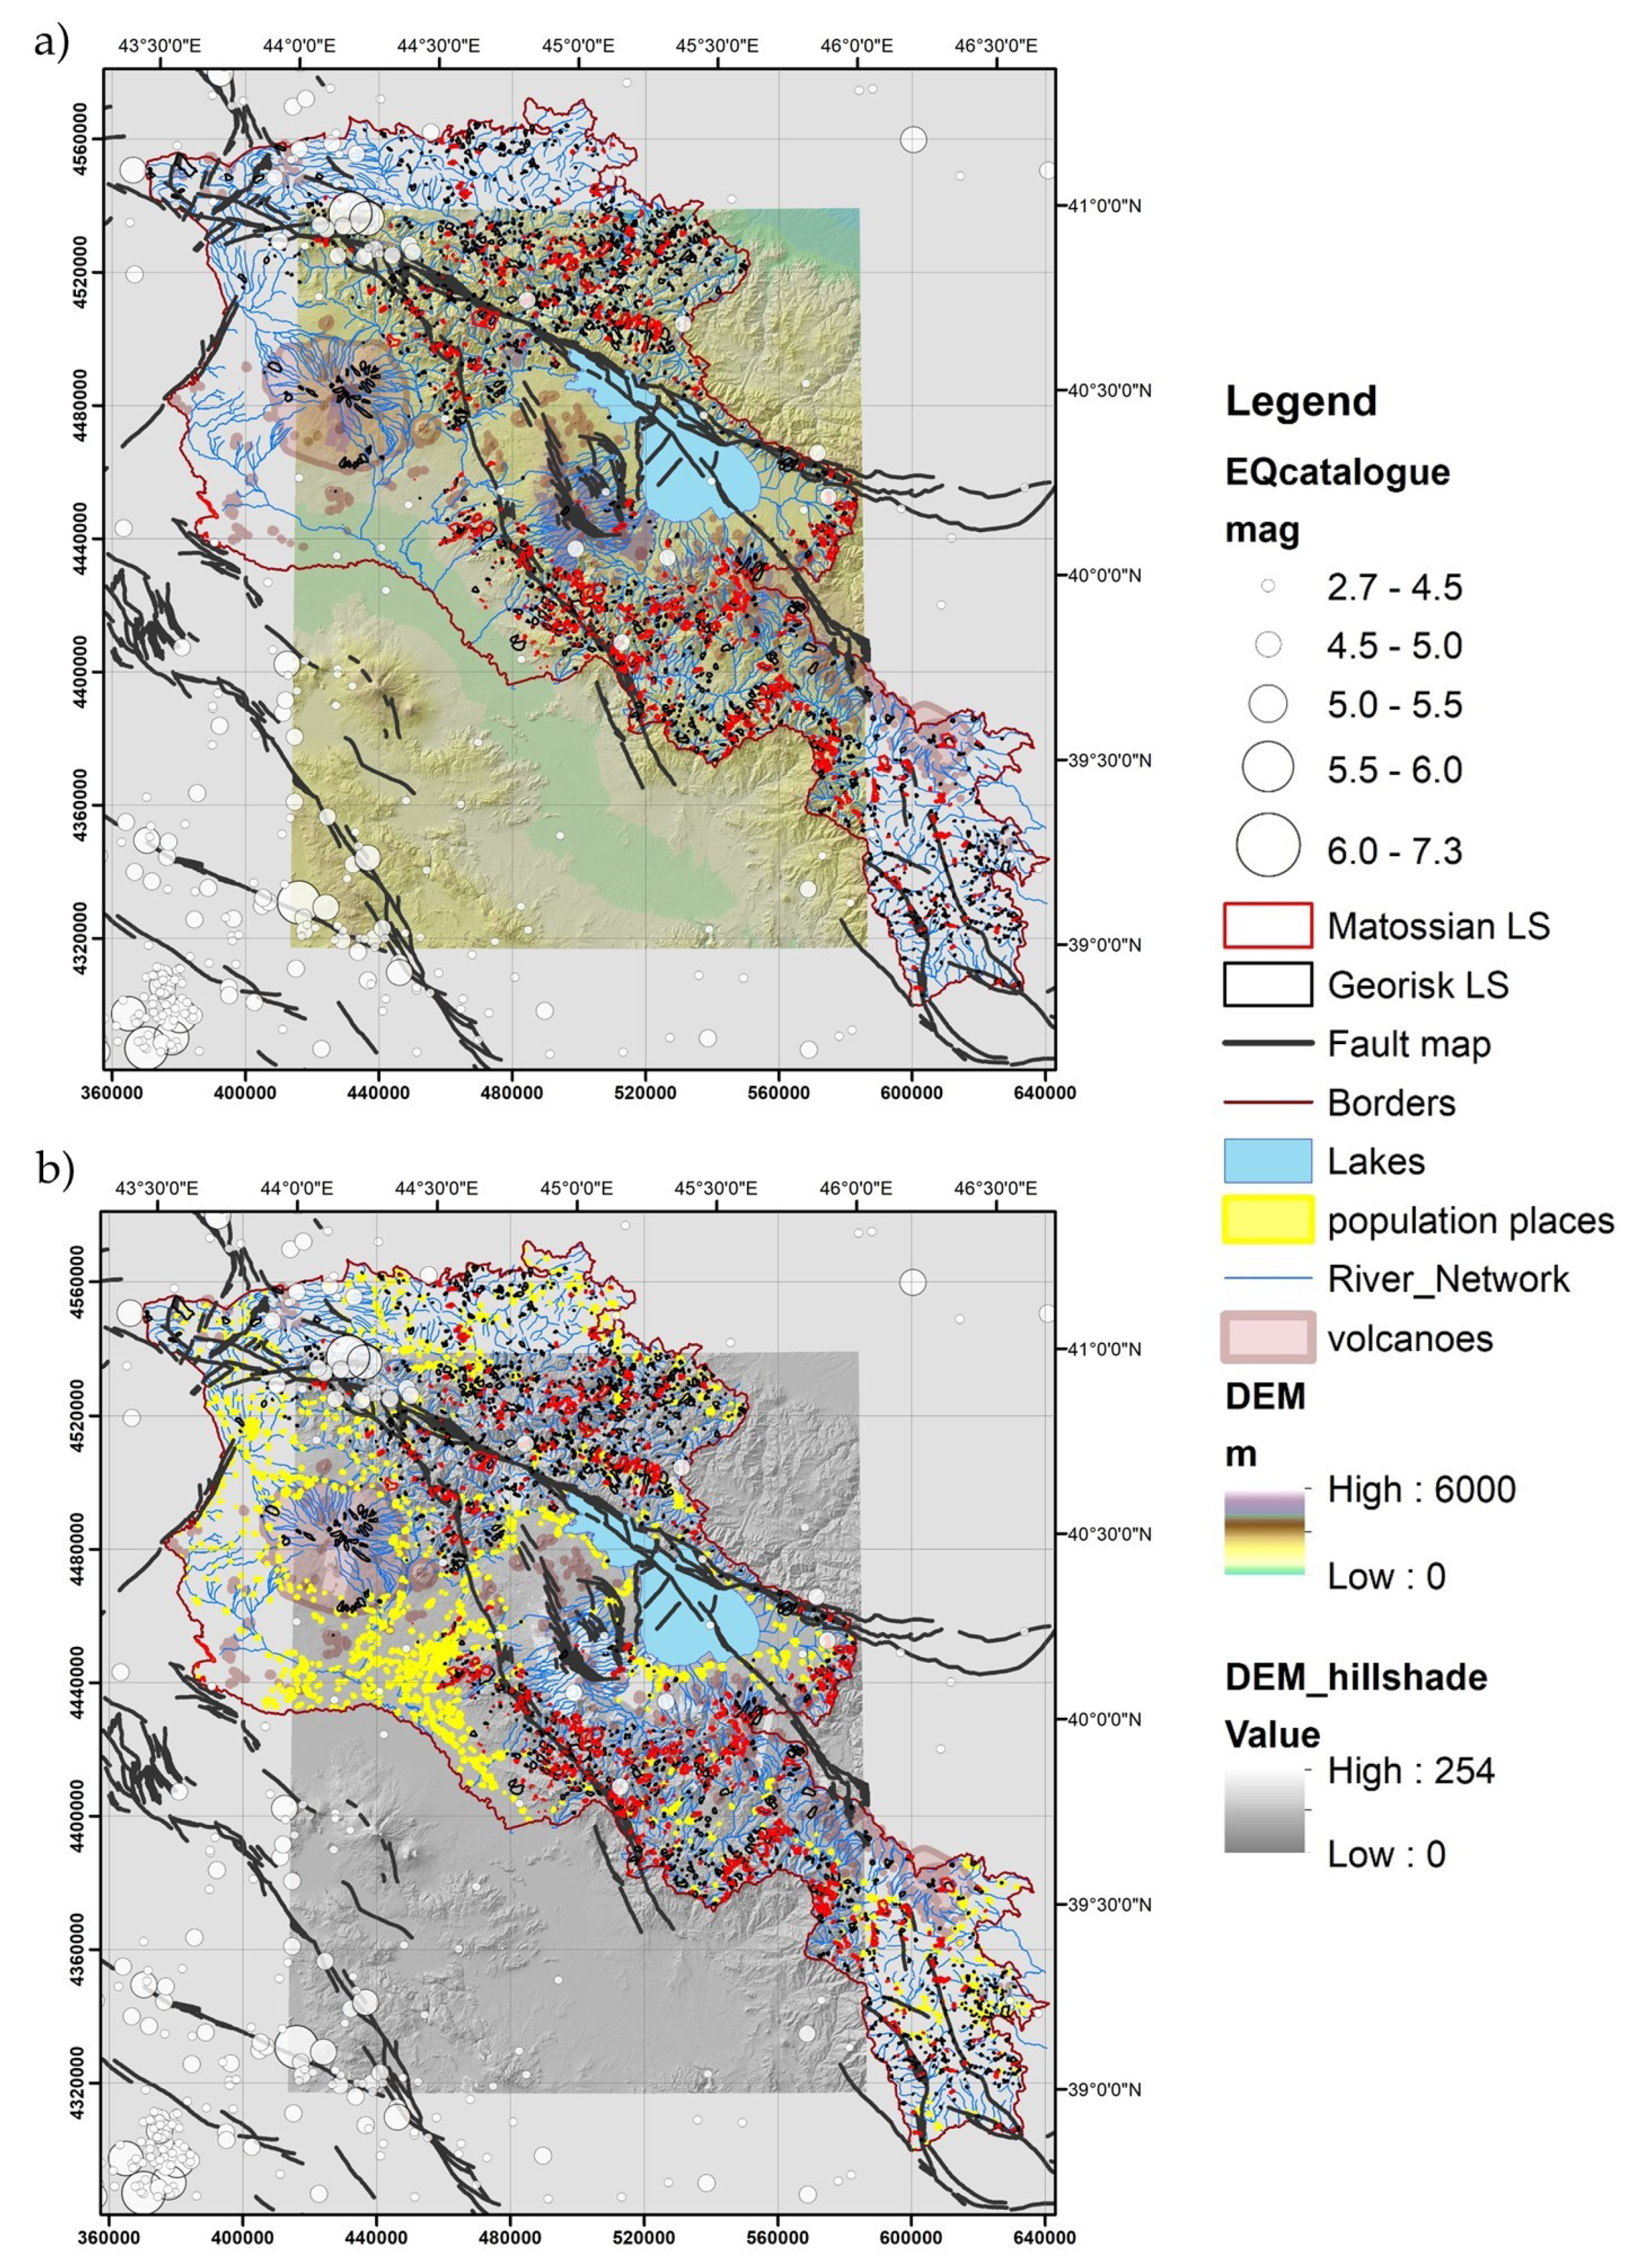
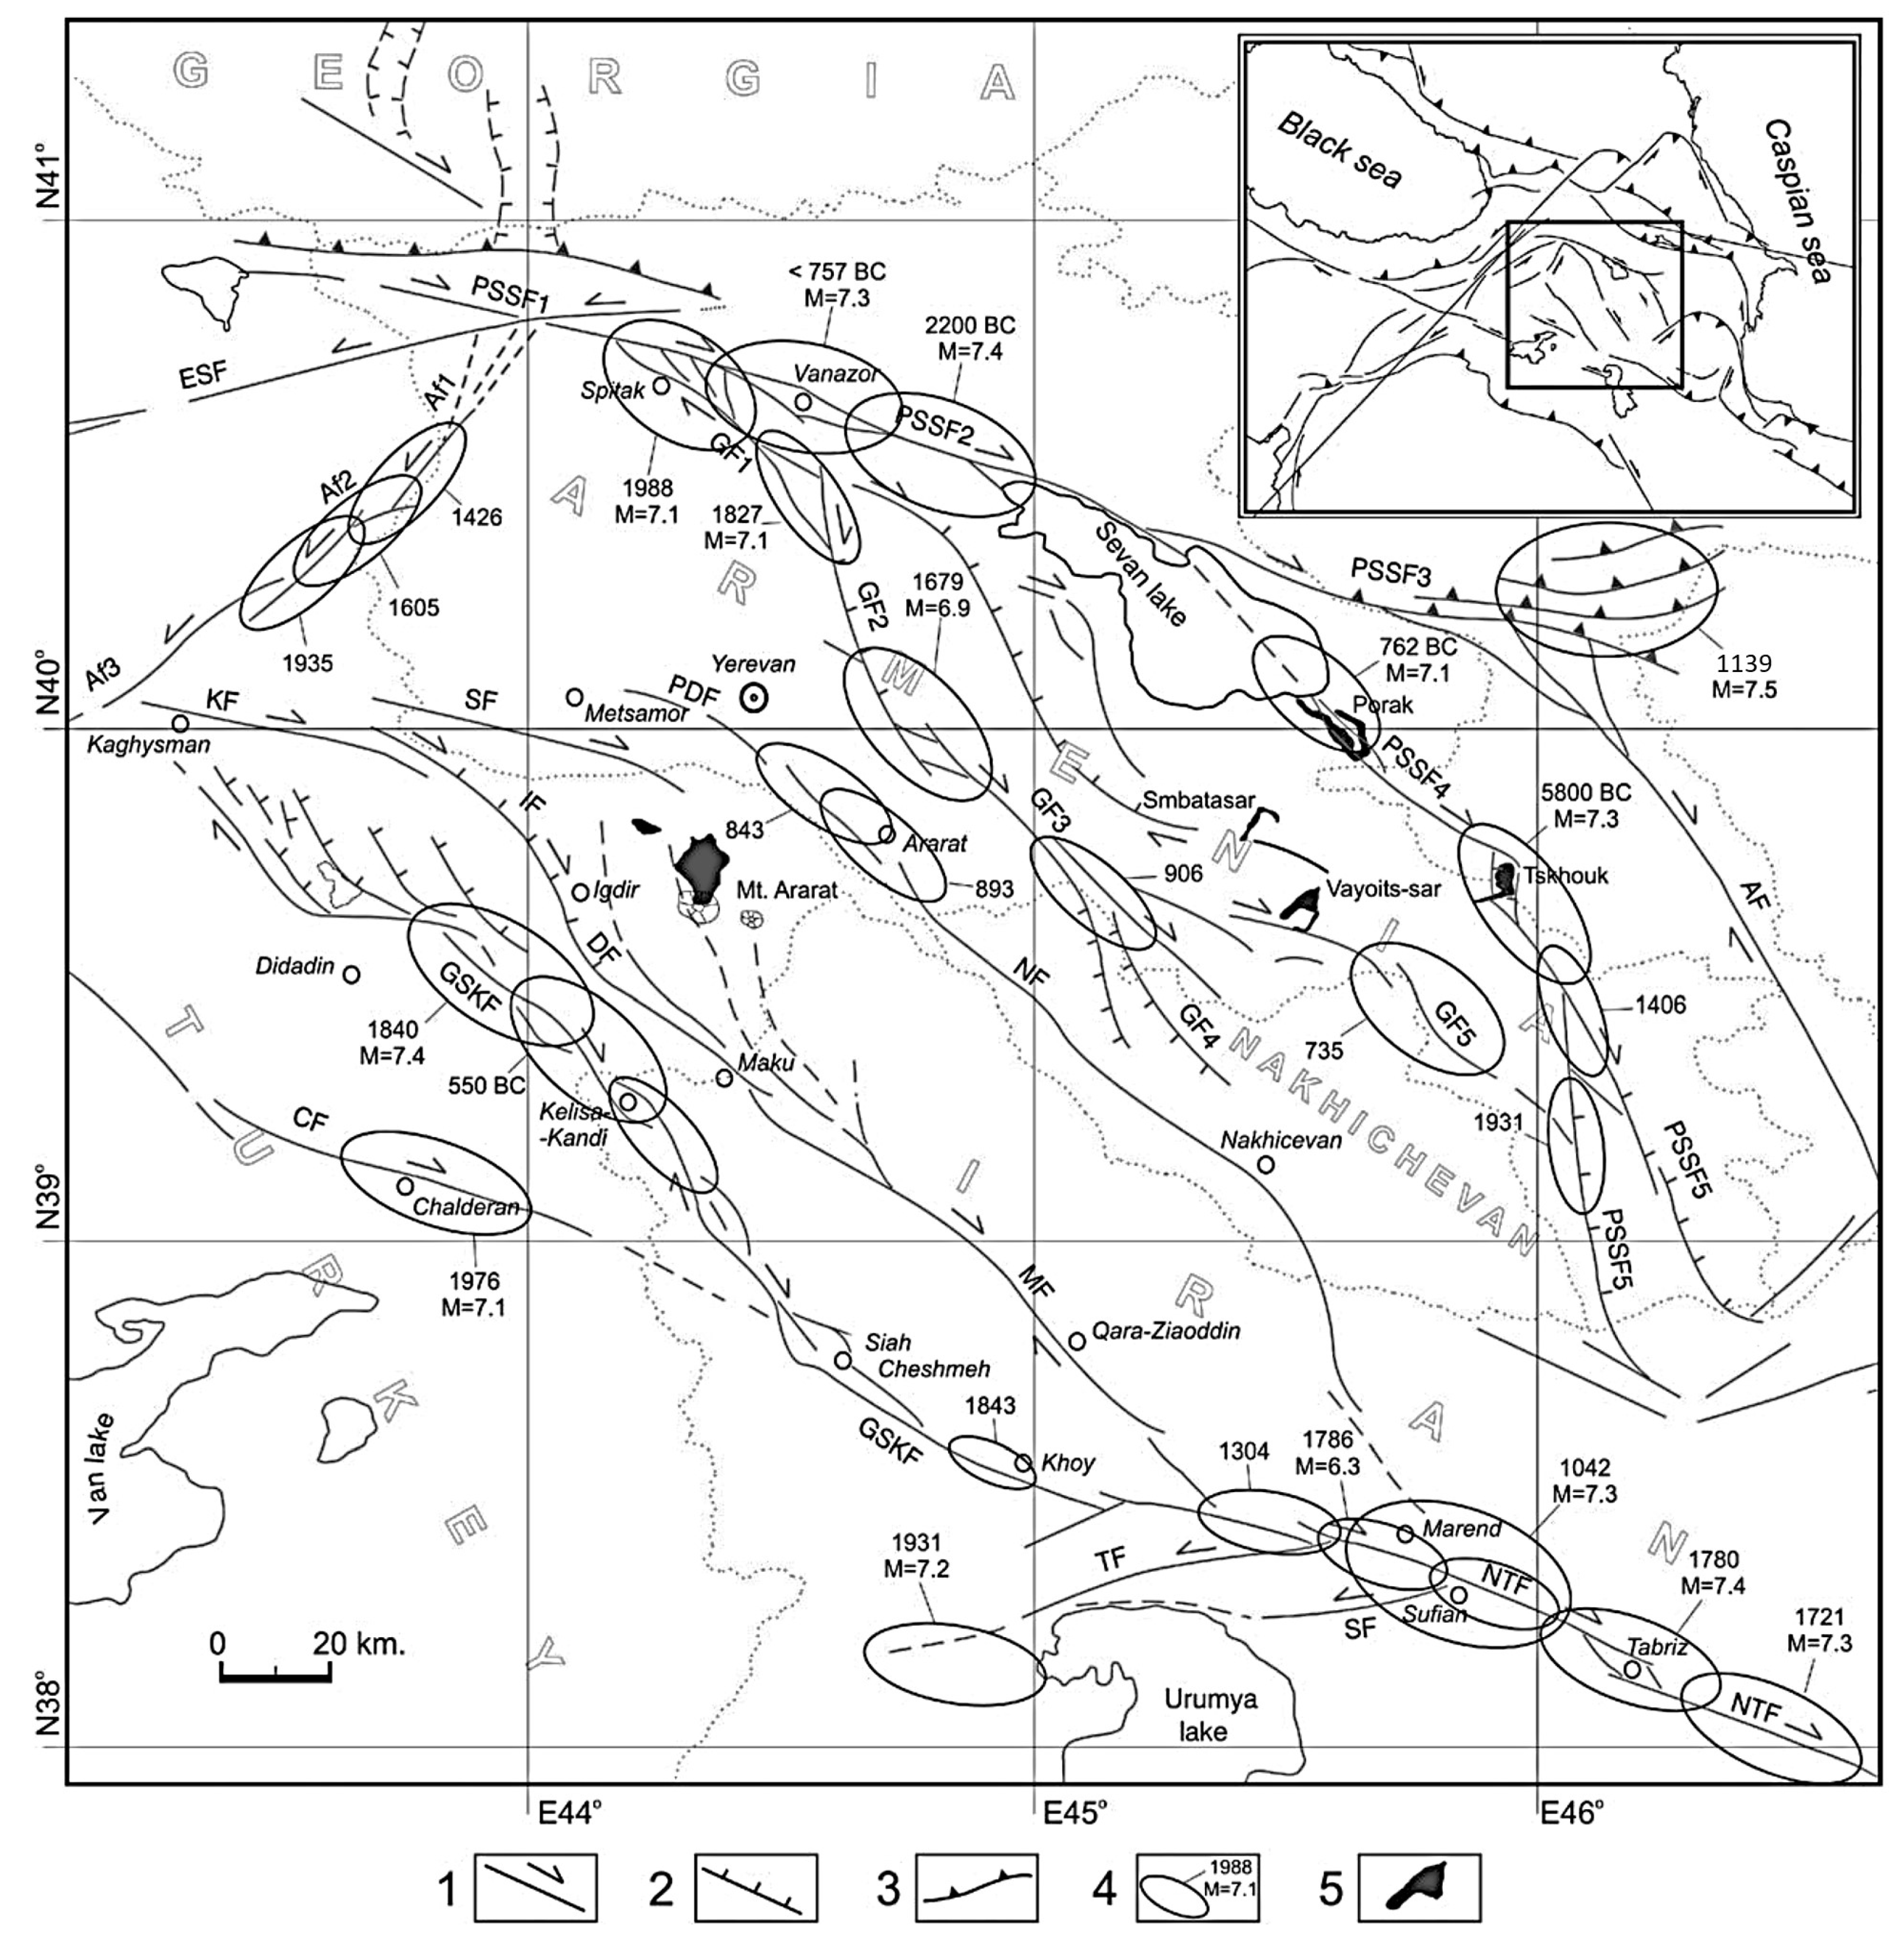
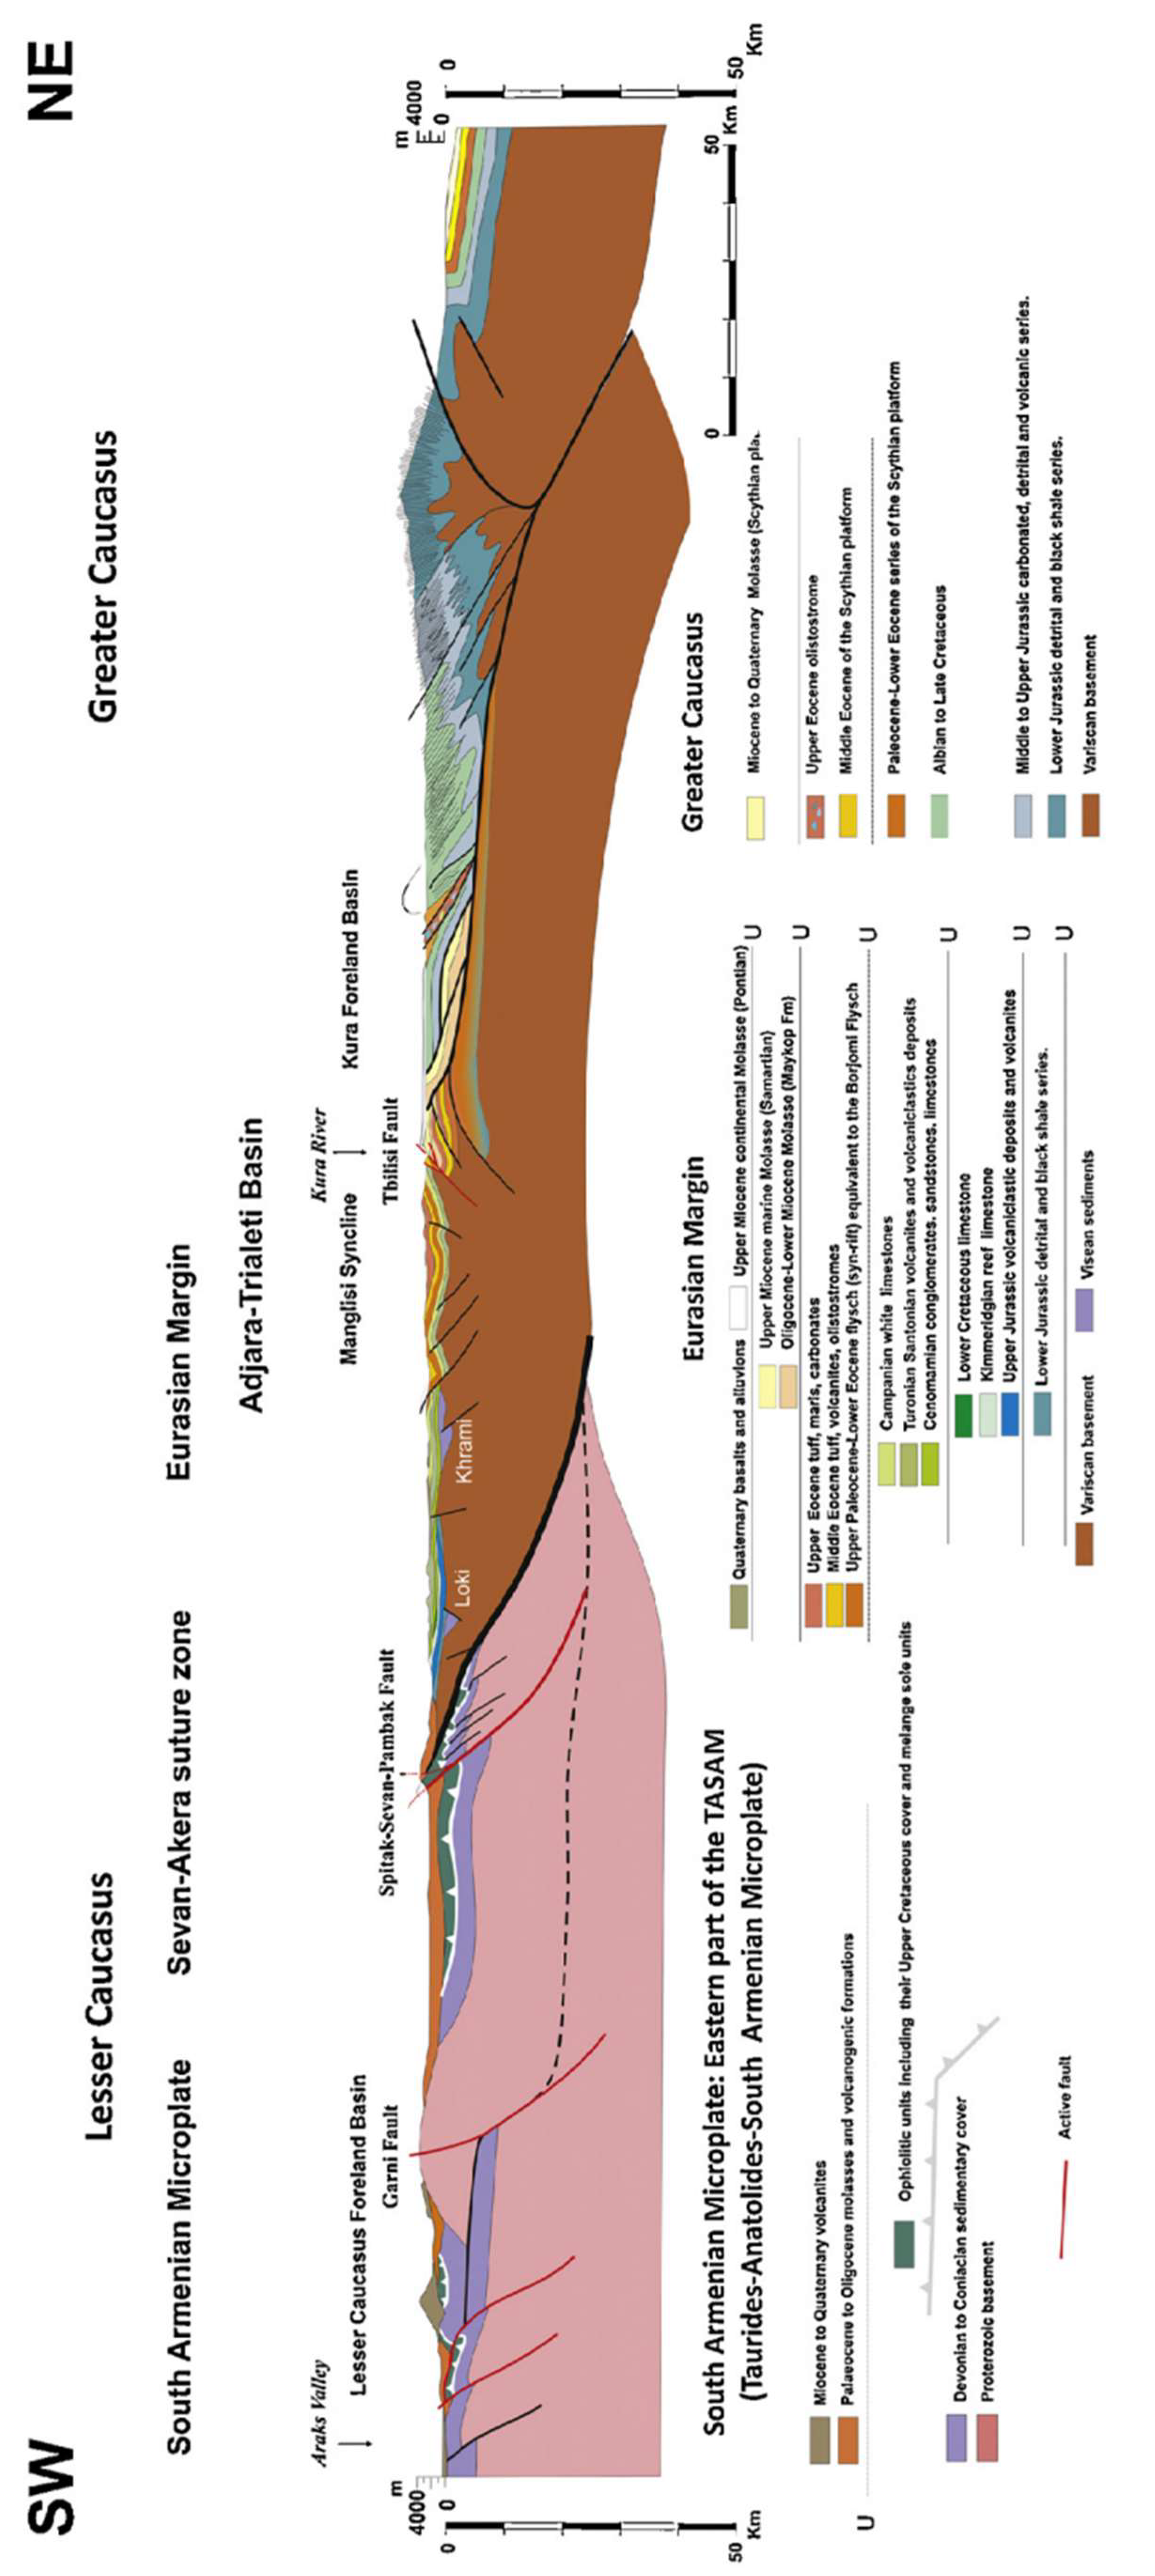
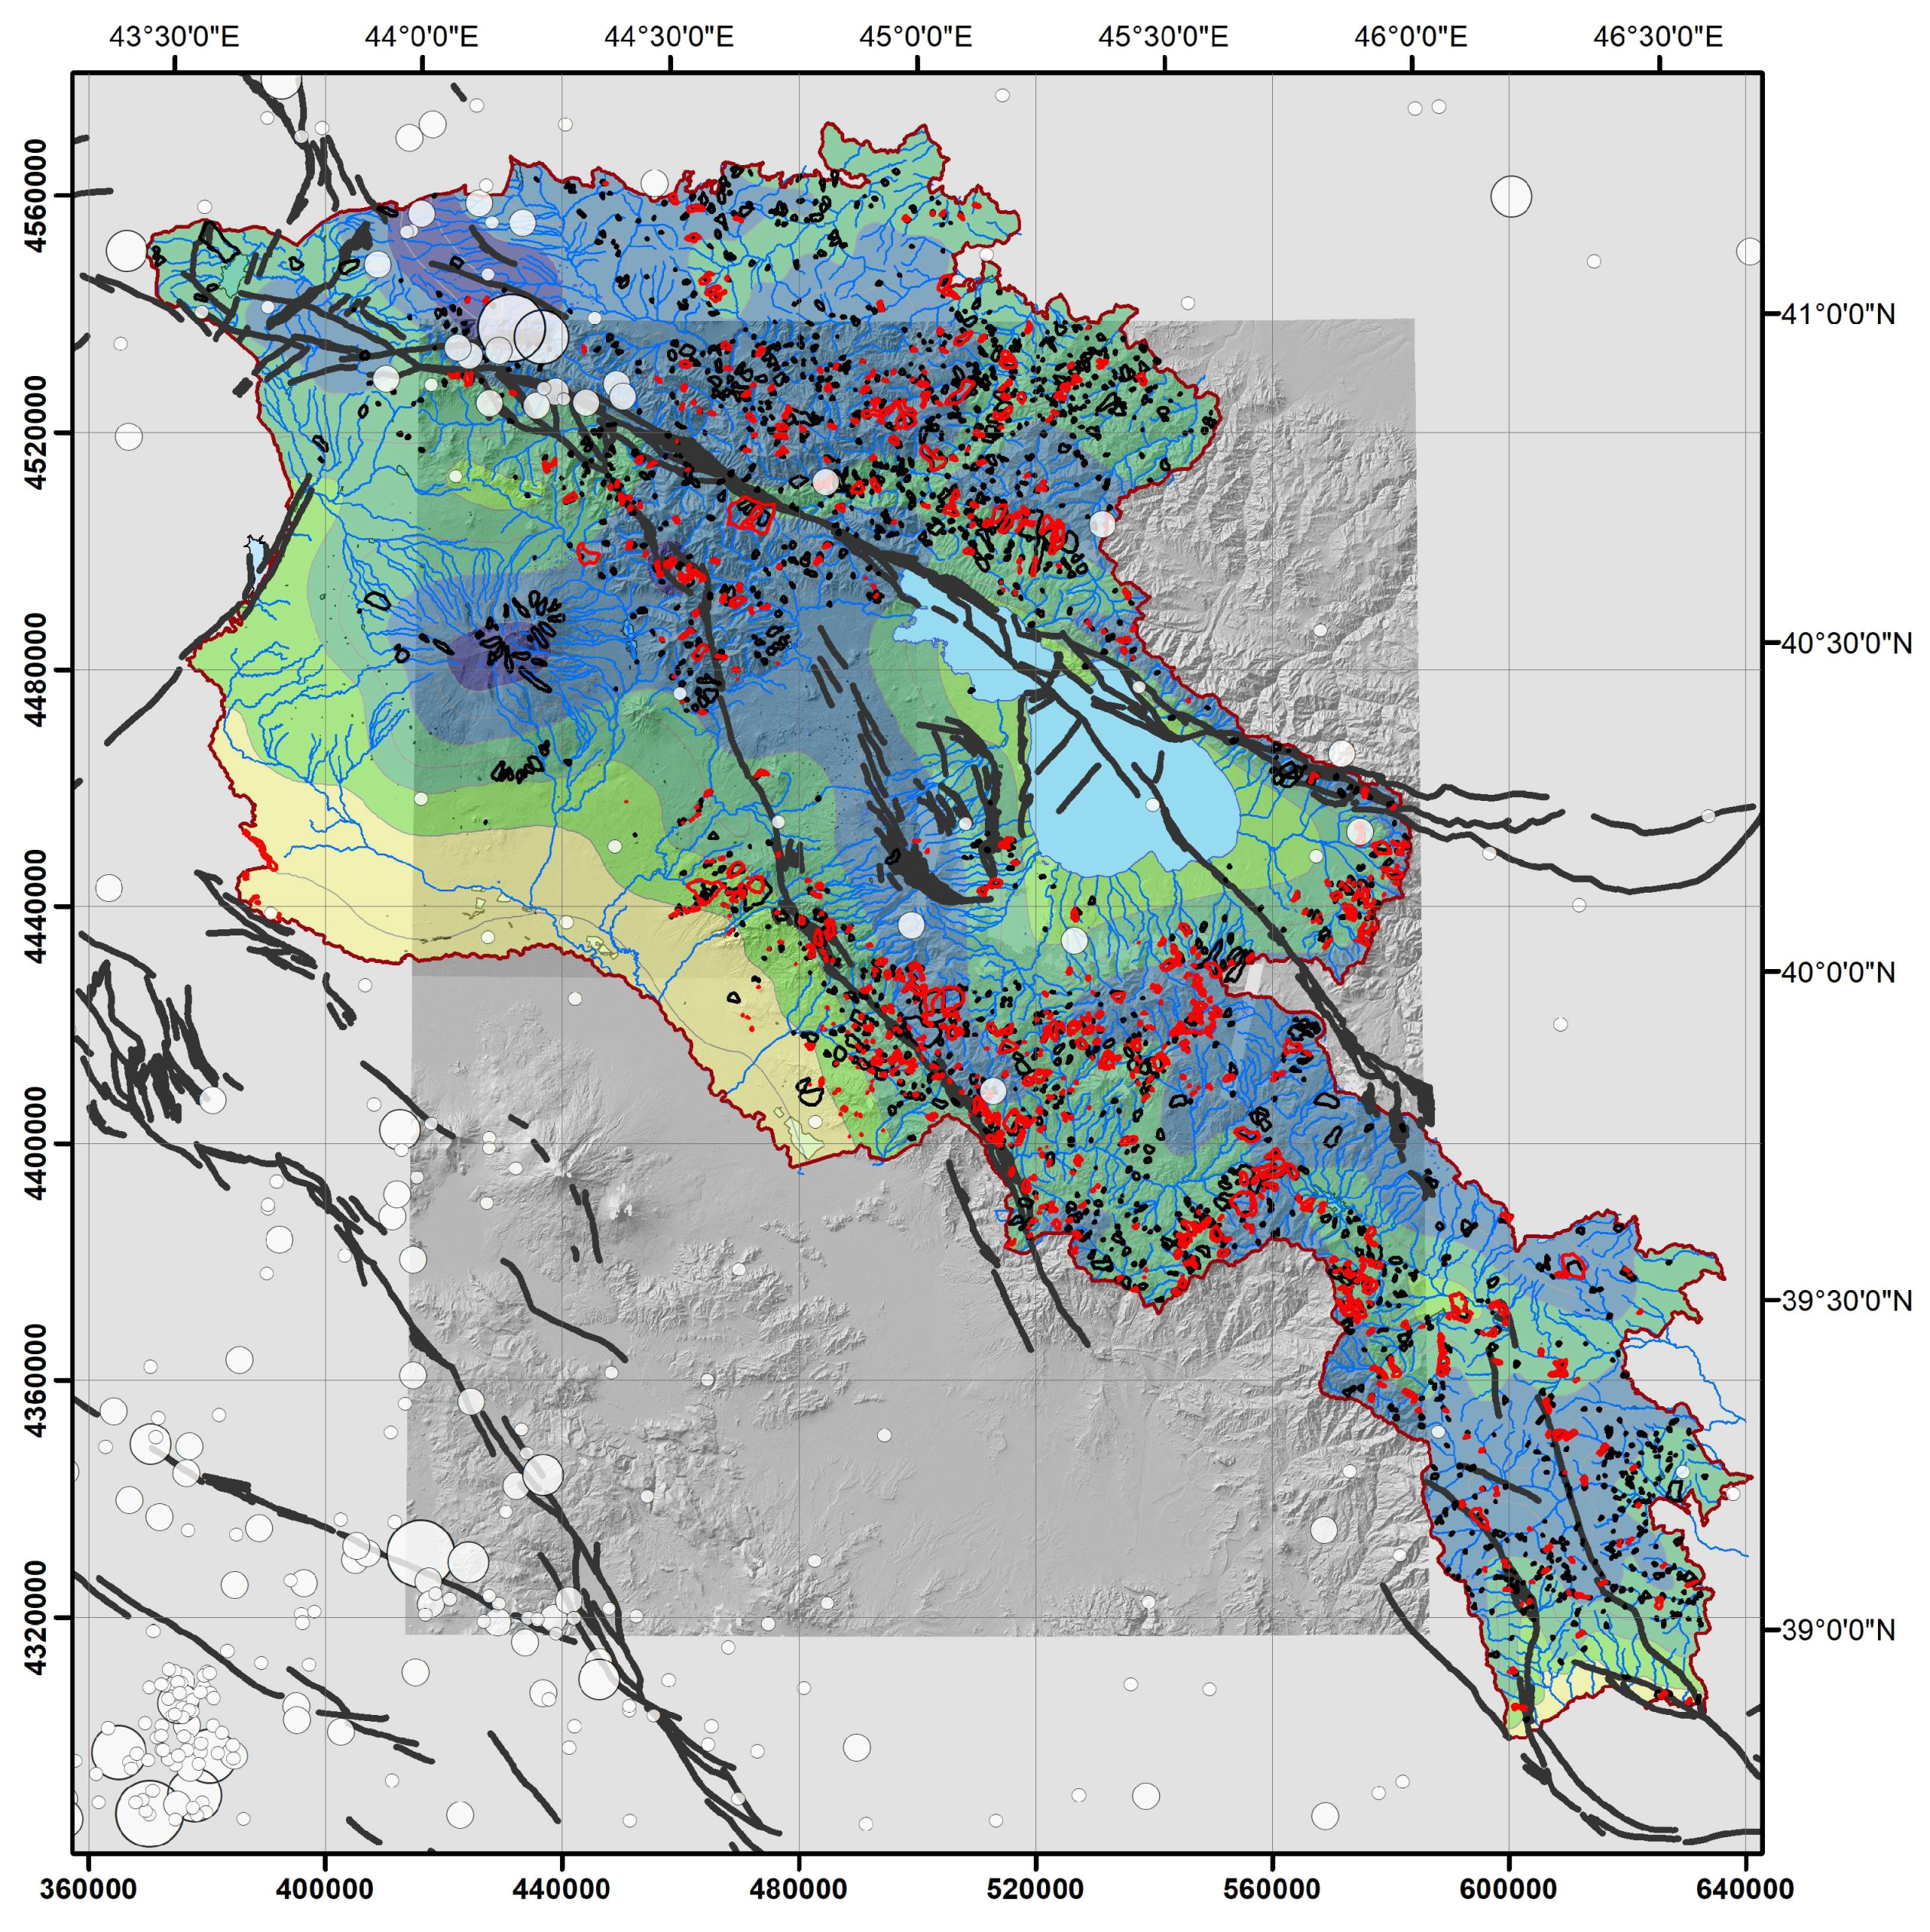
2.1. Seismotectonic Context and Historical Earthquakes

The North Armenian wedge (see detailed structural map [9], Figure 3) comprises two structural arcs: the outer arc includes the Zheltorechensk-Sarighamish Fault (ESF) in the west and the Pambak-Sevan-Syunik Fault (PSSF) in the east, whereas the inner arc comprises the Akhourian Fault (Af) in the west and the Garni Fault (GF) in the east. The faults are of sinistral strike–slip nature in the western branch and dextral strike–slip nature in the eastern branch [8,10,16]. The PSSF is the longest Armenian fault with a length of 490 km and comprises five segments [9,17]. It has produced several destructive earthquakes, including events in 915 (M 6.0), 1187 (M 6.0), 1407 (M 7.0), 1853 (M 6.0) and 1931 (M 6.5) [9,18,19]. The GF is a 200-km-long dextral strike–slip reverse fault. Other important faults in the area are the blind Yerevan Fault in the southern part of Yerevan (not shown in Figure 3) and the Khor Virap–Sari Pap and Urts-Aghbyur faults, both situated in the southeast of the Ararat depression [20]. The southern part of the northward-bending structural arc comprises faults that extend beyond Armenia (Figure 3), such as the Sardarapat, Nakhichevan, Maku, and Dogubayazit Faults [9].
Earthquakes represent the most important natural hazards in Armenia. The largest historical earthquake on the eastern Mrav segment of the PSSF occurred in 1139 (M 7.5; [9,21,22]), and M ≥ 5.5 earthquakes occur every 30–40 years in Armenia [23]. Several other historical earthquakes are well documented, such as the M 6.5 and 6.7 Dvin earthquakes in 863 and 893, respectively [24], which destroyed the ancient Armenian capital Dvin, the 1679 M 6.9 Garni earthquake [9], one of the most destructive historical earthquakes in Armenia, and the 1840 M 7.4 Ararat earthquake, which occurred on the Gailatu-Siah–Cheshmeh-Khoy Fault [9] and created a 72-km-long surface rupture. The 1840 Ararat earthquake, and possibly an accompanying explosive Bandai-type phreatic eruption at Ararat volcano [25], destabilized the volcano’s summit, producing a large mass movement that destroyed the monastery of St. James and the Akory village and dammed the Arax River [26]. The dam broke a few days later and destroyed other surrounding villages. Liquefaction and subsidence in the Ararat depression and along the Arax River destroyed other villages [25]. The 1988 M 6.9 Spitak earthquake was the most recent very destructive earthquake in Armenia; its epicenter was located near the intersection of the GF and PSSF [9] (Figure 3). The complex surface ruptures during that event reactivated many active fault segments, including a 32-km-long GF segment, a 300-m-long PSSF segment, and a 500-m-long ESF segment [8]. Consequently, a relatively wide area was affected, causing many fatalities and casualties and widespread damage in northern Armenian cities [9].

2.2. Volcanic Activity in the Lesser Caucasus

According to historical and archaeological records, some Armenian volcanoes were active during the Holocene, such as the Porak Group, Smbatassar, Vaiyots-Sar, Tskhouk-Karckar, Aragats, and Ararat (eastern Turkey) volcanoes [25] (Figure 2a and Figure 3). In general, Quaternary volcanism in Armenia is characterized by fissure- and central-vent eruptions [27]. Ararat stratovolcano, near the Armenian border in Turkey (clearly marked near the center of Figure 3), is subdivided into Greater Ararat (summit elevation 5165 m) and Lesser Ararat (summit elevation 3924 m) [25]. Ararat is situated within a 320-km-long and 80-km-wide pull-apart basin [25,28] that formed along active faults in a horsetail splay fault system [27]. The youngest lava flows issued by Ararat are 20,000 years old, and its most recent eruptions were explosive eruptions in 4500–4400 BP and 1840 AD [25,27,29].
Armenia is therefore exposed to volcanic hazards and related secondary gravitational effects. As some volcanoes were active during the Holocene, volcanic hazards have been included in nation-wide natural risk assessments [25].

2.3. Mass Movement Hazards

According to Boynagryan [1], the most favorable conditions for landslide development in Armenia are convex, steep, and high slopes, the presence of weathered rocks or loose deposits (often of volcanic origin), groundwater level, active faults, the occurrence of strong earthquakes, and anthropogenic factors such as irrigation, construction, and deforestation. They also temporally grouped Armenian landslides into those that formed between the lower Pliocene and upper Quaternary (considered to be ancient, giant earthquake-triggered mass movements 5–8 km long, 1–2 km wide, and 100–170 m thick, with vertical displacements of about 100–200 m and horizontal displacements of generally less than 1 km) and between the upper Holocene and the present (less massive landslides of mostly climatic origin and/or due to human activity such as deforestation and irrigation). Several large and active landslides, often related to reactivation of giant, ancient mass movements, are known to have caused massive destruction, as in the cases of the Haghardzin, Dilijan, Vokhjaberd (see next paragraph) and Ughedzor landslides, the most active in Armenia. The district of Dilijan hosts more than 160 landslides (a dense cluster of landslides in northeastern Armenia; see Figure 4a,b), some of which are still active. Conditions in the Dilijan district are particularly favorable to landslide formation, notably the presence of highly weathered rocks, bentonite, and shallow groundwater levels (due to the wetter climate in this region compared to rest of Armenia). Many of these large and active landslides were reactivated after the 1988 Spitak earthquake. Illustrative examples of recent, climatically induced landslide reactivations are those near Vokhjaberd and Noubarachen, ~10 km southeast of Yerevan; in the southeastern part of Figure 4e, the Vokhjaberd landslide is within the yellow rectangle, and the Noubarachen landslide is just to the west. These landslides were activated a few years after the Spitak earthquake and destroyed the cemetery of Noubarachen [1].
The reactivation of the Vokhjaberd landslide in the late 1990s was marked by widespread fracturing, bulging and subsidence, mainly in the upper inhabited part of this giant mass movement (see the green and yellow shaded zone in Figure 5d). One of the numerous houses destroyed by this landslide is shown in Figure 5c.

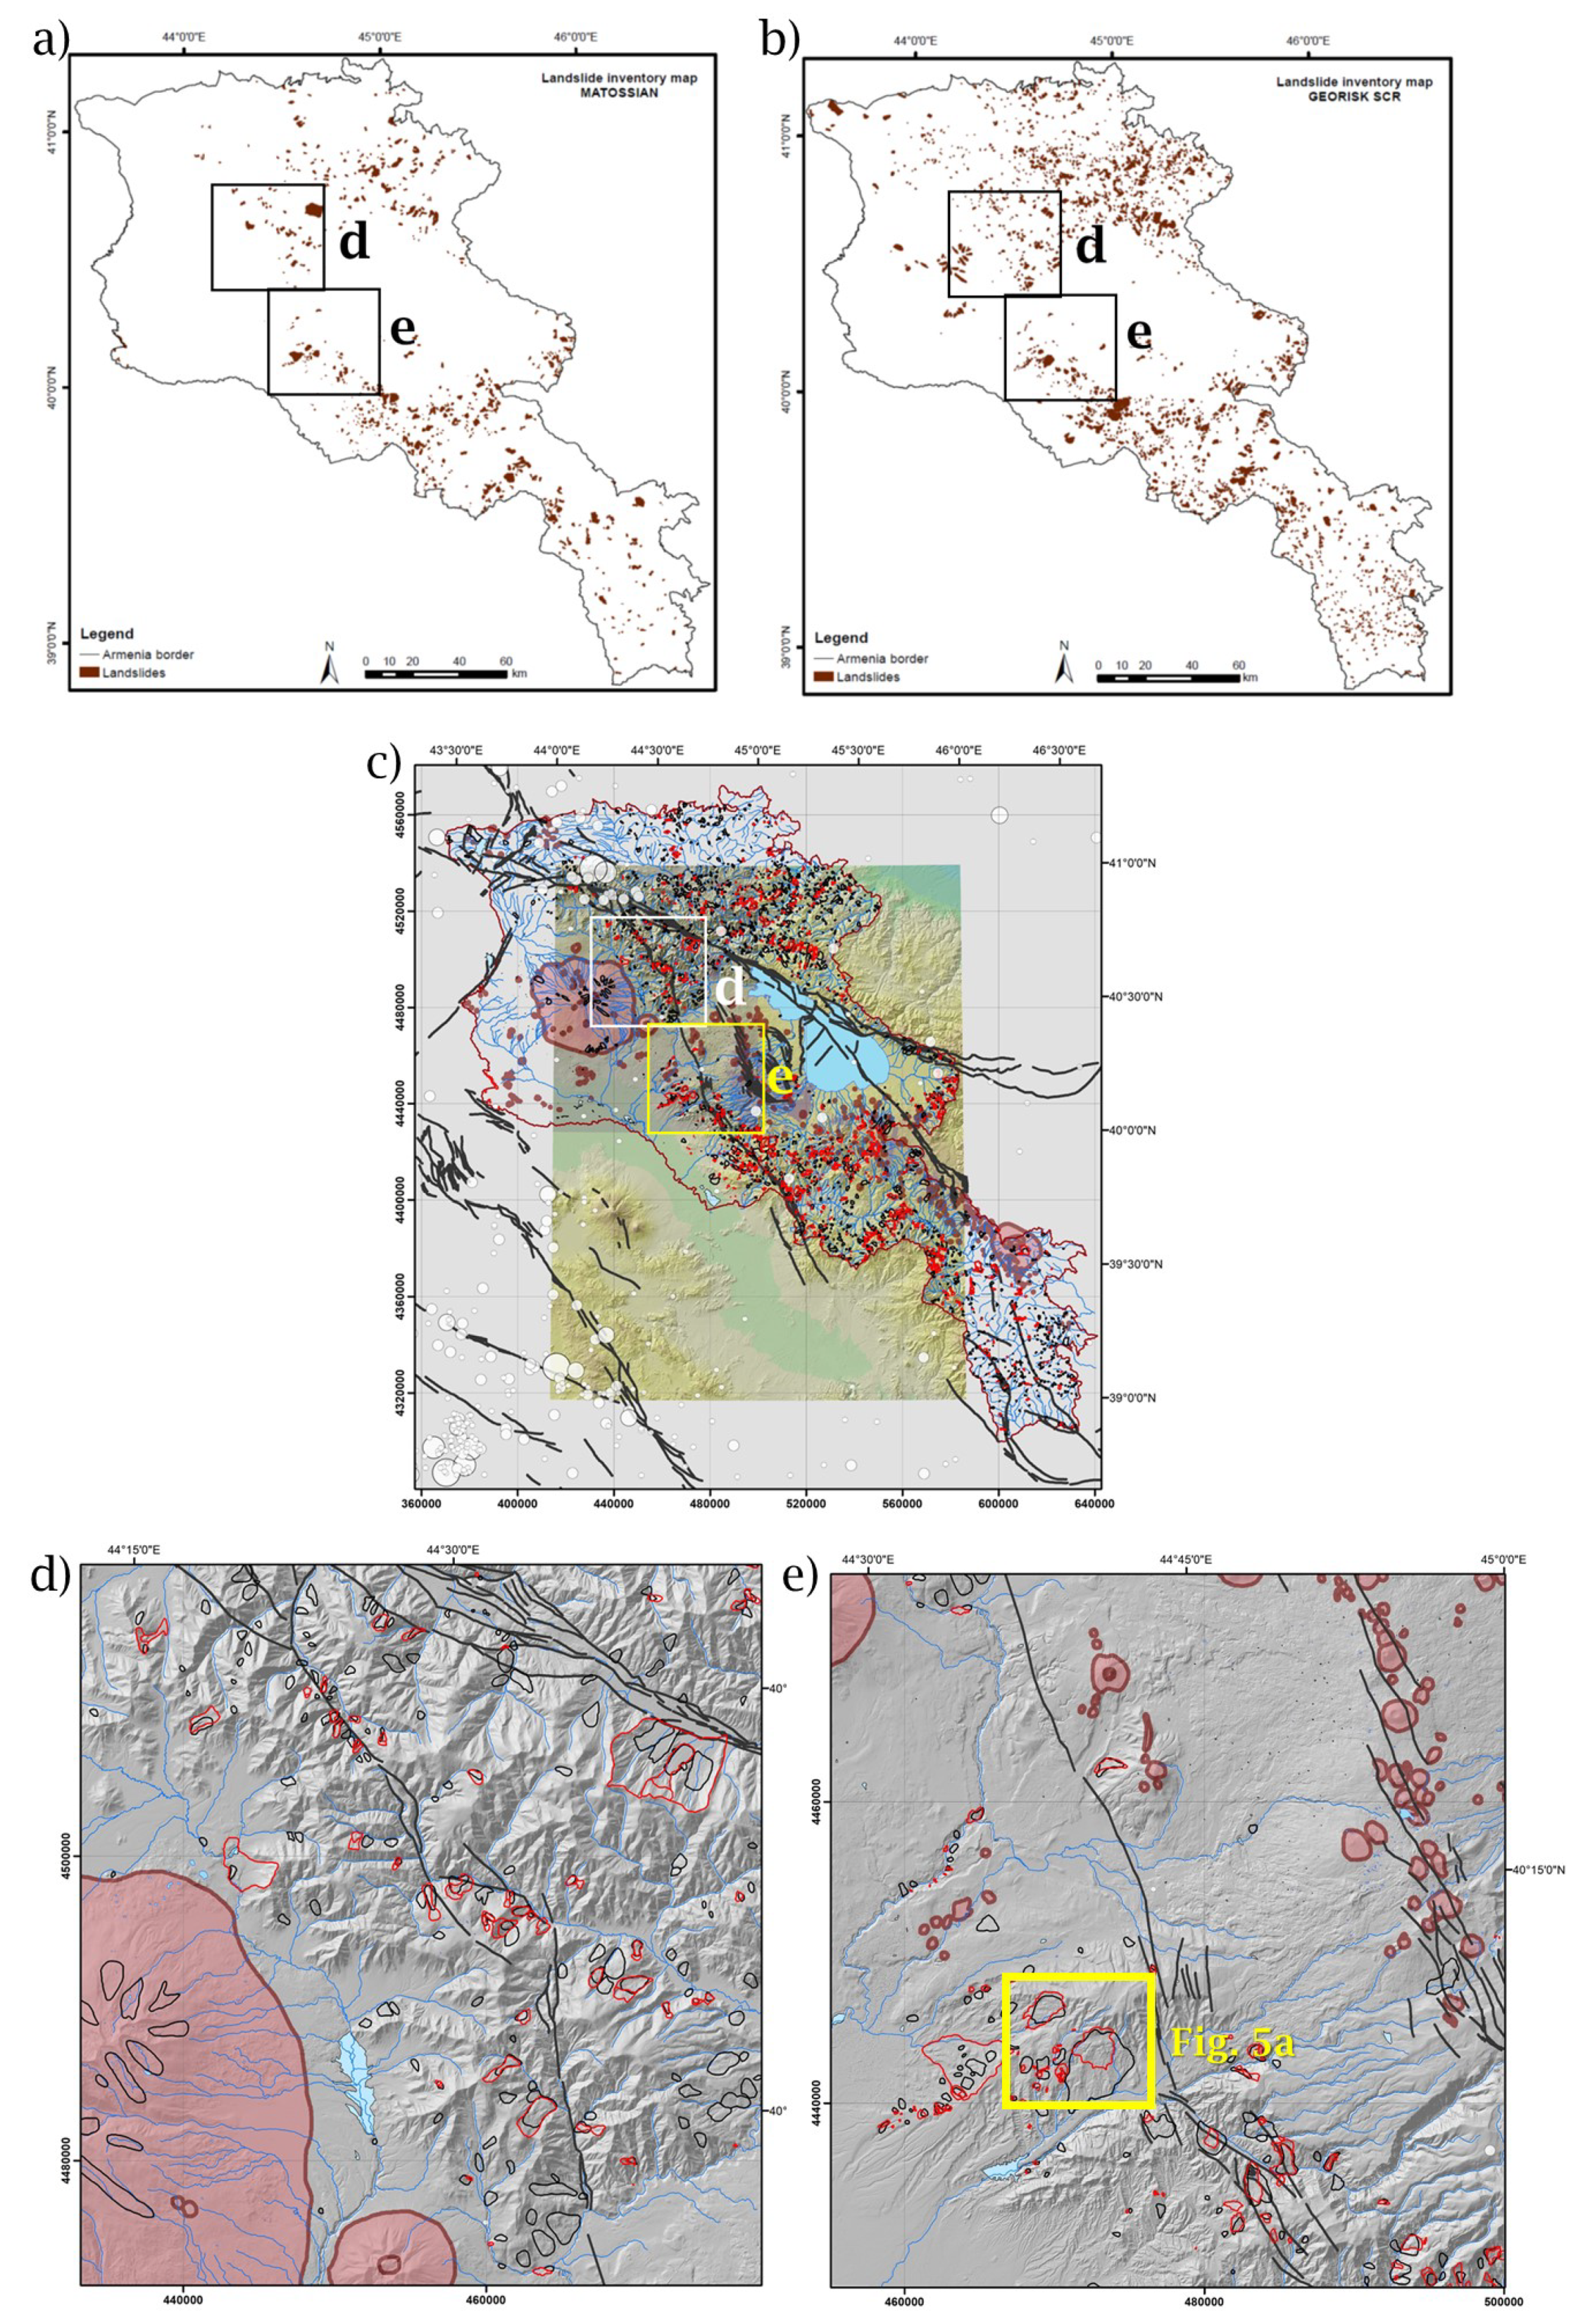
3. The Landslide Inventories

Two landslide inventories are currently available for the Armenian Lesser Caucasus: the Georisk and Matossian catalogues. The first, provided by the Georisk Scientific Research Company [15], contains more than 2000 landslides mapped over 29,743 km2. The Matossian inventory was compiled during 2017–2018, with parts published in Matossian [30], and also covers the entire country of Armenia. Both catalogues include records of several large, ancient mass movements (even of pre-Holocene origin) and more recent, still active or reactivated landslides. The Matossian inventory includes 1036 landslide features (including 138 scarps, 27 high-elevation instabilities, and 37 massive rockslides) that were manually digitized from Google Earth® (GE) imagery. The precision of this catalogue thus depends on the availability of high-quality images in GE. In this regard, we concede that there are some regions where the Matossian catalogue is incomplete, such as the Lori and Tavush provinces in northern Armenia, where slopes are intensely forested, and high-resolution (better than 10 m) imagery is not available for large areas in GE. Boynagryan [1] highlighted that the density of landslides in the Dilijan district (Tavush province) is high (at least 160 known landslides, although some are of smaller size) due to the presence of wet soils and highly weathered rocks. In the Matossian catalogue, only a few dozen landslides are recorded for this region; it is thus likely that many landslides, especially smaller ones, are not included. Furthermore, we expect that some landslides in higher mountainous regions with partial snow cover could not be detected. In those areas, it is difficult to distinguish features related to glacial erosion/deposition from gravitational mass movements (see Section 5.1). Additionally, most high-quality images available in GE were acquired between 2002 and 2010. Thus, the Matossian catalogue, although finalized in 2018, only includes records for landslides that existed prior to 2011.
The following criteria, illustrated in Figure 6, were used to identify landslides for the Matossian catalogue:
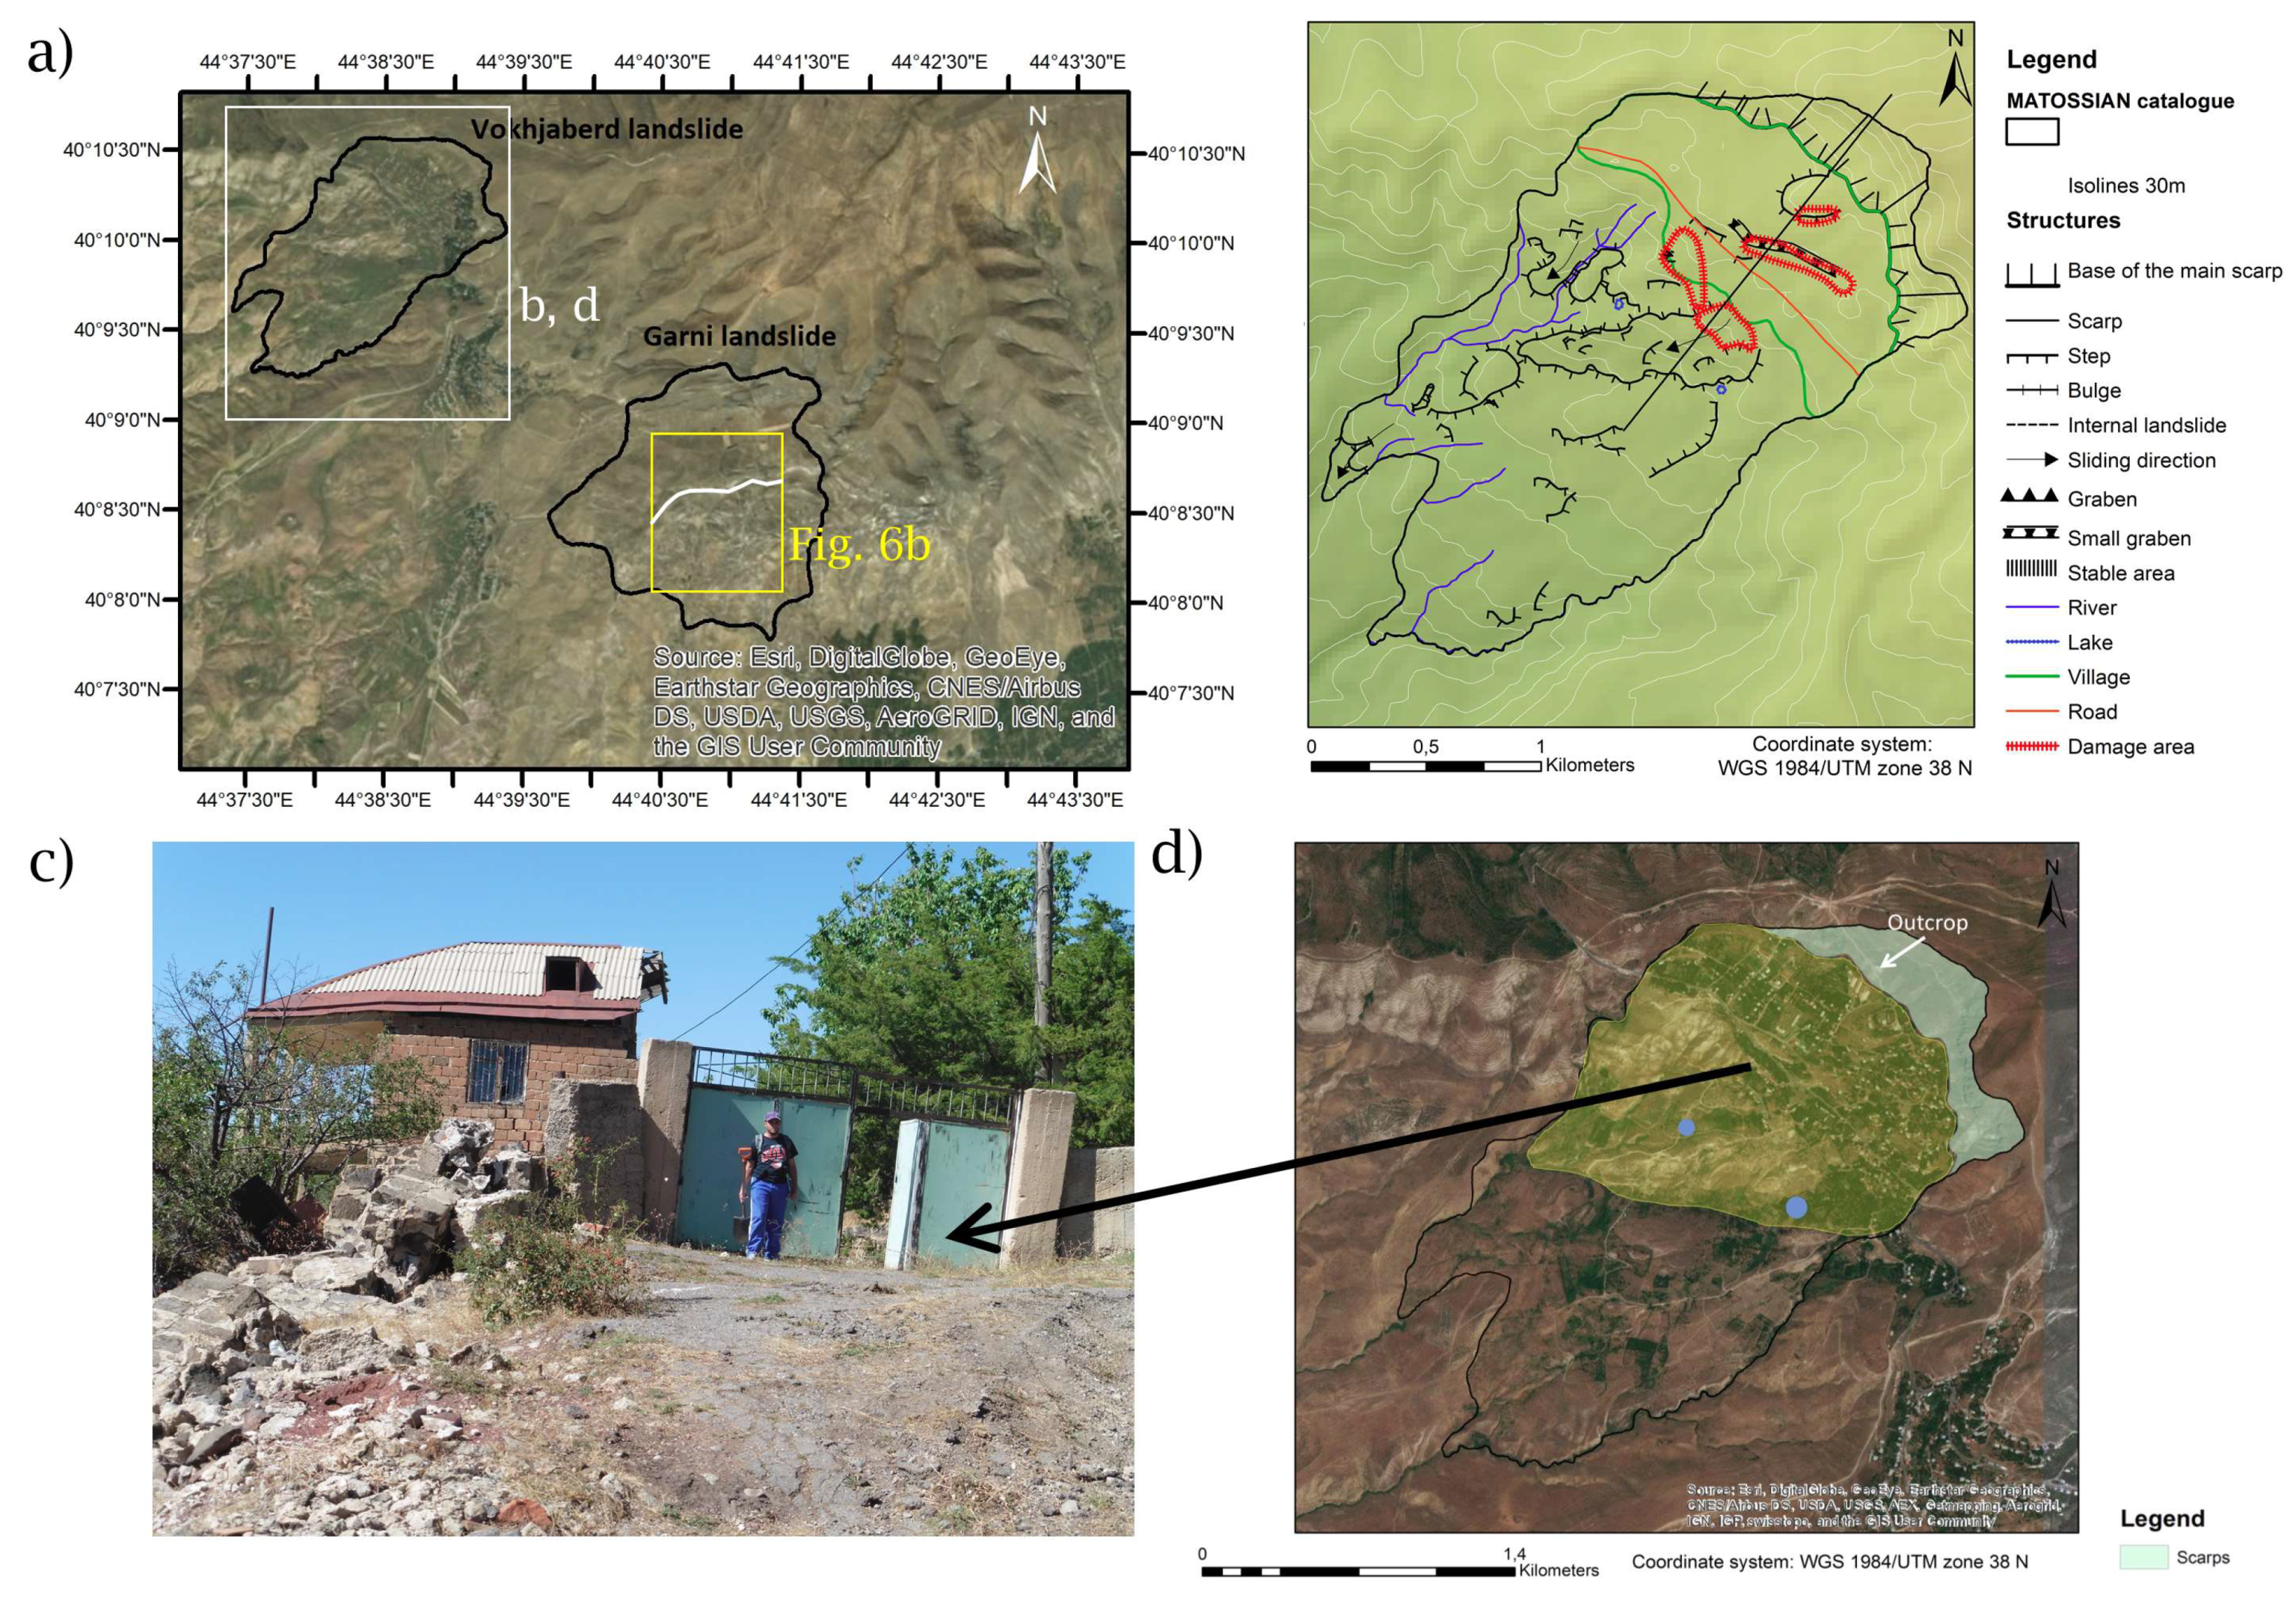
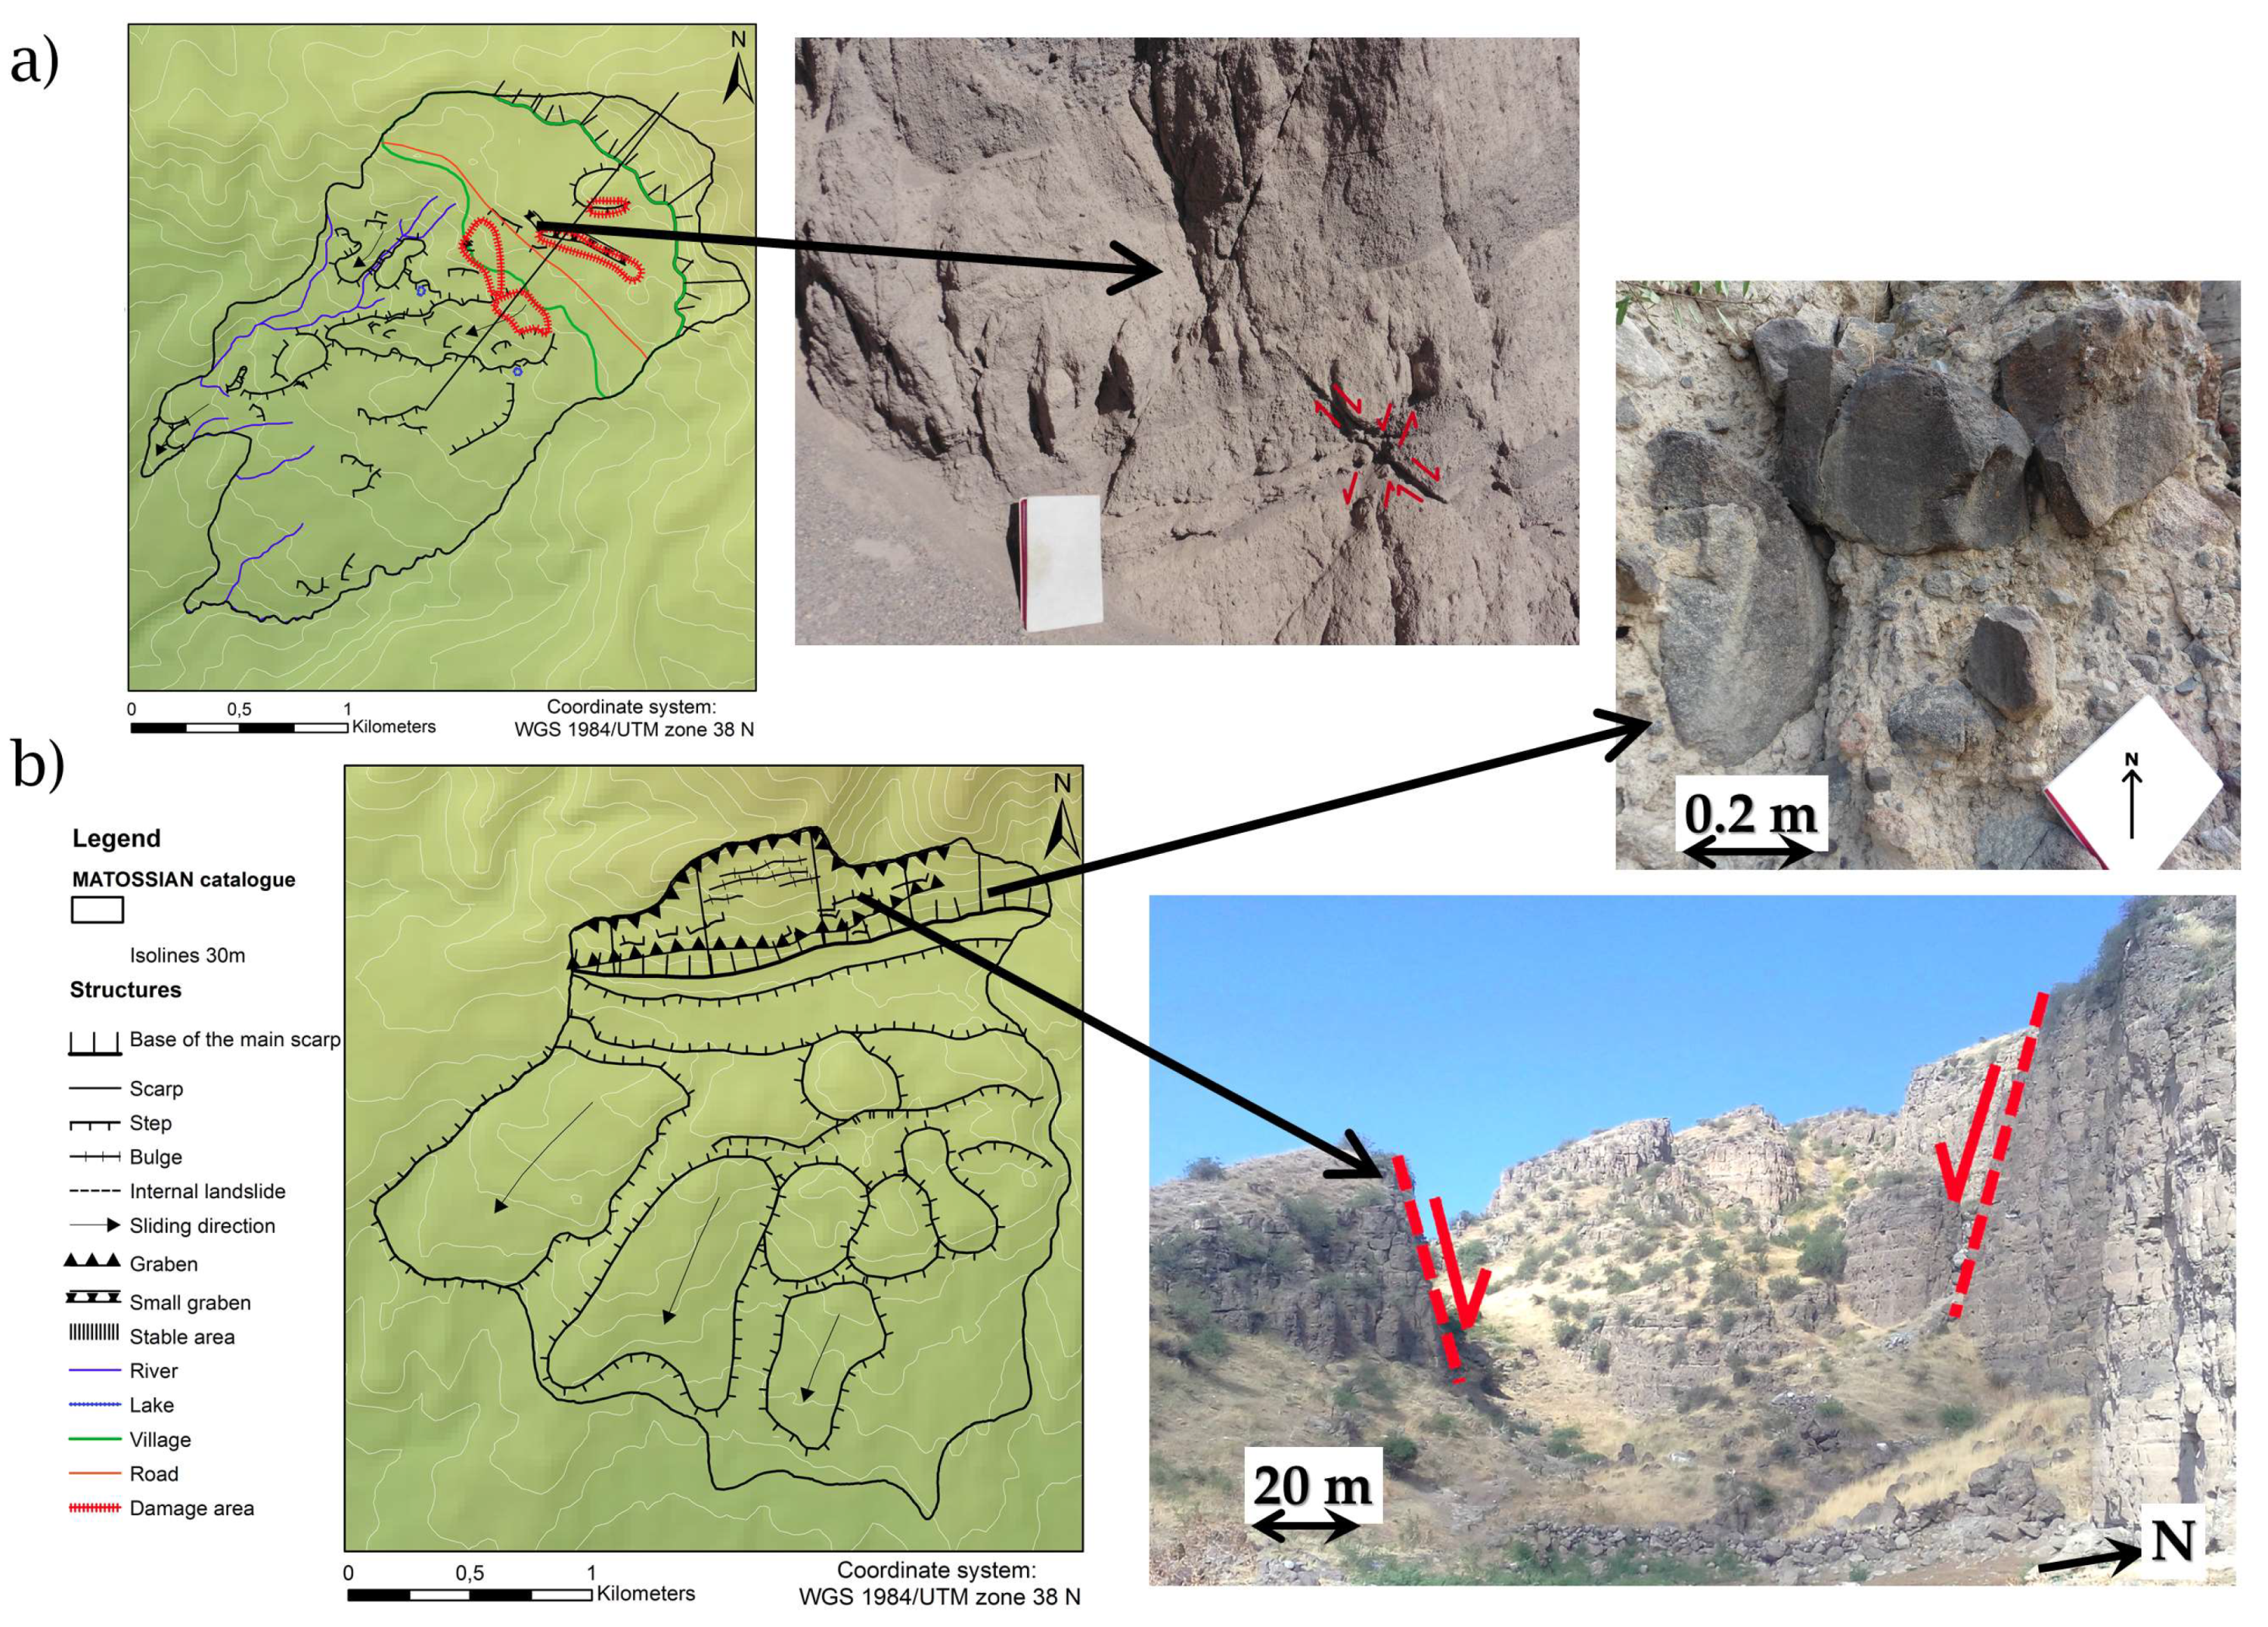
  • Changes of curvature and landscape slope: convex, gently sloping parts generally represent the main body of a landslide and the concave, steeper part the scarp/source zone;
  • In some cases, the presence of minor, internal scarps or cracks within the landslide body, or even beyond the scarp, correspond to crown cracks and small gravitational grabens;
  • Vegetation changes: the absence of vegetation may indicate recent landslide activity, especially where forest cover is important (as in northern Armenia, near Dilijan);
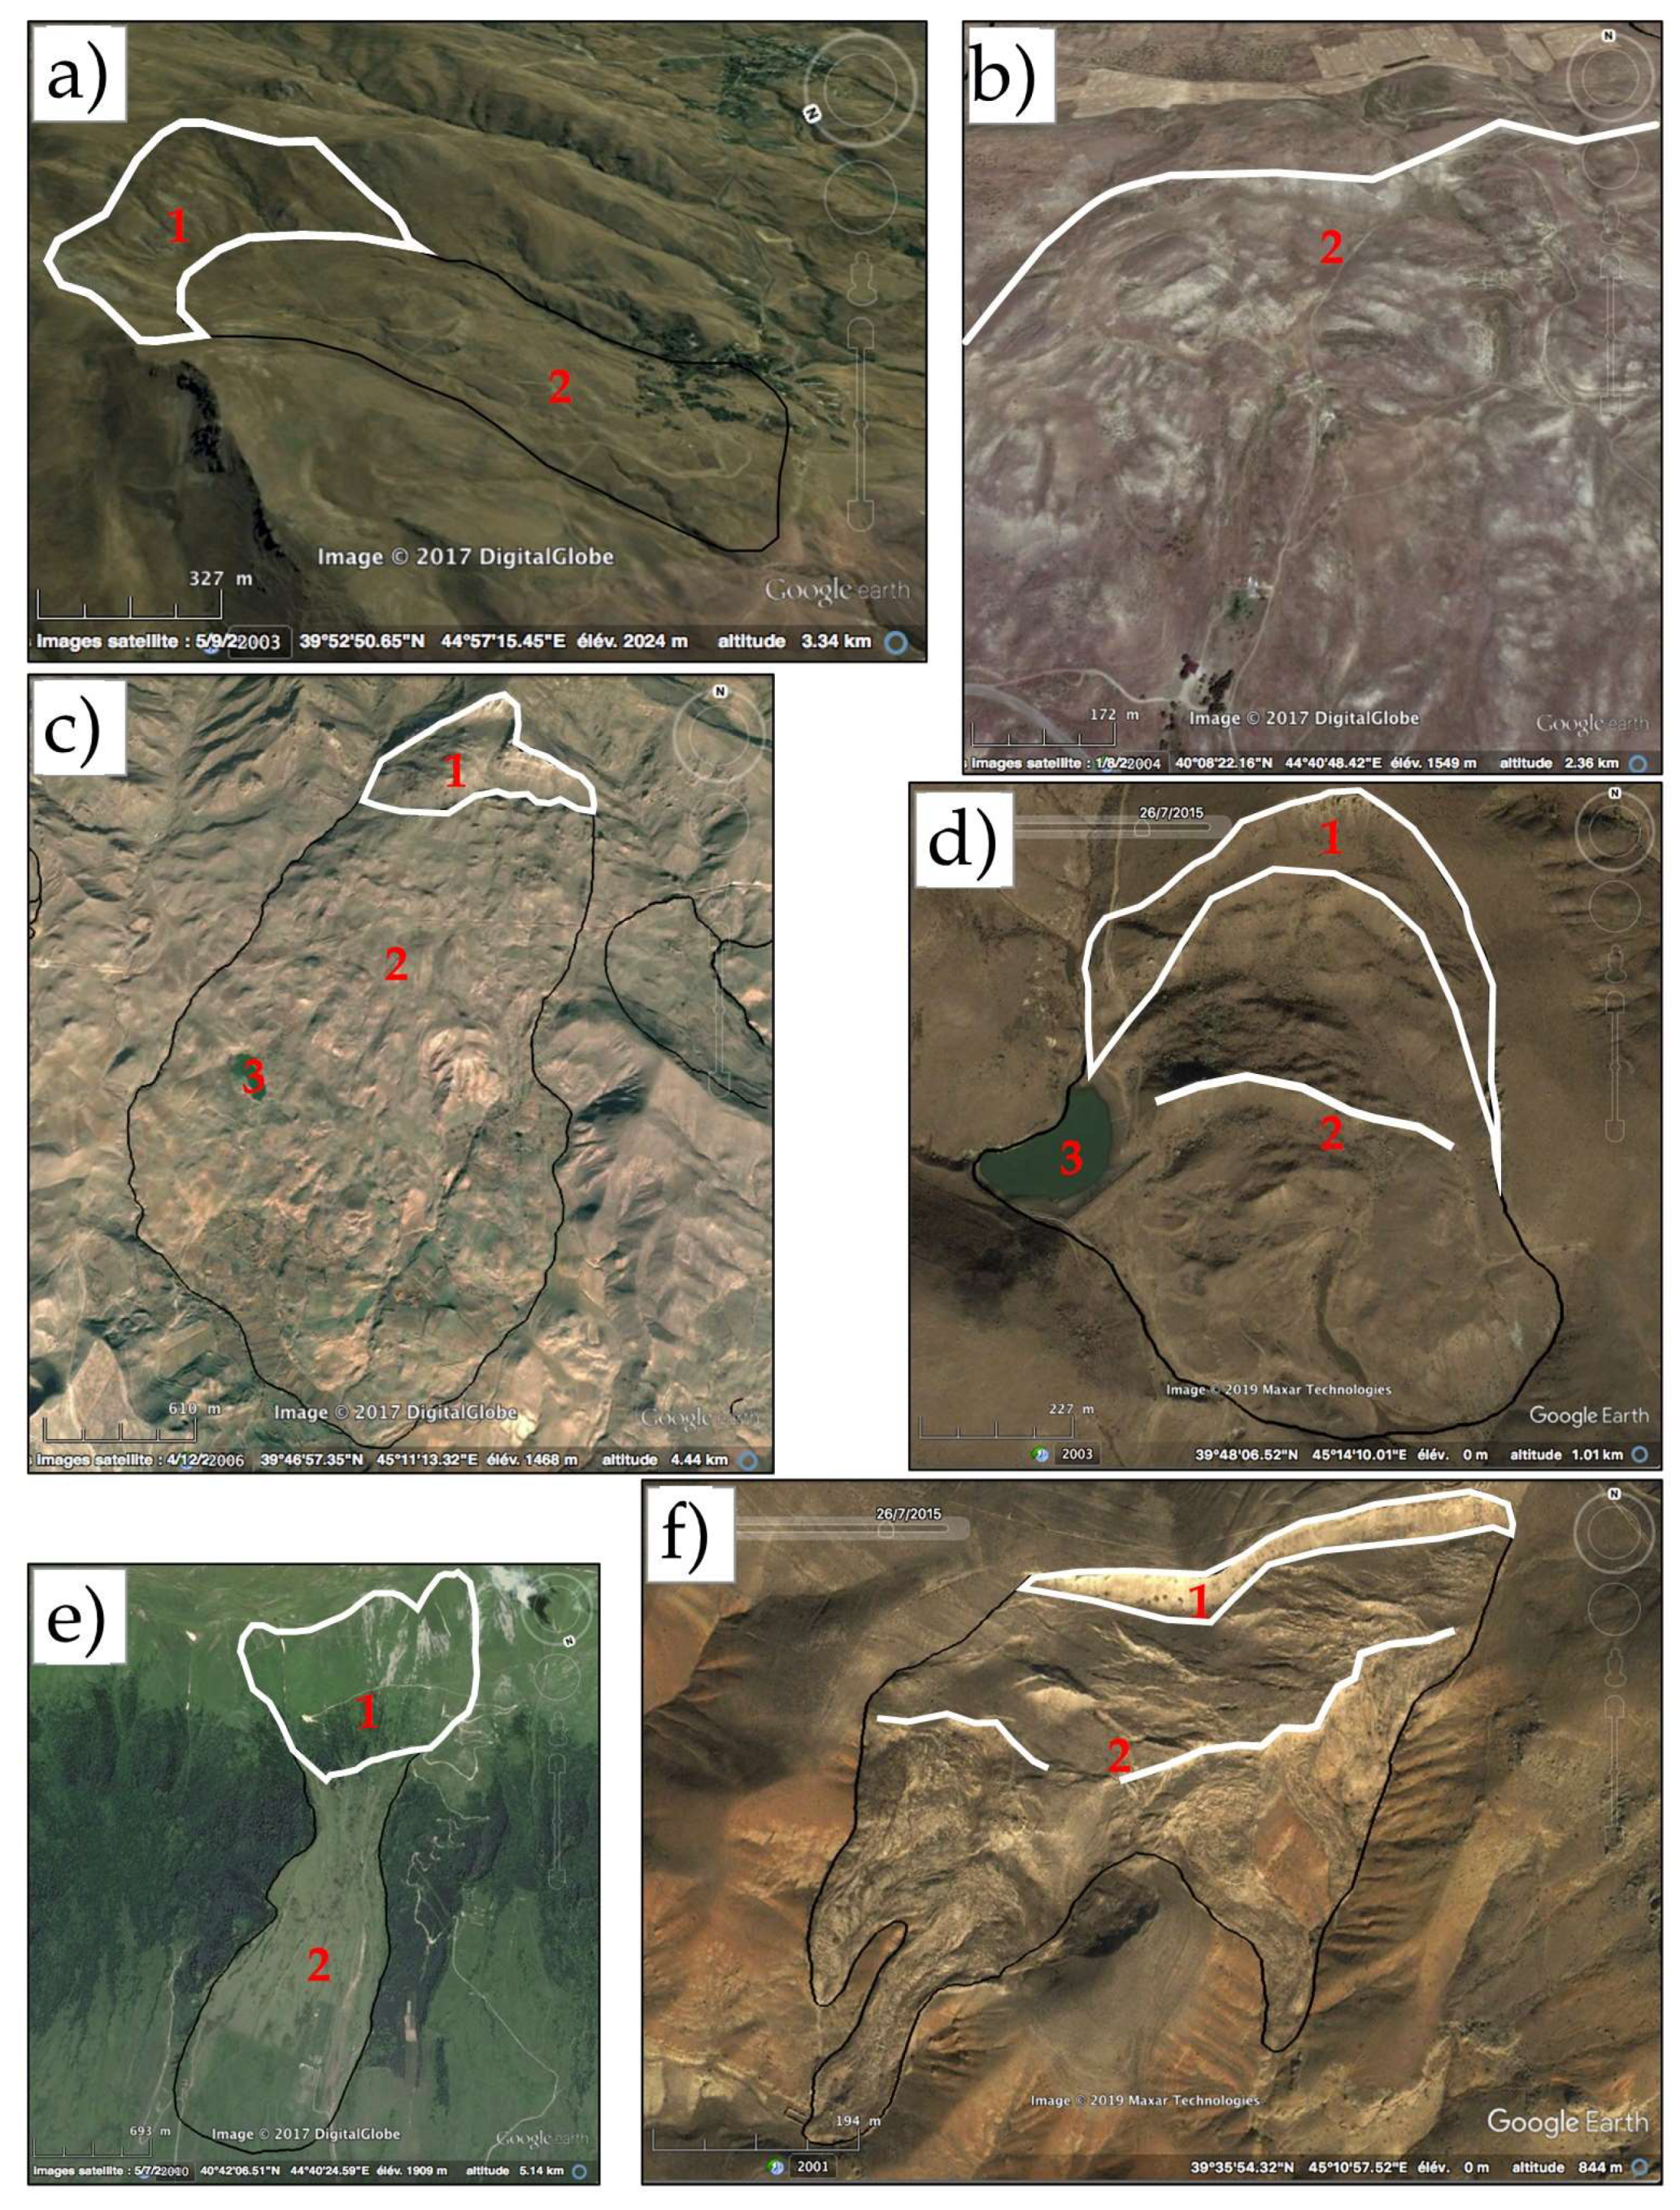
  • Hummocky landforms tend to mark the presence of a mass movement (see discussion in Section 5.1);
  • Lakes in valleys behind landslide dams or within landslide deposits due to the existence of counter-slopes and hummocky landforms;
  • The presence of destroyed houses could indicate recent landslide activity, as in the cases of the Noubarachen and Vokhjaberd landslides (Figure 5; some damaged houses are visible in GE satellite imagery).
The identification of landslides and their precise limits was very difficult in some areas. Therefore, the Matossian catalogue also includes information on the degree of certainty related to landslide identification and delimiting, on a scale from 1 (uncertain/imprecise) to 3 (certain/detailed outline). About 50% of the landslides in the Matossian catalogue are classified as ‘3’.
These uncertainties, which most likely also affect the Georisk catalogue, can explain some of the numerous differences between the landslide outlines in the two catalogues. Other differences between the two catalogues likely result from three distinct differences in mapping objectives, as discussed in the following paragraphs.
First, the number of landslides is very different between both catalogues: there are about 2257 landslides in the Georisk catalogue and 1036 in our inventory. This could be due to the fact that many landslides mapped in the Georisk catalogue are not identifiable with the available GE imagery. Nevertheless, the spatial distribution of landslides is similar in both catalogues, and there are scarce examples of landslides in the Matossian catalogue for which there are no equivalent features in the Georisk catalogue.
Second, we estimate that landslides recorded in both inventories are more precisely mapped in the Matossian catalogue because we used higher-resolution imagery than that available in 2006 during the creation of the Georisk inventory. Also, as shown in Figure 7, although the Georisk catalogue records landslide bodies, source areas or landslide scarps are often omitted (especially when deposits are clearly separated from the source area, such as for rockslides with longer runouts; Figure 7c). Most likely, the mapping objective for the Georisk catalogue was focused on landslide deposits, whereas the Matossian catalogue includes both landslide source and deposit areas in the total outline of a single mass movement (useful for landslide susceptibility mapping).
Third, in some higher mountain areas, some landslides recorded in the Georisk catalogue are omitted from the Matossian catalogue because we interpreted the morphologies (not necessarily the landslide processes) differently. These differences are discussed in Section 5.1.

4. Landslide Size-Frequency and First Spatial Distribution Analyses

In this section, we first describe the size-frequency statistics of landslides in both catalogues, then we analyze the distribution of landslides with respect to (i) the distance to active faults and (ii) the effects of local morphological factors (i.e., slope angle and orientation). The influence of volcanic structures/soils on slope stability is not analyzed in detail here and is subject to only limited discussion in Section 5. Although Matossian [30] reported a weak influence of volcanic features on slope stability, we estimate that this factor, especially the presence of volcanic soils, requires more detailed study.

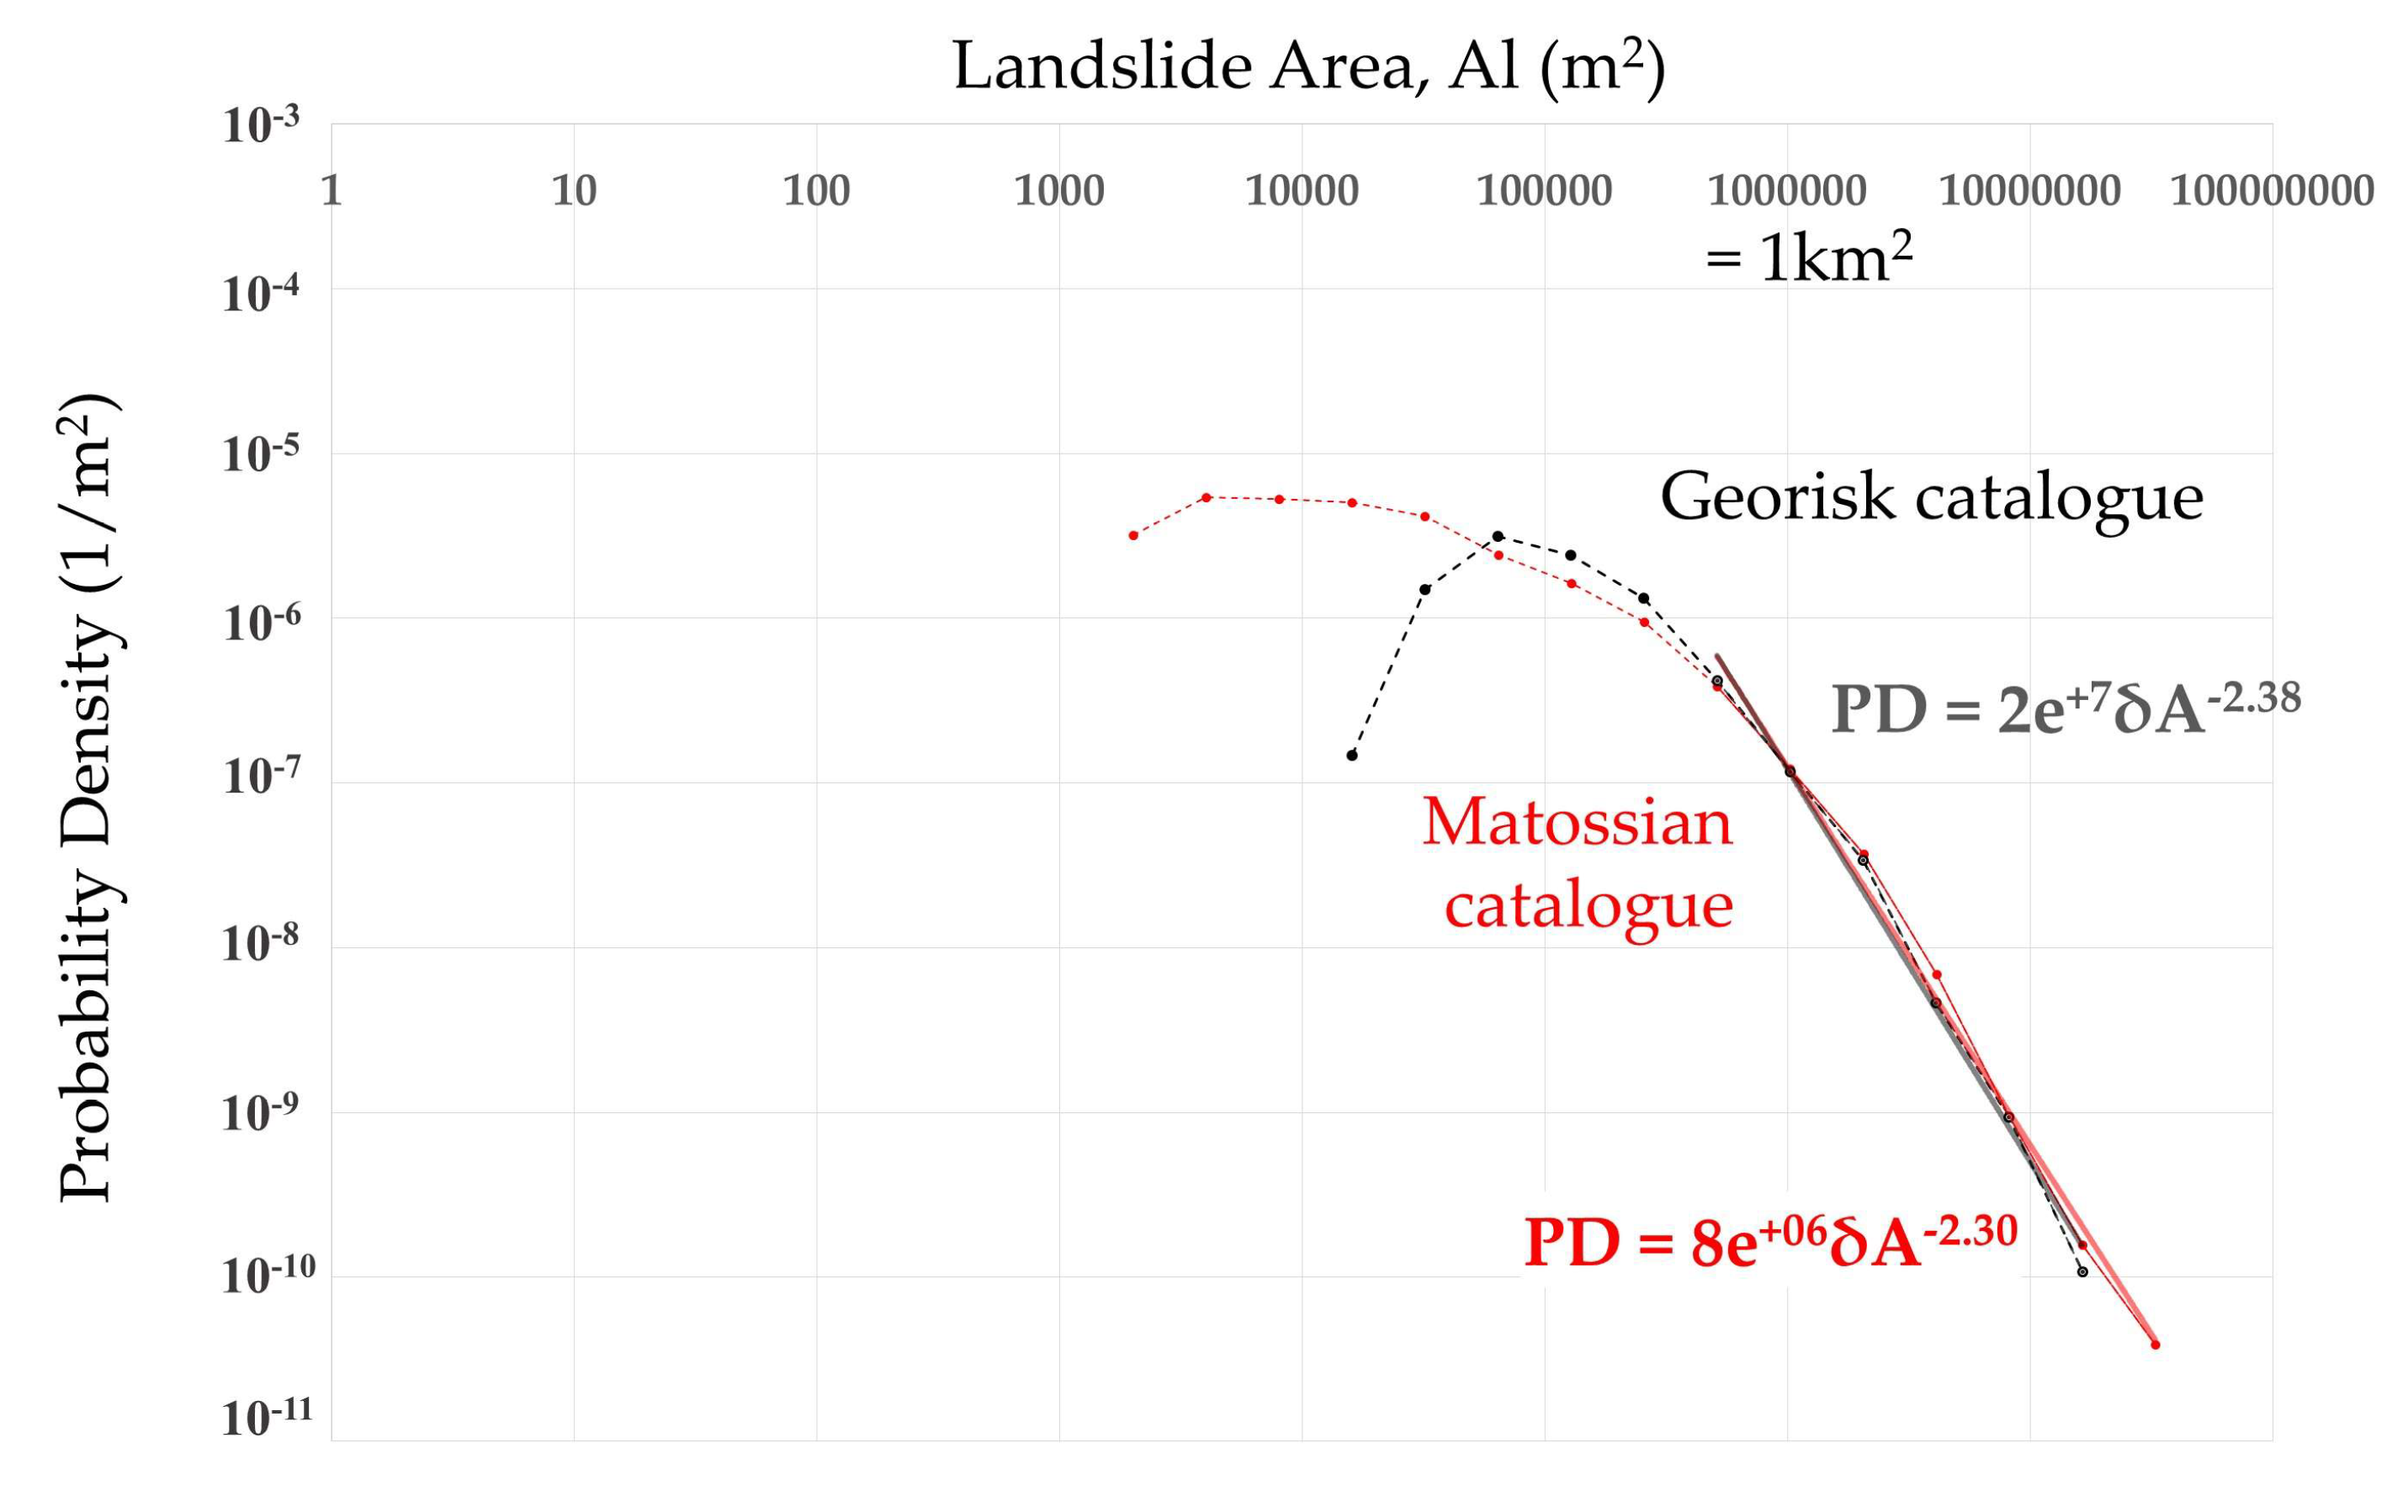
4.1. Landslide Size-Frequency Analysis

The landslide size-frequency relationship is presented for both catalogues in Figure 8 in terms of the probability density function of landslide areas, p(Al), applying the method of Malamud et al. [31], as follows:
p ( A l ) = 1 N t l δ N l δ A l
where Al indicates landslide surface area (m2), δNl is the number of landslides with areas between Al and Al + δAl, and Ntl is the total number of considered landslides.
The log–log graph in Figure 8 shows that landslide occurrence decreases with increasing size according to a power law (see also [32]) for all events larger than those marking the ‘rollover’ size, which delimits the trend of decreasing occurrence with decreasing size (left part of the graph) from that of decreasing occurrence with increasing size (right part of the graph). The roll-over size is about 10,000 m2 in the Matossian catalogue and about 100,000 m2 in the Georisk catalogue. According to Malamud et al. [31], such roll-over is a natural phenomenon explaining that the number of landslides generally (for a series of tested and verified landslide inventories) decreases for smaller events below a certain critical size (typically around 1000 m2). As the catalogues considered contain very few landslides of such small size, we estimate that the observed roll-over size represents a measure of the completeness of the catalogues, with values closer to 1000 m2 indicating a more complete catalogue. This seems to suggest that the Georisk catalogue is less complete, although it includes more small-sized events than the Matossian catalogue. Nevertheless, both power law trends have tails with similar exponents (−2.3 and −2.38 for the Matossian and Georisk catalogues, respectively). Thus, despite the differences presented in Section 3, the size-frequency distributions for larger events in both catalogues are quite similar. Compared with the size-frequency analysis of the entire Tien Shan landslide inventory [6], these exponents are markedly lower than their value of −1.9. The higher value for the Tien Shan inventory typically indicates a larger proportion of large to small mass movements. The reason for this apparently different proportion of large mass movements in the Lesser Caucasus and Tien Shan is discussed in Section 5.

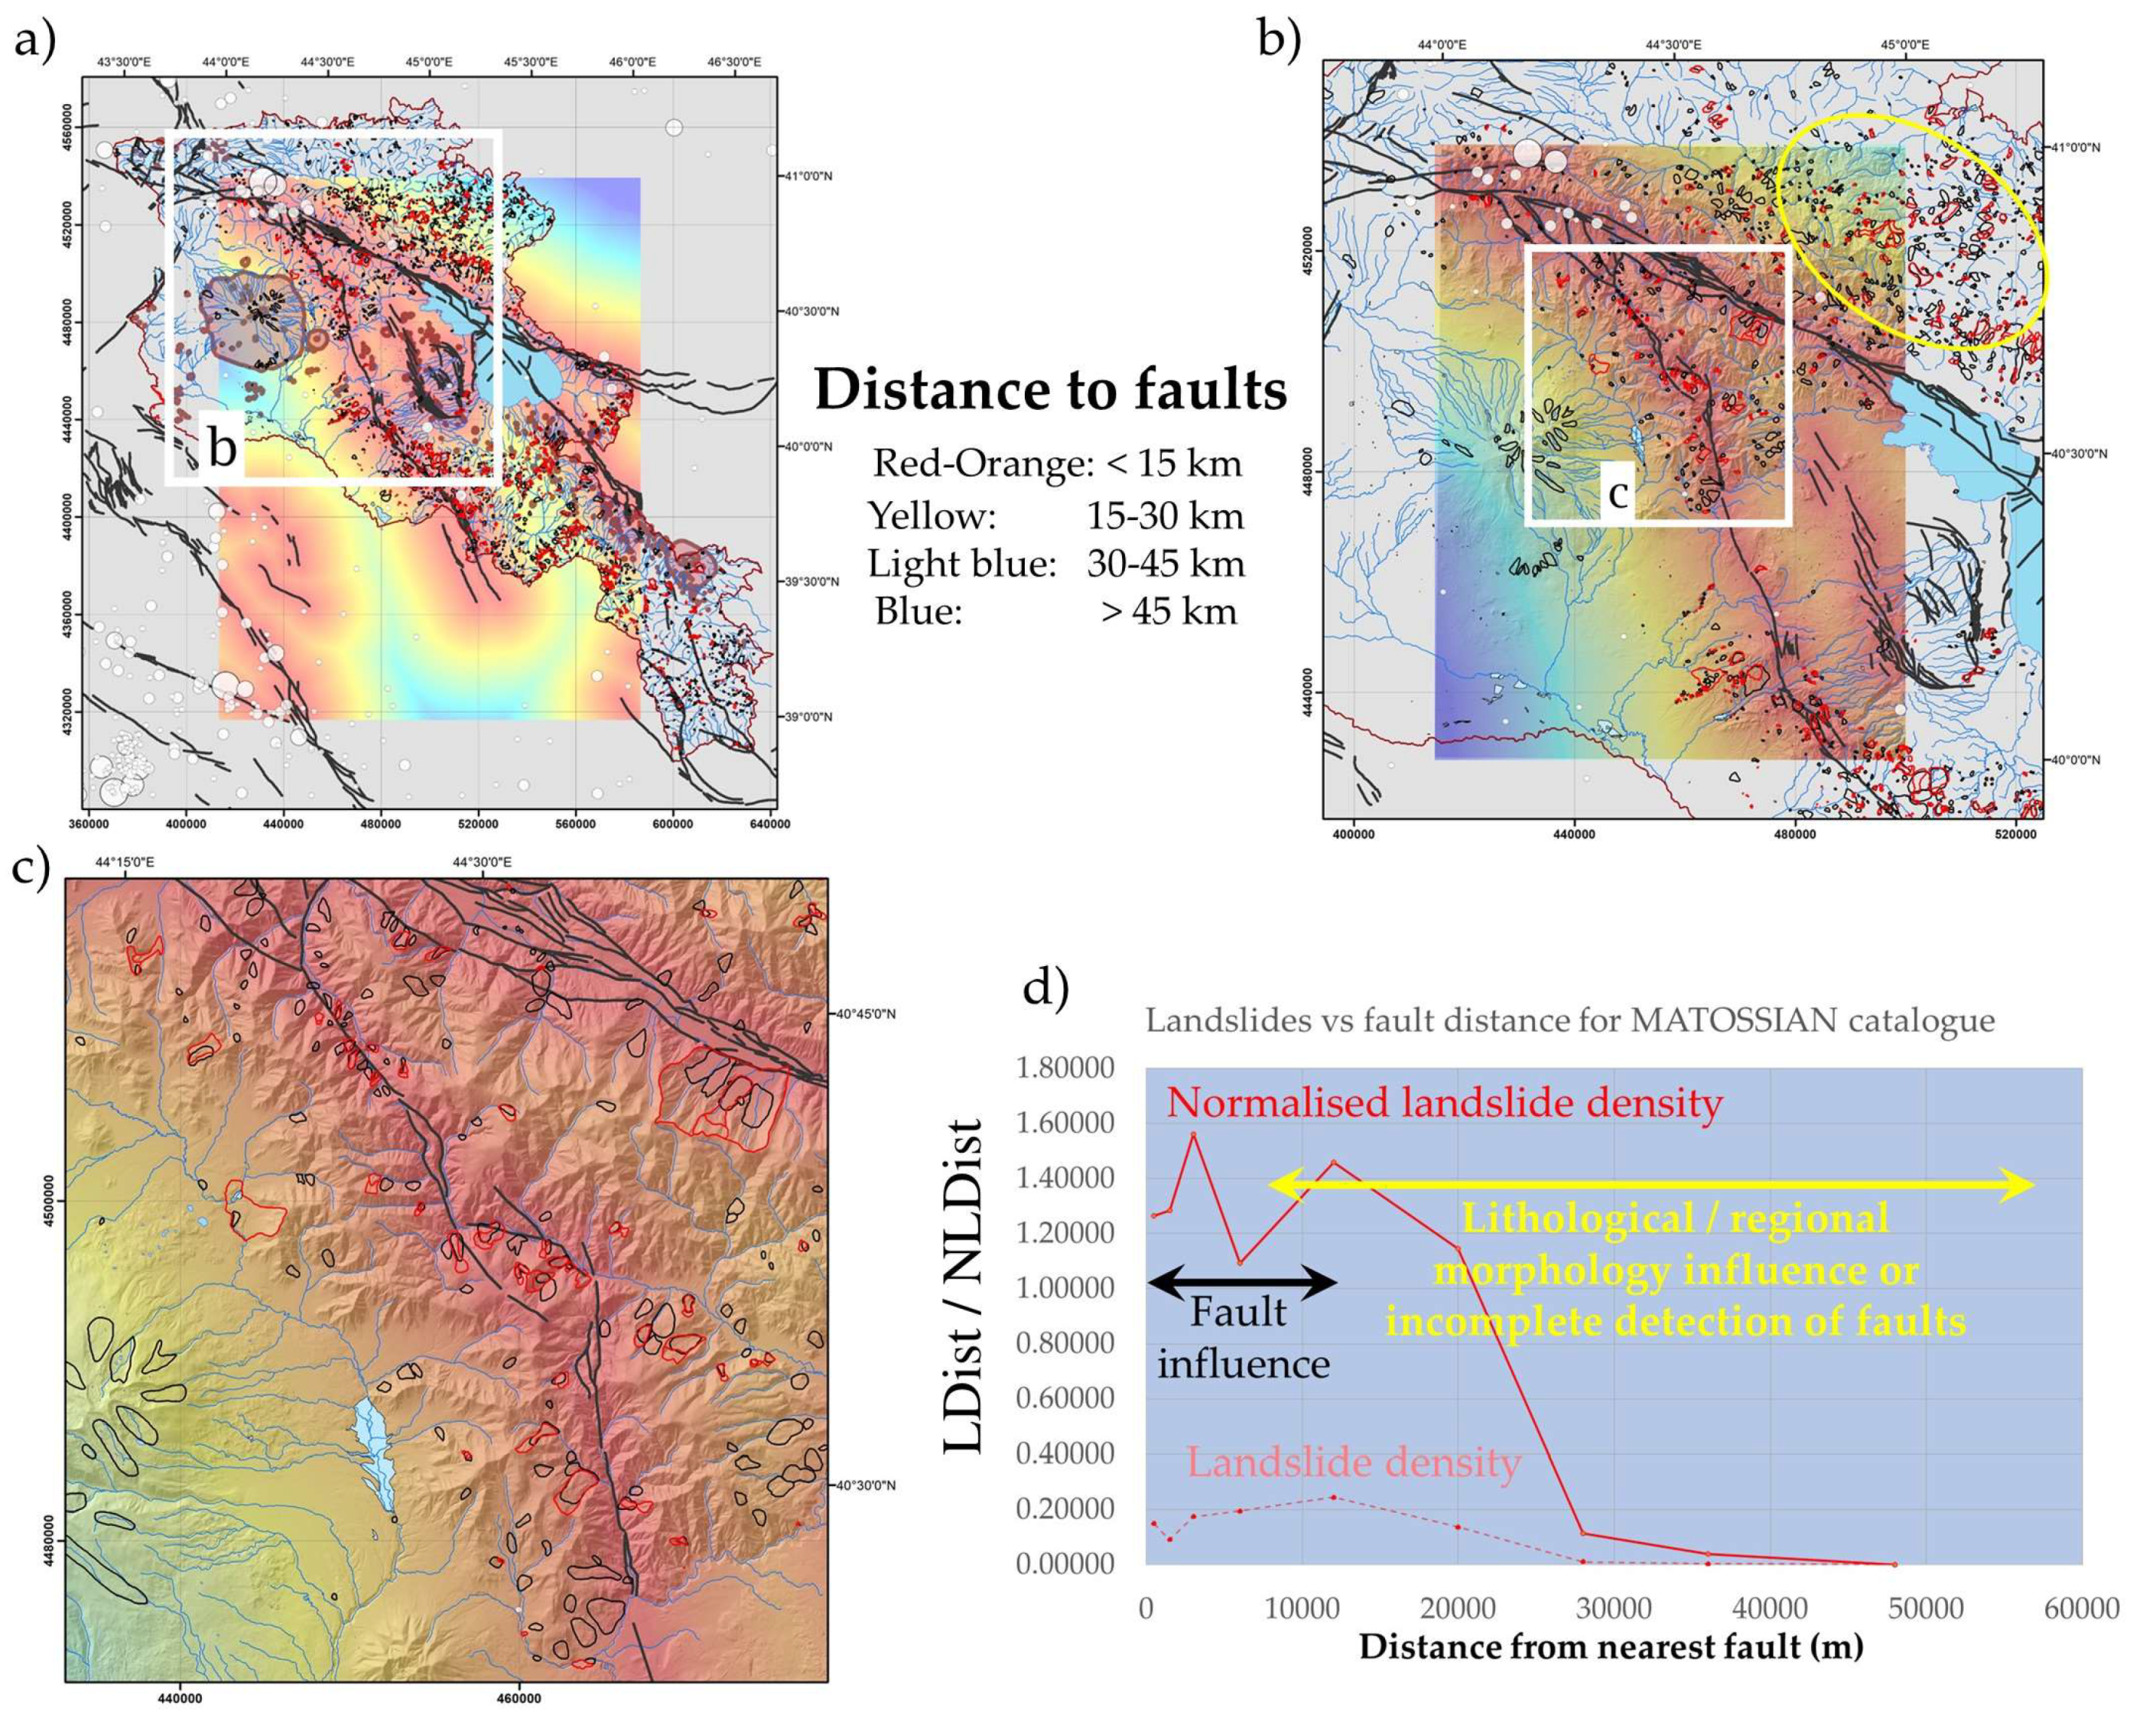
4.2. The Influence of the Distance to Active Faults on Landslide Occurrence

As a first indicator of landslide susceptibility, we analyzed landslide density with respect to the distance to active faults. We calculated both the number of landslide pixels within a certain distance class divided by the total number of landslide pixels, LDdist (‘landslide density’), and the normalized landslide density, NLDdist, corresponding to LDdist multiplied by the number of all map pixels and divided by the number of distance class pixels. Figure 9 presents the influence of the distance to faults on slope instability. The maps (Figure 9a–c) show that landslides (especially larger ones) are concentrated along the two major fault zones of the Garni in central–western Armenia (NNW–SSE oriented) and the Pambak-Sevan-Syunik in the eastern part (WNW–ESE oriented, bordering Sevan Lake). This concentration is more clearly observed in the Matossian catalogue (see red polygons in Figure 9c) than in the Georisk catalogue (black polygons in Figure 9c), notably due to the numerous landslide landforms recorded by the latter at higher altitudes (i.e., on volcanoes) farther from the faults.
Both catalogues contain numerous landslides mapped far from known active fault structures in the area north of Lake Sevan and east of Dilijan, near Ijevan (outlined by the yellow ellipse in Figure 9b), an area previously reported to be at higher landslide susceptibility [1]. This region is wetter (and more vegetated) than the rest of the Lesser Caucasus and is characterized by softer soils. In Figure 9d, those landslides far from any mapped fault structures (i.e., at distances >12 km) have thus been classified as ‘lithologically/morphologically’ influenced slope instabilities.

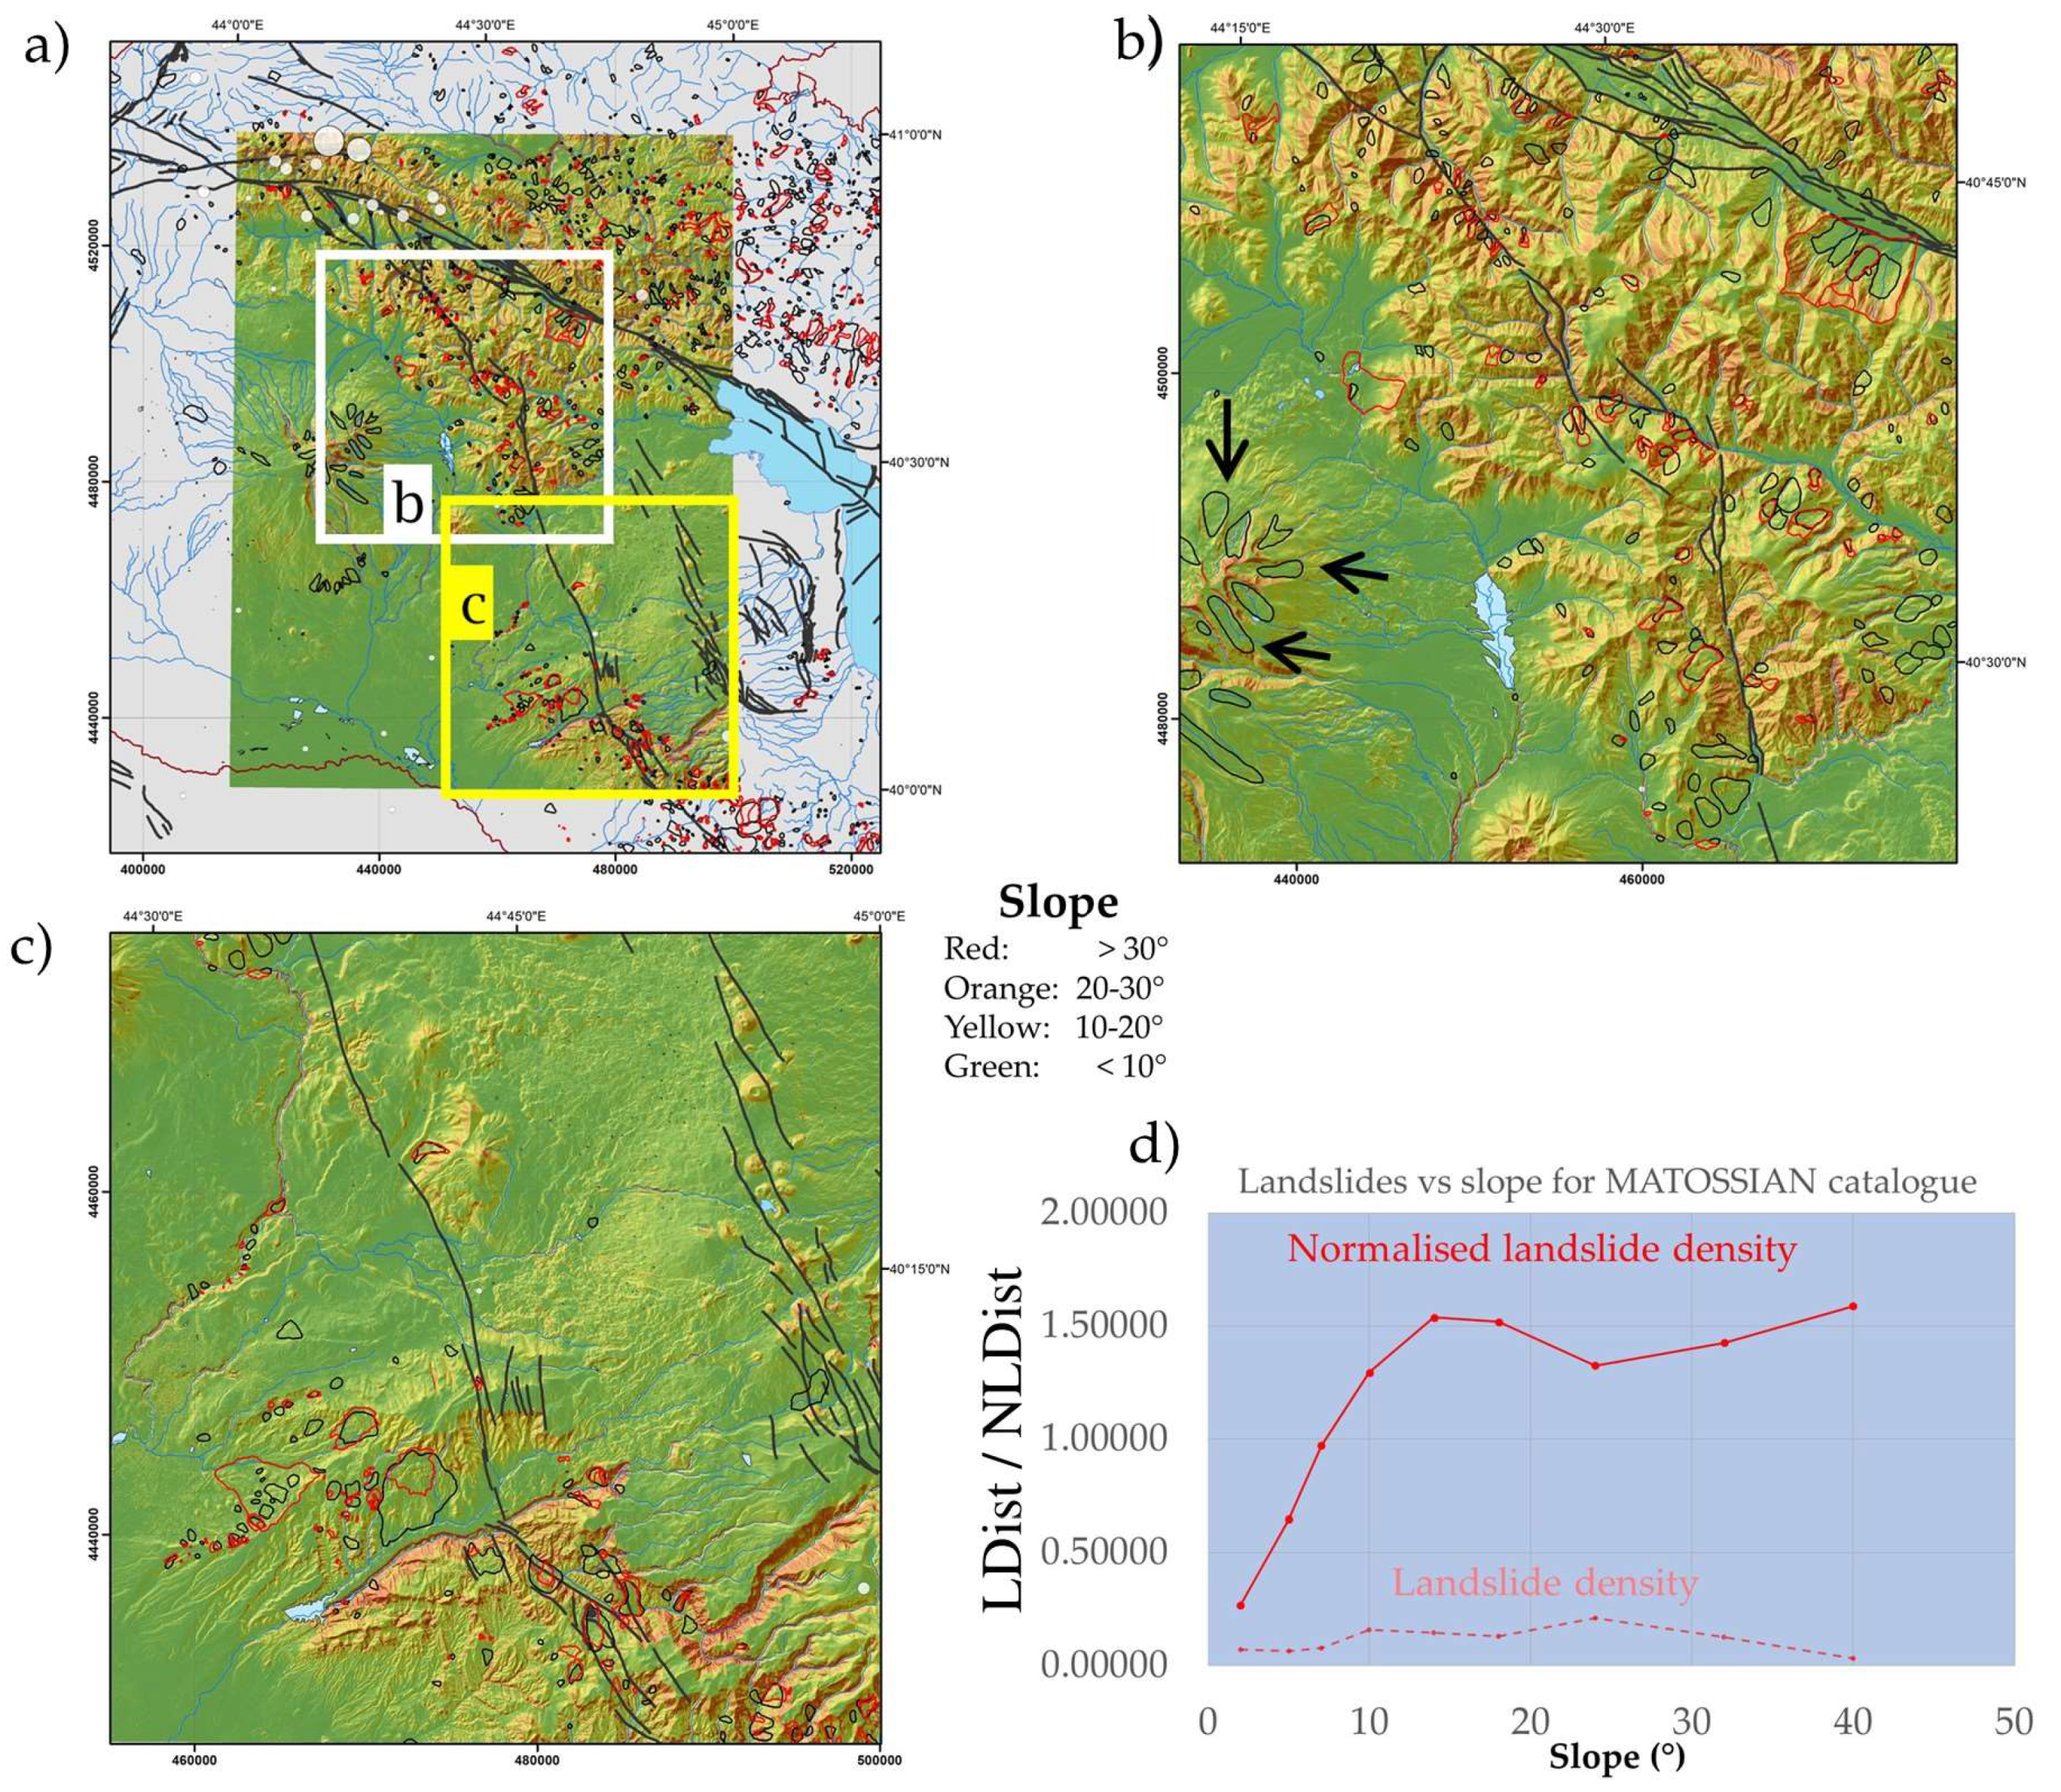
4.3. The Influence of the Slope Orientation and Angle on Slope Stability

In studying the effect of local morphology on slope instability, we first observed that the distribution of landslide densities with respect to slope orientation was similar for both catalogues, with the peak landslide density occurring on slopes oriented 255°–360°.
Along NW–SE-trending valleys near mapped active faults, many very large landslides (though far fewer than in northeastern Armenia, see Section 4.2) have occurred on slopes oriented to the southwest or northeast. Those slopes are quite steep (>35°) and relatively high and wide (Figure 10).

5. Discussion

In any region, landslide mapping is the fundamental task that must be completed for landslide susceptibility and hazard analyses. However, as landslide mapping requires time and effort, forward modelling and spatial analysis tools (e.g., see [33,34] for the Newmark mapping approach) have been developed to ‘predict’ landslide susceptibility more rapidly and without prior information on previous slope failures (as would be needed for regions hit by a severe storm or earthquake, for which a new or updated landslide susceptibility map should be rapidly created; see applications presented by [35,36]). Nonetheless, for a reliable and general (not event-based) landslide susceptibility assessment, landslide inventories provide a necessary control on such predicted susceptibility maps, as spatial analysis or forward modelling approaches cannot account for all region-specific information. In the case of landslide susceptibility assessments in the Lesser Caucasus, one must consider the combined influence of, among others, the distance to active faults, the presence of hard volcanic rocks versus soft volcanic deposits, slope steepness, the spatially variable effects of slope orientation and related soil wetness, and slope height and width. Here, we qualitatively analyzed mainly the influences of the distance to active faults and slope factors; a more detailed landslide susceptibility analysis was initiated by Ledworowska [37] but remains to be finalized. Before such a landslide susceptibility study can be finalized, the validity of the landslide catalogues used for statistical analyses must be proved. At a minimum, it must be indicated which types of landslides are recorded in the catalogue and what specific features have been mapped, as landslides are complex morphological features, some of which are only expressed by scarps, or, in the case of older landslides, the deposits have been eroded or are covered by, for example, fluvial sediments. We began such an assessment above on the basis of the observed differences between the two available landslide catalogues for the Armenian Lesser Caucasus (see Section 3 and Section 4); we continue that discussion in the following section with particular focus on the mapping of higher elevation landslides and the definition of landslide extents.

5.1. Landslide Size-Frequency Analysis

To explain the shift between the calculated probability density values and those obtained by Malamud et al. [31], we established Table 1. We compared some landslide distribution parameter values of the here presented two inventories of the Armenian landslides with the corresponding values obtained for the Northridge 1994 landslide inventory by Malamud et al. [31], for those of the Schlögel et al. [38] landslide inventory for the Mailuu-Suu Valley in Kyrgyzstan and for those of the Tien Shan catalogue analyzed by Havenith et al. [39].
An important parameter value is the one of the mean landslide size: about 0.5 km2 for the two Armenian catalogues and 0.002 km2 for the Northridge inventory by Malamud et al. [31]. The global Tien Shan landslide inventory is marked by a mean landslide size (0.4 km2) similar to the one of the Armenian catalogues, while the Mailuu-Suu Valley landslide inventory is characterized by an intermediate value of 0.03 km2.
It can be easily understood that the mean landslide size also influences the probability density values—the larger this mean size, the more the probability density function is shifted to large landslide size values.
Now, it has to be explained why the average landslide size is changing for the different catalogues, and why there is this clear shift to larger sizes of the probability density functions of the Armenian and Central Asian catalogues compared to those analyzed by Malamud et al. [31]. The reason is twofold and depends on the ‘mapping targets’ and on the ‘type of inventory’. The ‘mapping targets’ of the Armenian and Tien Shan catalogues were not the very small landslides as, first, the imagery available in Google Earth does simply not allow for mapping landslides smaller than 1000 m2 and, second, the goal was not to produce complete catalogues for the small-size landslides. The goal was to create an inventory that is complete for the larger and likely more hazardous mass movements in the Lesser Caucasus and in the Tien Shan, while the goal of Malamud et al. [31] was to analyze size-frequency statistics for complete catalogues, including also very small landslide sizes to show that there is that ‘roll-over’, qualifying the fact that the number of landslides does not ‘eternally’ increase with decreasing size. Thus, they could show that below a threshold size of about 600 m2, marking the ‘roll-over’, the number of smaller landslides systematically decreases (for all three analyzed catalogues). Our goal was not to prove that there is such a ‘roll-over’. Actually, there is also one for the Tien Shan and Lesser Caucasus inventories, but for much larger landslide sizes, due to the incompleteness of the catalogues for the smaller landslides; we were mainly interested in the size-frequency distribution for the larger landslides and the corresponding decay or tail (~ −2.3 for the Matossian catalogue, −2.38 for the Georisk catalogue that is close to the −2.4 value obtained by Malamud et al. [31]).
The second reason related to the changing ‘type of inventory’ is more scientifically grounded. Malamud et al. [31] showed that the three analyzed inventories (‘Northridge’, ‘Umbria’ and ‘Guatemala’) were marked by very similar size-frequency distributions—similar decays for larger sizes, similar roll-over position and no shift between the distribution—but those three inventories have one important factor in common: all three are recent event-related inventories, an earthquake that triggered landslides in the Northridge region in 1994 (California), a snowmelt that triggered landslides in Umbria, Italy, and heavy rainfall triggering landslides in Guatemala; mapped landslides were ‘fresh’ landslides. The Armenian and Tien Shan inventories are ‘non-event-related’ inventories. This difference is very important as most landslides are relatively old (some may even be called ‘ancient’ as they most likely occurred thousands of years ago); only a smaller portion of landslides is related to more recent triggering events, earthquakes, snowmelts or particularly wet seasons. Thus, those inventories represent a ‘landslide story’ covering a much longer period than the event-related catalogues. One aspect of this story is that landslides ‘disappear’ with time. This is particularly true for the smaller landslides that are quickly recovered by vegetation, eroded by rivers or covered by other larger landslide deposits. Thus, even if our target had been to map all small landslides in the Lesser Caucasus (as presented here) and in the Tien Shan (as done by Havenith et al. [39]), there would still have been a shift of the probability density function to larger landslides sizes—maybe less pronounced, but still clear—due to the ‘missing’ smaller landslides. Actually, the Mailuu-Suu Valley landslide catalogue (by Schlögel et al. [38]) is a ‘complete’ catalogue, verified by using aerial photographs and by field observations. That catalogue is characterized by values that are closer to those obtained for the Northridge catalogue analyzed by Malamud et al. [31], but there is still a shift towards larger average landslide size values. The Mailuu-Suu Valley landslides are relatively ‘young’, as many developed as a consequence of mining activity during the last century, and as some were triggered or reactivated after an earthquake (M 6.2 at 40 km) in 1992 (see Schlögel et al. [38]). Thus, the intermediate situation of the Mailuu-Suu Valley landslide size-frequency behavior can be explained by a mixture of relatively young event-related slope failures and an older predisposition of mass movement development in that area. Consequently, the average landslide size in Mailuu-Suu Valley of 0.03 km2 is just in between the values presented by Malamud et al. [31] of 0.002–0.003 km2 for the their three analyzed event-based catalogues and those (0.4–0.5 km2) of the ‘non-event-based’ inventories presented here for the Armenian Lesser Caucasus and by Havenith et al. [39] for the Tien Shan.

5.2. Differences in Landslide Extents Recorded in the Matossian and Georisk Catalogues

Most landslides recorded in the Matossian catalogue presented herein were already included in the Georisk catalogue, but the Georisk catalogue contains numerous inputs that were not included in the Matossian inventory. Figure 7b exemplifies the main difference: high-elevation hummocky landforms were mapped as landslides in the Georisk catalogue, whereas we interpreted them as moraine deposits and thus excluded them from the Matossian catalogue. Additionally, numerous (generally smaller) slopes recorded as landslides at lower elevations within the Georisk catalogue lacked characteristic features indicative of landslides during our mapping campaign and were also excluded from the Matossian catalogue. For example, in the Georisk catalogue, scarps were mapped without associated deposits, deposits were mapped without associated scarp zones, or the available imagery did not show any hummocky landforms. As we did not have access to aerial photographs as inputs for landslide mapping (while the Georisk mapping also used those data), some hummocky landforms or scarps may have been missed by using GE, and thus the Matossian catalogue may be incomplete for such typically smaller landslides. It is also possible that the Georisk catalogue used unpublished field data to map some unstable slopes; such data either could not be used for the Matossian catalogue or simply longer exists. Therefore, we stress that the Matossian catalogue only includes landslides identified based on the criteria described in Section 3.
Although many of the same landslides were identified in both catalogues (more than 50% of the Matossian records), the landslide extents in the two inventories are rarely the same. Generally, we observe that the Georisk catalogue identifies well the hummocky landforms within landslide deposits but often does not include the source or main scarp area. We estimate that this probably is due to differences in mapping objectives, that is, areas potentially presenting slope instabilities in the Georisk catalogue versus the entire area affected by mass movement in the Matossian catalogue. Considering the specific objective of the Georisk catalogue, it is understandable why it includes all moraine-like features at higher elevations, as moraines represent potential sources of future landslides. Nonetheless, moraines cannot be considered as landslide features until some sliding phenomenon has been identified; this is why moraines were excluded from the Matossian inventory. We stress that we prioritized precisely mapping the source areas over defining the detailed distal limits of the deposits. The reason for this different focus is that landslide susceptibility mapping employs statistics about the origin of an existing mass movement rather than about its later evolution down the slope (that is, unless incipient movements can be identified or predicted on the basis of other mapped instabilities that developed under similar conditions). As the underlying premise of the Matossian catalogue was that it could later be used for such nation-wide landslide susceptibility mapping, we found it necessary to include scarp areas. However, the usefulness of our new inventory goes beyond the need for adapted inputs for landslide susceptibility assessment. In many cases, landslides were re-mapped to identify characteristic features of the mass movements, particularly those that reflect the origin of the landslides, especially larger ones.

5.3. Direct and Indirect Influence of the Distance to Active Faults on Landslide Occurrence

We estimate that there are direct and indirect influences of active faults on slope stability, the direct influence being related to the likely impact of earthquakes along the mostly (sub)vertical strike-slip faults in the region (and thus with epicenters located very near to the fault traces) on triggering nearby slope failures. This influence certainly concerns zones near faults, not only those directly adjacent to them, as the shaking intensity can be high over a wide area (typically within an elliptical elongated area along the fault). The Garni and Vokhjaberd mass movements represent examples of this wider seismic impact, as the source areas of those landslides do not directly cross the faults but are located at 4 and 8 km from them Garni and Vokhjaberd faults, respectively. We estimate that this wider seismic effect on slope stability can be observed up to 10–15 km from the major faults, as highlighted by the larger normalized landslide density within 0–15 km from faults (Figure 9d).
The indirect influence of active faults on slope stability is related to the presence of deeper, steeper valleys along those faults due to the weakened and fractured fault rocks; such valleys are typically more prone to landslide activity than more distant plateaus and areas marked by gentler morphologies. As fault zones are not always marked by the presence of a single fault, but can include several splayed faults (see the northern part of Figure 9c), such weakened zones can have variable thicknesses. However, beyond the limit of outer sub-faults, the indirect influence of faults via changed morphology and weakened rocks is rapidly reduced within 2–3 km.
Both catalogues detected a high concentration of landslides far from any mapped/known active faults in northeastern Armenia (Figure 9b), whereas the presence of faults clearly increases local landslide susceptibility in all other areas. We suggest that the stronger concentration of landslides in this area indicates the presence of unidentified or inactive faults. Havenith et al. [39] highlighted a similar effect of missed detections in the southern Tien Shan, where an area was classified as weakly susceptible to landslide activity because few landslides had been mapped despite the presence of numerous faults. Later verification revealed that landslide mapping was simply incomplete in that area, which was actually highly susceptible to slope failure, especially along valleys crossed by active faults.

5.4. The Influence of Slope Orientation and Angle on Slope Stability, Considering Changed Morphologies

We observed a peak of landslide densities on slopes oriented 255°–360° in both catalogues. According to Matossian [30], the number of landslides on northwest-facing slopes is about twice that on southeast-facing slopes. This preferred orientation cannot be easily connected with a tectonic influence, as most faults trend NW–SE and valley slopes are oriented either to the southwest or northeast. Therefore, we interpret that the preferred northwest aspect of landslide slopes is most likely due to climatic effects related to the minor impact of sunlight on those slopes, resulting in increased snow accumulation on NNW-oriented slopes, slower snow melting, and wetter soils in general, thus contributing to increased slope destabilization.
Because a large proportion of landslides have occurred relatively far from mapped active faults in northern and northeastern Armenia, the general trend of northwest-oriented landslides is also influenced by the strong climatic effect on slope stability in those relatively wet areas (see the higher average precipitation in that area, Figure A2). For instance, one very large active landslide above the city of Dilijan, north of Lake Sevan, is located on a northwest-oriented slope.
As noted in Section 4.3, many very large landslides have occurred on southwest- or northeast-oriented slopes along NW–SE-trending valleys near active faults. Those deeper valleys formed in fractured near-fault rocks that are more easily eroded than the neighboring massifs, thus creating steeper gradients between valley bottoms and adjacent mountain peaks. Those higher and steeper slopes may thus produce larger mass movements than gentler and shallower valleys. However, such deep and steep valleys are not exclusively formed along the NW–SE-trending active strike–slip faults. In the southeast corner of Figure 10c, a NE–SW-oriented valley, perpendicular to the major Garni fault zone, is clearly marked by such steep and high slopes (note the extensive areas shaded in red, indicating slope angles >30°). However, this valley is not connected to any fault structure and does not host any major landslides in either the Matossian or Georisk inventories, despite having high and steep NW-oriented slopes highlighted above as being susceptible to slope instability. Thus, slope steepness, height, and orientation alone cannot explain landslide susceptibility in the entire Armenian Lesser Caucasus; other examples include deep gorges formed in basaltic rocks (e.g., the canyon near Garni), which are prone to rock falls but generally do not host any larger rockslides. Slope steepness and extent must, therefore, be combined with rock strength to explain the presence of landslides; for example, the young canyon-forming basalts are strong rocks resistant to sliding processes. Weaker rocks are generally found along fault zones, in the northern part of the Lesser Caucasus, and in soft volcanic deposits spread over mountain areas; in the latter case, the slopes are softer and, thus, would not normally be prone to sliding. Landslide density and normalized landslide density (Figure 10d) indicate that landslide susceptibility is almost identical for medium (10°–20°) and steeper (>25°) slopes. Indeed, the medium slopes with soft volcanic deposits are prone to the occurrence of large mass movements, such as those shown in Vokhjaberd and Garni (Figure 5 and Figure 6b).

5.5. The Sizes, Morphologies, and Origins of the Largest Mass Movements: Seismotectonic Influence

Many very large mass movements, such as those in Vokhjaberd and Garni, formed on relatively gentle and long slopes (Figure 11). Interestingly, the scarp of the Garni rockslide developed within quite competent conglomerates containing large rock fragments; those outcropping in the main scarp are neatly cut (see top photograph, Figure 11b), suggesting brittle deformation instead of the creeping gravitational processes expected on gentle slopes. Furthermore, the scarp includes a deep graben structure indicative of an initial rapid movement (see bottom photograph, Figure 11b). Below this graben and above the main landslide body, a basin had formed that probably once contained a lake and is now filled by fine sediments with a relatively flat horizontal surface. The Voghjaberd landslide also presents a clear scarp with brittle deformation structures, such as conjugate faults affecting volcanic sediments (see photograph in Figure 11a), and blocked lakes (although less developed than the basin on the Garni landslide). Certainly, such localized features cannot be mapped from GE imagery due to resolution limitations and their appearance in vertical outcrops, although well-cut scarps and large counter-slopes within the landslide body are observable and have been mapped for dozens of large mass movements. Additionally, the main scarps of most of those very large mass movements developed in the upper parts of the slope, near the upper slope break or even behind the mountain crest, and main scarps of large mass movements that developed in mid-slope locations are rare. Brittle deformation features and the high positions of main scarps were also observed by Havenith et al. [6] for large rockslides in the Tien Shan Mountains, which they interpreted as indicators of seismic triggering. However, this does not mean that the entire landslide as it appears today was induced by a single earthquake. Secondary scarps (e.g., the Garni landslide, Figure 6b) might have formed well after the initial movement, either triggered by later earthquakes or by climatic factors. As noted in Section 4.2, the general seismotectonic context of landslides must be considered before drawing any conclusions on their origin. Therefore, in the Lesser Caucasus, we consider that only large mass movements marked by clear scarps high on slopes within ~10 km of the nearest active fault were likely initially triggered by an earthquake. This leaves open the question of the origin of the larger mass movements with clear scarps high on slopes in northern Armenia, far from any mapped active faults: could there be unidentified active faults that may have induced those mass movements in ancient times, or do old (inactive and therefore undetected) faults contribute to large slope destabilization in that region?
Presently, we cannot answer this question. We can draw the partial conclusion that the effect of seismicity on landslides in the Lesser Caucasus is not always as obvious as one might expect. For instance, Havenith et al. [39] were able to clearly highlight the effect of seismicity on landsliding in the Tien Shan: zones marked by the presence of active faults there also host most landslides, and less seismically active zones (e.g., the Terskey Range south of Lake Issyk Kul) are less prone to slope failure. They suspect that this difference between the seismotectonic influence on slope stability in the Lesser Caucasus and the Tien Shan arises for two reasons. First, the Tien Shan is prone to larger earthquakes than the Lesser Caucasus; Mw 8 events have occurred historically in the Tien Shan, whereas no such large historical events have been recorded in the Lesser Caucasus, despite the longer historical record there. Second, the Tien Shan is crossed by both large strike–slip faults and major thrust faults, whereas all the largest faults in the Lesser Caucasus are mainly strike–slip. Fault mechanism and geometry impacts landslide triggering (and the distribution of seismic shaking in general), which is typically greater for thrust faults. For example, many landslides were triggered by the Wenchuan earthquake and were concentrated and widely distributed atop the activated thrust-fault segments, whereas fewer landslides were triggered near the activated strike–slip fault segment [40]. One reason for the reduced spreading of seismic energy (at the surface) from strike–slip faults is their near vertical dip: a strike–slip fault rupture surface rapidly increases in depth, whereas that of a thrust fault remains shallow over a greater distance from the surface rupture due to the minor inclination of the fault. Additionally, the thrust-related ‘push-up’ effect on slope failure in the hanging wall (marked by a large vertical component of seismic shaking) has been cited as a factor contributing to the large number of landslides triggered by the Wenchuan earthquake [41]. Thus, the predominance of sub-vertical strike–slip faults in the Lesser Caucasus (and, certainly, the low frequency of M > 7 earthquakes) could explain the lesser seismic influence on slope stability there compared to that in the Tien Shan.
This raises the question of whether the lesser seismic influence impacts the size of observed mass movements. Indeed, in the Lesser Caucasus, we did not observe any extremely large rockslide dams (>>1 km3) blocking deep, wide lakes, as was reported for the Sary Chelek rockslide dam in the Tien Shan [6]; the largest rockslide dams found in the Lesser Caucasus have volumes on the order of tens of millions of cubic meters. However, the Lesser Caucasus hosts a type of giant mass movement, for which there is no equivalent in the Tien Shan (to our knowledge): the collapse of the northern shore of Lake Sevan, bordered by the PSSF [22]. This mass movement is extremely large, likely exceeding 5 km3, but is not recorded in either the Matossian or Georisk catalogues as it is mostly submerged; only the ~3.5-km-long scarp is visible. Thus, although gigantic lake outbursts induced by landslide dam breaches are not expected in the Lesser Caucasus, a tsunami caused by a future collapse of a shore segment (and related subaquatic parts) of Lake Sevan is possible.
Finally, the impact volcanic activity/structures on slope stability remains uncertain. Matossian [30] could not identify any particular influence of volcanic structures on landslide development because many volcanoes form plateau-like landscapes that are not prone to slope instability (but do host moraines that are susceptible to sliding). Our mapping based on GE imagery provided no clear evidence of partial volcanic flank collapses (as observed at Ararat volcano [25]) on Aragats volcano or along the central Ghegham volcanic ridge. However, a semi-circular, nearly 10-km-long scarp marks the top of the eastern flank of Ishkhanasar volcano in southeast Armenia (see the large volcanic complex in the southeastern part of Figure 2a), and Lake Sev is located immediately below this scarp. We have not visited or studied this site in detail, and could not find any literature data on the formation of this scarp and lake as a consequence of flank collapse. Therefore, at present, we can only speculate that the scarp is related to a partial flank collapse. If true, the partial flank collapse of Ishkhanasar volcano would represent the largest mass movement (>10–15 km3) in the Lesser Caucasus.

6. Conclusions

The Lesser Caucasus is affected by multiple hazards related to earthquakes, volcanoes (some active during the Holocene), and landslides. Generally, two types of landslides occur in the Lesser Caucasus: large mass movements of seismic origin and less massive landslides of climatic origin or due to human activities. These landslides can be reactivated by earthquakes and climatic factors, and, more recently, by human activity.
The goal of this work was to identify all major landslides in the Armenian Lesser Caucasus and to perform a preliminary landslide susceptibility analysis on the basis of different analyses and multiple input parameters. We performed spatial analyses using two landslide catalogues: the Georisk catalogue [15] and the Matossian catalogue generated during this work by mapping landslides based on Google Earth® imagery and supported by local field work. Size-frequency analysis revealed that both catalogues are incomplete, as they contain very few smaller landslides, although the Georisk catalogue seems to be less complete.
We compared the two catalogues and drew the following conclusions:
  • Although they both cover all of Armenia, the Georisk and Matossian catalogues include 2257 and 1036 landslides, respectively, likely due to the resolution of Google Earth® imagery and soil cover;
  • The spatial distribution of landslides throughout Armenia is similar in both catalogues;
  • Both catalogues were created with different objectives: the Georisk catalogue outlines landslide deposits but does not include source or main scarp areas in landslide extents, whereas the Matossian catalogue includes both. Landslides in the Matossian catalogue were mapped more carefully, as it is intended to be used for landslide morphological and susceptibility analyses;
  • Moraine deposits were excluded from the Matossian catalogue at elevations >3000 m.
We performed spatial analysis to study the distribution of landslides with respect to the distance to active faults and to local morphological factors (slope angle and orientation), in order to determine the parameters that most influence slope instabilities in the Lesser Caucasus. Our results show that several parameters influence slope instability and must be taken into account for landslide susceptibility assessments in the Lesser Caucasus:
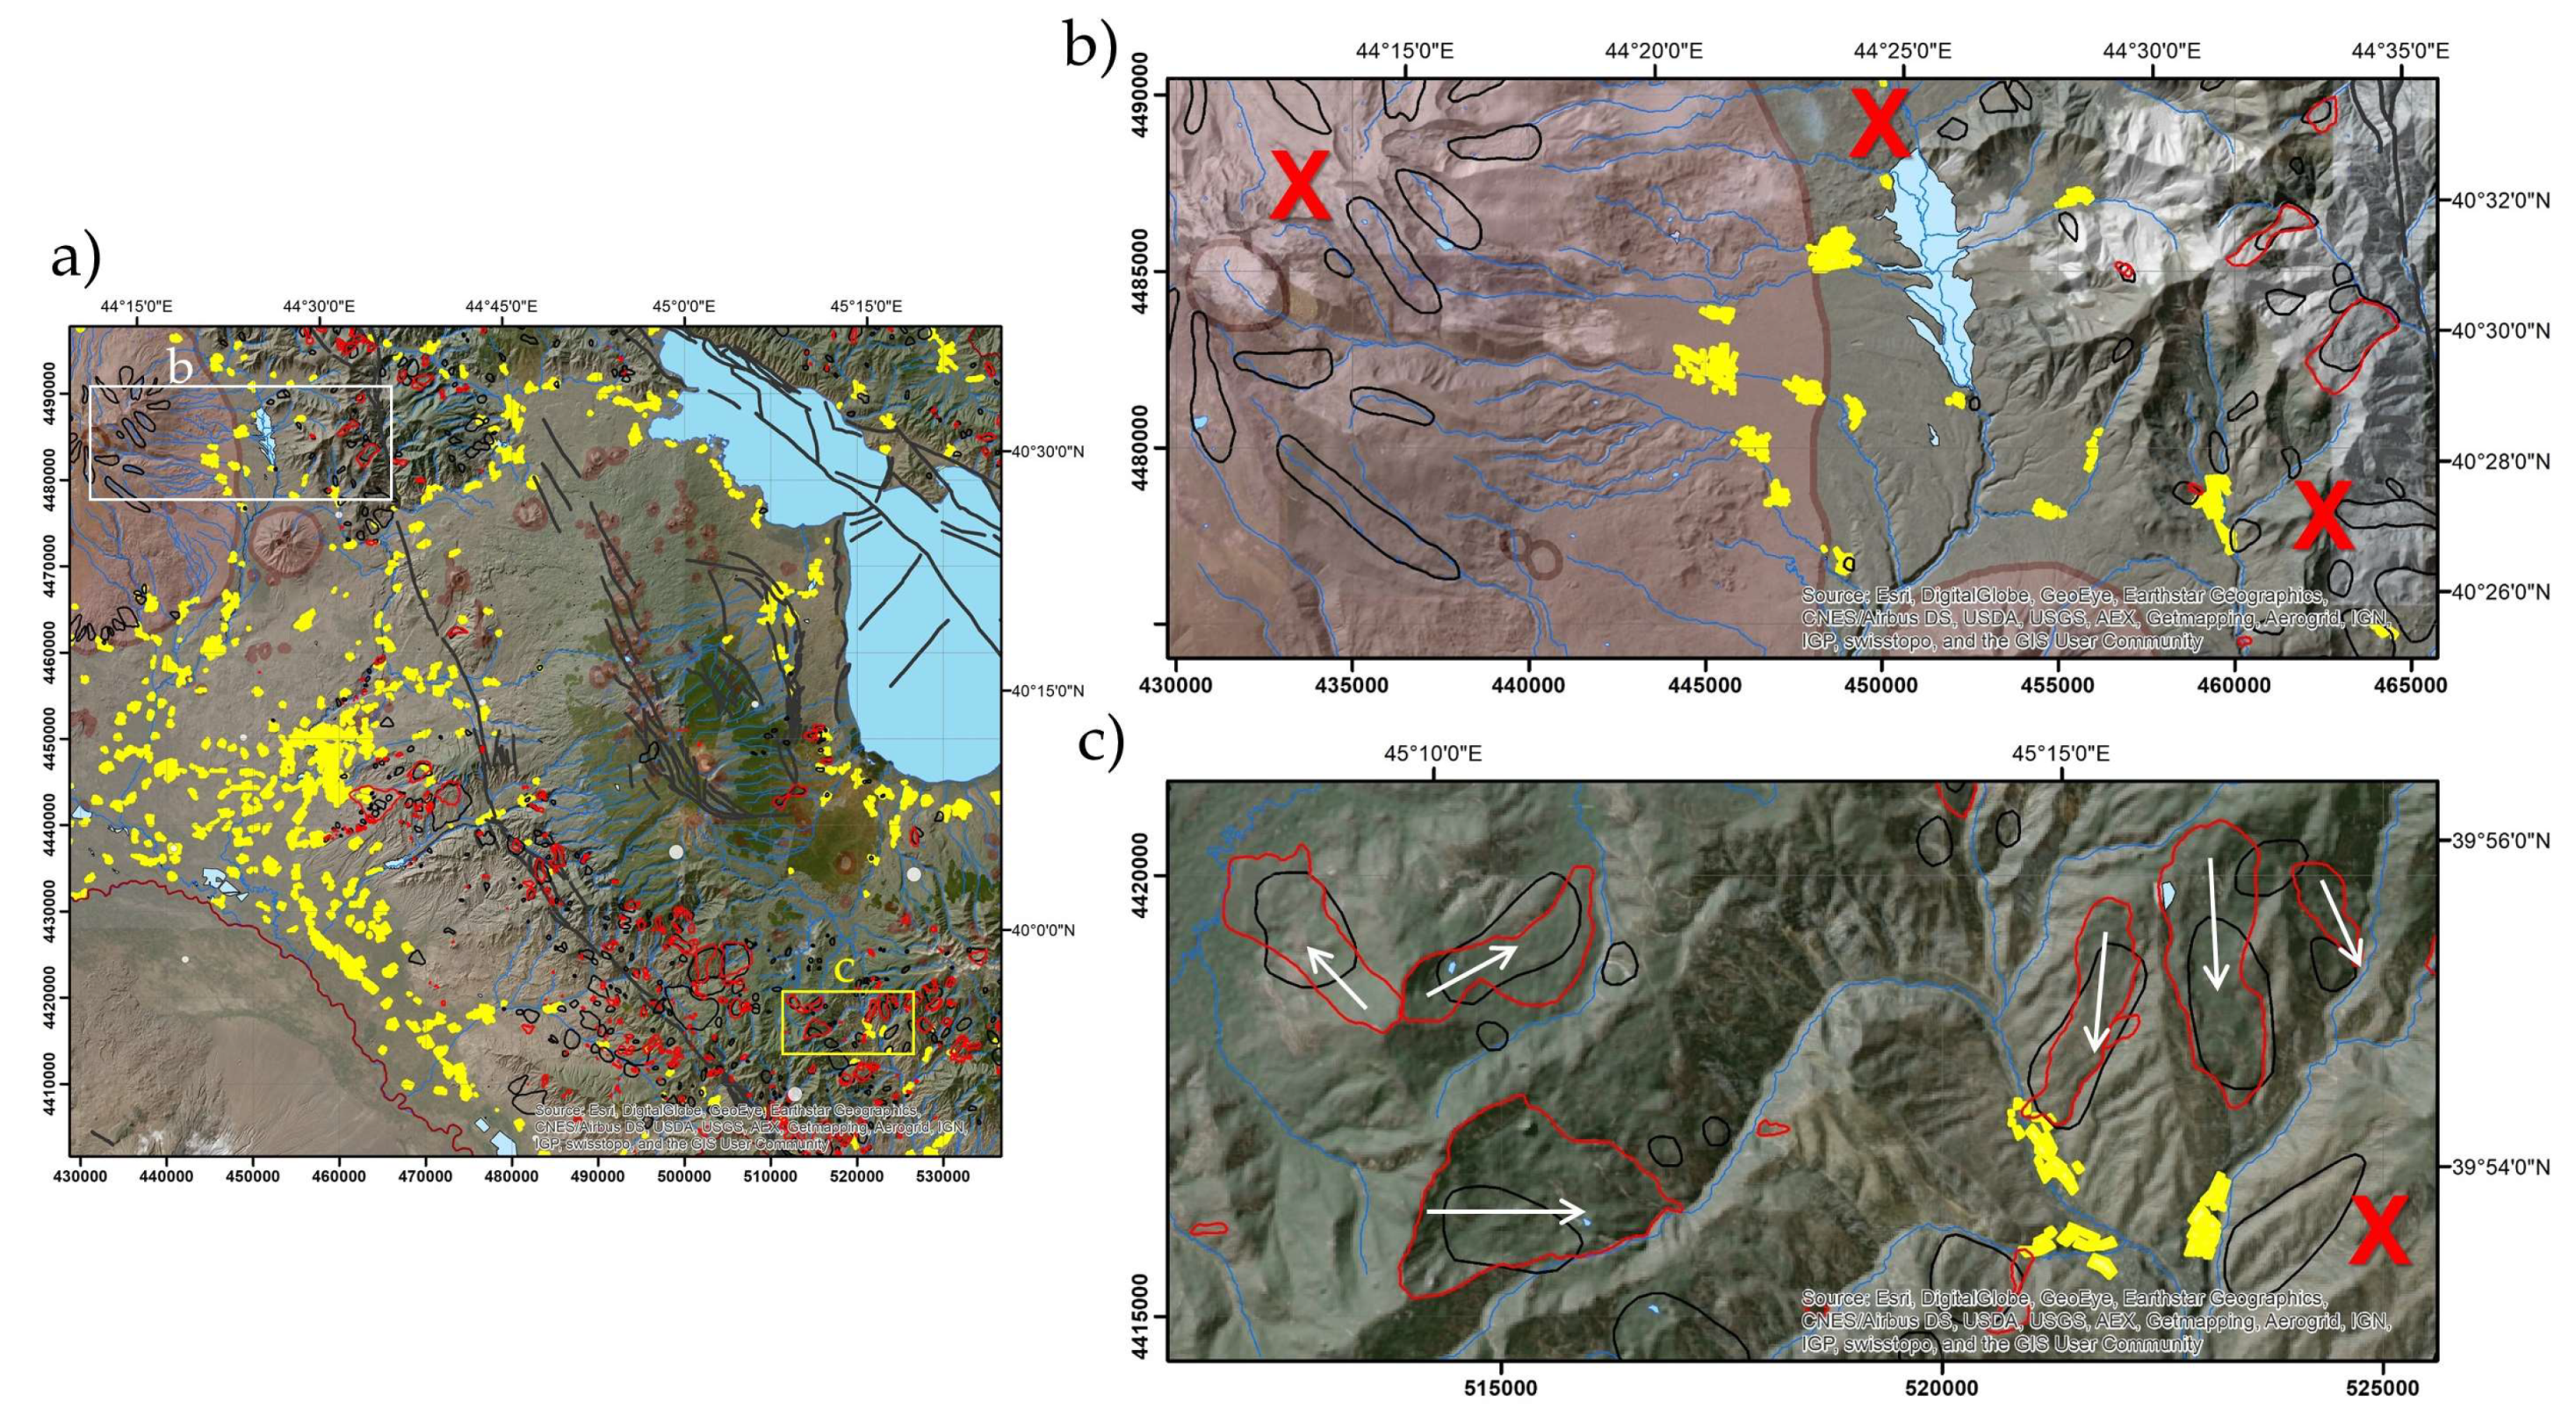
  • The distance to active faults has direct and indirect influences on landslide density. The direct influence is related to the triggering of slope failures by earthquakes occurring along nearby faults (mostly vertical strike–slip faults; e.g., the Garni and Vokhjaberd landslides). We estimate that earthquakes in the Lesser Caucasus have a relatively wide effect on landslides, and can trigger them within 10–15 km of activated fault segments. Within 2–3 km of active faults, landslides are indirectly influenced by the presence of deep and steep along-fault valleys. These valleys are induced by fault activity and are prone to landslides due to their steep, deep morphology and the presence of locally weakened fault rocks (e.g., along the northern part of the Garni Fault);
  • Climatic effects, such as increased average precipitation, may increase slope instabilities. For example, the relatively wet area around the city of Dilijan (northern Armenia) is characterized by softer soils, and a large proportion of landslides there occur far from known active faults. The high landslide density in this area, and the preferential occurrence of slope failures on wetter northwestern slopes, may be at least partially explained by climatic effects.
  • Lithology, particularly weaker rocks in fault zones or soft volcanic deposits, could also explain the occurrence of landslides on gentler slopes (e.g., the Garni and Vokhjaberd landslides).
Future studies should focus on the high concentration of landslides in northern Armenia, which are far from any mapped faults. Open questions include the influence of possible unidentified active faults or ancient inactive faults on the increased slope failure potential in that region. The impact of volcanoes and volcanic deposits on landslide susceptibility and the possible origin of the semi-circular scarp on Ishkhanasar Volcano should be carefully analyzed. Finally, quantitative landslide susceptibility analysis in Armenia remains to be completed, and numerical models are needed to assess the probability of a future shore segment failure along Lake Sevan and the related tsunamigenic potential.

Author Contributions

Conceptualization, H.-B.H.; Investigation, A.O.M. and H.-B.H.; Resources, H.B., A.A., H.I., M.G. and H.-B.H.; Supervision, H.-B.H.; Writing—original draft, A.O.M. and H.-B.H.; Writing—review & editing, H.B., A.A. and H.I. All authors have read and agreed to the published version of the manuscript.

Funding

This research received no external funding.

Acknowledgments

This work was performed with the help of Arkady Karakhanian, who passed away in autumn 2017. We also thank Sergey Balasanyan (shown in Figure 5c) and Khachatur Makaryan, who assisted with fieldwork in September 2016.

Conflicts of Interest

The authors declare no conflict of interest.

Appendix A

Figure A1. Geological section of the Black Sea Caucasus region (along red line shown in the geological map in Figure 1, modified after [7,8]).
Geosciences 10 00111 g0a1
Figure A2. Map of the Armenian part of the Lesser Caucasus with the same inputs as Figure 2, overlaid on the interpolated annual average precipitation map of Armenia (yellowish-green colours for annual precipitation <500 mm, bluish colours for maximum amounts of 1000 mm in the NW Aragats region).
Geosciences 10 00111 g0a2

References

  1. Boynagryan, V. Landslides in Armenia. Rom. J. Geogr. 2008, 53, 197–208. [Google Scholar]
  2. Grigoryan, M.A.; Aleksanyan, G.M.; Boyakhchyan, T.N.; Gevorgyan, L.A.; Lazarov, A.D.; Minchev, D.P. Digital Elevation Models of territories under risk in Caucasus Region-Armenia. In Proceedings of the International Research Conference on Interaction of Theory and Practice: Key Problems and Solutions, Burgas, Bulgaria, 24–25 June 2011. [Google Scholar]
  3. JICA; MoUD. Landslides in Armenia; Technical Bulletin of Landslides in Armenia: Yerevan, Armenia, 2005; p. 81.
  4. Karakhanian, A.S.; Baghdasaryan, H. Natural dams in Armenia: Landslide hazard and risk assessment. Ital. J. Eng. Geol. Environ. 2006, 1, 93–94. [Google Scholar]
  5. Strom, A.; Abdrakhmatov, K. Rockslides and Rock Avalanches of Central Asia: Distribution, Morphology and Internal Structure; Elsevier: New York, NY, USA, 2018; p. 458. [Google Scholar]
  6. Havenith, H.B.; Strom, A.; Torgoev, I.; Torgoev, A.; Lamair, L.; Ischuk, A.; Abdrakhmatov, K. Tien Shan geohazards database: Earthquakes and landslides. Geomorphology 2015, 249, 16–31. [Google Scholar] [CrossRef]
  7. Avagyan, A.; Sosson, M.; Philip, H.; Karakhanian, A.; Rolland, Y.; Melkonyan, R.; Rebai, S.; Davtyan, V. Neogene to Quaternary stress field evolution in Lesser Caucasus and adjacent regions using fault kinematics analysis and volcanic cluster data. Geodin. Acta 2005, 18, 401–416. [Google Scholar] [CrossRef] [Green Version]
  8. Sosson, M.; Stephenson, R.; Sheremet, Y.; Rolland, Y.; Adamia, S.; Melkonian, R.; Kangarli, T.; Yegorova, T.; Avagyan, A.; Galoyan, G.; et al. The Eastern Black Sea-Caucasus region during the Cretaceous: New evidence to constrain its tectonic evolution. C. R. Geosci. 2016, 348, 23–32. [Google Scholar] [CrossRef]
  9. McKenzie, D.P. Active tectonics of the Mediterranean region. Geophys. J. R. Astron. Soc. 1972, 30, 109–185. [Google Scholar] [CrossRef] [Green Version]
  10. Philip, H.; Avagyan, A.; Karakhanian, A.; Ritz, J.-F.; Rebai, S. Slip rates and recurrence intervals of strong earthquakes along the Pambak-Sevan-Sunik Fault (Armenia). Tectonophysics 2001, 343, 205–232. [Google Scholar] [CrossRef]
  11. Karakhanian, A.S.; Trifonov, V.G.; Philip, H.; Avagyan, A.; Hessami, K.; Jamali, F.; Bayraktutan, S.; Bagdassarian, H.; Arakelian, S.; Davtian, V.; et al. Active faulting and natural hazards in Armenia, eastern Turkey and northwestern Iran. Tectonophysics 2004, 380, 189–219. [Google Scholar] [CrossRef]
  12. Avagyan, A.; Sosson, M.; Karakhanian, A.; Philip, H.; Rebai, S.; Rolland, Y.; Melkonyan, R.; Davtyan, V. Recent tectonic stress evolution in the Lesser Caucasus and adjacent regions. In Sedimentary Basin Tectonics from the Black Sea and Caucasus to the Arabian Platform; Sosson, M., Kaymakci, N., Stephenson, R.A., Bergerat, F., Starostenko, V., Eds.; Geological Society: London, UK, 2010; Volume 340, pp. 393–408. [Google Scholar]
  13. Paffingolts, K.N. Essay on the Geology of Caucasus; Typography of the Academy of Science of Armenian SSR: Yerevan, Armenia, 1959; p. 506. [Google Scholar]
  14. Ambraseys, N.N.; Jackson, J.A. Faulting associated with historical and recent earthquakes in the Eastern Mediterranean region. Geophys. J. Int. 1998, 133, 390–406. [Google Scholar] [CrossRef] [Green Version]
  15. Japan International Cooparation Agency (JICA); Georisk CJSC (Armenia). Joint Project: The Study on Landslide Disaster Management in the Republic of Armenia; Inventory Database Creation: Yerevan, Armenia, 2006. Available online: https://www.google.com.sg/url?sa=t&rct=j&q=&esrc=s&source=web&cd=1&cad=rja&uact=8&ved=2ahUKEwjKp-LP7qfoAhUCD6YKHR4CAqkQFjAAegQIBBAB&url=http%3A%2F%2Fopen_jicareport.jica.go.jp%2Fpdf%2F11834660.pdf&usg=AOvVaw2NbdR_8qaKWvIc0I_6DvpE (accessed on 20 March 2020).
  16. Philip, H.; Cisternas, A.; Gvishiani, A.; Gorshkov, A. The Caucasian actual example of the initial stage of continental collision. Tectonophysics 1989, 161, 1–21. [Google Scholar] [CrossRef]
  17. Karakhanian, A.S.; Djrbashyan, R.T.; Trifonov, V.G.; Philip, H.; Ritz, J.F. Active faults and strong earthquakes of the Armenian Upland. In Historical and Prehistorical Earthquakes in the Caucasus; Giardini, D., Balassanian, S., Eds.; Kluwer Academic Publishing: Dordrecht, The Netherlands, 1997; pp. 181–187. [Google Scholar]
  18. Karakhanian, A. The active faults of the Armenian Upland. In Proceedings of the Scientific Meeting on Seismic Protection, Dipartimento per la Geologia e le Attivita estrattive, Venice, Italy, 12–14 May 1993; pp. 88–94. [Google Scholar]
  19. Shebalin, N.V.; Nikonov, A.A.; Tatevosian, R.E.; Mokrushina, N.G.; Petrossian, A.E.; Kondorskaya, N.V.; Khrometskaya, E.A.; Karakhanian, A.S.; Harutunian, R.A.; Asatrian, A.O.; et al. Caucasus test-area strong earthquake catalogue. In Historical and Prehistorical Earthquakes in the Caucasus; Giardini, D., Balassanian, S., Eds.; Kluwer Academic Publishing: Dordrecht, The Netherlands, 1997; pp. 210–223. [Google Scholar]
  20. Avagyan, A.; Sosson, M.; Sahakyan, L.; Sheremet, Y.; Vardanyan, S.; Martirosyan, M.; Muller, C. Tectonic evolution of the Northern margin of the Cenozoic Ararat basin, Lesser Caucasus, Armenia. J. Pet. Geol. 2018, 41, 495–512. [Google Scholar] [CrossRef]
  21. Nikonov, A.; Nikonova, K. The strongest earthquake in the Transcaucasus, September 30, 1139. Vopr. Ingenernoj Seismol. 1986, 27, 152–183. [Google Scholar]
  22. Karakhanian, A.; Arakelyan, A.; Avagyan, A.; Sadoyan, T. Aspects of the seismotectonics of Armenia: New data and reanalysis. In Tectonic Evolution, Collision, and Seismicity of Southwest Asia: In Honor of Manuel Berberian’s Forty Years of Research Contributions; Sorkhabi, R., Ed.; Geological Society of America: Boulder, CO, USA, 2016; Volume 525, pp. 1–32. [Google Scholar]
  23. Balassanian, S.Y.; Melkoumian, M.G.; Arakelyan, A.R.; Azarian, A.R. Seismic risk assessment for the territory of Armenia and strategy of its mitigation. Nat. Hazards 1999, 20, 43–55. [Google Scholar] [CrossRef]
  24. Aspinall, W.P.; Mallard, D.J.; Skipp, B.O.; Woo, G. Seismic Hazard Assessment for the Armenian Nuclear Power Plant Site; The Armenian Nuclear Power Plant: Yerevan, Armenia, 2007; p. 270. [Google Scholar]
  25. Karakhanian, A.; Djrbashian, R.; Trifonov, V.; Philip, H.; Arakelian, S.; Avagian, A. Holocene historical volcanism and active faults as natural risk factors for Armenia and adjacent countries. J. Volcanol. Geotherm. Res. 2002, 113, 319–344. [Google Scholar] [CrossRef]
  26. Stepanian, V. Earthquakes in the Armenian Upland and Adjacent Areas; Publishing House Hayastan: Yerevan, Armenia, 1964; p. 247. [Google Scholar]
  27. Karakhanian, A.; Jrbashyan, R.; Trifonov, V.; Philip, H.; Arakelian, S.; Avagyan, A.; Baghdasaryan, H.; Davtian, V.; Ghoukassyan, Y. Volcanic hazards in the region of the Armenian Nuclear Power Plant. J. Volcanol. Geotherm. Res. 2003, 126, 31–62. [Google Scholar] [CrossRef]
  28. Dewey, J.F.; Hempton, M.R.; Kidd, W.S.F.; Saroglu, F.; Sengör, A.M.C. Shortening of continental lithosphere: The neotectonics of Eastern Anatolia–A young collision zone. In Collision Tectonics; Coward, M.P., Riea, A.C., Eds.; Geological Society: London, UK, 1986; Volume 19, pp. 1–36. [Google Scholar]
  29. Yilmaz, V.; Guner, Y.; Saroglu, F. Geology of the Quaternary volcanic centers of the East Anatolia. J. Volcanol. Geotherm. Res. 1998, 85, 173–210. [Google Scholar] [CrossRef]
  30. Matossian, A.O. Identification of Giant Mass Movements in the Lesser Caucasus and Assessment of Their Spatial Relationship with Major Fault Zones and Volcanoes. Master’s Thesis, University of Liège, Liège, Belgium, 2017. [Google Scholar]
  31. Malamud, B.D.; Turcotte, D.L.; Guzzetti, F.; Reichenbach, P. Landslide inventories and their statistical properties. Earth Surf. Process. Landf. 2004, 29, 687–711. [Google Scholar] [CrossRef]
  32. Turcotte, D.L. Fractals and Chaos in Geology and Geophysics; Cambridge University Press: Cambridge, UK, 1997; p. 398. [Google Scholar]
  33. Jibson, R.W.; Harp, E.H.; Michael, J.M. A Method for Producing Digital Probabilistic Seismic Landslide Hazard Maps: An Example from the Los Angeles, California Area; US Geological Survey: Virginia Reston, VA, USA, 1998; pp. 98–113.
  34. Havenith, H.B.; Strom, A.; Caceres, F.; Pirard, E. Analysis of landslide susceptibility in the Suusamyr region, Tien Shan: Statistical and geotechnical approach. Landslides 2006, 3, 39–50. [Google Scholar] [CrossRef]
  35. Tanyas, H. Rapid Assessment of Earthquake-Induced Landslides. Ph.D. Thesis, University of Twente, Enschede, The Netherlands, 2019. [Google Scholar]
  36. Lombardo, L.; Bakka, H.; Tanyas, H.; van Westen, C.; Mai, P.M.; Huser, R. Geostatistical modeling to capture seismic-shaking patterns from earthquake-induced landslides. J. Geophys. Res. Earth Surf. 2019, 124, 1958–1980. [Google Scholar] [CrossRef]
  37. Ledworowska, A. Analysis of the Landslide Susceptibility in Armenia with GIS and Data Mining Methods. Master’s Thesis, Technical University of Berlin, Berlin, Germany, 2019. [Google Scholar]
  38. Schlögel, R.; Torgoev, I.; de Marneffe, C.; Havenith, H.-B. Evidence of a changing distribution of landslides in the Kyrgyz Tien Shan, Central Asia. Earth Surf. Process. Landf. 2011, 36, 1658–1669. [Google Scholar] [CrossRef]
  39. Havenith, H.B.; Torgoev, A.; Schlögel, R.; Braun, A.; Torgoev, I.; Ischuk, A. Tien Shan Geohazards Database: Landslide susceptibility analysis. Geomorphology 2015, 249, 32–43. [Google Scholar] [CrossRef]
  40. Gorum, T.; Fan, X.M.; van Westen, C.J.; Huang, R.Q.; Xu, Q.; Tang, C.; Wang, G.H. Distribution pattern of earthquake-induced landslides triggered by the 12 May 2008 Wenchuan earthquake. Geomorphology 2011, 133, 152–167. [Google Scholar] [CrossRef]
  41. Yin, Y.; Wang, F.; Sun, P. Landslide hazards triggered by the 2008 Wenchuan earthquake, Sichuan, China. Landslides 2009, 6, 139–152. [Google Scholar] [CrossRef]
Figure 1. Structural map of the Black Sea Caucasus region. The red line shows the location of the geological section presented in Figure A1. The black dashed rectangle outlines the Armenian geohazard database map shown in Figure 2 (modified after [7,8]).
Geosciences 10 00111 g001
Figure 2. Maps of the Armenian part of the Lesser Caucasus indicating major lakes and rivers (blue), active faults (black lines), earthquake epicenters (semi-transparent white circles with radii indicating earthquake magnitude), landslides recorded in the Matossian (red polygons) and the 2006 Georisk [15] (black polygons) catalogues, and (a) volcanoes (brown polygons) or (b) populated places (yellow). The 28 m resolution SRTM DEM base layer is colored for elevation in (a) and presented as a hillshade in (b).
Geosciences 10 00111 g002
Figure 3. Active faults and historical earthquakes (marked by elliptic epicentral zones) in Armenia, southern Georgia, western Azerbaijan, northern Iran, and eastern Turkey (modified from [9]; we revised the date of the event in the eastern part of the PSSF to 1139 because it was incorrectly reported as 1319 in the original map). The legend indicates faults, earthquakes, and volcanic features as: 1, strike-slip faults; 2, normal faults; 3, thrust faults; 4, epicenters of strong earthquakes; and 5, volcanic deposits associated with Holocene and historical seismically triggered eruptions. Faults are labelled as: GF, Garni Fault; PSSF, Pambak-Sevan-Syunik Fault; ESF, Zheltorechensk-Sarighamish Fault; AF, Akerin Fault; Af, Akhourian Fault; MF, Maku Fault; NF, Nakhichevan Fault; DF, Dogubayazet Fault; GSKF, Gailatu-Siah–Cheshmeh-Khoy Fault; SF, Sardarapat Fault; and PDF, Parackar-Dvin Fault.
Geosciences 10 00111 g003
Figure 4. Maps of Armenia showing the distribution of landslides within the (a) Matossian, (b) Georisk, and (c) both catalogues (Matossian and Georisk catalogues in red and black polygons, respectively). Enlarged views show the regions (d) east-northeast of Aragats Volcano (pink shaded area) and (e) east of Yerevan, with landslides mapped from both the Matossian and Georisk catalogues in red and black, respectively. The DEM shown in (c) is the 28-m-resolution SRTM DEM, whereas the hillshade maps in (d) and (e) are derived from the 11-m-resolution TanDEM-X DEM. The yellow square in (e) outlines the area shown in Figure 5a.
Geosciences 10 00111 g004
Figure 5. (a) The Vokhjaberd and Garni landslides, examples of ancient landslides of likely seismic origin near Yerevan. (b) Mapped morphological features of the Vokhjaberd landslide (scarp in the northeast and internal scarps in the central part, with damaged zones shown in red). (c) An example of a damaged house at the location indicated in (d). (d) Map showing the scarp zone in light blue-green and the active part of the landslide in green-yellow.
Geosciences 10 00111 g005
Figure 6. Examples of landslides identified in the present Matossian catalogue (based on data provided by DigitalGlobe and Google Earth®) representative of the criteria used to identify landslides. Landslide features are indicated as: 1, main scarp (outlined in white); 2, main landslide body (outlined in black, with secondary internal scarps indicated by white lines); and 3, lakes. (a) The Lanjanist landslide, showing a change of surface curvature. The landslide length (measured from the upper part of the scarp to the most distal part of the landslide body) is about 2 km. (b) The southern part of the Garni landslide, showing a secondary scarp and hummocky landforms in the mass deposit. Landslide length as shown, ~1 km (although the entire mass movement determined from Figure 5a reaches 2.5 km). (c) A landslide north of Rindr village, showing the presence of a main scarp, hummocky landforms, and a lake. Landslide length, ~3.5 km. (d) Aghavnadzor landslide dam, showing the main scarp, minor internal scarps, hummocky landforms, and a lake). Landslide length, ~1 km. (e) Margahovit landslide, showing a change of vegetation (the unvegetated area corresponds to the recent reactivation). Landslide length, ~4 km. (f) Khachik landslide, a recent landslide showing the main scarp with secondary internal scarps and transverse cracks. Landslide length, ~0.5 km.
Geosciences 10 00111 g006
Figure 7. Major differences between landslides recorded in the Matossian catalogue (red polygons) and the Georisk catalogue (black polygons). (a) The generalized map shows the locations of (b) and (c). In (b) and (c), ‘X’ marks zones where morphologies recorded as landslides in the Georisk catalogue were not considered as such in the Matossian catalogue. (b) Near Aragats volcano, Georisk landslides were excluded from the Matossian catalogue because we interpreted the morphologies as representative of moraine material (especially at elevations above 3000 m). (c) Comparison of Matossian and Georisk landslide outlines shows that the latter include the landslide deposits, but often not the scarp areas.
Geosciences 10 00111 g007
Figure 8. Size-frequency statistics for the Matossian (red) and Georisk (black) catalogues. Power law fits to the tails of the probability density distributions (solid straight lines) have exponents of −2.3 and −2.38 for the Matossian and Georisk catalogues, respectively.
Geosciences 10 00111 g008
Figure 9. Landslide distribution with respect to their distance to faults. (a) General map of Armenia, and enlarged views of (b) the northwestern zone and (c) the area east of Aragats volcano. The GF (west) and PSSF (east) fault areas are indicated in each map. (d) Landslide density (y-axis) as a function of the distance to the nearest active fault: the landslide density LDdist represents the ratio of the landslide areas within a certain distance class (in meters) compared to the entire area covered by mass movements, whereas the normalized landslide density NLDdist represents the same ratio normalized by the ratio of the distance class area divided by the total map area.
Geosciences 10 00111 g009
Figure 10. Landslide distribution with respect to local slope. (a) General map showing the locations of maps (a) and (c). (b) Enlarged view of the area to the east of Aragats volcano, showing the GF (west) and PSSF (east). Arrows mark zones atop Aragats where landslides recorded in the Georisk catalogue occur on very gentle slopes; these deposits are, instead, most likely of glacial origin. (c) Enlarged view of the area to the east of Yerevan, including part of the Ghegham volcanic ridge in the east. (d) Landslide density as a function of local slope. Landslide density represents the ratio of landslide areas within a certain slope class compared to the entire area covered by mass movements, whereas the normalized landslide density represents the same ratio normalized by the ratio of the class area divided by the total map area.
Geosciences 10 00111 g010
Figure 11. Indicators of brittle deformation during landslide movements that suggest possible seismic origins. (a) Morphological map of the Vokhjaberd landslide, indicating the location of outcrops presenting normal faulting related to gravitational movements. (b) Morphological map of the Garni landslide, indicating the graben structure below the main scarp (view towards the west, lower photograph) and of an outcrop along the main scarp presenting breccia and neatly cut pebbles (top photograph). Photographs taken on 15 September 2016.
Geosciences 10 00111 g011
Table 1. Comparison of landslide distribution parameter values from several inventories: Matossian, Georisk, Northridge inventory (Malamud et al. [31]), Mailuu-Suu Valley inventory (Schlögel et al. [38]) and Tien Shan inventory (Havenith et al. [39]).
Inventory/ParameterMatossian/GeoriskNorthridge InventoryMailuu-Suu Valley Inventory 1Tien Shan Inventory
Probability density value (1/m2) for landslide size 105 m2~105/
~105
~ 3 × 108=0.0002/208
=106
~ 5 × 10⁶
Total number of landslides1036/
2257
11111~2083460
Total investigated surface area (km2)~30,000~10,000~150~400,000
Total landslide area
(km2)
605/
1220
236.51330
Mean landslide area
(km2)
0.5/
0.5
0.0020.030.4
1 Schlögel et al. [38] presented frequency-density functions for analyzed landslides; thus, their frequency-density values have to be divided by the total number of analyzed landslides, which is 208.

