Article

Complex of Geophysical Studies of the Seyakha Catastrophic Gas Blowout Crater on the Yamal Peninsula, Russian Arctic

by
Vasily Bogoyavlensky
1,*,
Igor Bogoyavlensky
1,2,
Roman Nikonov
1,2 and
Aleksei Kishankov
1,2
1
Oil and Gas Research Institute of the Russian Academy of Sciences (OGRI RAS), 3, Gubkina St., 119333 Moscow, Russia
2
Department of Geoecology, Gubkin Russian State University of Oil and Gas (National Research University), 65, Leninsky Prospekt, 119991 Moscow, Russia
*
Author to whom correspondence should be addressed.
Geosciences 2020, 10(6), 215; https://doi.org/10.3390/geosciences10060215
Submission received: 8 April 2020 / Revised: 29 May 2020 / Accepted: 31 May 2020 / Published: 3 June 2020
(This article belongs to the Special Issue Gas Emissions and Crater Formation in Arctic Permafrost)

Abstract

:
This article describes the main results of two Arctic expeditions in 2017–2018 to study the Seyakha Crater in the north of Western Siberia, Yamal Peninsula. It was formed on a place of a pingo-like feature (PLF) by huge blowout, self-ignition, and explosion of gas on 28 June 2017. In 2018, for the first time, the integration of geophysical studies on the Yamal Peninsula revealed in detail an Arctic gas-blowout crater within a river channel and adjacent land with permafrost. On the basis of unmanned aerial vehicle photography, echo sounding, and ground penetrating radar survey data processing, a 3D digital elevation model (DEM) of the crater and the structure of near-surface deposits was created. A previously unknown uplift inside the permafrost layers, probably connected with the processes of gas chamber formation, was revealed. A long period of continuous gas emission (mainly, biogenic methane) from the Seyakha C11 Crater (2017–2019) and other existing data show evidence for a gas-dynamic mechanism of the PLF growth and a volcanic type of eruption.

1. Introduction

The presence of cryolithosphere and permafrost (PF) in most parts of Russian territory (about two thirds) has caused major problems for human activities, the construction of living and industrial objects, and the development of hydrocarbon fields. Oil and gas prospecting as well as the construction and maintenance of objects in the development of hydrocarbon fields pose significant risks for personnel and ecosystems, especially in the Arctic.
The development of hydrocarbon resources in the Arctic and Subarctic regions involves risks associated with the harsh land and climatic conditions and the presence of cryohydro- and cryolithospheres, which have been covered in numerous studies, databases, and geoinformation systems for different regions of the world [1,2,3,4,5,6,7,8,9,10,11,12,13,14,15,16,17,18]. For the last decade, this topic has been actively studied by Russian researchers [19,20,21,22,23,24,25,26,27,28,29,30,31,32,33,34,35,36,37,38,39,40,41,42,43,44,45,46,47,48].
On a megaregional scale, PF and gas hydrates, which are widespread in the Arctic onshore and offshore areas [6,31,38,39,49], constrain permanent degassing of the Earth, acting as seals for subvertical gas migration. This is why under thick PF (also inside PF) and/or gas hydrate layers, huge free gas volumes are accumulated, forming abnormally high formation pressures [19,50], which can break seals and eject large volumes of gas with massive fragments of frozen ground and ground ice.
The combination of separate dangerous events increases the risk of emergencies and have often led to disasters in USSR territory including the Arctic zone, and also in the north of Canada and other regions of the world [11,19,25,26,30]. In many cases, the volumes of ejected and burned hydrocarbon compounds were much larger than those at the disaster in the Gulf of Mexico in 2010 [51]. For example, during the 6.5 years of catastrophic blowout of the hydrocarbon mixture (mainly, gas) on the Kumzha Field (1980–1987) in the delta of the Pechora River for 2362 days, not less than 3.5 billion m3 of gas and 0.2 million tons of condensate (in total, more than 3.5 million tons of oil equivalent) was blown, evaporated, and burned [30].
In recent decades, new risks have appeared in the Arctic that are connected with global warming, causing processes of PF degradation and gas hydrate dissociation. The stability of gas hydrates strongly depends on even small changes of temperature [52]. PF melting and gas hydrate dissociation processes increase volumes of methane emissions from the cryolithosphere.
For more than 10 years, the authors of this research have been collecting and analyzing data on different natural and man-made dangerous events that pose threats to the lives and activities of humans, mainly focusing on regions of hydrocarbon resource development in the Arctic and the World Ocean. Most dangerous events are connected with earthquakes, landslides, stratovolcanoes, mud volcanoes, oil and gas seeps, formation and dissociation of gas hydrates, etc. [5,6,19,24,25]. For revealed dangerous objects, monitoring is conducted during their occurrence and liquidation and their impacts are also analyzed. Data from remote sensing (RS) including space and aerial observations and the results of field studies are actively used for such research. Initial and resulting materials are uploaded to the created geoinformation system “The Arctic and the World Ocean” [19,20,21,25] and are being constantly updated.
Since 2014, gas blowouts with the formation of giant craters on land and the bottoms of thermokarst lakes in the Russian Arctic have been studied by the authors [22,34]. In Figure 1, the main study areas in the north of the Yamal-Nenets Autonomous District are shown including four giant craters of gas blowout, formed in the central part of the Yamal Peninsula at locations of perennial frost heave mounds (PFHM) that were assigned with indexes C1, C2, C9, and C11 (Table 1) in the geoinformation system “The Arctic and the World Ocean”. In the Arctic, PFHMs are mainly connected with cryogenic processes and correspond to pingos, also called bulgunniakhs or hydrolaccoliths [53]. In particular, 1247 pingos have been discovered in the Arctic zone of Alaska [4] and 1350 pingos in the Beaufort-Mackenzie Basin in Canada, specifically, on the Tuktoyaktuk Peninsula [8,9,10].
Widely known are the open-system pingos, revealed in Svalbard, in the valley of the Adventelva River and on the shore of the Adventfjorden. From the tops of certain pingos, even in winter, at −17 °C temperature, significant water flows to the river valley of Adventdalen have been observed [7]. The most interesting object is the Riverbed Pingo (78.195° N, 16.433° E) [12,17,18], located on the shallow of the Adventelva River, 21 km to the east from the fjord and the town of Longyearbyen, the administrative center of Svalbard. In 1990, the area of the Riverbed Pingo was 200 m × 140 m, with a height of 12 m [12,18]. Concerning that the pingo height was 7.8 m in 1964, the average rate of its growth is 16.2 cm per year. Three sides of the pingo are gently dipping and the southern one is steep, due to partial erosion by the river flow. In 1990, the side erosion exposed ground ice and formed a sub-horizontal cavity with a depth of more than 7 m [12]. In fact, at the beginning of 1990, the growth of the pingo stopped, but near its southern edge, a new mound started to develop. It is possible to assume that due to the exposure of the ground ice, the water flowing from the talik was frozen, causing the formation of a new mound. After, the river started to flow at a new trajectory. It is important to note that the Riverbed Pingo is one of the key objects in this paper for comparison with the studied Seyakha C11 Crater (Table 1, Figure 1) on the Yamal Peninsula.
It is worth noting that the term PLF (pingo-like features) is often used worldwide in terms of studying the underwater PFHMs in Arctic seas (Beaufort, Pechora and Kara) [13,14,15,46]. Additionally, PLFs have been found on shelves in Angola, Nigeria, California, and Japan [54,55,56,57]. PFHM and PLF are actually synonyms, therefore, in this article, for easier perception of the text, we only use the term PLF, assuming that it is also valid for PFHM.
Research conducted by the authors in 2014–2020 showed a great danger of Earth degassing for human life in regions of cryolithosphere distribution [19,20,21,22,23,24,25]. The C1 Crater was formed 3 km from the Bovanenkovo-Ukhta gas pipeline with high pressure, and the C9 Crater near the railroad. The ejection distance of fragments of frozen ground and ground ice in various cases reached 300–900 m, which is much bigger compared to the man-made gas blowouts occurring during the drilling of wells. Such man-made blowouts have happened repeatedly in the Arctic and other regions of the world, and have led to the destruction of drilling equipment and often to the death of people (for example, on the Kumzha, Bovanenkovo, Gubkin, and South-Tambey fields [19,25,30]). In each of the (three) cases of gas blowouts witnessed by people, there was a self-ignition and an explosion, which made these events extremely dangerous.
Natural and man-made blowouts may cause dangerous fires and explosions. The explosive concentration of methane in the air is 5–16%, the most dangerous concentration being 9.5% [19,58]. Gas has a possibility of rapid distribution in the environment, and explosions of mixtures of gas and air have strong devastative power. Self-ignitions and explosions of gas have been observed during numerous natural and man-made gas blowouts in the Russian Arctic and other regions of the world and they have occurred not only in the last decades of climate warming, but also more than 50 years ago [25,27,30].
Almost all published results of gas content studies in shallow deposits in the north of Western Siberia including the Yamal Peninsula, and other onshore areas of the Russian Arctic show the absolute prevailing of methane [48,49,59]. In particular, the research in [48] specified that during drilling in the area of the Bovanenkovo Field, gas blowout occurred from depths of 15–220 m (mainly, 50–120 m) with methane content from 74.8 to 99.8% and in the area of the Yamburg Field, with a methane content from 79.3 to 95.0%. Only in one study [36] did we find a statement that the gas consisted mainly of carbon dioxide at the blowout on the C1 Crater. However, in all other cases in the study area, the content of carbon dioxide was in a range from 0.02 to 2.72% [48,59]. Moreover, in July 2014, the concentration of methane in air inside the C1 Crater reached the most explosive values of 9.6–9.8% [43].
In the vast territory of the Russian Arctic tundra (ca. 1.8 million km2—10.5% of the country’s territory), revealing and studying phenomenal natural events such as powerful blowouts, self-ignitions, and explosions of gas with the formation of giant craters, are complicated not only by the difficulty of their discovery, but also by the specifics of field work organization. Usually, the study areas can only be reached by helicopter, which is very expensive and inappropriate for delivering heavy geophysical equipment. Due to this circumstance, there is a need to create a mobile complex of geophysical equipment, optimized for conducting field work, that is sufficient for studying the upper part of PF, where particularly dangerous gas accumulations form (on depths to 100 m) [49]. The authors assumed that the mobile complex of equipment should be available for the operative launch of field studies of new gas blowout objects.
In 2014–2015, the authors of this article proposed a model of formation of a PLF with a gas-filled chamber for the first time and justified it by mathematical modeling [19,20,21,28]. In 2014, after observation of the Bovanenkovo C1 gas blowout crater [20], the first author of this article proposed the following: “Most probably, the gas accumulation formed in a chamber (cavity, cavern) located at the zone of gradual thawing of ground ice, as a result, gas distributed in space, previously occupied by ice and water. Existence of PF led to accumulation of huge volumes of gas in shallow deposits including thermokarst chambers. Pressure of accumulated gas at some places was enough for disruption of overlying PF layer. Ejection of collapsed rocks happened by pneumatic or gas-explosive mechanism, with formation of a parapet”. Additionally we noted that “before the explosion, the ejected rocks (the parapet of the crater) composed a seal of a chamber, the thickness of the seal reached 7–9 m. Conic walls of the upper part of the crater show signs of rocks disruption along planes dipping at angle of 40–60°, whereas almost vertical walls look like smooth frozen ground, at some places, almost pure ice.” [21]. Gas can migrate to the chamber from deeper layers through subvertical faults, from thawed zones (cryopegs), and from dissociated gas hydrates [21].
A chamber in ground ice can be formed in three ways: (1) the thermokarst mechanism, thawing of ground ice and formation of a cavity; (2) suffosion, mechanical and chemical, due to the effect of ice dissolution by saline water; and (3) gas mechanism due to the disruption of a layer by gas with pressure, higher than lithostatic [25,53]. In 2017–2020, confirmation of this model was obtained based on physical modeling and the results of field studies of certain craters [23,24,25]. Therefore, “the mechanism forming these craters was the same as that which created pockmarks generated by gas blowouts offshore, except that in Yamal and Gydan the onshore gas comes from thermokarst chambers and other reservoirs under and inside the permafrost layers, which are about 200–400 m thick.” [22].
In many earlier studies of the authors (2014–2017), a hypothesis was proposed regarding the volcanic mechanism of gas blowouts. Mud volcanic eruptions on certain PLFs in the Russian Arctic were proposed in the research by Nezhdanov et al. [60] on the basis of the detection of erupted mud-like rock on the walls of PLFs. The cryovolcanic (volcanic) mechanism is discussed in the research by Buldovicz et al. [36], where the justifications are hypothetical, based on an analogy with cryovolcanic eruptions on other planets. According to Russian and international technological standards, a volcanic mechanism can be confirmed if continuous or intermittent gas escape is determined [53,61]. Such confirmations were obtained by the authors of this article in 2017 for the Antipayuta C3 Crater and published in 2018 [23] (half a year earlier than Buldovicz et al. [36]). Furthermore, the authors gained similar confirmations of a volcanic mechanism on some other objects including the Seyakha C11 Crater [25,32].
The problem investigated in the research was associated with revealing a new (known since 2014) natural and probably man-made process in cryolithosphere on land and the bottoms of water areas (lakes and rivers) of the Arctic. This process consists of powerful gas blowouts with the formation of giant craters with parapets composed of ejected rocks. Quite often, the gas self-ignites and explodes, which significantly increases the distance of frozen ground ejection. Obviously, such explosions pose threats to the ecosystem and human activities as well as destroy the facilities of hydrocarbon fields and other industries, which may lead to an ecological catastrophe.
This problem could be solved in the following way: a detailed study of the above-mentioned dangerous objects using available geological and geophysical methods and technical devices (including RS); collecting, analyzing, and summarizing the obtained information; and revealing the features of their formation. It is planned to categorize the Arctic territories by level of powerful gas blowouts risk; reveal and study potentially dangerous objects near (or within) areas of human activities; monitor dangerous objects development; and elaborate and apply technologies for the decrease in danger level.
Despite the fact that this problem is now being studied by several independent groups of researchers, there are certainly mutually controversial results, and thus the problem is currently far from being solved.
The main objective of this paper was to solve the existing problem by conducting all of the research operations above-mentioned. In this paper, the specific goal consisted of investigating the Seyakha C11 crater of a gas blowout with a complex of geophysical methods for studying the geological structure of the upper part of PF (1) and the features of gas seepage (2) as well as making a comparative analysis of the obtained new data and the previously collected information (3).
The article covers the results of the 2017–2018 field studies of the Seyakha C11 gas blowout, self-ignition, and explosion including observations from helicopters and an unmanned aerial vehicle (UAV)—drone, echo sounding, ground penetrating radar (GPR) survey as well as data integration. The 2017 field work was organized by the Yamal-Nenets Autonomous District Government, Russian Center of the Arctic Development and Oil and Gas Research Institute of the Russian Academy of Sciences with support by the NOVATEK and Yamal LNG companies [34,35]. The second field season was organized by Oil and Gas Research Institute of the Russian Academy of Sciences with support by the NOVATEK and Yamal LNG companies and also partially by the Russian Foundation for Basic Research (Grant No. 18-05-70111).

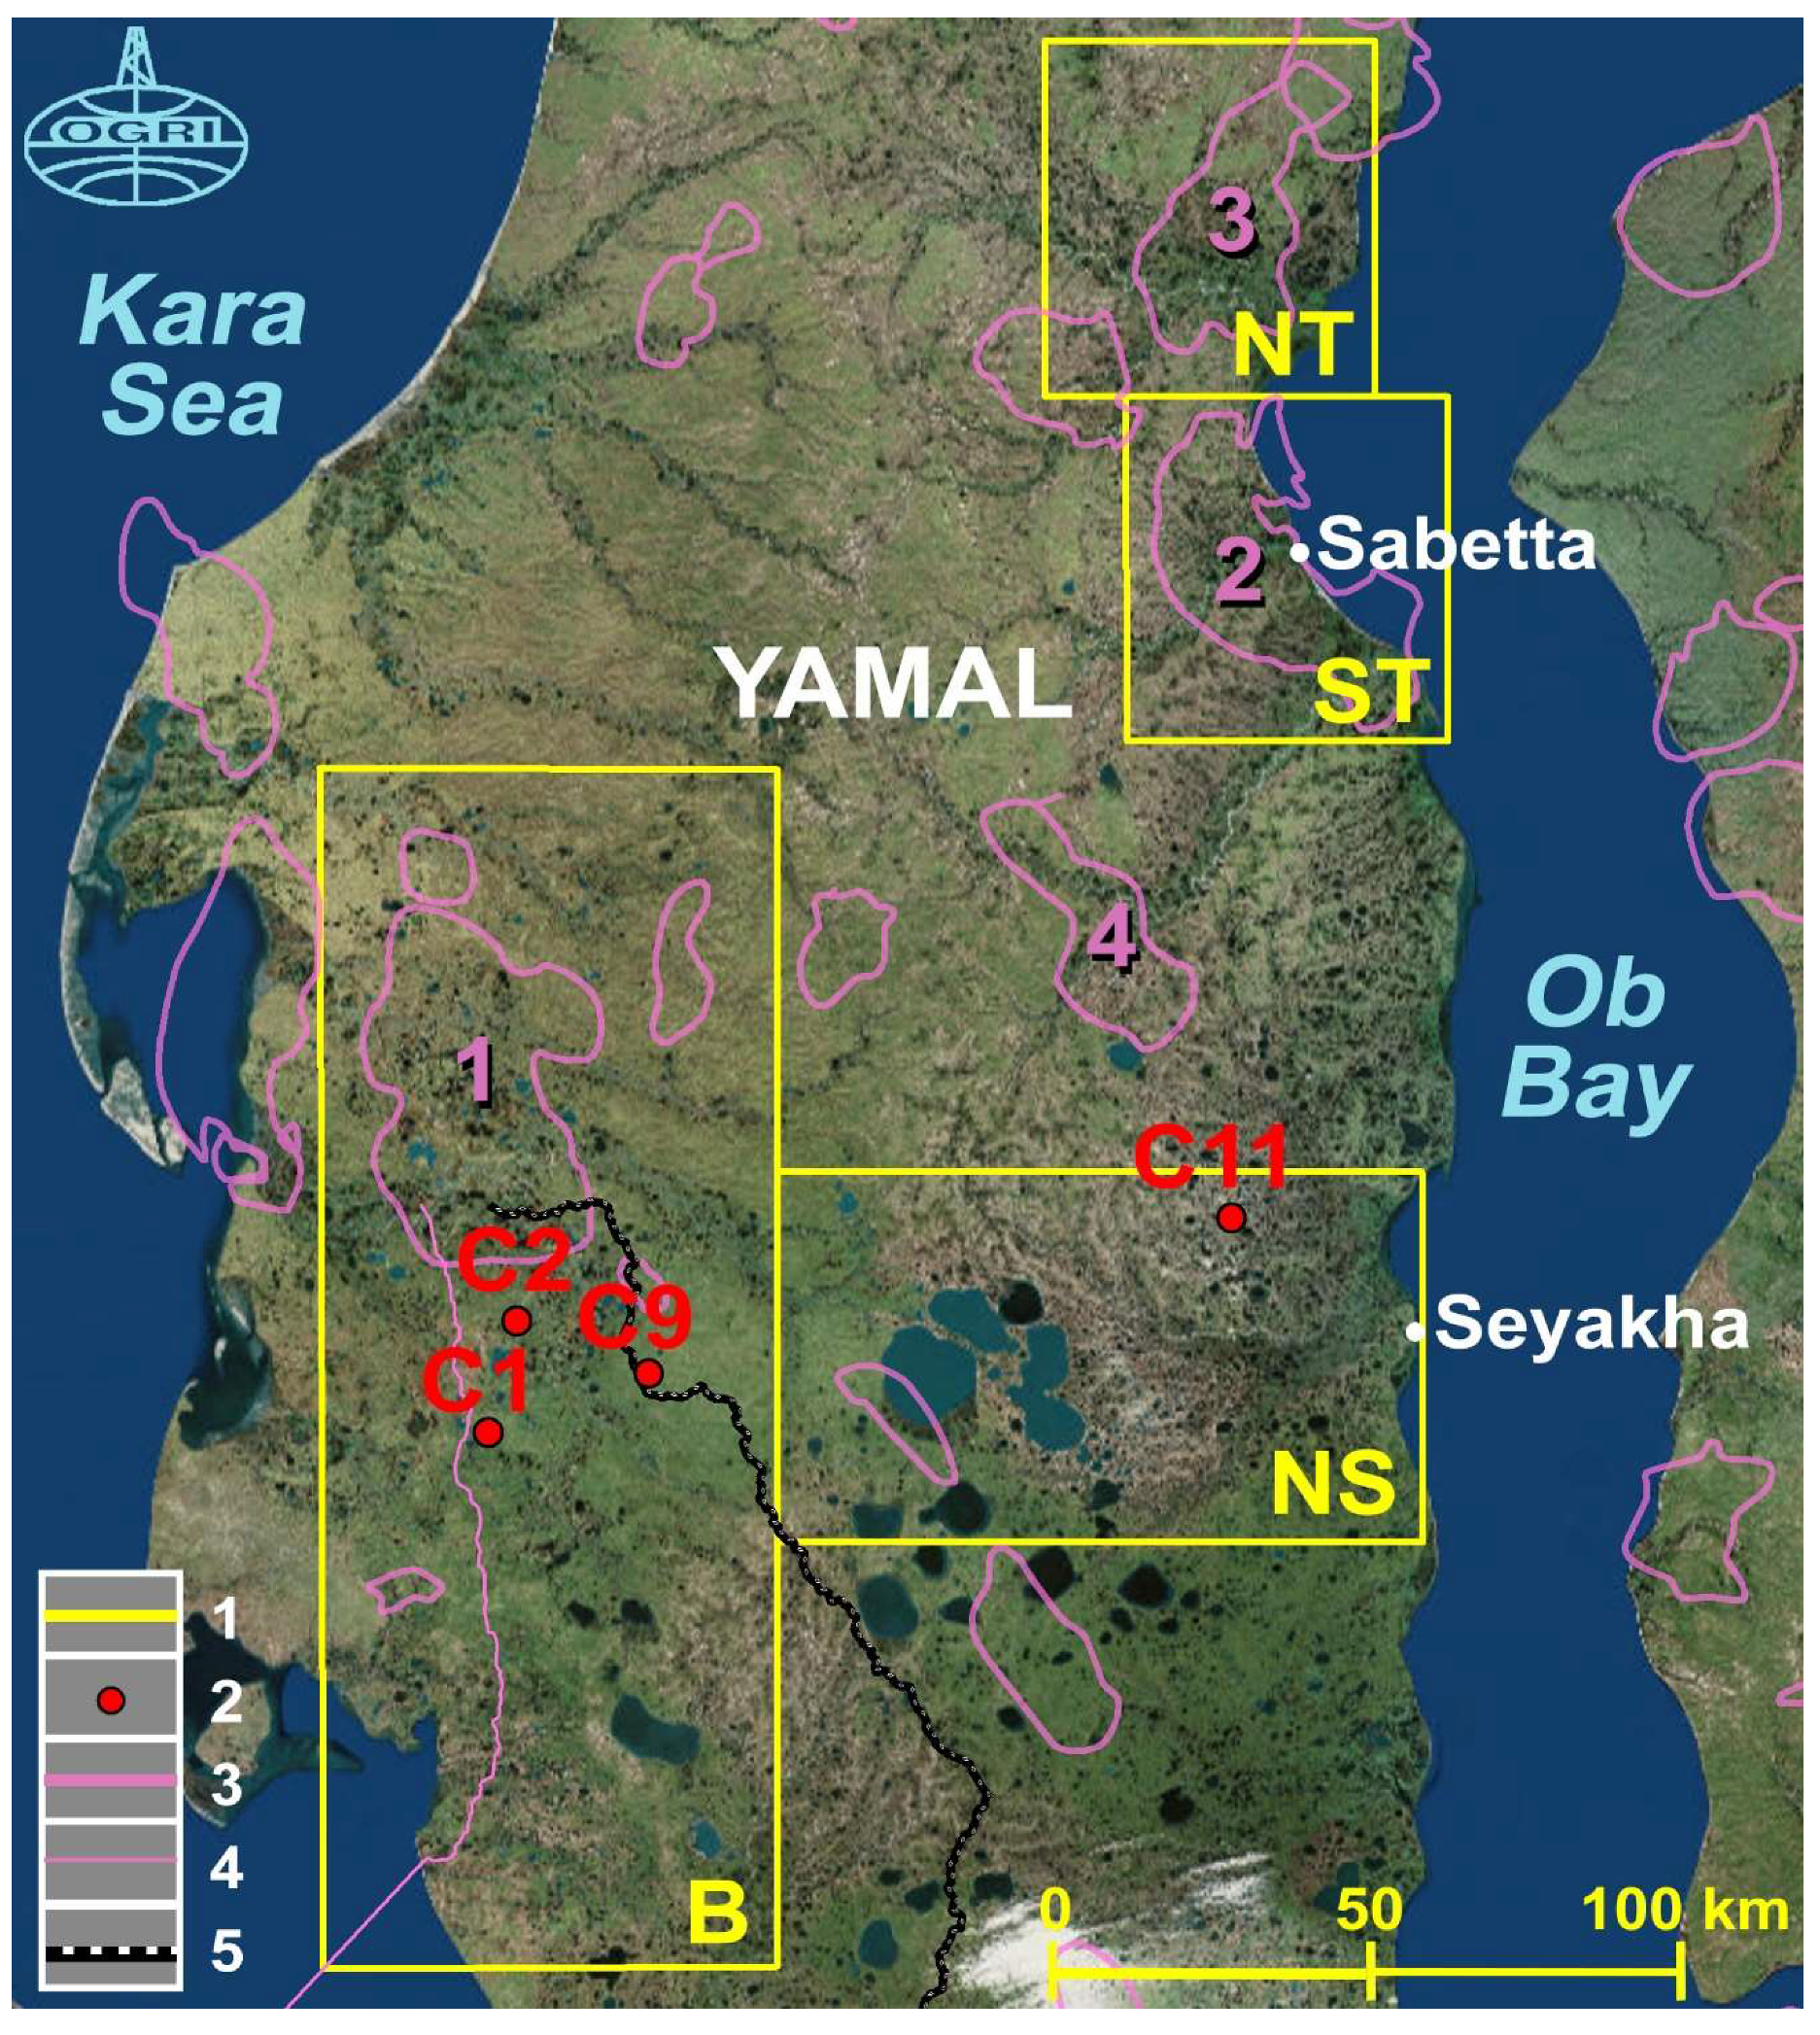
2. Description of the Region and the Object of Study

The Yamal Peninsula is part of the Russian Arctic territory, located completely beyond the Arctic Circle. From a geological point of view, Yamal is a northern part of the huge West Siberian oil and gas bearing megaregion. Yamal and its adjacent areas are among the richest regions in the world in gas resources. The Bovanenkovo Field, just one of these fields, is located in the middle part of Yamal (Figure 1) and contains about 4.5 trillion m3 of gas and over 100 million tons of oil and condensate. The largest part of the gas is concentrated in the Cenomanian deposits at a depth of ca. 600 m.
The Seyakha C11 gas blowout crater was formed within the Neito-Seyakha area, which is among the authors’ long-term study areas (Figure 1, NS). The crater lies within the Myudriyakha River, 33 km to the northwest from the settlement of Seyakha and 110 km to the east from the Bovanenkovo Field. The C11 Crater area shows an average absolute elevation of 6 m above sea level (Baltic elevation system). The Myudriyakha riverbed is composed of alluvial-marine deposits (sands, sandy loams, loamy sands with gravel, and pebble) [62]. The study area is located in a zone of continuous PF distribution, which may have a thickness of up to 150 m and a temperature as low as −6–8 °C. Depth of seasonal thawing of PF within the riverbed and adjacent territory ranges from 0.5 to 1.5 m. Period of active thawing does not exceed 80 days [62]. The nearest well to the C11 Crater, Seyakhinskaya-1 (total depth 2700 m), is located 15 km to the southeast, and the nearest field, West-Seyakha, is 40 km to the northwest. The West-Seyakha Field (discovered in 1989) consists of 18 pools of gas and gas condensate in the Jurassic–Upper Cretaceous (Valanginian–Cenomanian) deposits at depths of 900–2900 m. Their areas vary from 60 to 90 km2, proven reserves contain over 300 billion m3 of gas and 6.5 million tons of condensate [63].
All of the craters that we have been studying have common features: before the explosions, the frost heave mounds existed at the locations of the craters; the distance of frozen ground and ground ice ejection varied from 160 m (C1) to 900 m (C4); in each of the three cases of gas blowouts witnessed by people, there was a self-ignition and an explosion; the gas consisted mainly of methane; and ground ice was present at all the studied craters [19,20,21,22,25]. The most intensively studied craters are C1, C2, and C3 [19,20,21,22,28,43,44,45].
The powerful gas blowout, self-ignition, and explosion with the formation of the giant Seyakha C11 Crater on 28 June 2017 were different from previous ones (C1, C2, C9, etc.) as C11 occurred on the Myudriyakha riverbed. As a consequence, the crater was immediately flooded. With the help of local resident M.N. Okotetto, the authors obtained important information about the explosion in real time on the day of the event. As a result, the first brief field study of the C11 unique event was organized just four days later on 2 July 2017.
Information about the powerful gas blowout on the Yamal Peninsula was confirmed by the Unified Geophysical Survey of the Russian Academy of Sciences, located in the city of Obninsk. In this survey, seismic stations were installed in spring 2017 in the settlements of Sabetta, Bovanenkovo, and Kharasavey through recommendations and the direct participation of the authors of this article via the Russian Center for Arctic Development. As a result of seismic record processing at the Unified Geophysical Survey, approximate coordinates of the seismic event were determined (uncertainty up to 20 km). This confirmed the theory of the authors regarding the gas explosive origin of low-magnitude seismic events in the Arctic, which had been registered in the Barents-Kara region by the Norwegian Seismic Array (NORSAR) [19]. In fact, for a long time, this region has been known for active seismicity, with magnitudes more than 3, although only in the western part, around Svalbard, and near the Mid-Atlantic Ridge. However, it is not clear as to what causes numerous low-magnitude seismic events with magnitudes less than 3 both off- and onshore. Regarding seismic events on land, these can be triggered by man-made activities, whereas in offshore areas, they are obviously driven by natural factors. Thousands of craters (also called pockmarks, structures initially described for the Scotian shelf [64]) have been found in seas, which provide evidence of gas seepage. The formation of large pockmarks was caused by powerful gas blowouts, which might have initiated low-magnitude earthquakes [19].
The first brief expedition to the C11 crater by helicopters was organized on 2 July 2017. While approaching the C11 area of gas blowout, several thermokarst lakes with numerous craters in their bottoms were detected, including one just 1.5 km to the north from the study area. Most craters had remained parapets, seen in photos as light round structures, framing dark vents of the craters [33].
The revealed C11 Crater was flooded (Figure 2a), as its center was located near the right bank of the Myudriyakha River, as determined by visual approximation. The crater had an asymmetric elongated form, covering an area of ca. 50 m × 70 m. In the vicinity of the right bank, a local zone of gas emission was detected in an area with a diameter of up to 3–4 m (Figure 3a,b, red arrows) [33,34]. The ascending flow of gas bubbles had formed a slightly elevated zone on the water surface, and also the local water turbulence. Methane content in the air, measured with a gas analyzer Ventis VX4, differed from the background values to 0.5–1.5% over the zone of the gas seepage. It is worth noting that in July 2014, the methane content in the area of the Bovanenkovo C1 Crater changed from 0.3–2.8% to an especially dangerous concentration of 9.6–9.8% directly in the crater [43].
Investigation of the crater lake bottom was carried out from two inflatable “Lotsman” boats. The available portable echo sounder “Deeper” showed steep dipping of the bottom in directions from the banks to the center; however, the crater depth exceeded the working range of the echo sounder (0.3–15 m). Further depth measurements conducted from inflatable boats using a rope with a weight on its end showed a maximum depth of ca. 56 m (in the vicinity of gas seepage location). Obviously, as a result of the falling of the ejected frozen ground into the crater, the latter became partially blocked and gas flow was significantly constrained. Additionally, the crater depth of ca. 56 m might have initially been bigger without the blocky material. Gas sampling and analysis, conducted by F.M. Rivkin (Yamal LNG), showed that it was composed mainly of methane with a light isotopic content of methane carbon δ13C(CH4) = −80.6‰ [35]. This definitely confirmed the bacterial genesis of the gas. Based on published data, content of biogenic methane carbon δ13C ranges from −55‰ to −88…−92‰ in different areas of Yamal [19,23,24,48,49,65].
During the area observation on 2 July 2017, 117 of the most significant (concerning size and character of falling) fragments of ground ice and rocks (Figure 3 and Figure 4) were revealed as well as the depressions of impact origin. Among the objects, the most remarkable were the giant fragments of frozen ground and ground ice. The largest one, broken into two parts, was located in the river channel on the southwestern edge of the crater. The recognizable maximum size was ca. 4 m × 8 m × 10 m (volume of ca. 100–150 m3) (Figure 3a and Figure 4b), but was probably larger, as its underwater part was difficult to assess.
The distance of total (100%) damage of the territory by fragments of ground ice and frozen ground in all directions reached 100 m from the explosion epicenter (including the parapet with large PF rocks and fragments of ground ice), whereas the maximum distance of the ejection of separate fragments of frozen ground was up to 380 m [33]. Some fragments of ground ice near the crater and, partially, adjacent tundra vegetation had a specific burnt view. Intensive ignition of the soil did not occur due to its high moisture in spring.
Numerous large fragments of ground ice, revealed on the C11 object, allows us to conclude that a large ground massive ice layer had existed at the explosion area, as in areas of a number of other craters (C1–C6 and C12). It is worth noting that all fragments of ground ice appeared to have been ejected to the left (southeastern) bank of the river. In contrast, they were not revealed in the right bank, which is higher (probably, small pieces of ground ice had thawed). On both banks, numerous large and small blocks of sandy loam rock were observed, some of which had thawed and formed placers (partially, pure sand). Justification of this phenomenon was found later on the basis of RS data analysis [33].
In 2017–2019, on the basis of the complex analysis of RS data, the geodynamical processes of the Seyakha C11 PLF formation before the explosion and the dynamics of the crater changes were studied. Results of the studies were published in [24,34,35].
A special study analyzing the data of RS from space and field data showed that the eastern part of the Yamal Peninsula has the largest density of distribution of thermokarst lakes with craters of gas blowouts in bottoms as well as PLFs with potential risk of further explosion [33]. In total, as of mid-2019, the authors had detected 415 thermokarst lakes with gas blowout craters and 7185 PLFs [33]. In particular, many thermokarst lakes are concentrated in the eastern part of Yamal including areas of the North-Tambey and South-Tambey fields, the eastern zone of the Neito-Seyakha area (Figure 1, NT, ST, NS). Certain lakes seasonally drain completely or partially and craters become exposed to air. In many lakes, there are hundreds and, occasionally, thousands of craters. The Seyakha C11 gas blowout crater is located approximately on the same latitude as four other craters (Figure 1, C1, C2, C3 and C9), which were formed at the locations of PLFs [19,23,25,29]. The area of the Seyakha C11 gas blowout crater is among the most dangerous in Yamal, in terms of possible gas blowouts and explosions.
RS data analysis allowed us to summarize the revealed active geodynamical processes on the Seyakha C11 target area [35]. Before the gas blowout, a PLF developed, which was actively growing for 3.5 years, driven by gas-hydrodynamic forces. The crater, which was formed on 28 June 2017, was immediately flooded by the river and by 18 September 2018, its area had increased by 3.26 times (from 2780 to 9049 m2), and the depth decreased by almost five times (from 56 to 12 m).
It is worth noting that for the C11 Crater and seven other craters of gas blowouts (C1–C6 and C12; C4, C6, and C12 are located beyond the limits of the map in Figure 1), the existence of thick massive ground ice was confirmed in 2014–2017 [19,23,29,41,42].

3. Materials and Methods

To study the processes of the Earth degassing in the Russian Arctic on a lithosphere-cryosphere-hydrosphere–atmosphere system in the Seyakha C11 Crater in 2018, the following materials (data), methods, technologies, and technical devices were used.

3.1. Remote Sensing Including Digital Elevation Model (DEM)

Digital elevation model ArcticDEM was used in this study [24,33,34,35,66,67,68]. ArcticDEM is a National Geospatial-Intelligence Agency and National Science Foundation (NGA-NSF) initiative to create and share a high-resolution digital surface model of the Arctic zone using optical stereo imagery processed with open source photogrammetry software [68]. It has a nearly full coverage of territories above the 60° N latitude. The latest release of ArcticDEM available since 2018 has a spatial resolution up to 2 m and mainly includes WorldView 2 and WorldView 3 imagery from DigitalGlobe with a resolution up to 0.5 m [68]. Although all the data are generated automatically from high quality sources, sometimes errors can occur on small objects with steep walls like the C11 Crater.

3.2. Remote Sensing Using the Russian Helicopter MI-8 and the Unmanned Aerial Vehicle (UAV) Drone “DJI Mavic Pro”

A MI-8 helicopter was used for the regional search of degassing objects. The photos and coordinates of the objects were added to the geoinformation system “The Arctic and the World Ocean”.
The unmanned aerial vehicle (UAV) drone “DJI Mavic Pro” (DJI, Shenzhen, China) has a high resolution 12.3 MPixel Ultra HD camera “Mavic Pro” with a stabilizer. It has a weight ca. 800 g and can fly at a speed of up to 65 km/h and overcome distances of up to 13 km (concerning the way back—6.5 km) at a height of up to 500 m. GPS and GLONASS satellites were used for the navigation.
For the Arctic, obtaining adequate data of remote sensing from space is complicated by the low quantity of satellite observations and particularly harsh weather conditions. Due to this, for the monitoring of geodynamical processes on the Earth’s surface including the Arctic areas, UAVs have become commonly used [40,42,67,69,70,71].
It is possible to create 3D models of the area relief (digital elevation models—DEMs) with UAV data processing in Pix4Dmapper and ArcGIS software [67,72]. In Pix4Dmapper, high-technology algorithms of object reveal are realized, based on a series of aerial images made during UAV flights (specifically assigned trajectories in parallel and perpendicular directions are recommended). As a result of data processing in Pix4Dmapper, orthophotoplans can be created and DEMs with assigned sampling interval computed. Based on DEMs, using ArcGIS software, 3D models of the area relief could be created. The mentioned operations were subsequently conducted in this research.
The main problems of using an UAV at high latitudes of the Arctic are frequent strong winds as well as the insufficient number of GPS satellites in view in polar regions. For adequate functioning, not less than six satellites are required [71]. The latter problem caused the loss of three UAVs by the authors’ colleagues. The authors themselves were also close to losing their own UAV twice.

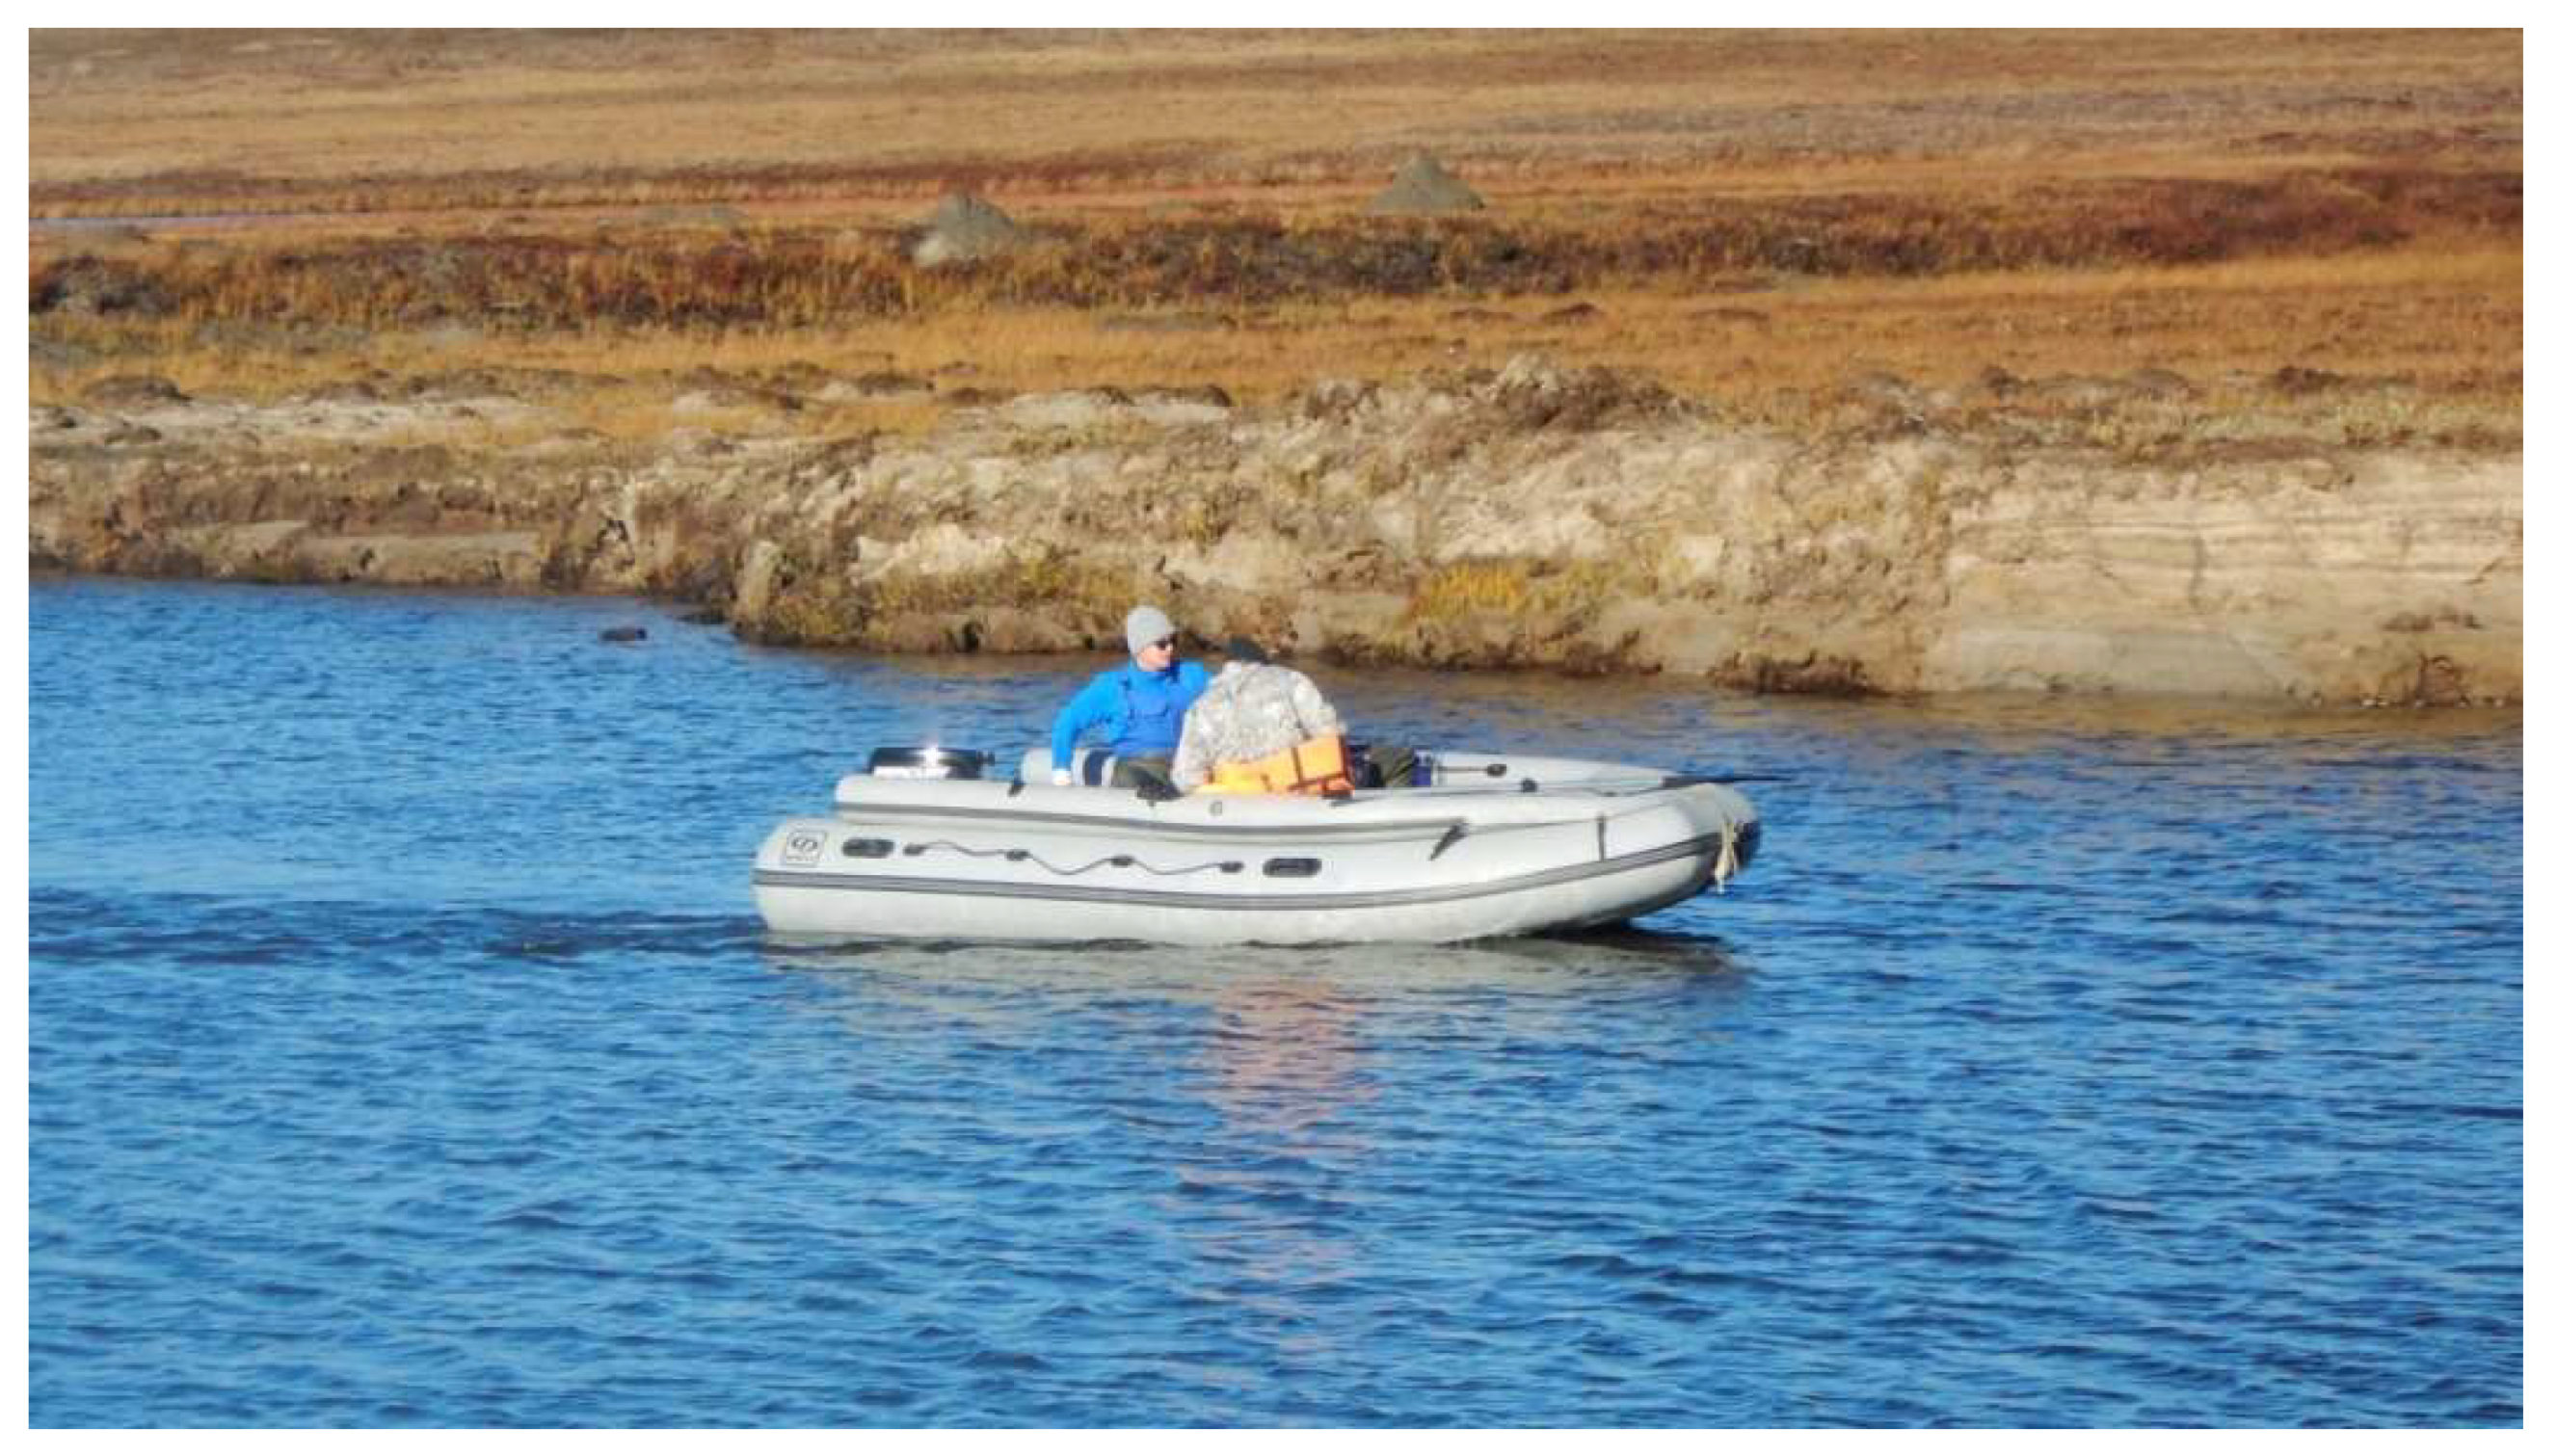
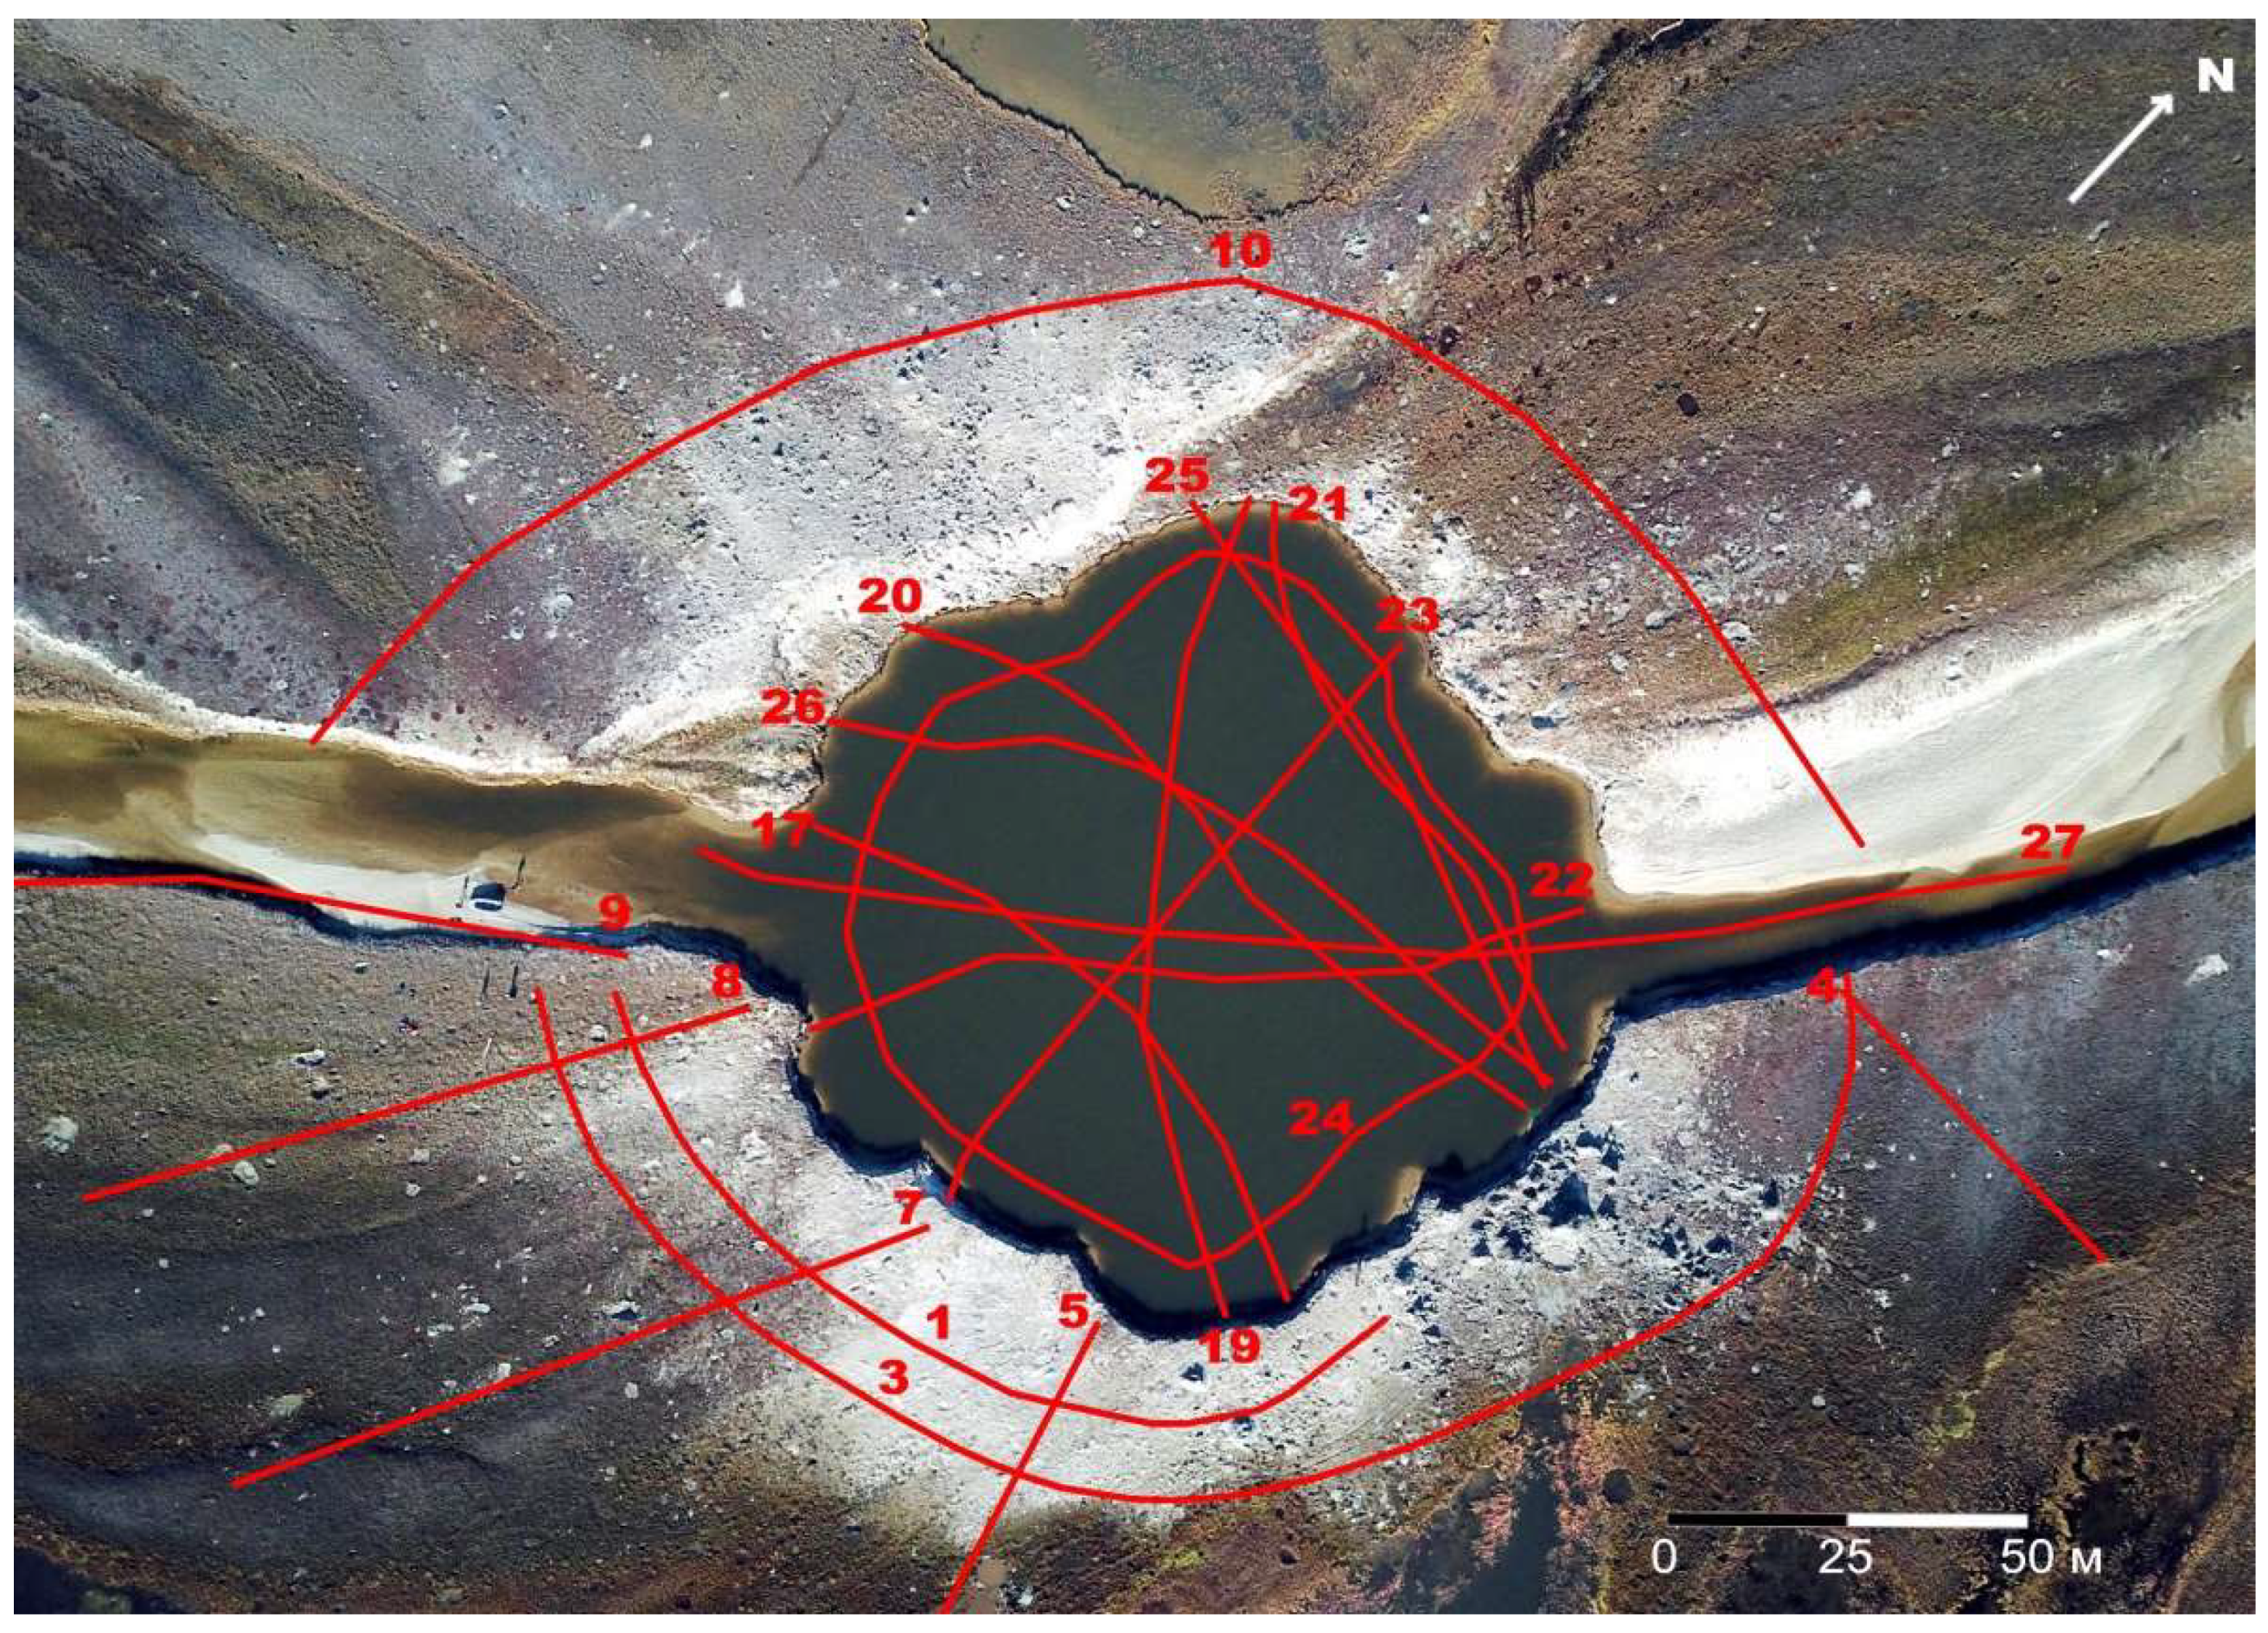
3.3. Expeditionary Geological and Geophysical Studies on Land and Water Areas Including Echo Sounding and GPR Survey

The echo sounders “Deeper Smart Sonar” and “Garmin Striker Plus 7cv” were used in this study. Deeper Smart Sonar Pro+ is a small portable wireless echo sounder that is operated with a smartphone/tablet using Wi-Fi connection. It has built-in GPS, so there is no need to use other tracking applications or a GPS receiver. Deeper Smart Sonar Pro+ has a dual beam system. The narrow beam (15°) works on a 290 kHz frequency and the wide one (55°) uses a 90 kHz with up to 15 scans per second. The depth measuring range is from 0.5 to 80 m. The GPS signal comes from the L1 48 channel receiver with an accuracy of up to 3 m. The Garmin Striker Plus 7cv is a bigger, boat-mounted echo sounder with a separate 500 W transducer with built-in GPS and CHIRP technology. It has six working frequencies: 50, 77, 200, 260, 455, and 800 kHz. Both devices have built-in software for bottom mapping with the possibility of saving the results in lines or point formats.
Echo sounding is used as a unique tool for determining the depth of water areas (the lake and the river) based on the travel time of pressure waves generated by an acoustic emitter. It is also used for studying bottom degassing in water areas. In acoustic echograms, gas bubbles rising in water, called gas flares, are usually clearly visible [1,5,6,19,24]. Different types of echo sounders have been repeatedly used successfully in studies of Arctic water areas [1,16,24,40,67] as well as lakes in volcanic craters [73].
GPR “Oko-3”, developed by Geotech Company (the Russian leader in onshore GPR equipment and software development), was used in the study [74]. It is a relatively small portable GPR with both antennas and all the electronic components gathered in one metal case with a size of 227 cm × 107.5 cm and weight of 14 kg. Additionally, Oko-3 has a built-in GPS receiver. The used antenna was a Geotech AB-150M (frequency 150 MHz), allowing us to reach a maximum depth of 12 m from the solid ground.
The GPR survey is based on the generation of electromagnetic waves by antenna and the recording of reflecting waves from boundaries between layers with different dielectric permittivity (two-way travel times of reflection waves from antenna to subsurface reflectors). GPR is a widely used tool for studying near-surface deposits on depths down to 10–20 m (occasionally, more). GPR is successfully implemented during engineering works in zones with PF distribution, where it allows boundaries to be defined with strong contrasts in dielectric permittivity. In such zones, the base of the active layer, bottoms of thermokarst lakes, massive ice layers, and other features can be distinguished [75,76,77]. GPR data are usually represented in a form of digital record (traces) with registered signals of electromagnetic waves. Reflections of electromagnetic waves from interfaces going from lower to higher dielectric permittivity maintain their polarity. In the opposite case, polarity becomes reversed [75]. This is one of the key principles, used in the interpretation of obtained GPR data. Another point useful for interpretation is that massive ice layers can usually be recognized as homogeneous objects in GPR sections.
GPR survey can be used for studying the bottom structure of water areas with fresh water, from ice in winter, and from a boat in summer. The authors conducted a GPR survey on the land, lake, and river from the motor boat “Fregat” (Figure 5). The main disadvantages of GPR survey include a small depth of penetration and the impossibility of using it in the case of significantly saline water, which constrains the propagation of electromagnetic waves.

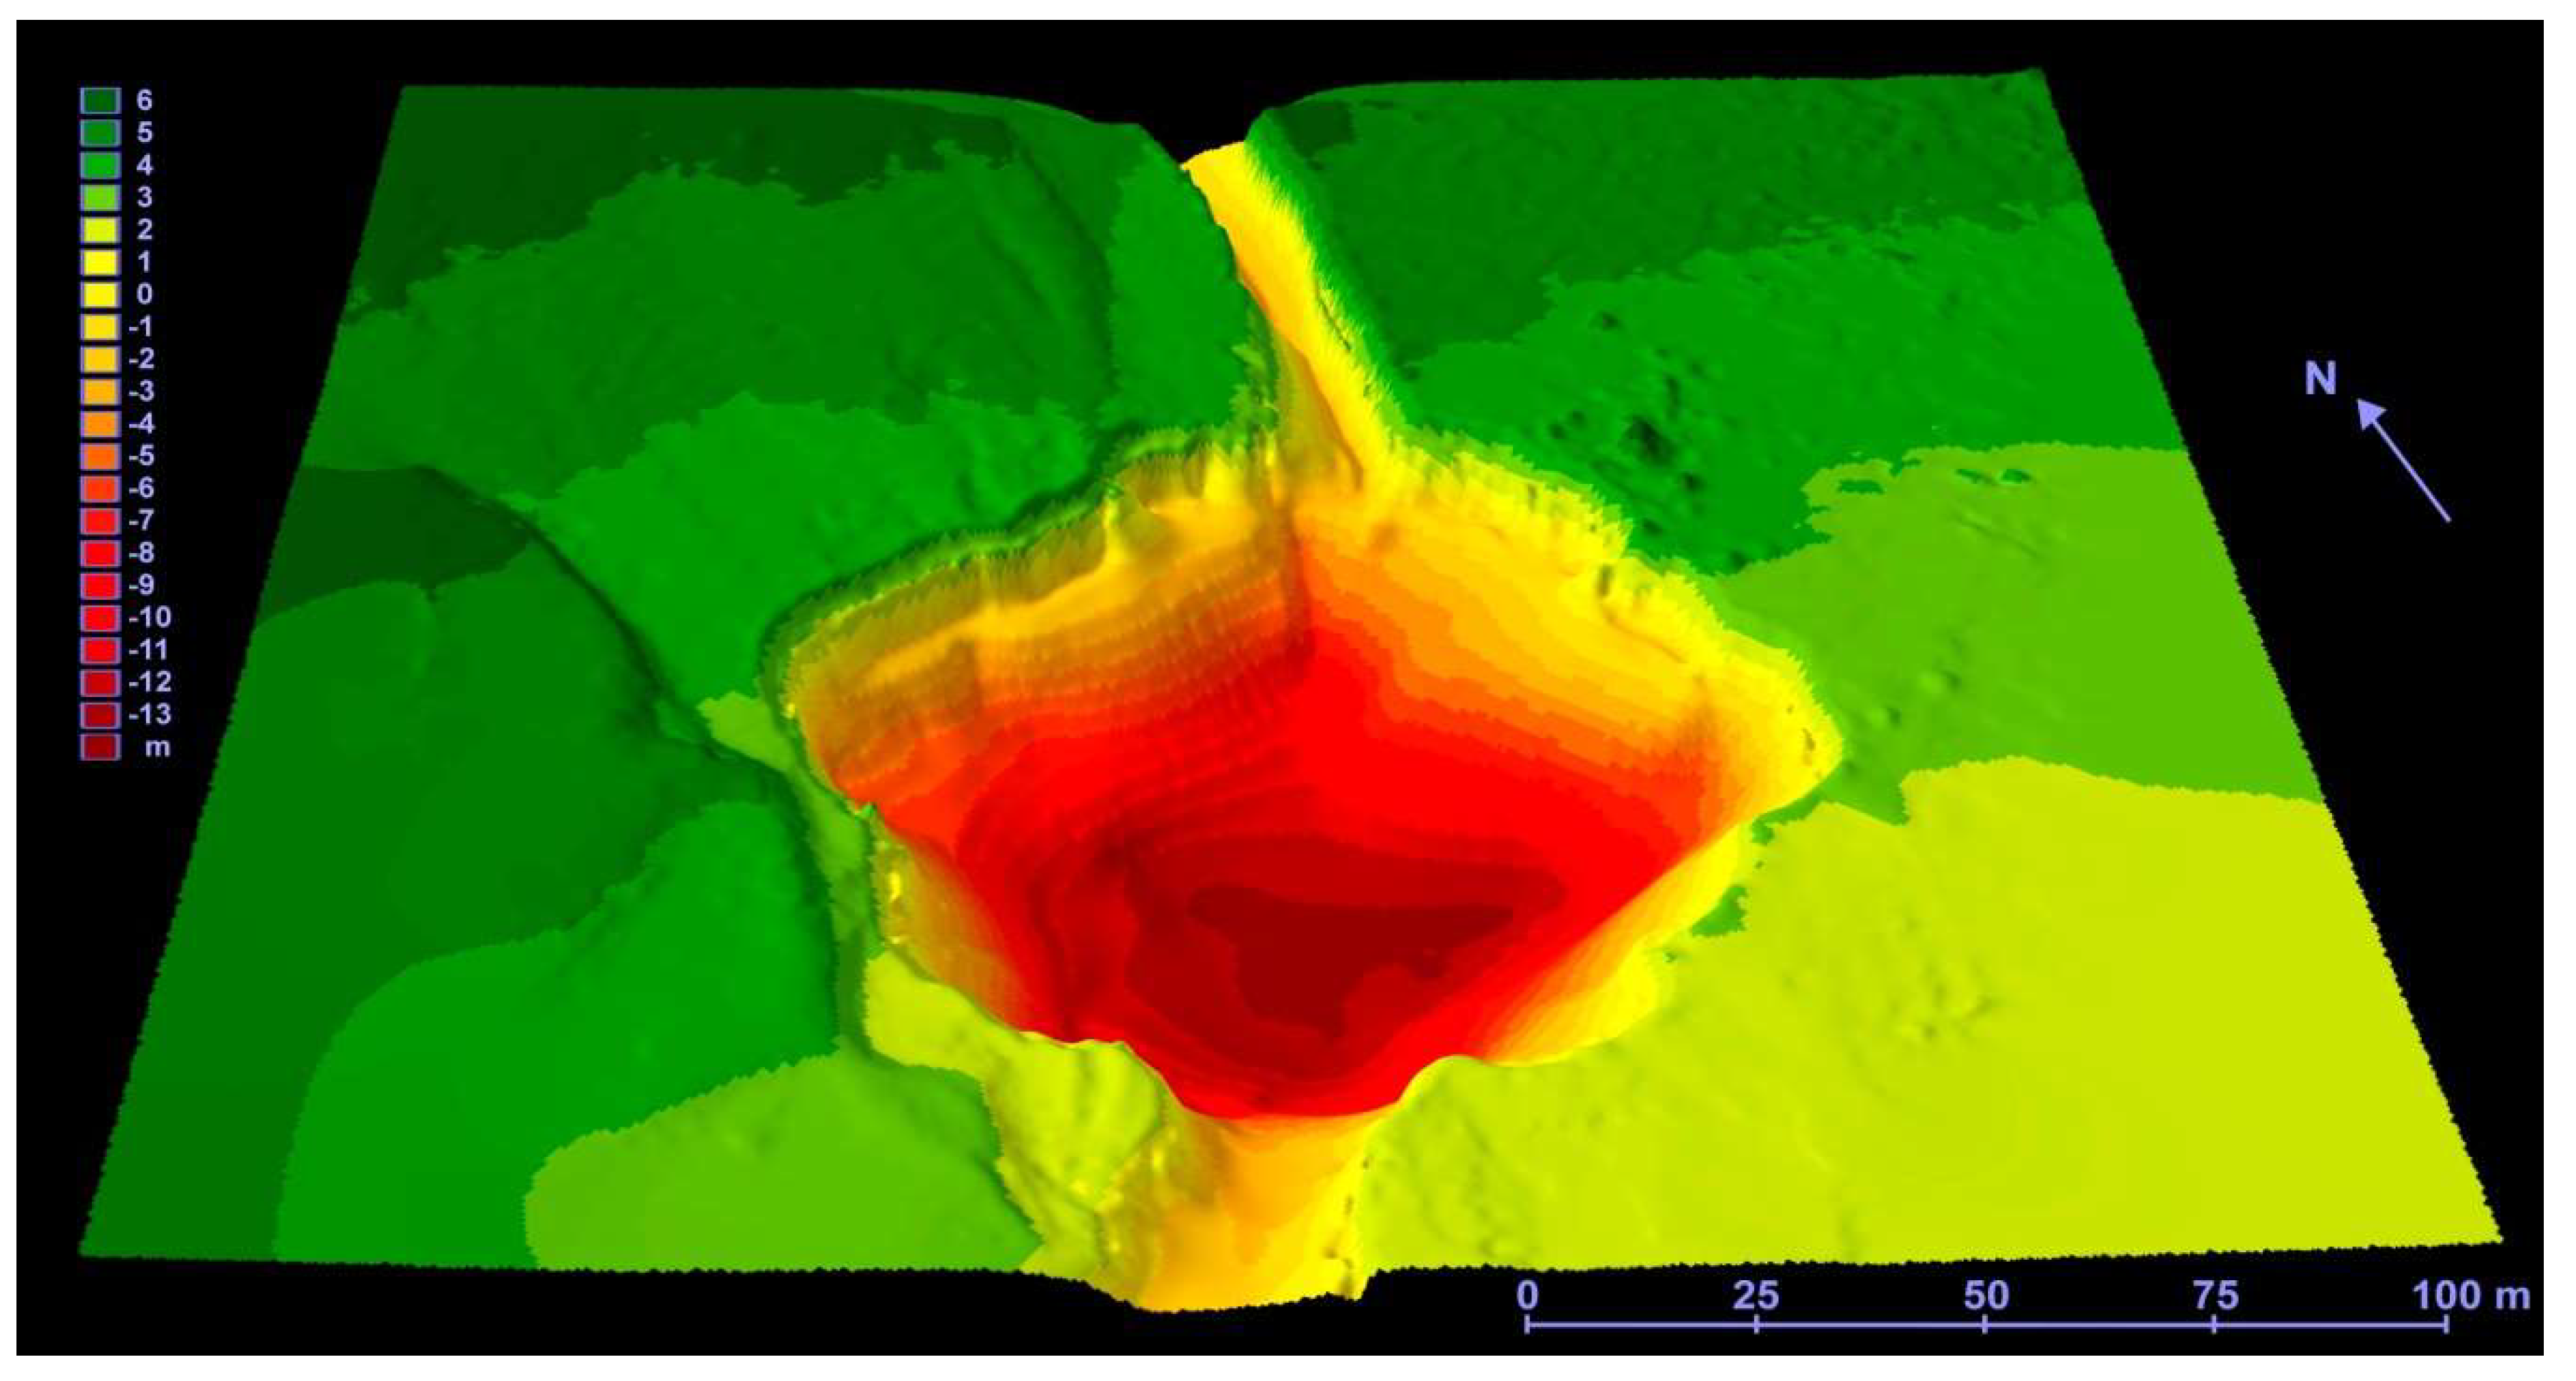
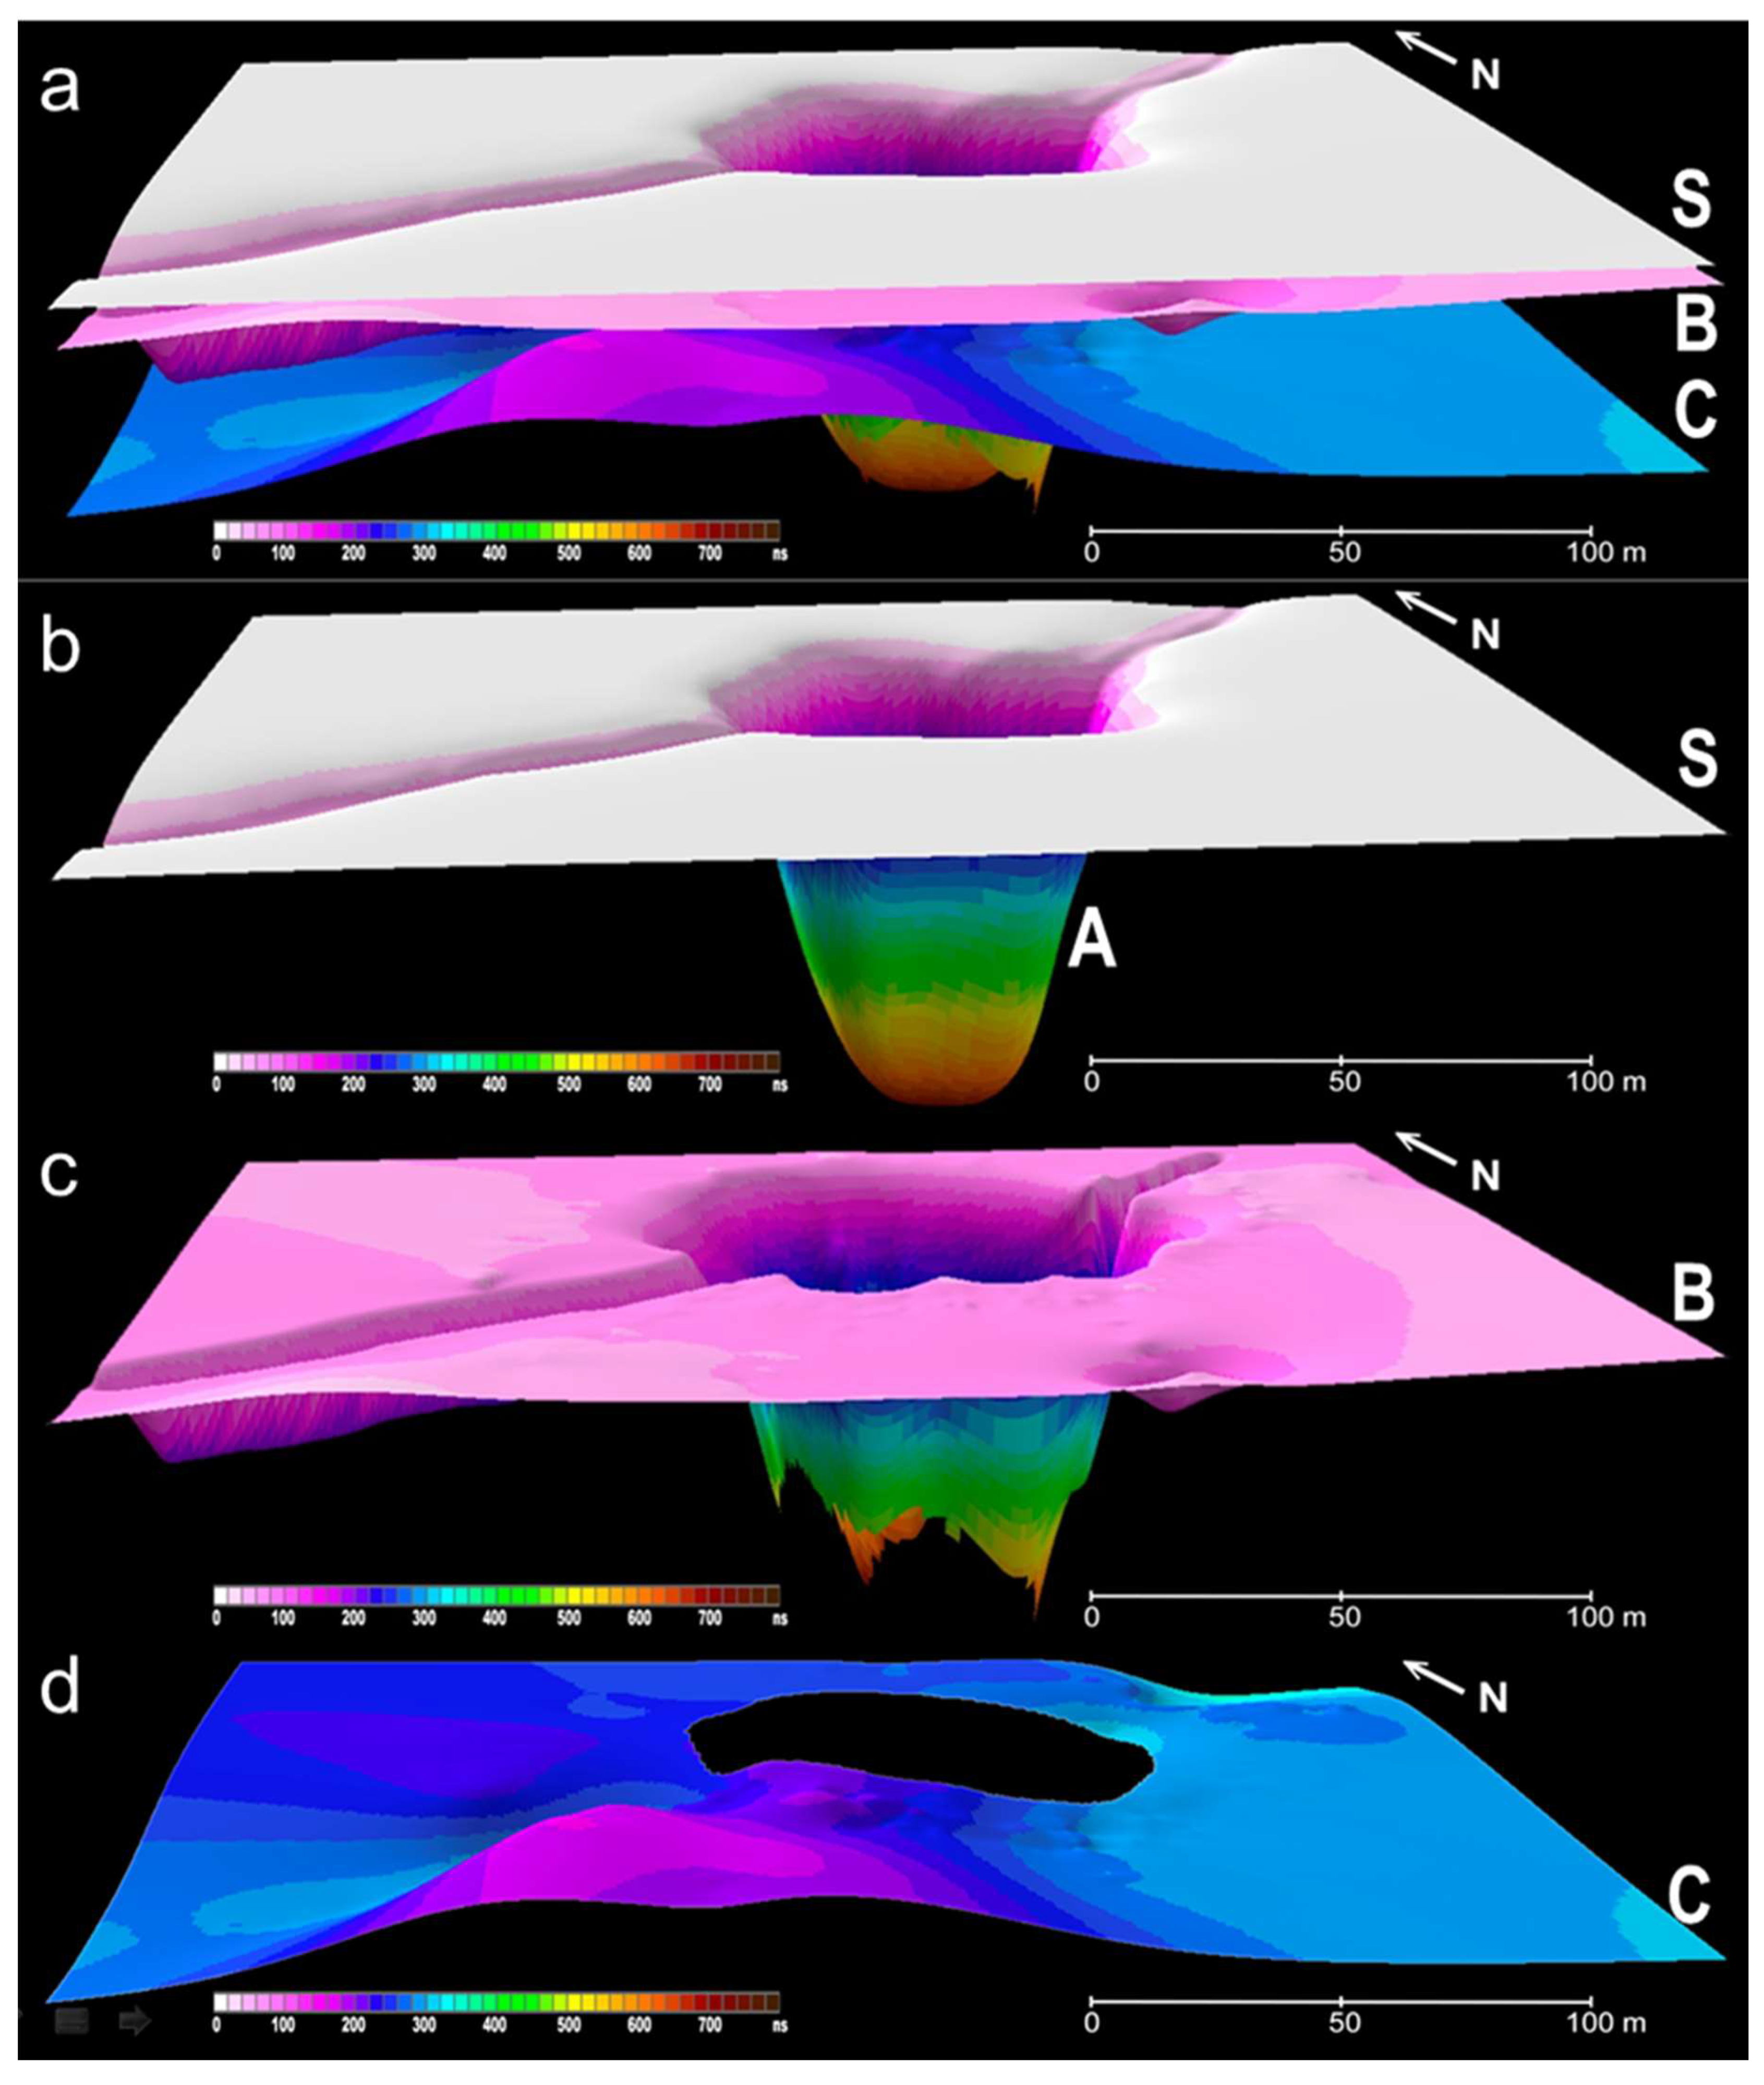
3.4. Creating 3D Models of the Water Area Bottom, Adjacent Area Elevation and Structure of the Upper Part of Sedimentary Cover

Geoscan 32 software, (Geotech Company, Moscow, Russia) [78], was used for converting GPR data into the SEG-Y format and applying a spatial reference. Interpretation of the GPR sections was conducted in IHS Kingdom software. As a result of the interpretation, three horizons were defined and traced: one horizon standing for the crater bottom, and two others marking boundaries in the sedimentary cover. For each horizon, a surface was interpolated between the survey lines. The surfaces were further uploaded to ESRI ArcGIS for 3D visualization.
Additionally, data from the UAV aerial photography, processed in Pix4DMapper, and echo sounding data were uploaded to ArcGIS. On the basis of this data and the surface of the crater bottom obtained by GPR data interpretation, a 3D DEM model was created for a single surface of the crater bottom, the river bottom, and the adjacent land area elevation. All the data had a spatial reference, therefore the authors combined it in ArcGIS, making one continuous grid for the entire study area. This grid was visualized in the ArcScene module of ArcGIS for getting the 3D view of the crater, the river, and the surrounding land. It is necessary to note, that for some zones (located at the periphery of the crater), the data from the UAV were insufficient for determining the land surface. For these zones, the model was complemented with the ArcticDEM data (DEMs provided by the Polar Geospatial Center under National Science Foundation – Office of Polar Programs (NSF-OPP) awards 1043681, 1559691, and 1542736).

4. Results of the Research
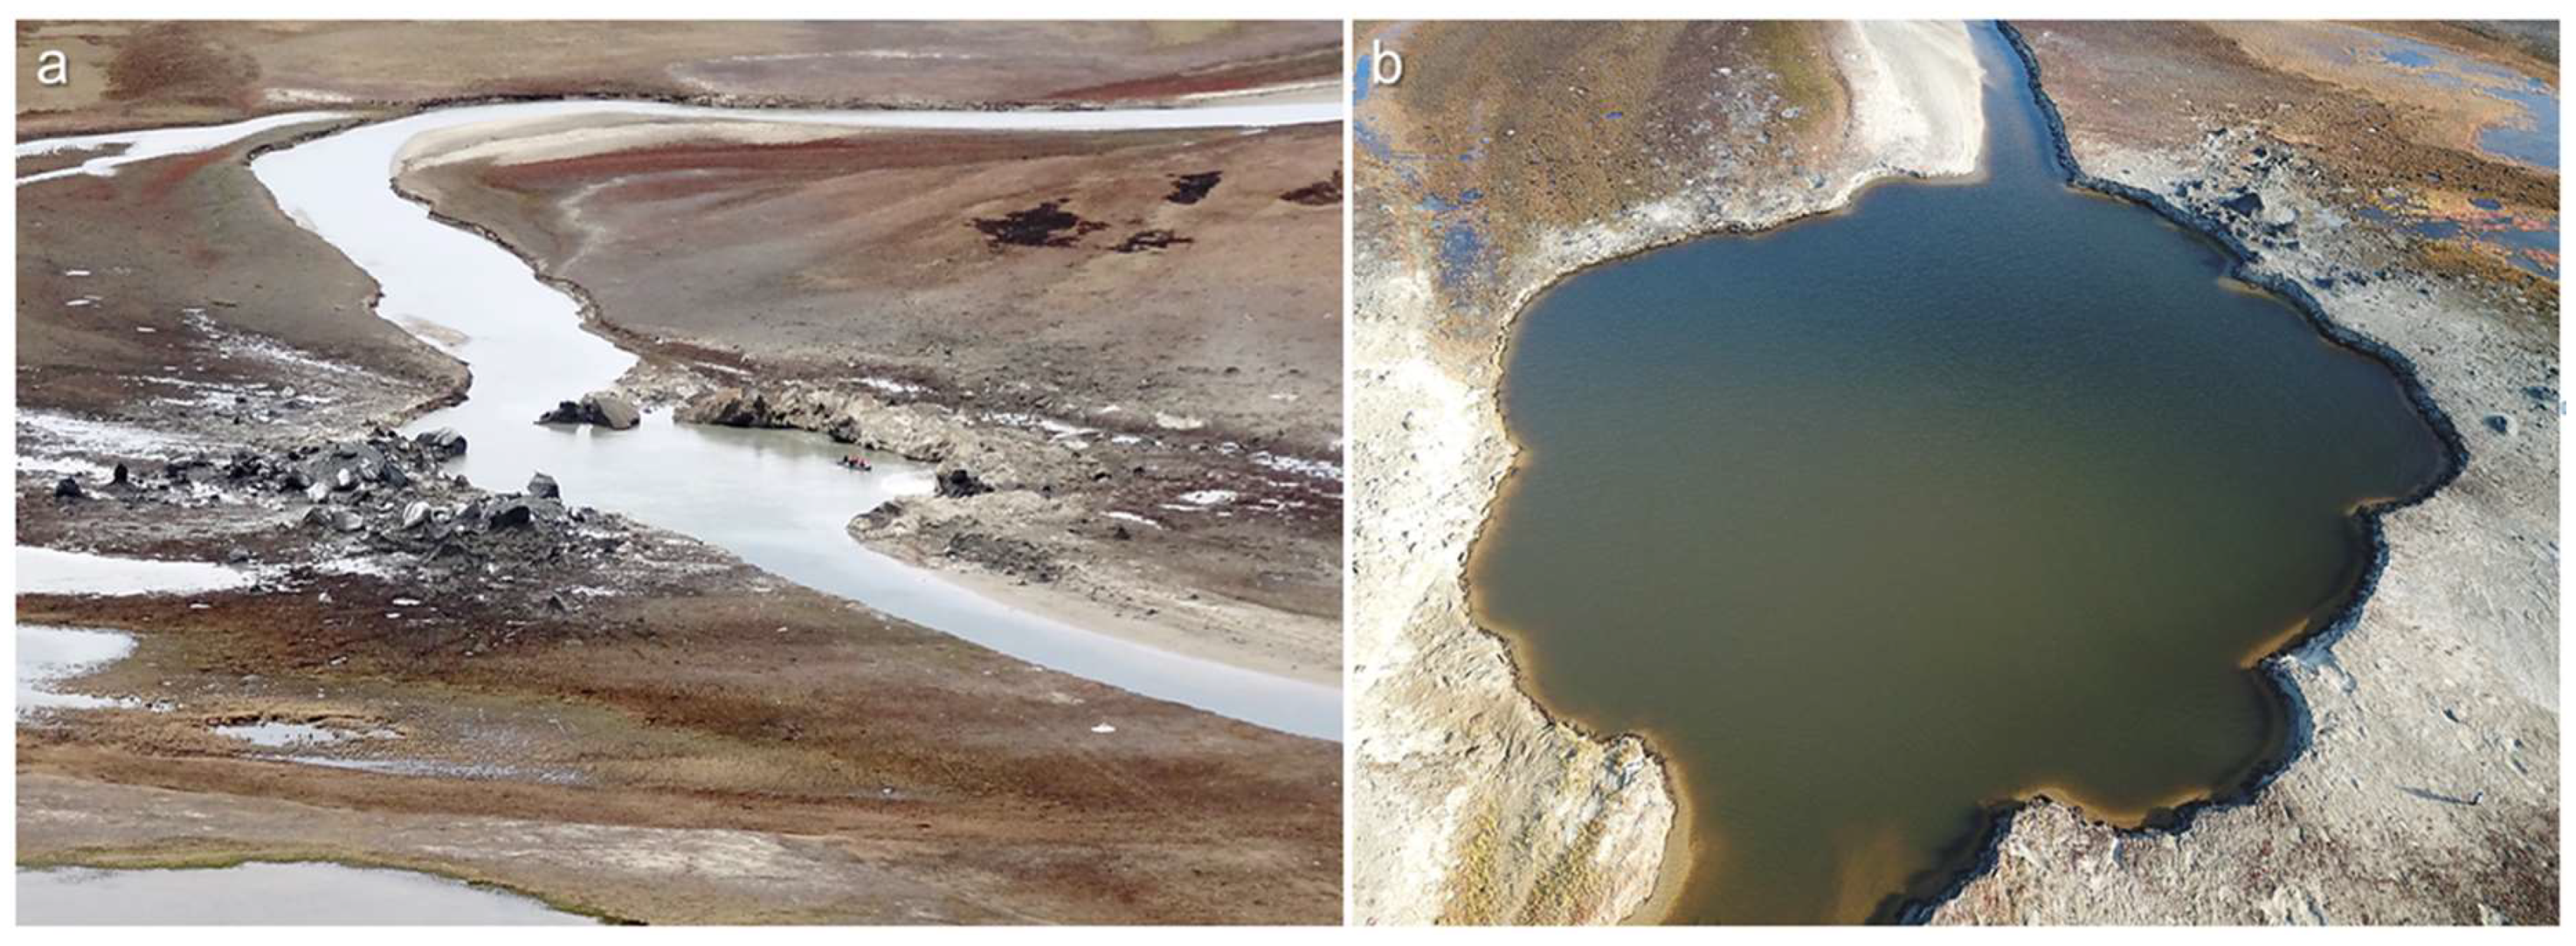
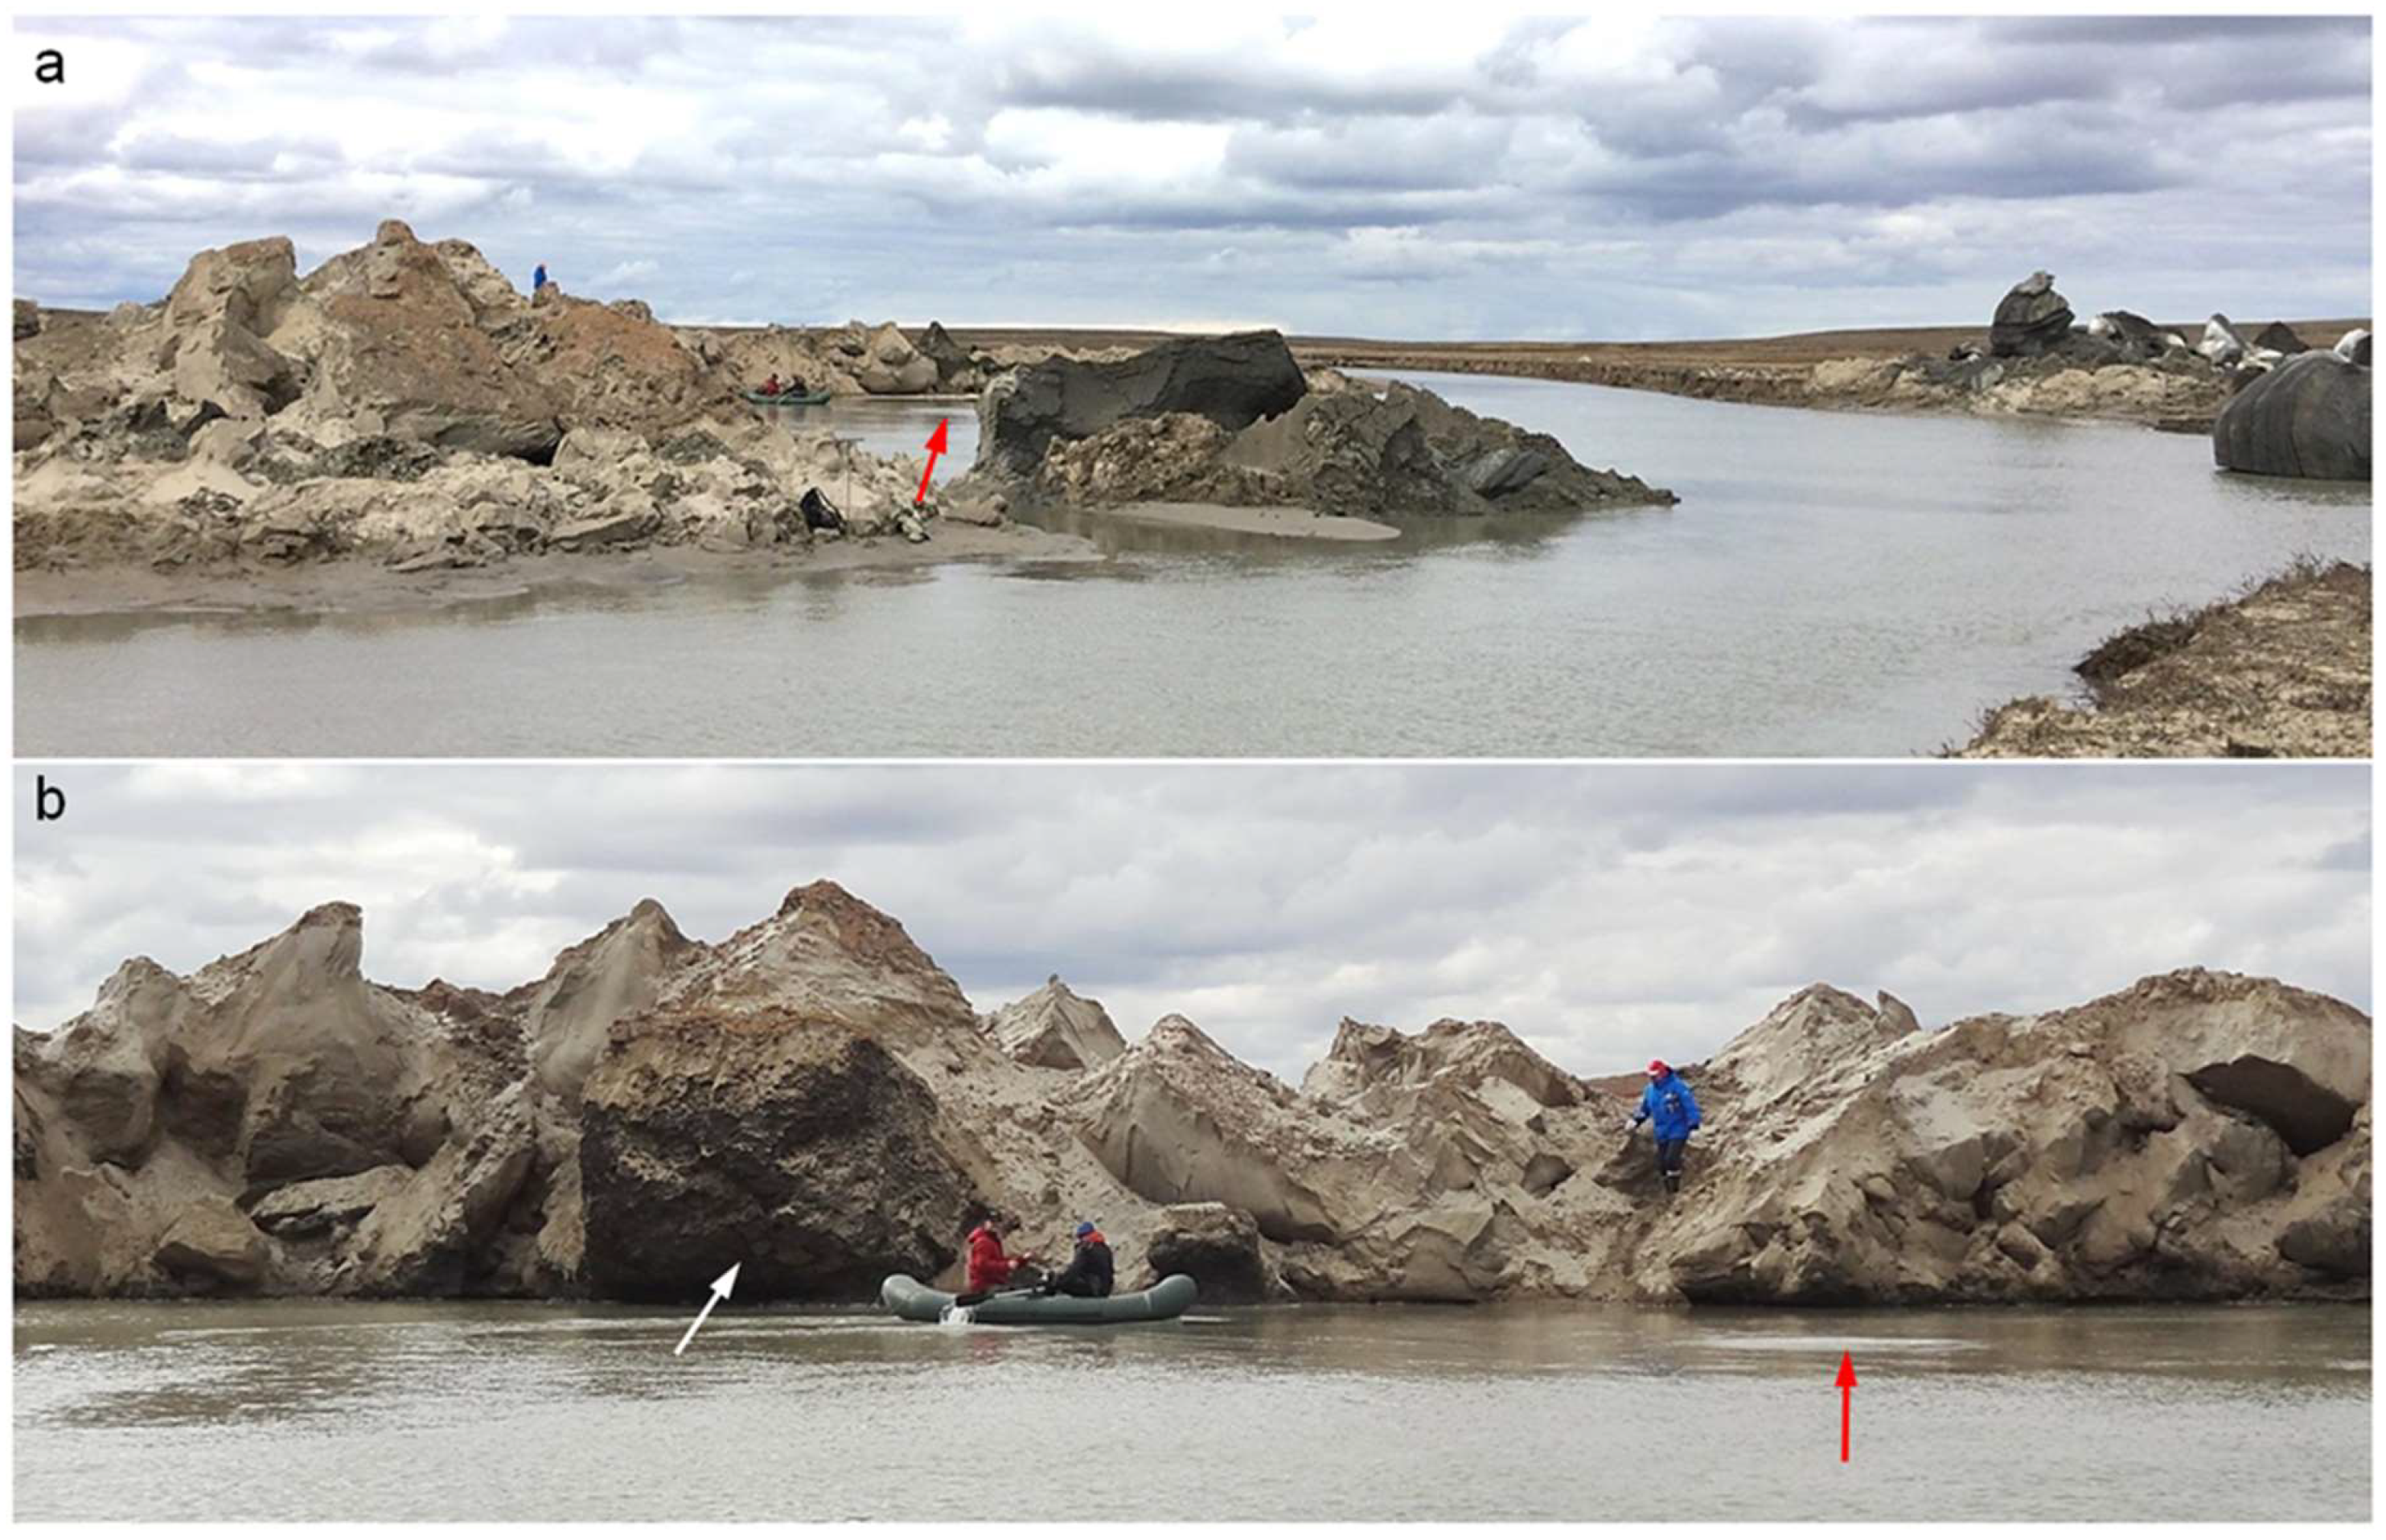
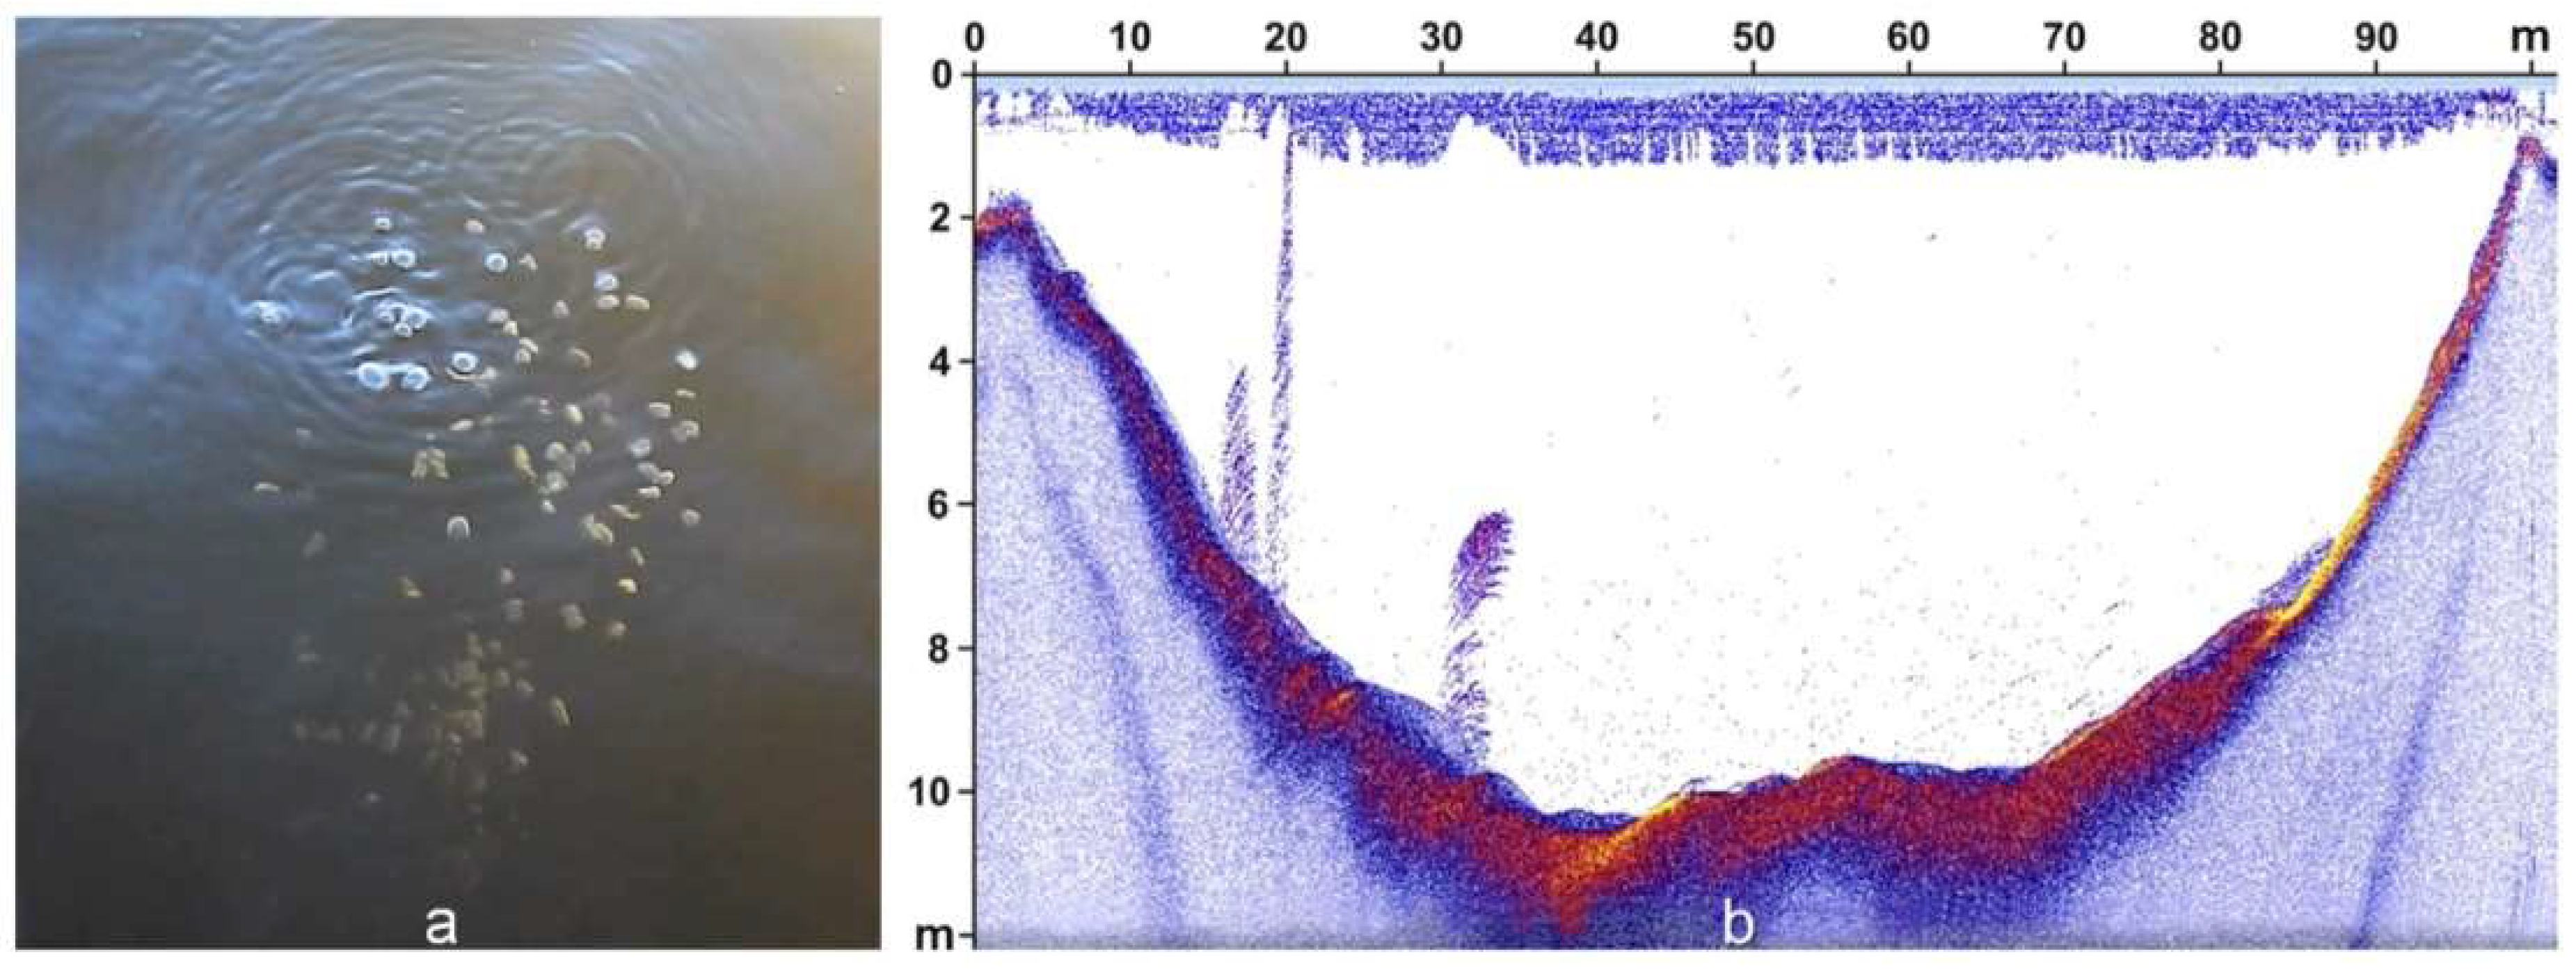
4.1. Field Studies

In September 2018, a complex multiday expedition covering three areas of the Seyakha-Sabetta region of Yamal, focusing on specific targets in study zones NS and ST (Figure 1), one of which was the C11 Crater in the NS zone (Figure 1 and Figure 2b), was undertaken. Various types of geophysical equipment allowed us to study the flooded area of the Seyakha C11 Crater (from the motor boat “Fregat”) and the adjacent land including the “DJI Mavic” drone, “Garmin Striker Plus 7cv”, and “Deeper Smart Sonar” echo sounders, and “Oko-3” GPR (Figure 5). Figure 5 shows the large fragments of rocks ejected from the Seyakha Crater onto the river bank.
The water level in September 2018 was approximately one meter lower compared to its high stand on 2 July 2017, and in many parts, the river depth appeared to be less than 30–40 cm. On 18–19 September 2018, gas seepage on the Seyakha Crater was still continuing, however, it was weaker than in July 2017. Visual observations and echo sounding data revealed more than 10 gas flares, associated with separate flows of ascending gas bubbles, mainly, 2–3 cm in diameter (Figure 6). It is likely that new gas accumulation is forming, which with the increase in pressure will lead to a new strong gas blowout, similar to the mechanism of mud volcanoes [61].
The GPR survey was conducted for radial and circular lines within the water area and also on the land near the crater (Figure 7). The GPR was placed at the bottom of the rubber boat for surveying the lake and the river (Figure 5). Eighteen sections of good quality data were acquired, with a total length of 2478 m.

4.2. Creating 3D Models Based on Complex Analysis of Echo Sounding, Ground Penetrating Radar Survey and Aerial Photography Data

This section presents the results of the complex processing and interpretation of aerial photography from the UAV, echo sounding, and GPR survey data, acquired during the expedition in September 2018. The field geophysical data, collected in 2018, were processed and interpreted in 2019.
An example of a GPR section across the crater for line 23 (location see Figure 7) is demonstrated in Figure 8a, where reflections from the crater bottom (A) and the top of the PF (B) can be identified. PF was recognized only at the crater walls. In the structure of the bottom, some sequences were distinguished with particularly oblique reflections, which may correspond to landslides (L). Separate landslide blocks, formed at certain time periods, could be divided by rather strong reflectors. Horizons underlying the assumed landslide blocks are supposed to mark older crater walls (A1), as they were prior to the major landslide deposition in the crater. The section also exhibited side reflections (S), which crossed reflections from the bottom. They seemed to be caused by landslides, not crossed directly by the survey line, but located very close to it, attached to adjacent parts of the crater walls, thus, acting as strong reflecting surfaces. The section is complicated with diffracted waves (D), most probably connected with edges of landslide blocks and certain layers of the sedimentary cover, outcropping in the crater lake, and thus, intersecting with the bottom horizon (A) and the top of the PF horizon (B). Furthermore, on the flanks of the crater, multiple reflection waves (M) were recognized, mimicking the older bottom horizon (A1), but dipping at a larger angle. The depth scale was estimated concerning the average velocity of electromagnetic waves in water of 0.033 m per ns [79].
The section for line 7, crossing the onshore territory adjacent to the crater, is demonstrated in Figure 8b, where reflections from the top of the PF (B) and, presumably, the base of the massive ground ice (ice-sediment contact) at time 150–220 ns (depths approximately 11–16.5 m) (C) can be distinguished. The section also exhibited two pseudo horizons that are formed by multiple reflection waves of various intensity (M1, M2), which obviously simulate the top of the PF (B). Between B and M1 horizons, the authors proposed the occurrence of a reflector, referring to the top of the massive ground ice (sediment-ice contact), which can be particularly recognized with dipping angles differing from those of B and M1. However, it is not possible to trace it accurately as there is interference with the multiples. There is another prominent reflector (E) above the B horizon, which is supposed to divide a soil layer saturated with water from the underlying relatively dryer unfrozen rocks.
For accurate conversion of the section from time to depth, it is necessary to know the velocity of the electromagnetic waves in each layer. Lacking these data in the present case, the authors used a single velocity of 0.15 m per ns, obtained by averaging the velocities for frozen rocks (0.11–0.15 m per ns) and ice (0.15–0.17 m per ns) [75,76,77].
It is worth noting that the top of the PF (the B horizon) was distinguished in the GPR sections everywhere, except for the bottom of the crater, which was covered with unconsolidated alluvial deposits. On land, the depth of the B horizon (thickness of the active layer) changed from 0.4 to 1.7 m (20–80 ns). In the river channel, it was up to 3.5 m (160 ns) from the bottom, due to an additional warming effect from the river water. Here, the velocity of 0.0436 m per ns was used, obtained on the basis of the GPR data and direct depth measurement by inserting a metal pole through unfrozen ground down to the PF top. Thus, taliks were not revealed under the riverbed. This is justified by the fact that the river is very shallow (0.3–0.4 m) and its channel freezes completely in winter. A talik (a way for gas supply) probably existed under the PLF and might still exist at the location of the C11 Crater, since gas is still seeping.
Figure 9 demonstrates the 3D DEM image of the surface of the Seyakha Crater bottom, the river bottom, and the elevation of the adjacent land area (water surface equals 0 m), created as a result of the complex processing of aerial photography from the UAV (Figure 2b, area ca. 150 m × 150 m), echo sounding, and GPR survey data. The 3D DEM was created by processing the data in Pix4Dmapper (passport error is a few centimeters per pixel) and ArcGIS software [67,72].
As a result of the GPR survey data complex processing and interpretation (using Geotech Geoscan32, IHS Kingdom, and ESRI ArcGIS software), a 3D model was created for the surface of the Seyakha Crater bottom, the river bottom (A), and the adjacent land area elevation (S), as of 18–19 September 2018 as well as for the top of PF (B) and, presumably, the base of the massive ground ice at depths of 10–15 m (C) (Figure 10). Surfaces A and S are demonstrated as a single continuous horizon, as seen in Figure 9. The 3D model in Figure 10 is represented in the time domain (in ns). Additionally, for better visual perception, each horizon is also demonstrated separately in Figure 10b–d.
On the C horizon, presumably marking the base of the massive ground ice, an elevation occurred in the southwestern part, also well recognizable in the GPR section in Figure 8b (at SP 60–105). It is likely that this elevation started to form, caused by the gas-dynamical process [5,6,23,80], as on the exploded C11 object. However, for the area of the C horizon elevation, the data of the 3D survey from the drone did not show heaving of the land (Figure 9). This could be due to the disadvantages of the DEM, which came from a limited area of survey from the drone.

5. Discussion and Conclusions

As a result of expeditions in 2017–2018 with the use of complex of geophysical methods in the area of the Seyakha gas blowout, important results were obtained and main goals were achieved, according to three points stated in the Introduction (main objectives):
(1)
The geological structure of the upper part of PF was studied. Echo sounding and GPR surveys in the crater lake and the river allowed us to obtain information on the structure of the bottom and identify several subsurface horizons including oblique layering in the riverbed deposits. Integration of the land surface and the water area data (echo sounding and GPR) allowed us to create a complex 3D model of the surface of the cryolithosphere.
Results of the geophysical studies of the crater demonstrated how its size had changed during the year between the two expeditions. According to the data obtained in September 2018 (GPR survey, echo sounding, drone photography), the crater has an average diameter of ca. 100 m (on a water level) and depth ca. 12 m, compared to 50 m × 70 m and about 56 m, respectively, in July 2017. This indicates active exogenic processes in the study area. The walls of the crater seem to have been exposed to intensive thermoabrasion by the river’s water flow. The initial bottom of the crater was covered by ejected fragments of frozen rock that fell back in the crater vent due to the explosion, and sediments transported by the river. Some sediments were deposited as landslides in the crater, having formed specific sequences that have been recognized in the GPR section (Figure 8a,L). The mentioned processes are still active, and the size of the crater is continuing to change. It was very fast initially, up to 1.6 m per day during the first month [35], but is now much slower.
(2)
With the help of echo sounding, more than 10 zones of continuous gas seepage on the crater bottom were revealed, evidence of active endogenous processes of the Earth degassing. The permafrost layer, as it is not recognized in the lower part of the GPR section, might be pinching out near the crater walls, thus leaving opportunities for permanent gas seepage through the sediments in several places of the crater bottom.
(3)
The obtained results confirm that the gas-dynamic mechanism on the Seyakha object is still active. Therefore, the authors have strong confirmation of the continuous and long-term gas emission of the C11 Crater, evidence of the volcanic mechanism. Almost all volcanic processes include stages of powerful gas blowouts (eruptions) and passive weak gas emission. Additionally, emissions can stop or be almost invisible. In the case of the C11 Crater, there was a strong eruption on 28 June 2017 and permanent emission (seepage) is still occurring. It is possible that due to an increase in pressure, a new powerful gas blowout will happen, as defined for another object, the Antipayuta C3 Crater [23].
It is still unclear from which depth the volcanic blowout started. Nevertheless, even if this blowout originated from a small depth, it could be related to shallow mud volcanoes, according to the well-known publication by Judd and Hovland [5].
Results of the two expeditions and analysis of RS data allowed us to reconstruct geodynamical processes of the PLF growth and crater formation after gas blowout and explosion. A conclusion was made about the short-term (3.5 years) gas-dynamical mechanism of the formation of the PLF with the gas-filled chamber. Most probably, gas self-ignition and explosion were caused by electrostatic discharge [25].
The Seyakha PLF (C11), formed in the Myudriyakha River on Yamal, has a close analogue: the Riverbed Pingo, which occurred in the valley of the Adventelva River [7,12,17,18]. However, the Riverbed Pingo that formed due to hydrostatic water pressure (open system, artesian pressure), partially blocked the river channel and water started to erode it at the southeastern side. The PLF at the location of the C11 Crater completely blocked the river channel, and the river started to flow with a new trajectory and erode the PLF in the eastern, southern, and southeastern parts. On both objects, the sedimentary rocks were partially eroded and the ground ice was outcropped and became exposed to thermoabrasion. These objects significantly differed in sizes: the C11 PLF was almost three times smaller than the Riverbed Pingo. Furthermore, the age of the Riverbed Pingo, as of 1990, was estimated as more than 30 years (in 1990), whereas the C11 PLF developed very fast: approximately in 3.5 years with an average rate of its growth over 80 cm per year [34,35]. This rate is more than 3–5.3 times higher than that of the Riverbed Pingo and other pingos in the north of Canada (from 2 to 15–26 cm per year [9,10,12,17,18]). Growth of the Riverbed Pingo stopped in 1990 and near its southern side, a new pingo started to grow. The C11 PLF exploded and the crater was formed at its location. Such a fast growth of the heave mound and further gas blowout indicate a strong gas-dynamic mechanism of its growth. It is worth noting that 30 m south from the C11 Crater, a high was revealed in the base of the massive ground ice (Figure 8b and Figure 10a,d).
New results of the C11 Crater are significant for understanding the processes of gas blowout and explosion not only on a local, but also on a regional scale. As the studied object is located within the NS area (Figure 1), it can additionally confirm the high risk of possible gas explosions in the eastern part of the Yamal Peninsula, which was justified by earlier studies of the region [33].
As a result of the field studies in 2018, the following conclusions and recommendations for future field works could be obtained:
-
Aerial photography using the “DJI Mavic Pro” UAV with data processing in Pix4Dmapper and ESRI ArcGIS software allowed us to operatively detect objects, which is useful for studying the geodynamical processes, creating DEMs, and monitoring landscape changes. This is actually important for studying objects of gas blowouts in the Arctic and volcanic processes. It is possible and useful to combine results of the studies with the data of ArcticDEM.
-
When using UAVs in the Arctic, the lack of satellites for reliable GPS tracking sometimes becomes a problem. High Arctic tracking of UAVs cannot only depend on one GPS, but must also involve other global satellite navigation systems in order to get reliable results. Therefore, we recommend the use of the GLONASS system and/or remote devices like D-RTK 2 High Precision GNSS [81] for additionally tracking UAVs. The D-RTK 2 Mobile Station is a highly accurate (up to one cm) GNSS receiver, which supports major global satellite navigation systems (for example, GPS, GLONASS, Beidou, and GALILEO).

Author Contributions

V.B. developed the methodology, supervised the research, obtained and processed the 2017–2018 field data, analyzed the data, and wrote the article; I.B. and R.N. obtained and processed the 2018 field data, worked with the RS data and prepared the GPR 3D models; A.K. interpreted the GPR data. All authors reviewed and approved the final version of the article.

Funding

The reported study was funded by “Rational usage of nature and effective development of oil and gas resources of the Arctic and Subarctic zones of the Earth” basic research program and Russian Foundation for Basic Research, Grant No. 18-05-70111 (2018).

Acknowledgments

The authors are grateful to the Government of the Yamal-Nenets Autonomous District and personally to D.N. Kobylkin and A.V. Mazharov, PJSC NOVATEK, OJSC Yamal LNG and personally to E.A. Kot for their great repeated assistance in conducting the 2017–2018 field studies; the representatives of the indigenous population, and especially M.N. Okotetto for providing important information; and the Geotech Company for assistance in conducting the GPR field work in 2018. The authors are also grateful to the anonymous reviewers whose recommendations helped to improve the article.

Conflicts of Interest

The authors declare no conflicts of interest.

References

  1. Andreassen, K.; Nilssen, E.G.; Ødegaard, C.M. Analysis of shallow gas and fluid migration within the Plio-Pleistocene sedimentary succession of the SW Barents Sea continental margin using 3D seismic data. Geo-Mar. Lett. 2007, 27, 155–171. [Google Scholar] [CrossRef]
  2. Andreassen, K.; Hubbard, A.; Winsborrow, M.; Patton, H.; Vadakkepuliyambatta, S.; Plaza-Faverola, A.; Gudlaugsson, E.; Serov, P.; Deryabin, A.; Mattingsdal, R.; et al. Massive blow-out craters formed by hydrate-controlled methane expulsion from the Arctic seafloor. Science 2017, 356, 948–953. [Google Scholar] [CrossRef] [PubMed] [Green Version]
  3. Hovland, M.; Svensen, H. Submarine pingoes: Indicators of shallow gas hydrates in a pockmark at Nyegga, Norwegian Sea. Mar. Geol. 2006, 228, 15–23. [Google Scholar] [CrossRef]
  4. Jones, B.M.; Grosse, G.; Hinkel, K.M.; Arp, C.D.; Walker, S.; Beck, R.A.; Galloway, J.P. Assessment of pingo distribution and morphometry using an IfSAR derived digital surface model, western Arctic Coastal Plain, Northern Alaska. ElsevierGeomorphol 2012, 138, 1–14. [Google Scholar] [CrossRef]
  5. Judd, A.; Hovland, M. The evidence of shallow gas in marine sediments. Cont. Shelf Res. 1992, 12, 1081–1095. [Google Scholar] [CrossRef]
  6. Judd, A.; Hovland, M. Seabed Fluid Flow. The Impact on Geology, Biology, and the Marine Environment; Cambridge University Press: New York, NY, USA, 2007; p. 475. [Google Scholar]
  7. Liestol, O. Pingos, Springs, and Permafrost in Spitsbergen Arbok; Norsk Polarinstitutt: Oslo, Norway, 1975; pp. 7–30. [Google Scholar]
  8. Mackay, J.R. Pingos of the Tuktoyaktuk Peninsula Area, Northwest Territories. Géogr. Phys. Quat. 1979, 33, 3–61. [Google Scholar] [CrossRef] [Green Version]
  9. Mackay, J.R. The birth and growth of Porsild Pingo, Tuktoyaktuk Peninsula, district of Mackenzie. Arctic 1988, 4141, 267–274. [Google Scholar] [CrossRef]
  10. Mackay, J.R. Pingo growth and collapse, Tuktoyaktuk Peninsula Area, Western Arctic Coast, Canada: A long-term field study. Géogr. Phys. Quat. 1998, 5252, 271–323. [Google Scholar] [CrossRef] [Green Version]
  11. Maier, L. Killing the King Christian D-18 well, Arctic Islands. Pet. Hist. Soc. Arch. 2014, 2525, 5–10. [Google Scholar]
  12. Matsuoka, N.; Sawaguchi, S.; Yoshikawa, K. Present-day periglacial environments in Central Spitsbergen, Svalbard. Geogr. Rev. Jpn. 2004, 7777, 276–300. [Google Scholar] [CrossRef]
  13. Paull, C.K.; Lii, W.U.; Dallimore, S.R.; Blasco, S.M.; Lorenson, T.D.; Melling, H.; Medioli, B.E.; Nixon, F.M.; McLaughlin, F.A. Origin of pingo-like features on the Beaufort Sea shelf and their possible relationship to decomposing methane gas hydrates. Geophys. Res. Lett. 2007, 34, L01603. [Google Scholar] [CrossRef] [Green Version]
  14. Paull, C.K.; Dallimore, S.R.; Caress, D.W.; Gwiazda, R.; Melling, H.; Riedel, M.; Jin, Y.K.; Hong, J.K.; Kim, Y.-G.; Graves, E.D.; et al. Active mud volcanoes on the continental slope of the Canadian Beaufort Sea. Geochem. Geophys. Geosyst. 2015, 16, 3160–3181. [Google Scholar] [CrossRef]
  15. Serov, P.; Portnov, A.; Mienert, J.; Semenov, P.; Ilatovskaya, P. Methane release from pingo-like features across the South Kara Sea shelf, an area of thawing offshore permafrost. J. Geophys. Res. Earth Surf. 2015, 120, 1515–1529. [Google Scholar] [CrossRef] [Green Version]
  16. Serov, P.; Vadakkepuliyambatta, S.; Mienert, J.; Patton, H.; Portnov, A.; Silyakova, A.; Panieri, G.; Carroll, J.L.; Andreassen, K.; Hubbard, A. Postglacial response of Arctic Ocean gas hydrates to climatic amelioration. Proc. Natl. Acad. Sci. USA 2017, 114, 6215–6220. [Google Scholar] [CrossRef] [PubMed] [Green Version]
  17. Yoshikawa, K. Notes on open-system Pingo Ice, Adventdalen, Spitsbergen. Permafr. Periglac. Process. 1993, 4, 327–334. [Google Scholar] [CrossRef]
  18. Yoshikawa, K. The groundwater hydraulics of open system pingos. In Permafrost—Seventh International Conference (Proceedings); International Permafrost Association: Yellowknife, NWT, Canada, 1998; pp. 1177–1184. [Google Scholar]
  19. Bogoyavlensky, V.I. Arctic and the World Ocean: Current state, perspectives and challenges of development of hydrocarbon resources. In Transactions of Free Economic Society of Russia; VEO Publ.: Moscow, Russia, 2014; Volume 182, pp. 11–175. (In Russian) [Google Scholar]
  20. Bogoyavlensky, V.I. The threat of catastrophic gas blowouts from the Arctic permafrost. Funnels of Yamal and Taymyr. Drill. Oil 2014, 9, 13–18. (In Russian) [Google Scholar]
  21. Bogoyavlensky, V.I. The threat of catastrophic gas blowouts from the Arctic permafrost. Funnels of Yamal and Taymyr. Part 2. Drill. Oil 2014, 10, 4–8. (In Russian) [Google Scholar]
  22. Bogoyavlensky, V. Gas Blowouts on the Yamal and Gydan Peninsulas. GeoExPro 2015, 1212, 74–78. [Google Scholar]
  23. Bogoyavlensky, V.I. Gas-hydrodynamics in the Arctic craters of gas blowout. Arctic: Ecol. Econ. 2018, 1, 48–55. (In Russian) [Google Scholar] [CrossRef]
  24. Bogoyavlensky, V.I. Innovative technologies and results of studying processes of natural and man-made degassing of the earth in the Lithosphere-Cryosphere-Hydrosphere-Atmosphere system. In Proceedings of the Third International Conference on Geology of the Caspian Sea and Adjacent Areas, Baku, Azerbaijan, 16–18 October 2019. [Google Scholar]
  25. Bogoyavlensky, V.I. Natural and technogenic threats in fossil fuels production in the Earth cryolithosphere. Russ. Min. Ind. 2020, 1, 97–118. (In Russian) [Google Scholar] [CrossRef] [Green Version]
  26. Bogoyavlensky, V.I.; Bogoyavlensky, I.V. Accidental and catastrophic gas blowouts during hydrocarbon resources development in the Arctic zones of the USA and Canada. Drill. Oil 2019, 12, 3–8. [Google Scholar]
  27. Bogoyavlensky, V.I.; Bogoyavlensky, I.V. Formation of hydrocarbon accumulations in the upper part of section and craters of gas blowouts. Neftegaz. Ru 2019, 1, 48–55. (In Russian) [Google Scholar]
  28. Bogoyavlensky, V.I.; Garagash, I.A. Justification of gas blowout craters formation process in the Arctic by mathematical modeling. Arct. Ecol. Econ. 2015, 33, 12–17. [Google Scholar]
  29. Bogoyavlensky, V.I.; Bogoyavlensky, I.V.; Nikonov, R.A. Results of aerial, space and field investigations of large gas blowouts near Bovanenkovo field on Yamal peninsula. Arct. Ecol. Econ. 2017, 3, 4–17. (In Russian) [Google Scholar] [CrossRef]
  30. Bogoyavlensky, V.I.; Boichuk, V.M.; Perekalin, S.O.; Bogoyavlensky, I.V.; Kargina, T.N. Kumzhinskoye gas condensate field disaster: Reasons, results and ways of eliminating the consequences. Arct. Ecol. Econ. 2017, 1, 32–46. (In Russian) [Google Scholar]
  31. Bogoyavlensky, V.; Kishankov, A.; Yanchevskaya, A.; Bogoyavlensky, I. Forecast of gas hydrates distribution zones in the arctic ocean and adjacent offshore areas. Geosciences 2018, 8, 453. [Google Scholar] [CrossRef] [Green Version]
  32. Bogoyavlensky, V.I.; Bogoyavlensky, I.V.; Kargina, T.N.; Nikonov, R.A.; Sizov, O.S. Earth degassing in the Artic: Remote and field studies of the thermokarst lakes gas eruption. Arct. Ecol. Econ. 2019, 2, 31–47. (In Russian) [Google Scholar] [CrossRef]
  33. Bogoyavlensky, V.I.; Sizov, O.S.; Bogoyavlensky, I.V.; Nikonov, R.A.; Kargina, T.N. Earth degassing in the arctic: Comprehensive studies of the distribution of Frost Mounds and Thermokarst Lakes with gas blowout craters on the Yamal Peninsula. Arct. Ecol. Econ. 2019, 4, 52–68. (In Russian) [Google Scholar] [CrossRef] [Green Version]
  34. Bogoyavlensky, V.I.; Sizov, O.S.; Bogoyavlensky, I.V.; Nikonov, R.A.; Kishankov, A.V.; Kargina, T.N. Study of the seyakha gas explosion on the Yamal Peninsula. In Proceedings of the Conference “Geomodel 2019”, Gelendzhik, Russia, 13–18 September 2019; pp. 1–5. [Google Scholar]
  35. Bogoyavlensky, V.I.; Sizov, O.S.; Mazharov, A.V.; Bogoyavlensky, I.V.; Nikonov, R.A.; Kishankov, A.V.; Kargina, T.N. Earth degassing in the Arctic: Remote and field studies of the Seyakha catastrophic gas emission on the Yamal Peninsula. Arct. Ecol. Econ. 2019, 1, 80–105. (In Russian) [Google Scholar] [CrossRef]
  36. Buldovicz, S.N.; Khilimonyuk, V.Z.; Bychkov, A.Y.; Ospennikov, E.N.; Vorobyev, S.A.; Gunar, A.Y.; Gorshkov, E.I.; Chuvilin, E.M.; Cherbunina, M.Y.; Kotov, P.I.; et al. Cryovolcanism on the earth: Origin of a spectacular crater in the Yamal Peninsula (Russia). Sci. Rep. 2018, 8, 13534. [Google Scholar] [CrossRef] [PubMed]
  37. Chuvilin, E.M.; Yakushev, V.S.; Perlova, E.V. Gas and possible gas hydrates in the permafrost of bovanenkovo gas field, Yamal Peninsula, West Siberia. Polarforschung 1998, 68, 215–219. [Google Scholar]
  38. Chuvilin, E.; Bukhanov, B.; Davletshina, D.; Grebenkin, S.; Istomin, V. Dissociation and self-preservation of gas hydrates in permafrost. Geosciences 2018, 8, 431. [Google Scholar] [CrossRef] [Green Version]
  39. Chuvilin, E.; Davletshina, D.; Ekimova, V.; Bukhanov, B.; Shakhova, N.; Semiletov, I. Role of warming in destabilization of intrapermafrost gas hydrates in the arctic shelf: Experimental modeling. Geosciences 2019, 9, 407. [Google Scholar] [CrossRef] [Green Version]
  40. Dvornikov, Y.A.; Leibman, M.O.; Khomutov, A.V.; Semenov, P.; Bussman, I.; Babkin, E.M.; Heim, B.; Portnov, A.; Babkina, E.A.; Streletskaya, I.D.; et al. Gas-emission craters of the Yamal and Gydan peninsulas: A proposed mechanism for lake genesis and development of permafrost landscapes. Permafr. Periglac. Process. 2019, 30, 146–162. [Google Scholar] [CrossRef] [Green Version]
  41. Kizyakov, A.I.; Sonyushkin, A.V.; Khomutov, A.V.; Dvornikov, Y.A.; Leibman, M.O. Assessment of the relief-forming effect of the Antipayuta gas emission crater formation using satellite stereo pairs. Curr. Probl. Remote Sens. Earth Space 2017, 14, 67–75. (In Russian) [Google Scholar] [CrossRef]
  42. Kizyakov, A.; Khomutov, A.; Zimin, V.; Khairullin, R.; Babkina, E.; Dvornikov, Y.; Leibman, M. Microrelief associated with gas emission craters: Remote-sensing and field-based study. Remote Sens. 2018, 10, 677. [Google Scholar] [CrossRef] [Green Version]
  43. Leibman, M.O.; Kizyakov, A.I.; Plekhanov, A.V.; Streletskaya, I.D. New permafrost feature-deep crater in Central Yamal (West Siberia, Russia) as a response to local climate fluctuations. In Geography, Environment, Sustainability; Kasimov, N.S., Kotlyakov, V.M., Vandermotten, C., Eds.; Lomonosov Moscow State University: Moscow, Russia, 2014; Volume 7, pp. 68–79. [Google Scholar]
  44. Leibman, M.O.; Dvornikov, Y.A.; Khomutov, A.V.; Babkin, E.M.; Babkina, E.A.; Vanshtein, B.G.; Kizyakov, A.I.; Oblogov, G.E.; Semenov, P.B.; Streletskaya, I.D. Water-chemical features of the water of lakes and funnels of the gas emission, invested in marine deposits of the north of Western Siberia. In Geology of Seas and Oceans, Proceedings of the XXII International Scientific Conference (School) for Marine Geology; IO RAS: Moscow, Russia, 2017; pp. 117–121. (In Russian) [Google Scholar]
  45. Olenchenko, V.V.; Sinitsky, A.I.; Antonov, E.Y.; Eltsov, I.N.; Kushnarenko, O.N.; Plotnikov, A.E.; Potapov, V.V.; Epov, M.I. Results of geophysical surveys of the area of “Yamal crater”, the new geological structure. Kriosf. Zemli 2015, 19, 84–95. [Google Scholar]
  46. Rokos, S.I. Engineering-geological features of near-surface zones of abnormally high formation pressure on the shelf of the Pechora Sea and southern part of the Kara Sea. Eng. Geol. 2008, 4, 22–28. [Google Scholar]
  47. Vorobyev, S.; Bychkov, A.; Khilimonyuk, V.; Buldovicz, S.; Ospennikov, E.; Chuvilin, E. Formation of the Yamal crater in Northern West Siberia: Evidence from geochemistry. Geosciences 2019, 9, 515. [Google Scholar] [CrossRef] [Green Version]
  48. Yakushev, V.S.; Chuvilin, E.M. Natural gas and gas hydrate accumulations within permafrost in Russia. Cold Reg. Sci. Technol. 2000, 31, 189–197. [Google Scholar] [CrossRef]
  49. Yakushev, V.S. Natural Gas and Gas Hydrates in Cryolithic Zone; VNIIGAZ: Moscow, Russia, 2009; p. 192. (In Russian) [Google Scholar]
  50. Fenin, G.I. Anomalous reservoir pressure in the zones of hydrocarbon accumulation oil and gas bearing basins. Pet. Geol. Theor. Appl. Stud. 2010, 5, 1–20. [Google Scholar]
  51. Deep Water. The Gulf Oil Disaster and the Future of Offshore Drilling. Report to the President; January 2011; p. 398. Available online: https://www.govinfo.gov/content/pkg/GPO-OILCOMMISSION/pdf/GPO-OILCOMMISSION.pdf (accessed on 3 May 2020).
  52. Yakushev, V.S.; Semenov, A.P.; Bogoyavlensky, V.I.; Medvedev, V.I.; Bogoyavlensky, I.V. Experimental modeling of methane release from intrapermafrost relic gas hydrates when sediment temperature change. Cold Reg. Sci. Technol. 2018, 149, 46–50. [Google Scholar] [CrossRef]
  53. Kotlyakov, V.M.; Komarova, A.I. Elsevier’s Dictionary of Geography; Elsevier: Amsterdam, The Netherlands, 2007; p. 1073. [Google Scholar]
  54. Cunningham, R.; Lindholm, R.M. Seismic evidence for widespread gas hydrate formation, offshore west Africa, In Petroleum Systems of South. AAPG Mem. 2000, 73, 93–105. [Google Scholar] [CrossRef]
  55. Freire, A.F.M.; Matsumoto, R.; Santos, L.A. Structural-stratigraphic control on the Umitaka Spur gas hydrates of Joetsu Basin in the eastern margin of Japan Sea. Mar. Pet. Geol. 2011, 28, 1967–1978. [Google Scholar] [CrossRef]
  56. Paull, C.K.; Norman, W.R.; Ussler, W.; Caress, D.W.; Keaten, R. Association among active seafloor deformation, mound formation, and gas hydrate growth and accumulation within the seafloor of the Santa Monica Basin, offshore California. Mar. Geol. 2008, 250, 258–275. [Google Scholar] [CrossRef]
  57. Serié, C.; Huuse, M.; Schødt, N.H. Gas hydrate pingoes: Deep seafloor evidence of focused fluid flow on continental margins. Geology 2012, 40, 207–210. [Google Scholar] [CrossRef]
  58. Kaledina, V.F.; Kaledina, I.O.; Sleptsov, V.I. Protection in Emergencies; MSU Publ.: Moscow, Russia, 2004; p. 285. (In Russian) [Google Scholar]
  59. Skorobogatov, V.A.; Yakushev, V.S.; Chuvilin, E.M. Sources of natural gas within permafrost in North- West Siberia. In Proceedings of the 7th International Permafrost Conference; International Permafrost Association: Yellowknife, NWT, Canada, 1998; pp. 1001–1007. [Google Scholar]
  60. Nezhdanov, A.A.; Novopashin, V.F.; Ogibenin, V.V.; Akhmedsafin, S.K.; Varyagov, S.A. Mud volcanism in the north of Western Siberia. In TyumemNIIgiprogaz Ltd Paper Collection; Flat: Tyumen, Russia, 2011; pp. 74–79. (In Russian) [Google Scholar]
  61. ISO 19901-2:2017(en). Petroleum and Natural Gas Industries—Specific Requirements for Offshore Structures—Part 2: Seismic Design Procedures and Criteria. Available online: https://www.iso.org/obp/ui/#iso:std:iso:19901:-2:ed-2:v1:en (accessed on 3 May 2020).
  62. OMSK Cartographic Factory. Atlas of the Yamal-Nenets Autonomous District; Omsk Cartographic Factory: Omsk, Russia, 2004; p. 30. (In Russian) [Google Scholar]
  63. Skorobogatov, V.A.; Stroganov, L.V.; Kopeev, V.D. Geological Structure and Gas and Oil Content in Yamal; Nedra-Biznestsentr: Moscow, Russia, 2003; p. 352. [Google Scholar]
  64. King, L.H.; MacLean, B. Pockmarks on the scotian shelf. Geol. Soc. Am. (Bull.) 1970, 81, 3141–3148. [Google Scholar] [CrossRef]
  65. Dvoretskiy, P.I.; Goncharov, V.S.; Esikov, A.D. Isotopic Composition of Natural Gases in the North of the Western Siberia: Overview; Gazprom IAC LLC: Moscow, Russia, 2000; p. 80. (In Russian) [Google Scholar]
  66. ArcticDEM. Available online: https://www.pgc.umn.edu/data/arcticdem/ (accessed on 15 September 2019).
  67. Bogoyavlensky, I.V. Perspectives of implementing remote methods for geoecological tasks with creating 3D models. In Proceedings of the Third International Conference on Geology of the Caspian Sea and Adjacent Areas, Baku, Azerbaijan, 16–18 October 2019; pp. 1–5. [Google Scholar]
  68. Porter, C.; Morin, P.; Howat, I.; Noh, M.; Bates, B.; Peterman, K.; Keesey, S.; Schlenk, M.; Gardiner, J.; Tomko, K.; et al. ArcticDEM. Harv. Dataverse 2018, 1. [Google Scholar] [CrossRef]
  69. Bhardwaj, A.; Sam, L.; Martín-Torres, F.-J.; Kumar, R. UAVs as remote sensing platform in glaciology: Present applications and future prospects. Elsevier Remote Sens. Environ. 2016, 175, 196–204. [Google Scholar] [CrossRef]
  70. Gaffey, C.; Bhardwaj, A. Applications of unmanned aerial vehicles in cryosphere: Latest advances and prospects. Remote Sens. 2020, 12, 948. [Google Scholar] [CrossRef] [Green Version]
  71. Stuchlík, R.; Stachoň, Z.; Láska, K.; Kubíček, P. Unmanned Aerial Vehicle—Efficient mapping tool available for recent research in polar regions. Czech. Polar Rep. 2015, 5, 210–221. [Google Scholar] [CrossRef]
  72. Pix4Dmapper. Getting Started Manual; Pix4: Prilly, Switzerland, 2018; p. 25. [Google Scholar]
  73. Kozlov, D.N.; Zharkov, R.V. Experience of echosounding research in study of morphology of the hard lakes basin of the Kuril islands. In Geomorphology and Cartography: Materials of the XXXIII Plenum of the Geomorphological Commission of RAS; Publ. of Saratov University: Saratov, Russia, 2013; pp. 319–323. [Google Scholar]
  74. Geotech Company Group. OKO-3 GPR with a Control Unit. Available online: http://geotechru.com/oko-3-gpr-with-control-unit-2/ (accessed on 3 May 2020).
  75. Brandt, O.; Langley, K.; Kohler, J.; Hamran, S.-E. Detection of buried ice and sediment layers in permafrost using multi-frequency Ground Penetrating Radar: A case examination on Svalbard. Elsevier Remote Sens. Environ. 2007, 111, 212–227. [Google Scholar] [CrossRef]
  76. Gusmeroil, A.; Liu, L.; Schaefer, K.; Zhang, T.; Schaefer, T.; Grosse, G. Active layer stratigraphy and organic layer thickness at a thermokarst site in arctic alaska identified using ground penetrating radar. Arct. Antarct. Alp. Res. 2015, 47, 195–202. [Google Scholar] [CrossRef] [Green Version]
  77. Tregubov, O.; Kraev, G.; Maslakov, A. Hazards of activation of cryogenic processes in the arctic community: A geopenetrating radar study in Lorino, Chukotka, Russia. Geosciences 2020, 10, 57. [Google Scholar] [CrossRef] [Green Version]
  78. Geotech Company Group. GEOSCAN 32 Demo for Windows VISTA. Available online: http://geotechru.com/geoscan-32-demo-fo-windows-vista/ (accessed on 3 May 2020).
  79. Moorman, B.; Robinson, S.; Burgess, M. Imaging near-surface permafrost structure and characteristics with Ground-Penetrating Radar. CSEG Rec. J. 2007, 32, 23–30. [Google Scholar]
  80. Lee, S.H.; Chough, S.K. Distribution and origin of shallow gas in deep-sea sediments of the Ulleung Basin, East Sea (Sea of Japan). Geo-Mar. Lett. 2003, 22, 204–209. [Google Scholar] [CrossRef]
  81. D-RTK 2 High Precision GNSS Mobile Station. Available online: https://www.dji.com/d-rtk-2?site=brandsite&from=insite_search (accessed on 20 February 2020).
Figure 1. Gas blowout craters in the central part of the Yamal Peninsula. (1) Areas of detailed studies of Oil and Gas Research Institute of Russian Academy of Sciences (OGRI RAS): B, Bovanenkovo; ST, South Tambey; NT, North Tambey; NS, Neito-Seyakha. (2) Craters of gas blowouts C1, C2, C9 and C11. (3) Gas and gas condensate fields including those marked with pink color: Bovanenkovo (1), South Tambey (2), North Tambey (3) and West Seyakha (4). (4) Gas pipeline Bovanenkovo-Ukhta. (5) Railroad. Basemap—ESRI standard imagery.
Geosciences 10 00215 g001
Figure 2. Seyakha gas blowout crater. Photos from a helicopter, 2 July 2017 (a) and a drone, 19 September 2018 (b). Source: Vasily and Igor Bogoyavlensky.
Geosciences 10 00215 g002
Figure 3. Panoramic photos of the exploded pingo-like feature (PLF) from the river left bank (a) and a view of the parapet on the right bank (b), 2 July 2017 (photos by Vasily Bogoyavlensky). Notes: red arrow indicates the strong gas seepage from the crater bottom; white arrow is the remnant of the PLF dome.
Geosciences 10 00215 g003
Figure 4. Massive fragments of ground ice (a) and frozen sandy loam rock (b) ejected by the explosion, 2 July 2017 (photos by Vasily Bogoyavlensky).
Geosciences 10 00215 g004
Figure 5. Echo sounding and ground penetrating radar survey (GPR) on the water area of the Seyakha C11 Crater from the motor boat “Fregat”, 19 September 2018 (photo by Roman Nikonov).
Geosciences 10 00215 g005
Figure 6. Gas emission (photo by Igor Bogoyavlensky) (a) and NW–SE echo sounding section (b) with three gas flares on the Seyakha C11 Crater flooded by the river.
Geosciences 10 00215 g006
Figure 7. Lines of the GPR survey within the Seyakha C11 Crater and adjacent territory. Basemap: aerial image from the drone, 18 September 2018 (photo by Igor Bogoyavlensky).
Geosciences 10 00215 g007
Figure 8. GPR sections for lines 23, across the crater lake (a) and 7, on the left, southeastern bank (b). Legend: reflections from the bottom (A), older bottom (A1), the top of permafrost (B), the base of the massive ground ice (C), base of the upper soil layer (E), multiple reflections from the crater bottom (M) and the top of permafrost (M1 and M2), side reflections (S), diffracted waves (D), landslides blocks (L, orange-shaded).
Geosciences 10 00215 g008
Figure 9. Complex 3D DEM of the Seyakha C11 gas blowout area surface.
Geosciences 10 00215 g009
Figure 10. 3D model of the upper part of the sedimentary cover in the area of the C11 Crater based on GPR data with three horizons (a) and each horizon separately (b–d): A, the surface of the crater and the river bottom; S, the surface of the adjacent land area; B, the top of permafrost; C, reflecting horizon at the depth of 10–15 m (presumably, the base of the massive ground ice).
Geosciences 10 00215 g010
Table 1. Coordinates of the gas blowout craters on the Yamal Peninsula.
LatitudeLongitudeDate of Formation
C169.97168.3702014 Q1
C270.14568.4962012 Q3
C970.06269.1002013 Q1?
C1170.30271.7462017.06.28

