Pollution Plume Development in the Primary Aquifer at the Atlantis Historical Solid Waste Disposal Site, South Africa

CSIR, Natural Resources and Environment, Stellenbosch 7600, South Africa
*
Author to whom correspondence should be addressed.
Geosciences 2018, 8(7), 231; https://doi.org/10.3390/geosciences8070231
Submission received: 4 May 2018
/
Revised: 15 June 2018
/
Accepted: 18 June 2018
/
Published: 22 June 2018
(This article belongs to the Special Issue Groundwater Pollution)
Abstract
:The monitoring of pollution plumes from municipal landfills is essential in order to control and, where necessary, remediate aquifer contamination. The Atlantis historical landfill was established in 1975 and was unlined as it preceded the promulgation of the Minimum Requirements by the Department of Water and Sanitation. As the underlying, unconfined sandy aquifer serves as a water supply source to the town of Atlantis, regular quarterly hydrochemical monitoring was carried out from 1989 to 1997, at irregular intervals until 2003, and resumed in 2015 when new, deep boreholes were drilled. Groundwater monitoring over nearly three decades provided valuable information on the nature of the chemical reactions that take place in the subsurface and the extent of transport of chemical constituents. Ammonium and organic carbon, which are subject to redox reactions, were lagging compared to chloride and sodium, which are transported advectively. The most recent data indicated the plume consisted mainly of salinity (electrical conductivity (EC) > 200 mS m−1) in the form of sodium, calcium, chloride and bicarbonate ions 350–400 m down-gradient of the landfill, and it is still expanding at a maximum rate of about 25 m a−1, with local deviations from the regional flow pattern. It also became evident that the plume migrated to greater depth as it was transported further from the waste pile. The breakthrough of contaminants being observed at different depths highlights the importance of suitably designed monitoring networks.
1. Introduction and Background
Municipal landfills are a potential source of pollution for underlying groundwater, where release of contaminants may occur for decades and longer, and contamination may spread in the form of pollution plumes down-gradient of the source. The difficulties of preventing contaminant leaching and containing/remediating pollution plumes are exacerbated when landfills are unlined and exposed to rainfall and infiltration (usually old landfills) [1], and under specific hydrogeological settings. Shallow and alluvial aquifers are particularly vulnerable because they are overlain by a thin vadose zone and characterized by high hydraulic conductivities of groundwater that results in rapid spreading of pollution plumes. Additional challenges are the wide range of contaminants present in landfill leachates and the complex geochemical processes occurring in the aquifer. Landfills contain a variety of building material, commercial and industrial waste, medicinal waste, organic waste from households, inorganic waste and metals [2]. Kjeldsen et al. [1] characterized leachate pollutants as dissolved organic matter (expressed as chemical oxygen demand or total organic carbon), inorganic macro-components, heavy metals, and xenobiotic organic compounds. Temporal variations and variations in groundwater quality with depth were documented due to redox processes that are particularly intensive in the upper aquifer zone [3,4]. While some natural attenuation of pollutants may occur over time and space, this is usually long-term and circumstantial [3].
Monitoring of pollution plume movement in time, space and depth, and understanding the geochemical reactions at each specific site are essential for controlling the plume with remediation where necessary. Various methods can be employed to delineate leachate plumes and these were reviewed by Mukherjee et al. [5]. Commonly employed methods are: monitoring of groundwater level and water quality tracers in boreholes/wells around the landfill [6,7], isotopic characterization of groundwater in piezometers installed around the landfill [8], geophysical methods [9,10,11], and modelling of transport and biogeochemical processes [12]. Although a large body of literature exists on techniques to determine the composition and delineation of leachate plumes, fewer studies were found that characterize pollution leachates over time [13] and at different groundwater depths [14,15]. In this paper, we attempt to characterize the leachate plume originating from the historical landfill in Atlantis (South Africa) over time, space and depth using long-term geophysical and hydrochemistry measurements. This investigation was required because groundwater is used extensively in the study area for water supply to urban users.
The Atlantis primary aquifer is part of the water supply scheme to the town of Atlantis and the City of Cape Town (Western Cape, South Africa). Until the year 2000, this sandy aquifer was the sole source of water to the town of Atlantis. Any contamination of this resource would, therefore, be disastrous. The Atlantis historical landfill is located about 6 km up-gradient of the Witzand Wellfield alongside the town area and it covers an area of approximately 9 ha. The landfill was brought into operation in 1975 and was intended for the disposal of domestic refuse, building rubble and “clean” industrial waste such as textiles, paper and cardboard [16]. It was unlined as its creation preceded the promulgation of the Minimum Requirements by the Department of Water and Sanitation in 1994. The indications are that the landfill mainly received general waste from the Atlantis residential and industrial areas; however, there are no records available of the composition or quantity of the waste disposed. In 1988, the Atlantis historical landfill was officially closed and in the following year the Divisional Council of the Cape initiated a groundwater monitoring program to monitor the possible groundwater pollution effects of the disposal site on the aquifer. Although the site was “closed” in 1988, it is estimated that the landfill operated for 21 years from 1976, when the Atlantis development started, to 1997. No formal closure process (shaping or capping) was undertaken to officially close the site. Until June 1997, annual groundwater quality monitoring reviews were prepared by the Council for Scientific and Industrial Research (CSIR) [16,17,18,19,20,21,22,23,24,25]. The latter report also contains information on an electromagnetic (EM-34, Geonics Ltd., Mississauga, ON, Canada) resistivity survey carried out in March 1997 with a further survey carried out in 2006 [26]. All these reports indicated the presence of a pollution plume emanating from the landfill.
Until recently, the landfill was used for salvaging purposes by informal salvagers, being located within 500 m of an informal settlement. In 2010, medical waste was uncovered on site by the informal salvagers at the landfill. The City of Cape Town (CoCT) removed the medical waste from the site and disposed of it at the Vissershok H:h landfill located on the fringes of Cape Town. In 2012, the CoCT decided to formally close and rehabilitate the Atlantis historical landfill site in accordance with the requirements of the National Environmental Management: Waste Act [27]. The facility was established before the promulgation of the Environment Conservation Act [28] and, therefore, had no permit in terms of section 20. For closure of the site, the CoCT appointed a contractor in 2016 to complete the shaping and capping of the waste pile at the site. The activities undertaken by the contractor were: (i) during April to November 2016, waste which had been dumped in areas surrounding the landfill (uncontrolled dumping areas) was excavated and moved to the landfill; (ii) the shaping and top soiling of the landfill area was done concurrently and completed by December 2016; (iii) further shaping, installing of a levelling layer, clay capping and top soiling of the landfill area took place between January and June 2017; (iv) vegetation was also planted in the uncontrolled dumping areas and landfill area; and (v) a permanent fence was erected around the landfill in June 2017. The monitoring wellfield is outside this fence.
Using the geophysical and hydrochemical data collected over some three decades, this paper tracks plume development and breakthrough curves of the various parameters and discusses its relevance in terms of groundwater monitoring at waste disposal sites. Based on these results, the importance of monitoring network design for successful monitoring is also highlighted. The study demonstrates how measurements at different aquifer depths (e.g., shallow and deep boreholes) provided novel insights into the mechanisms of plume transport.
2. Description of the Study Area
The industrial town of Atlantis is situated approximately 50 km north of the Cape Town city center along the dry west coast of South Africa (Figure 1). The Atlantis aquifer lies across three main topographical features, namely the featureless coastal plains, the interior plateau and the intermittently stepped “escarpment” zone [16]. The elevation of the area varies between 0 and 200 m a.s.l. At the waste disposal site the topographic gradient was interpolated to be 1:350. The vegetation in the area is of the Coastal Fynbos type but has been invaded by Rooikrans (Acacia cyclops) and Port Jackson (Acacia saligna) as well as some stands of Blue gum trees (Eucalyptus spp.). The location of the historical landfill with respect to the geology and key features of the Atlantis development is shown in Figure 1.
2.1. Climatic and Physiographic Information
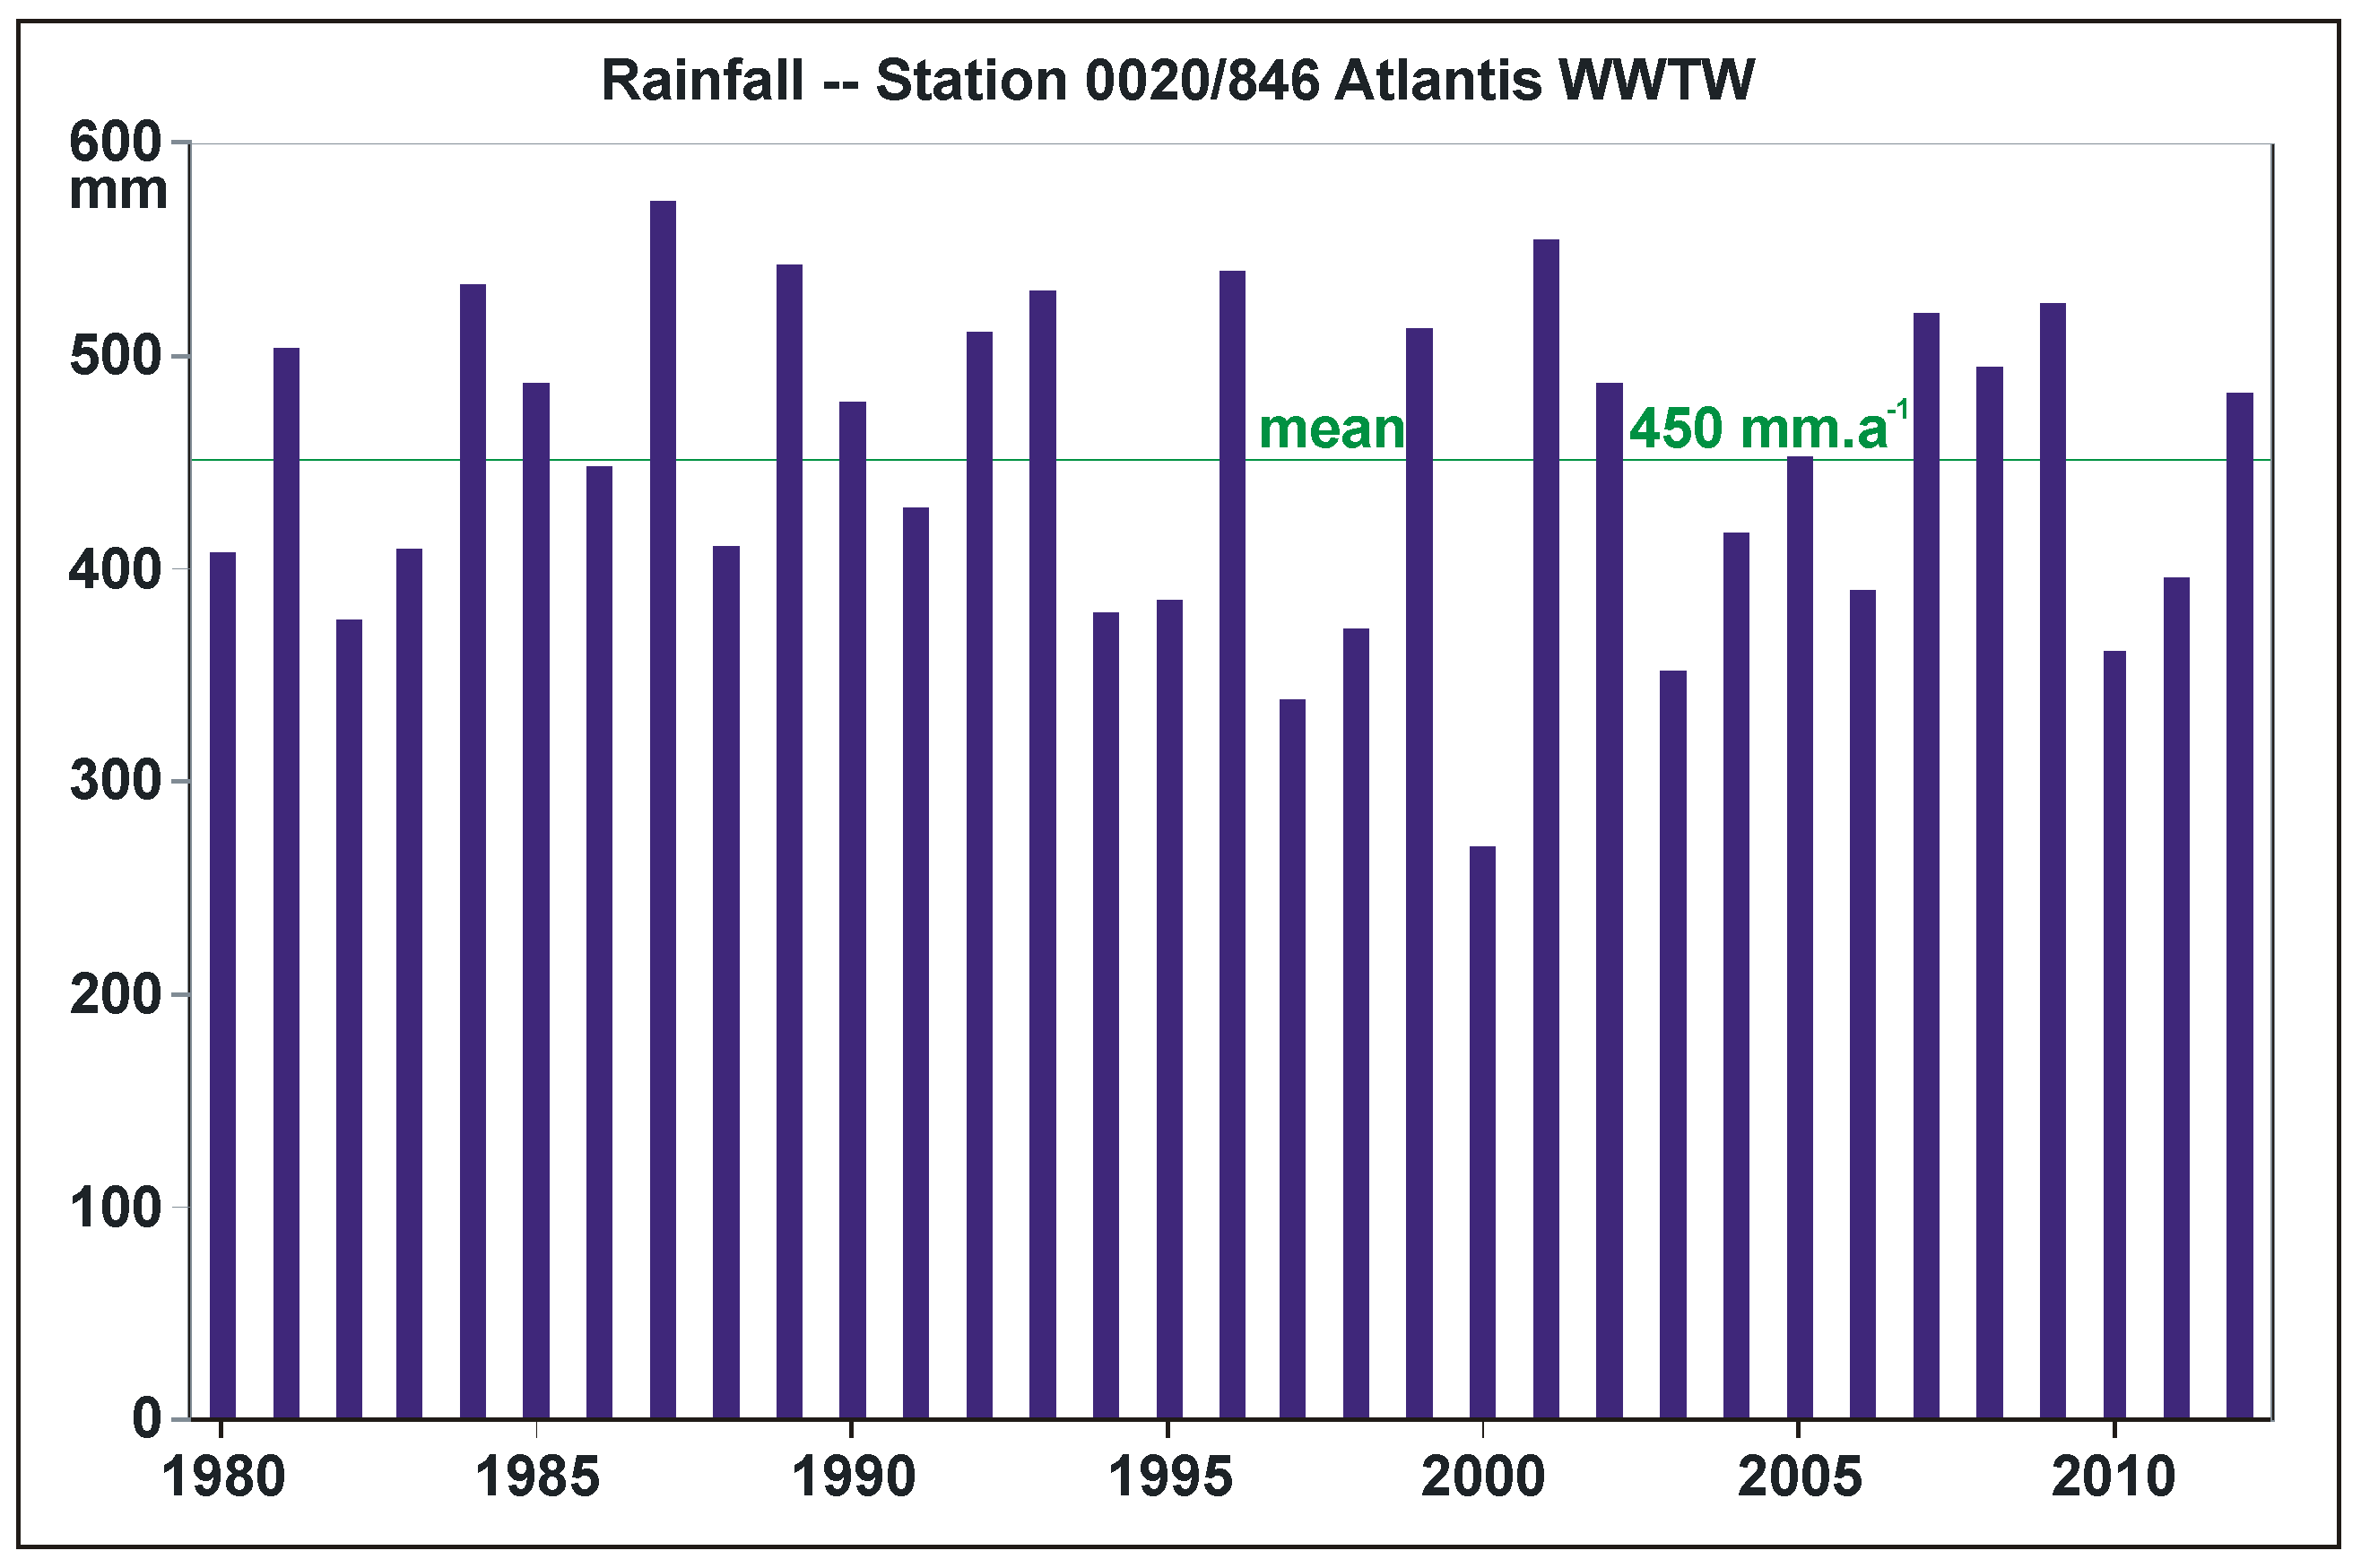
The Atlantis area experiences winter rainfall with a mean annual precipitation of approximately 450 mm over the period from 1979 to 2012 (Figure 2). Most of the rainfall is received from April to September. As a result of the sandy surface over most of the area, recharge percentages of 15 to 30% of the annual rainfall are generally experienced, the higher recharge occurring in the unvegetated dune area (Figure 1) [29]. The average annual potential evaporation is 1613 mm. This was determined from data collected between 1985 and 1988 using a Symon’s evaporation tank [16]. The highest monthly evaporation occurs during December and January (256 mm) and the lowest during July (36 mm). Due to the sandy nature of the soil, surface runoff is intermittent and only occurs after significant rainfall events. The absence of surface drainage features confirms the lack of runoff. As the highest rainfall occurs in the months from June to August, excess rainwater is available for groundwater recharge.
2.2. Geological Setting
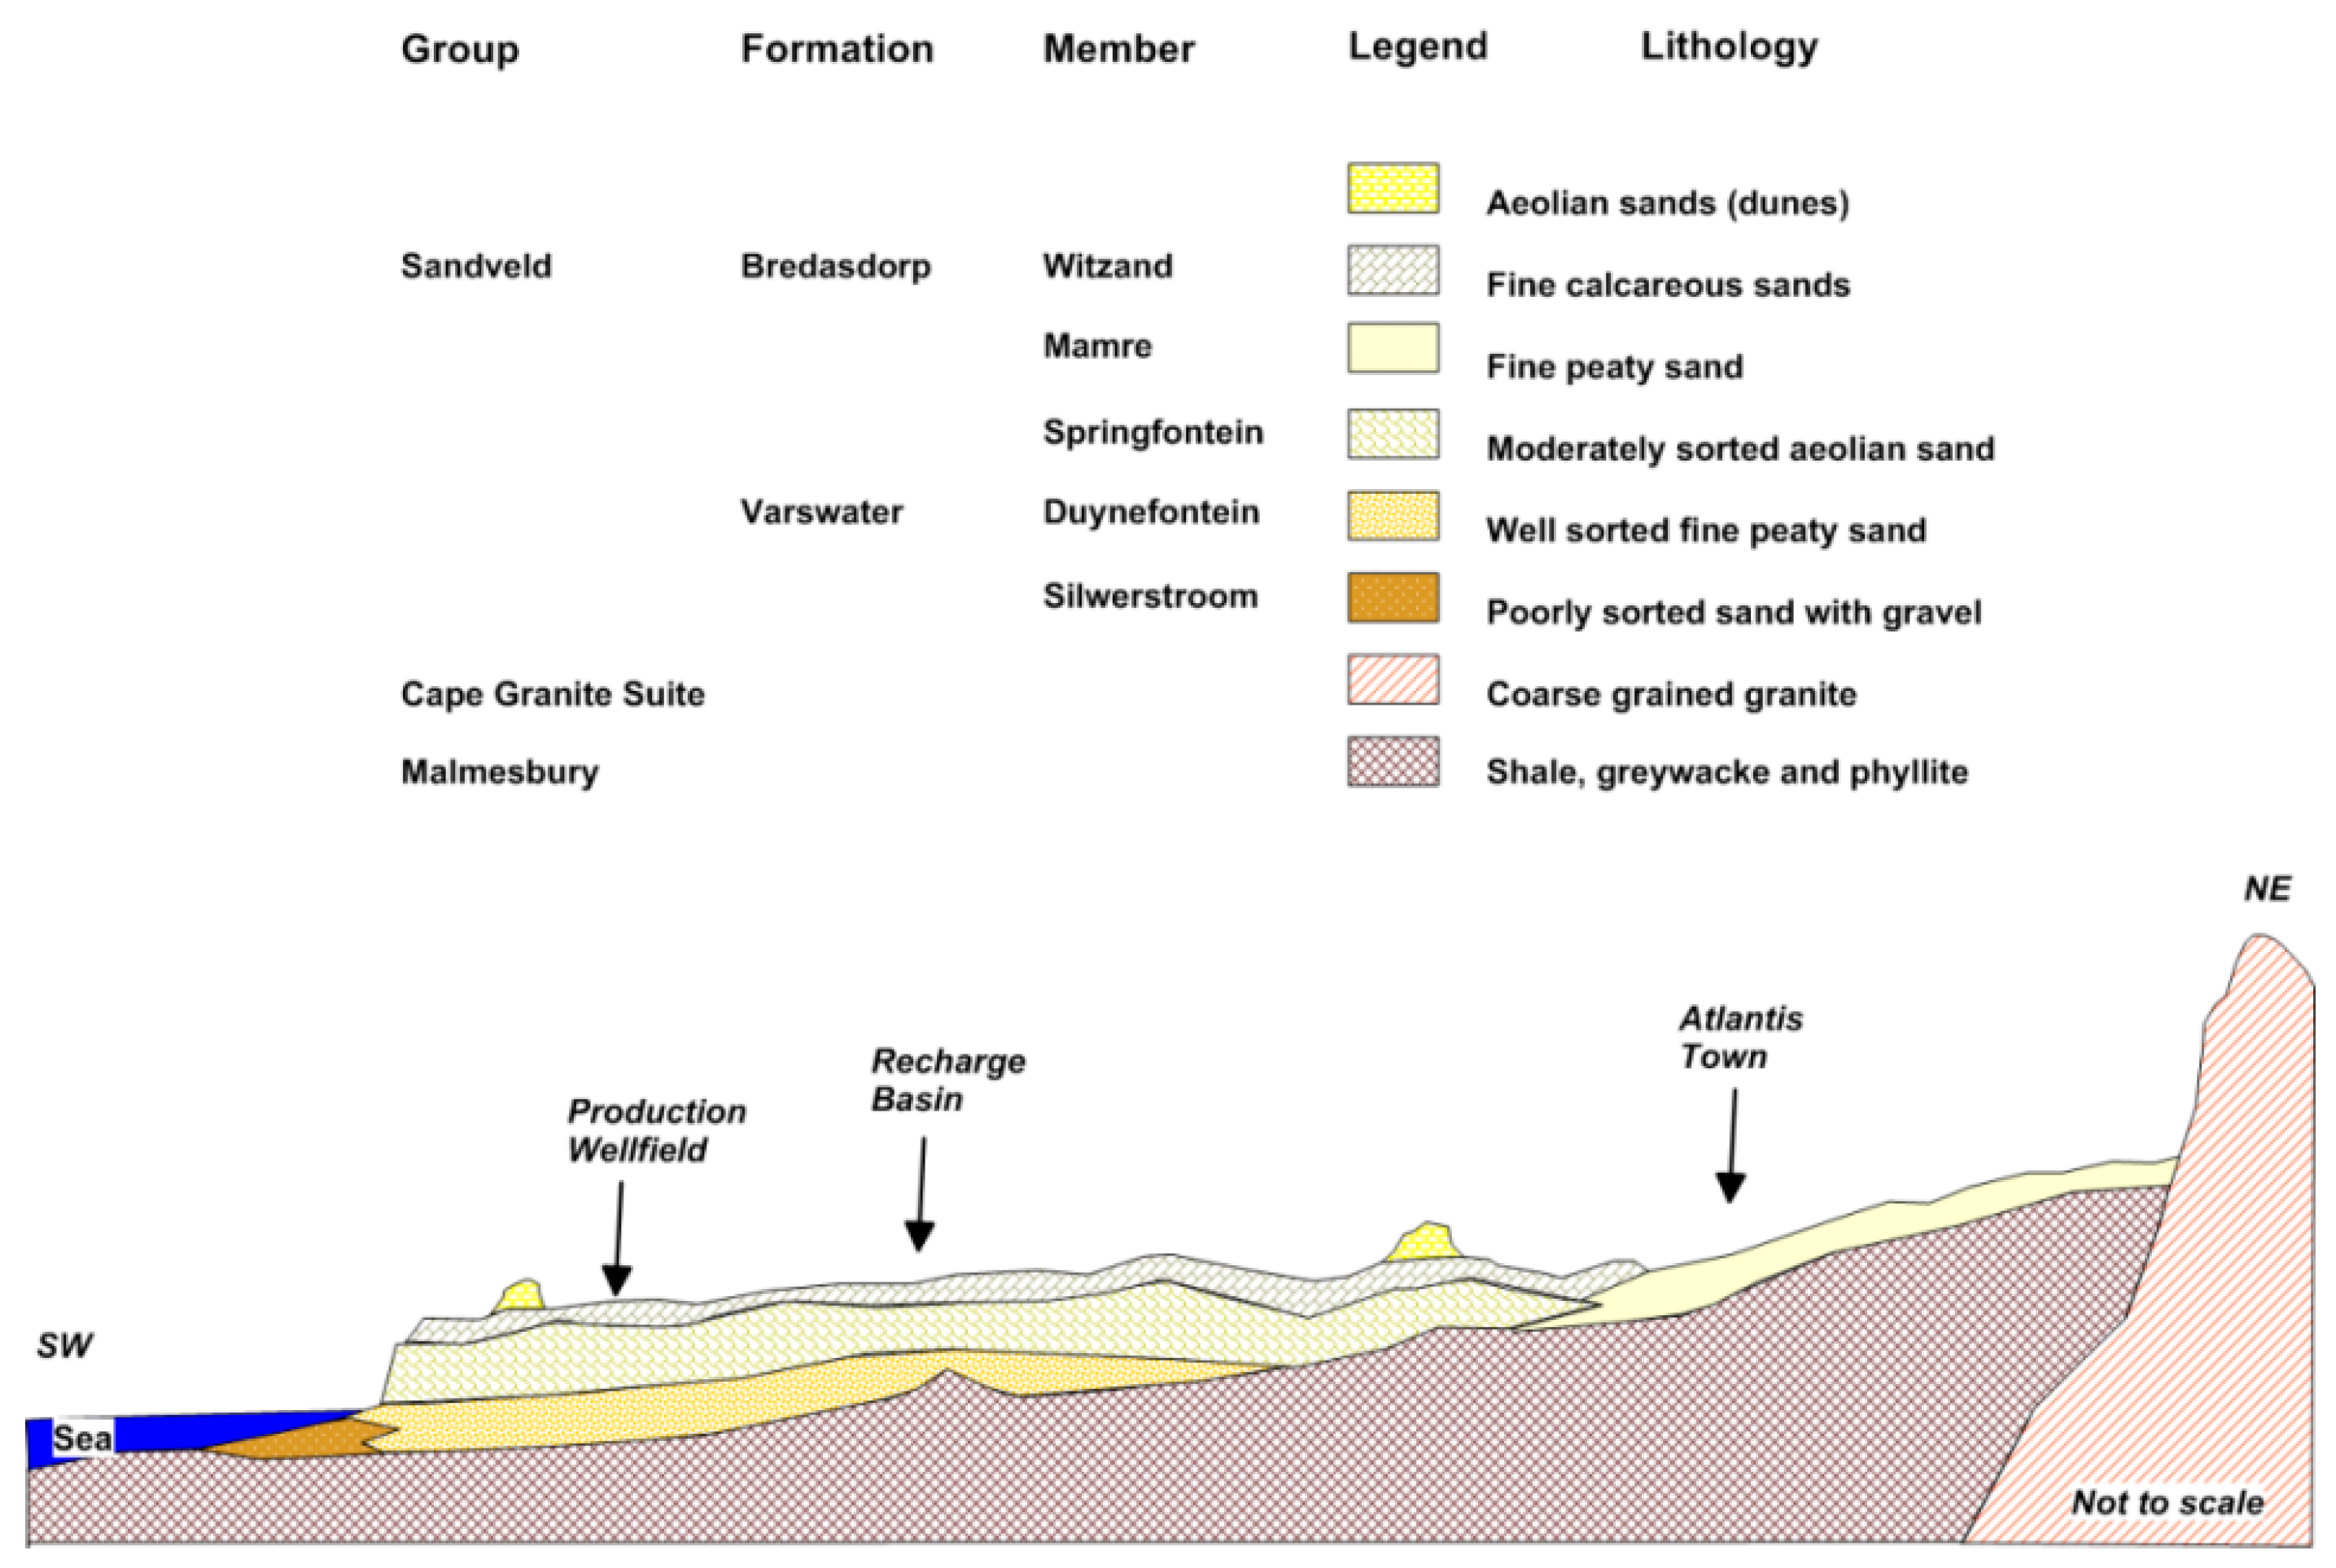
The coastal aquifer system in the Atlantis area is formed of unconsolidated Cenozoic sediments over-lying bedrock of greywacke and phyllitic shale [30]. Granite plutons have intruded the bedrock. The Cenozoic successions in the area consist of quartz sands belonging to the Sandveld Group. These comprise a lower unit of shallow marine origin, the Varswater Formation, and an upper, primarily aeolian unit, the Bredasdorp Formation [31]. The Bredasdorp Formation is subdivided into the Springfontein, Mamre and Witzand Members (Figure 3). The total sand cover reaches a thickness of 60 m in the central area, with an average thickness of 25 m [30].
The general geology, stratigraphic sequence and lithology of the aquifer are shown in Figure 3 by means of a schematic geological cross-section. The Tygerberg Formation, which consists of weathered metamorphosed sediments, underlies the entire area and forms an impervious bottom to the aquifer. This basal unit is very irregular which results in varying thicknesses of the overlying sands.
2.3. Soil Description
In general, the soils in the Atlantis area may be classified as a mixture of sands and clay. The sandy soils are medium to coarse textured, grey, generally alkaline, deep and well leached. According to the 1:250,000 Land Type Survey map, the soils in the vicinity of the Atlantis historical landfill are dominated by the homogenous Fernwood and Langebaan soil series [32] or Arenosols according to the United Nations Food and Agriculture Organization (FAO) classification [33]. These soils exhibit a depth of more than 1200 mm and a clay content ranging between 0% and 5%. The soils are susceptible to wind erosion if devoid of vegetation. Their agricultural potential is limited due to both their sandy nature and the lack of nutrients. According to [20], there are no confining or impermeable layers present in the sand, although minor grain size variations do occur, and thus infiltrating water can move relatively freely in a vertical direction.
2.4. Hydrogeology of the Atlantis Aquifer
The Department of Water and Sanitation in South Africa undertook the early exploration and development of wellfields in the Atlantis aquifer and more than 200 boreholes were drilled in the process [30,34]. From 1982, the artificial recharge of treated wastewater and storm water in the Witzand area has been operational (Figure 1) and eventually also development and extension of the wellfields took place. In the process, more than 300 further boreholes, piezometers and other monitoring points were installed.
The main water-bearing formation is the Springfontein Member of the Bredasdorp Formation [31]. This is well-sorted clean quartz aeolian sand which contains no shell fragments. Inland, the Springfontein Member interfingers and merges into a much finer peaty sand facies, designated as the Mamre Member [35]. The calcareous nature of this member is ascribed to the seasonal fluctuation of the water table causing the dissolution and subsequent re-precipitation of CaCO3 [31]. The waste site is located on the windblown sand deposits of the Witzand Formation adjacent to the Atlantis town area (Figure 1). The sands reach a thickness of about 20 m before the impervious clay base is reached.
A great deal of exploration and evaluation work has been carried out on the Atlantis aquifer [18,19,20,35,36,37]. Simplistically, the hydrogeological system contains a heterogeneous anisotropic aquifer overlying an impervious clay base. The thickness of saturated sand varies throughout but only in a few locations attains a thickness >35 m. Lateral and vertical changes in grain size are characteristic. Calcrete and peaty horizons are also common. Fleisher [35] noted that in the past the aquifer has been described as a phreatic water table type, which in many cases is semi-confined with delayed yield.
Considerable effort was made to develop the resource to its full potential from the mid-1970s onwards. Many workers [18,30,36] have conducted aquifer tests in the Atlantis aquifer. Transmissivity (T) values determined range between 10 and 1400 m2 d−1. From these data, typical (horizontal) hydraulic conductivities were determined (Table 1). Vertical hydraulic conductivities were also determined using the double-ring infiltrometer technique (Table 1) [38].
Bredenkamp and Vandoolaeghe [36] proposed a storativity (S) of 0.05 while Fleisher [35] estimated a specific yield of 25% for the upper part of the aquifer. Vandoolaeghe and Bertram [34] presented S values ranging between 3% and 28% as determined by aquifer tests. Bertram et al. [39] suggested what they call a conservative specific yield of 20%.
Very few estimates of aquifer porosity were found in reports concerning the Atlantis area. Fleisher [35] presented a porosity estimate of 23% for the Witzand Wellfield. Parsons [16] determined a porosity of 41% and a specific yield of 36% using a neutron-scattering logger in the upper zones of the aquifer.
Estimates of average recharge as a percentage of rainfall have been presented in numerous reports [34,35,36,39]. These estimates range between 10% and 30%. Fleisher [35], however, estimated that the average is in the order of 16% while he regarded his 1987 estimation of 22% to be an exceptionally high percentage owing to above average precipitation during that period.
In the following sections, we present first the groundwater monitoring network, then we interpret and discuss chronologically data of geophysical surveys, groundwater level and water-quality monitoring obtained over nearly three decades in order to describe the development of the pollution plume from the Atlantis historical waste site.
3. Groundwater Monitoring Network
The groundwater investigations underlined the vulnerability of the unconfined sandy aquifer. From numerous groundwater pollution and remediation studies around the world, it is known that once pollution has taken place remediation is difficult and in many instances practically impossible. In 1989, a monitoring network was set up and a quarterly groundwater level and water quality monitoring program was initiated. The regional groundwater flow is in a south-south-westerly direction in this area and the shallow monitoring boreholes (WP112 to WP116) were arranged down-gradient along a line in this direction (Figure 4; Table 2). A reference borehole (WP117) was installed north-east of the waste pile. Once the monitoring points were installed, it was found that the local flow pattern at the landfill deviated from the regional flow direction by 30° [19]. This deviation resulted in a misalignment of the monitoring boreholes and subsequent installation of two additional down-gradient monitoring points, WP188 and WP189 (Figure 4).
Parsons [17] discussed the rationale of initially installing the shallow well points to a depth of 8 m:
- Plume-generation theory and results of monitoring elsewhere in the world show that if contamination from a waste site were to occur, it would nearly always be detected near the top of the saturated zone. With time, the plume would extend horizontally in the direction of flow as well as downwards [40].
- No evidence existed that the contaminants emanating from the waste site would be very dense, which would result in the contaminants sinking to the base of the aquifer before horizontal movement were to occur.
- The cost of installing well points is far lower than the cost of drilling deeper holes [17]. In the immediate vicinity of the landfill, the plume would enter the saturated zone from the top.
However, as Ehrig [40] indicated the plume would, with time, extend horizontally but also downwards as the plume moves away from the landfill. This will take place even if the density of the leachate is similar to that of pure water as diffusion will also play a role. For this reason, the original design was only valid in the immediate vicinity of the landfill. Following geophysical surveys (described below), nine new boreholes (WP251 to WP259) were drilled in 2015 for better plume definition (Figure 4; Table 2). One of these replaced borehole WP188 that could not be reinstated. Borehole WP259 was drilled in an area near the location of the destroyed borehole WP116. Taking the plume transport theory above into consideration, practically all the new boreholes were drilled right down to bedrock.
4. Geophysical Surveys for Pollution Plume Assessment
The bulk resistivity of different geological strata varies mostly because of changes in salinity of the pore fluid or changes in porosity of the host rock. Pollution generated from a waste site generally results in an increase in the salinity (electrical conductivity, EC) of the groundwater which, in turn, will manifest as a decrease in subsurface resistivity. Three geophysical surveys were conducted at the Atlantis historical landfill, i.e., [25,26,41]. The main objectives of these surveys were to delineate the extent of the pollution plume and to assess the ability of the current groundwater monitoring network to accurately track the migration of the plume.
Cavé [25] conducted two electromagnetic (EM-34) traverses at the site in March 1997, two decades after the waste site was established. The traverse lines are shown in Figure 4. The higher conductance of saline water produces a higher EC reading than water of low salinity. This allows the plume of high electrical conductivity water at the waste site to be tracked from the surface. The west-east traverse line, which ran along WP113, WP114, WP115, and then across the site below the southern edge, traced a plume of high salinity groundwater (EC over 200 mS m−1) to a distance of approximately 100 m east of WP115. The plume appeared to have a symmetrical shape 230 m across in this direction, centered just west of WP115 where conductivity is at its highest. The traverse from north to south starting at WP188 and passing WP189 was intended to identify the leading edge of the plume in the direction of migration. There was a gradual decline in the intensity of groundwater contamination in this direction. This gradient was much less steep than that of the transverse profile. Beyond 350 m (approximately 470 m south of the waste site) the readings levelled off and the groundwater was assumed to be unaffected by the pollution plume.
Soltau et al. [26] acquired electrical resistivity data along two profiles down-gradient of the waste site (Figure 4). This study aimed to identify further plume migration some nine years after the study by Cavé [25]. The data for the first profile (Profile A) were acquired to the south of the waste site in an E–W direction in order to attempt to determine the lateral extent of the pollution plume. The resistivity data acquired along Profile A showed a high resistivity (>1000 ohm m) top layer associated with the dry, near-surface layer of unsaturated sand. An underlying layer of lower resistivity (<200 ohm m) was also evident which is associated with the saturated aquifer sand. Stratification was also evident within the lower resistivity layer, which was interpreted to be a result of more saline-polluted groundwater floating on top of unpolluted groundwater. Soltau et al. [26], however, also suggested that this stratification could be a result of a decrease in porosity with depth, since there is an inverse relation between resistivity and porosity; i.e., a decrease in porosity manifests as an increase in resistivity. The aim of Profile A was to determine the lateral extent of the pollution plume and the results suggested that the pollution extended the full length of the profile. The data for the second profile (Profile B) were acquired to the south of the waste site (Figure 4) in a N–S direction in an attempt to define the leading edge of the pollution plume. Similar to Profile A, the resistivity profile showed a high resistivity top layer that corresponds with the dry, top layer of unsaturated sand. The underlying lower resistivity layer corresponded to the saturated aquifer sand. The results of Profile B also suggested that the pollution extended the full length of the profile.
Bugan et al. [41] conducted five EM-34 surveys along selected access paths at the site (Figure 4). The results revealed a reasonable correlation between high apparent conductivity and known pollution with a lateral transition from low conductivity (associated with unpolluted aquifer) to high conductivity (associated with pollution) being evident. The results of the EM-34 surveys suggest that the pollution plume emanating from the waste pile, has migrated further south of WP112, along profile AA/AB, reached the northern sections of profile AC, and has migrated along profile AE. The EM-34 surveys were thus able to inform the siting of additional monitoring boreholes drilled in 2015.
5. Groundwater Levels
From 1989 to 1997, groundwater levels were measured quarterly with manual dip meters. Since 2015, the groundwater levels were again measured manually at all monitoring points at a quarterly frequency. In addition, three LTC loggers (Solinst Canada Ltd., Halton Hills, ON, Canada), which record the groundwater level, EC and temperature at hourly intervals, were installed at WP189, WP253 and WP256. During an investigation by Bugan et al. [41], an additional LT logger (Solinst Canada Ltd., Halton Hills, ON, Canada), which records the groundwater level and temperature at hourly intervals, was installed at WP117.
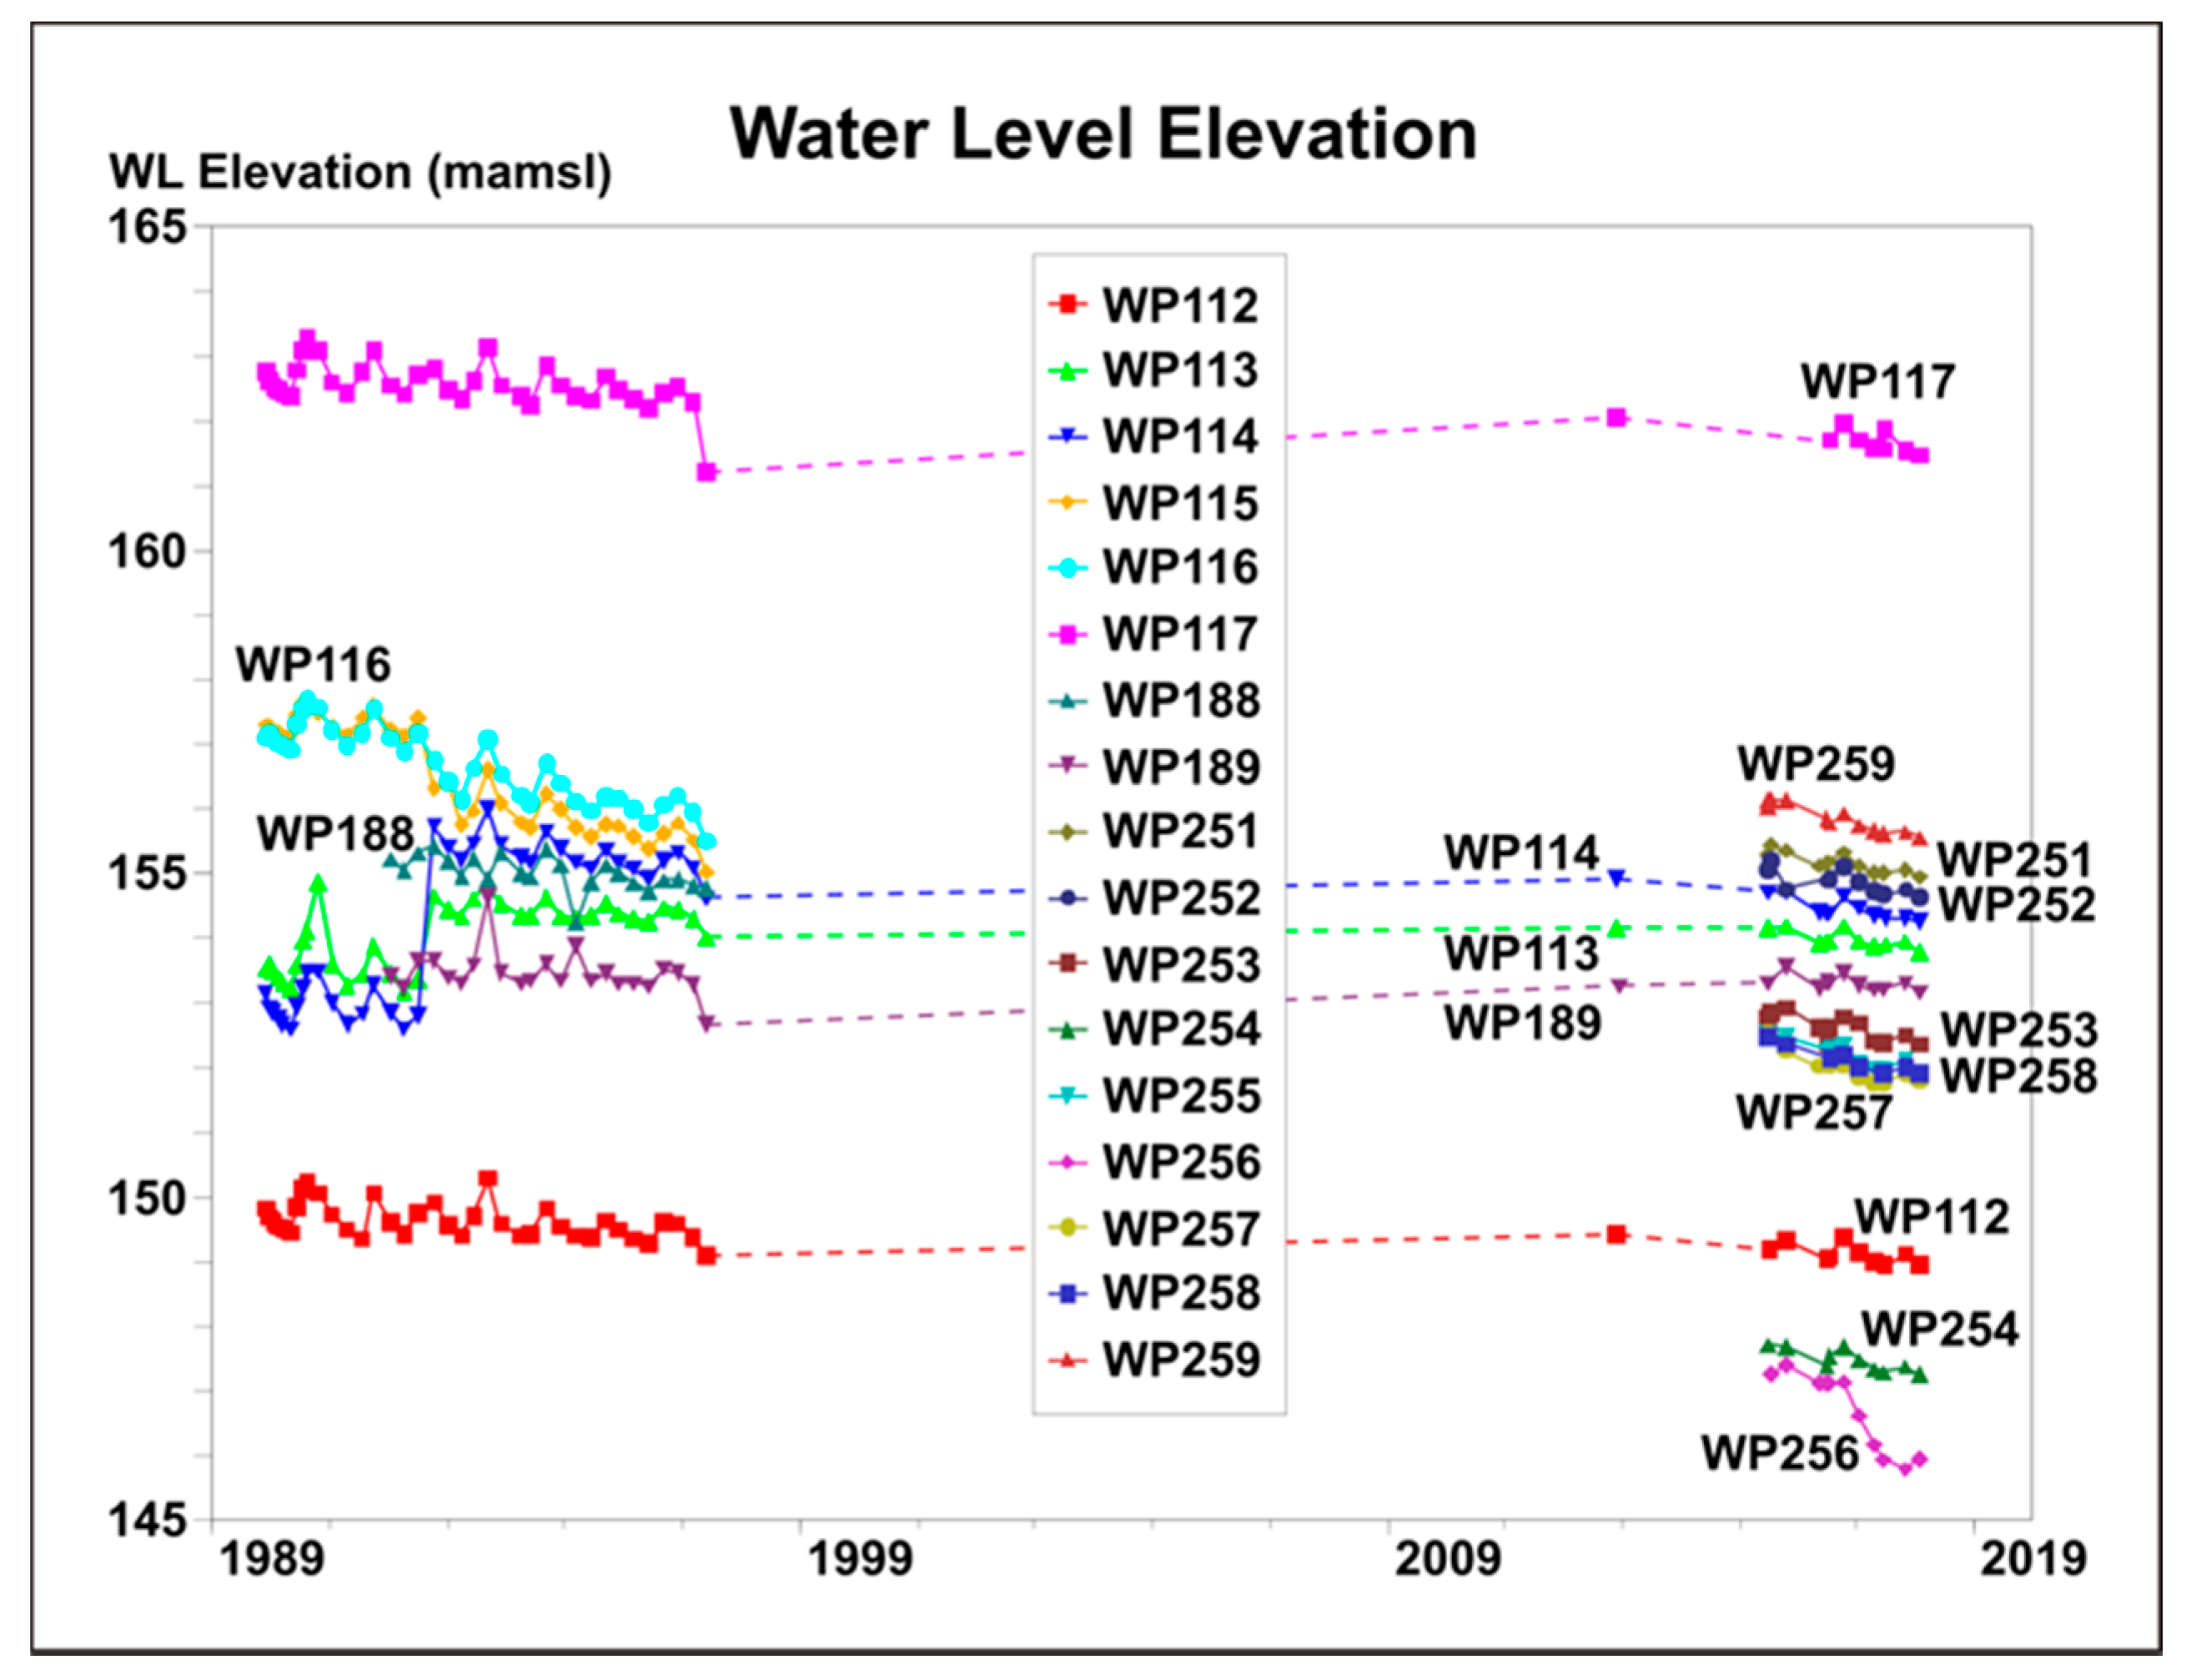
The groundwater levels at the site range from approximately 162 to 145 m a.s.l. The groundwater level elevation data provided evidence of a seasonal fluctuation of the groundwater level with seasonal highs being observed towards the end of winter and seasonal lows being observed towards the end of summer (Figure 5). This seasonal oscillation is not pronounced (less than 0.5 m) but it does, however, provide evidence of groundwater recharge. The seasonal response of the groundwater level was less pronounced from 2015 to present, particularly when analyzing data from WP117 and WP256, which is ascribed to the current drought in the Western Cape. In contrast to the general trend at the site, borehole WP256 shows a relatively steep water level decline over the last year. This is considered to be caused by increased groundwater abstraction in the nearby industrial area due to the local use of groundwater as an alternative water supply source in view of the drought and the lack of surface water supplies.
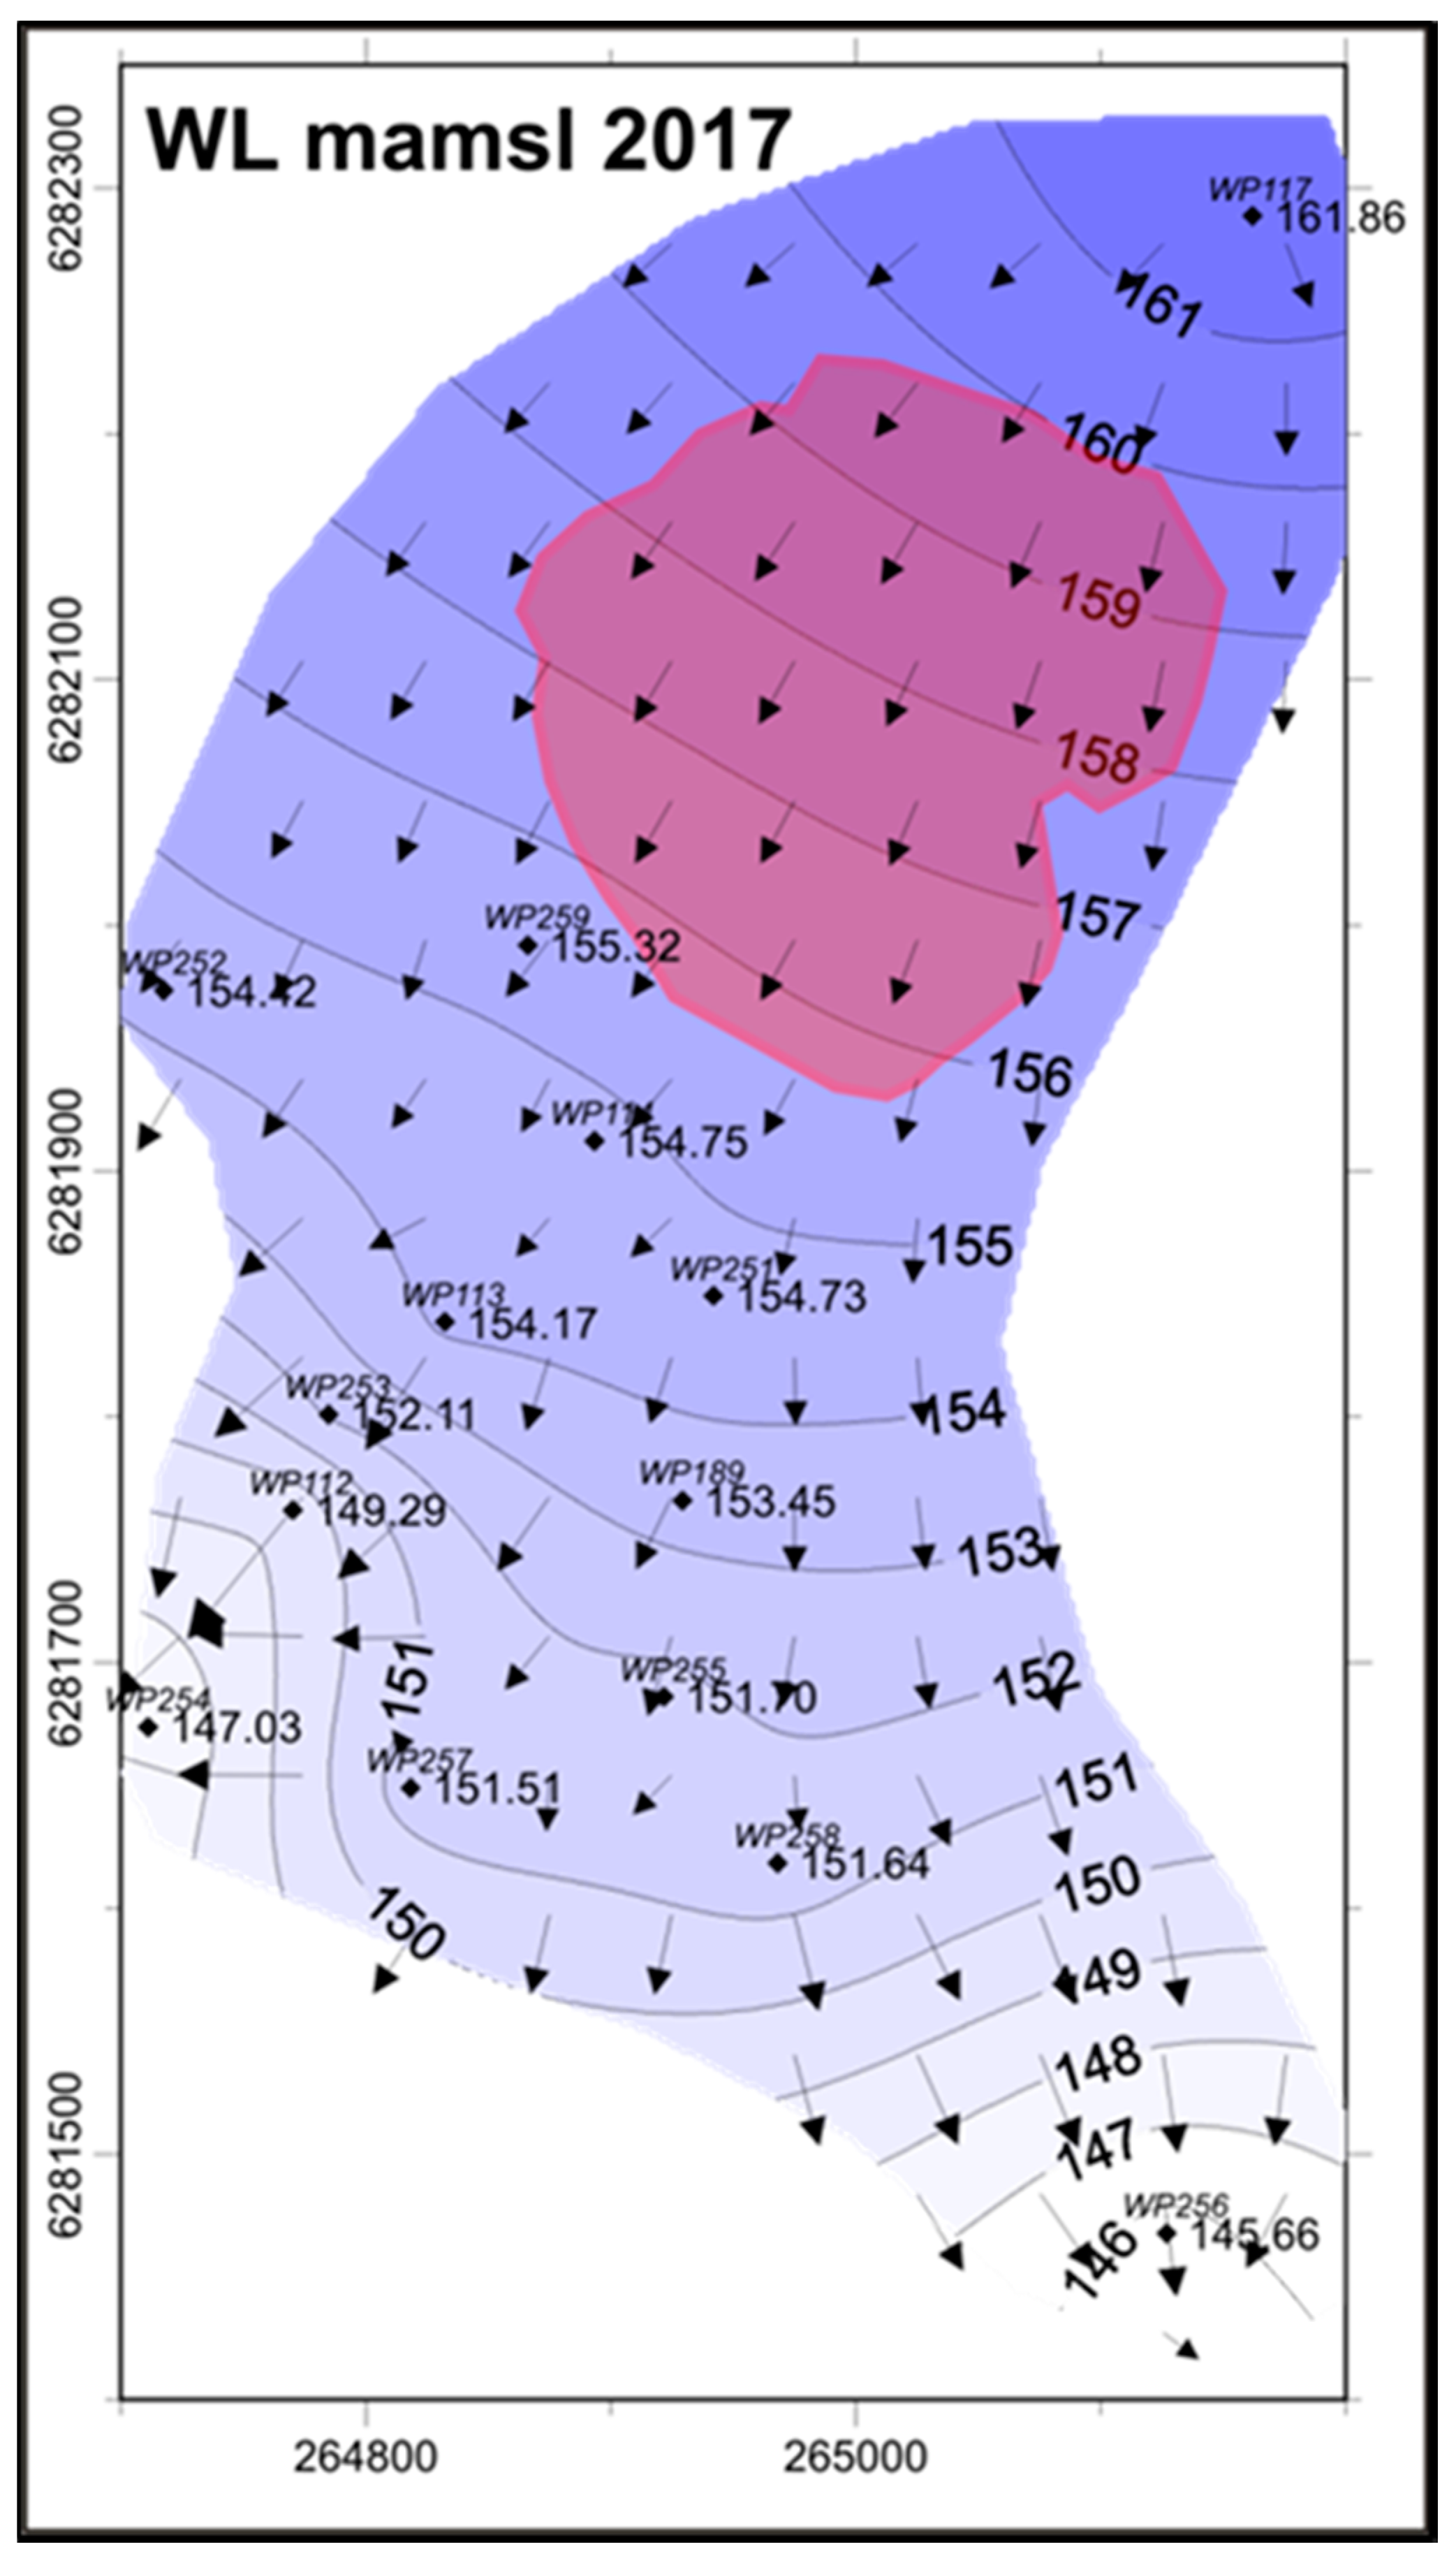
The groundwater level contour map is presented in Figure 6 for June 2017. The apparent groundwater level gradient from the N–NE to the S–SW across the waste site implies that the groundwater at the site generally flows in a south-south-westerly direction. The initial monitoring network was designed on this assumption and modified as water level data and geophysical results showed deviations from this pattern. Local deviations occur due to inhomogeneity in the sand deposits affecting the permeability from point to point. This is also partly due to the dune topography and the associated depositional conditions affecting the particle size distribution. Variations in particle size distribution cause variations in transmissivity. As explained above, there is presently a steep water level decline in the vicinity of WP256 in the South-Eastern part of the site which led to a deviation in the direction of groundwater flow.
6. Hydrochemistry
Quarterly water-quality monitoring was conducted in the period 1989–1997, and it was resumed after 2015. Water-quality sampling took place after purging the boreholes and the water samples were analyzed for the major inorganic and organic constituents. In this study, we interpret and discuss the time series and spatial/depth variations of EC, Cl−, K+, NH4+, SO42− and total organic carbon (TOC). In addition, down-the-hole logs were performed at deeper boreholes to measure the variations of EC and temperature with depth.
Considering the approximate 9 ha extent of the landfill, it would constitute a rather diffuse source of pollution with leachate generated over a large area. The leachate migration is expected to mainly follow the general groundwater flow direction based on the regional gradient. Due to the dune topography established during aeolian deposition of the aquifer material, zones of higher and lower permeability exist which will, to some extent, lead to local preferential pathways in coarser, well-sorted material. It is also expected that the composition and concentration of the leachate plume will vary from point to point along the perimeter of the waste pile.
6.1. Electrical Conductivity
Electrical conductivity is regarded as being the most useful indicator of pollution by leachate due to its sensitivity and ease of measurement [42]. In a naturally low-salinity environment, it is an ideal parameter for detection of the “breakthrough” of a pollution plume.
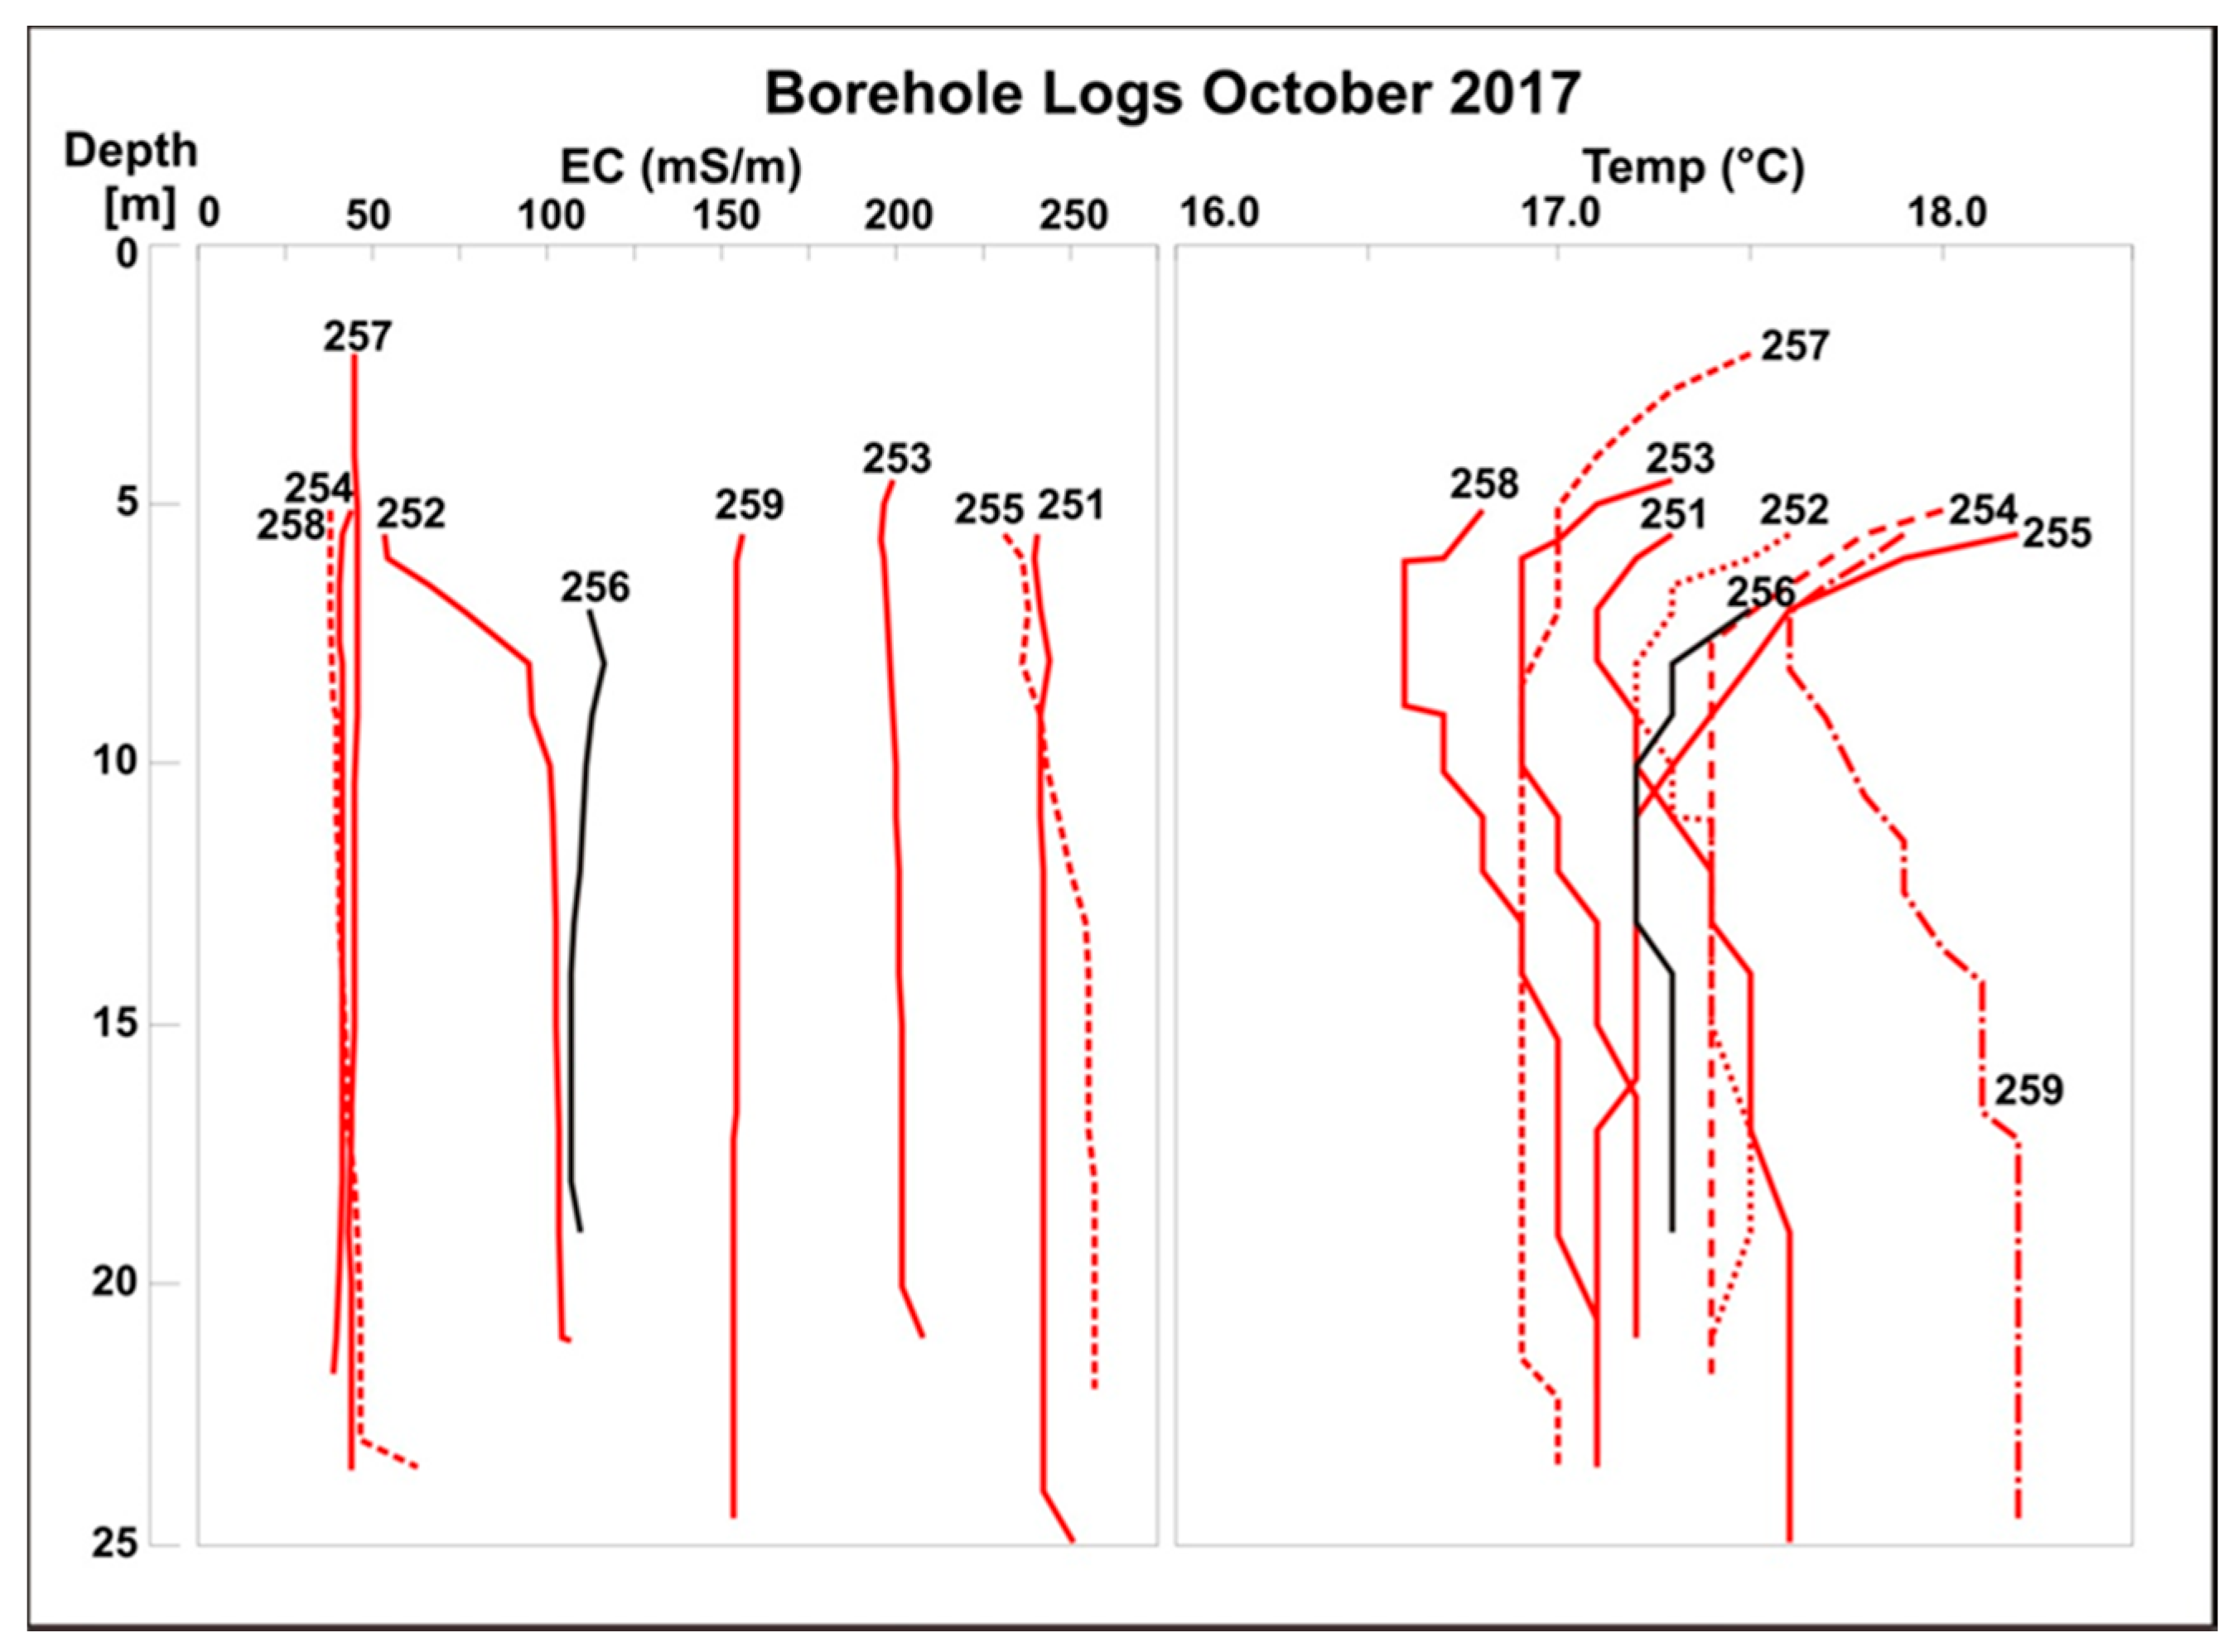
In an attempt to determine the salinity distribution with depth, down-the-hole logs were performed at each of the new, deeper boreholes (Figure 7). The EC varied between 50 mS m−1 (unpolluted boreholes) and 250 mS m−1 (polluted boreholes). Only two boreholes showed an increasing EC with depth, viz. WP252 at 210 m west-south-west of the waste pile and WP255, the borehole showing the highest level of pollution at 260 m south of the waste site. At least three boreholes showed a slight increase in EC in the sump (0.5 m long) at the bottom of the borehole which could relate to drilling fluid that was not removed during borehole development. With regard to the temperature logs it is noteworthy that borehole WP259, which is the closest to the waste pile, has the highest temperature at a depth which is considered to be related to the exothermic reactions in the waste pile.
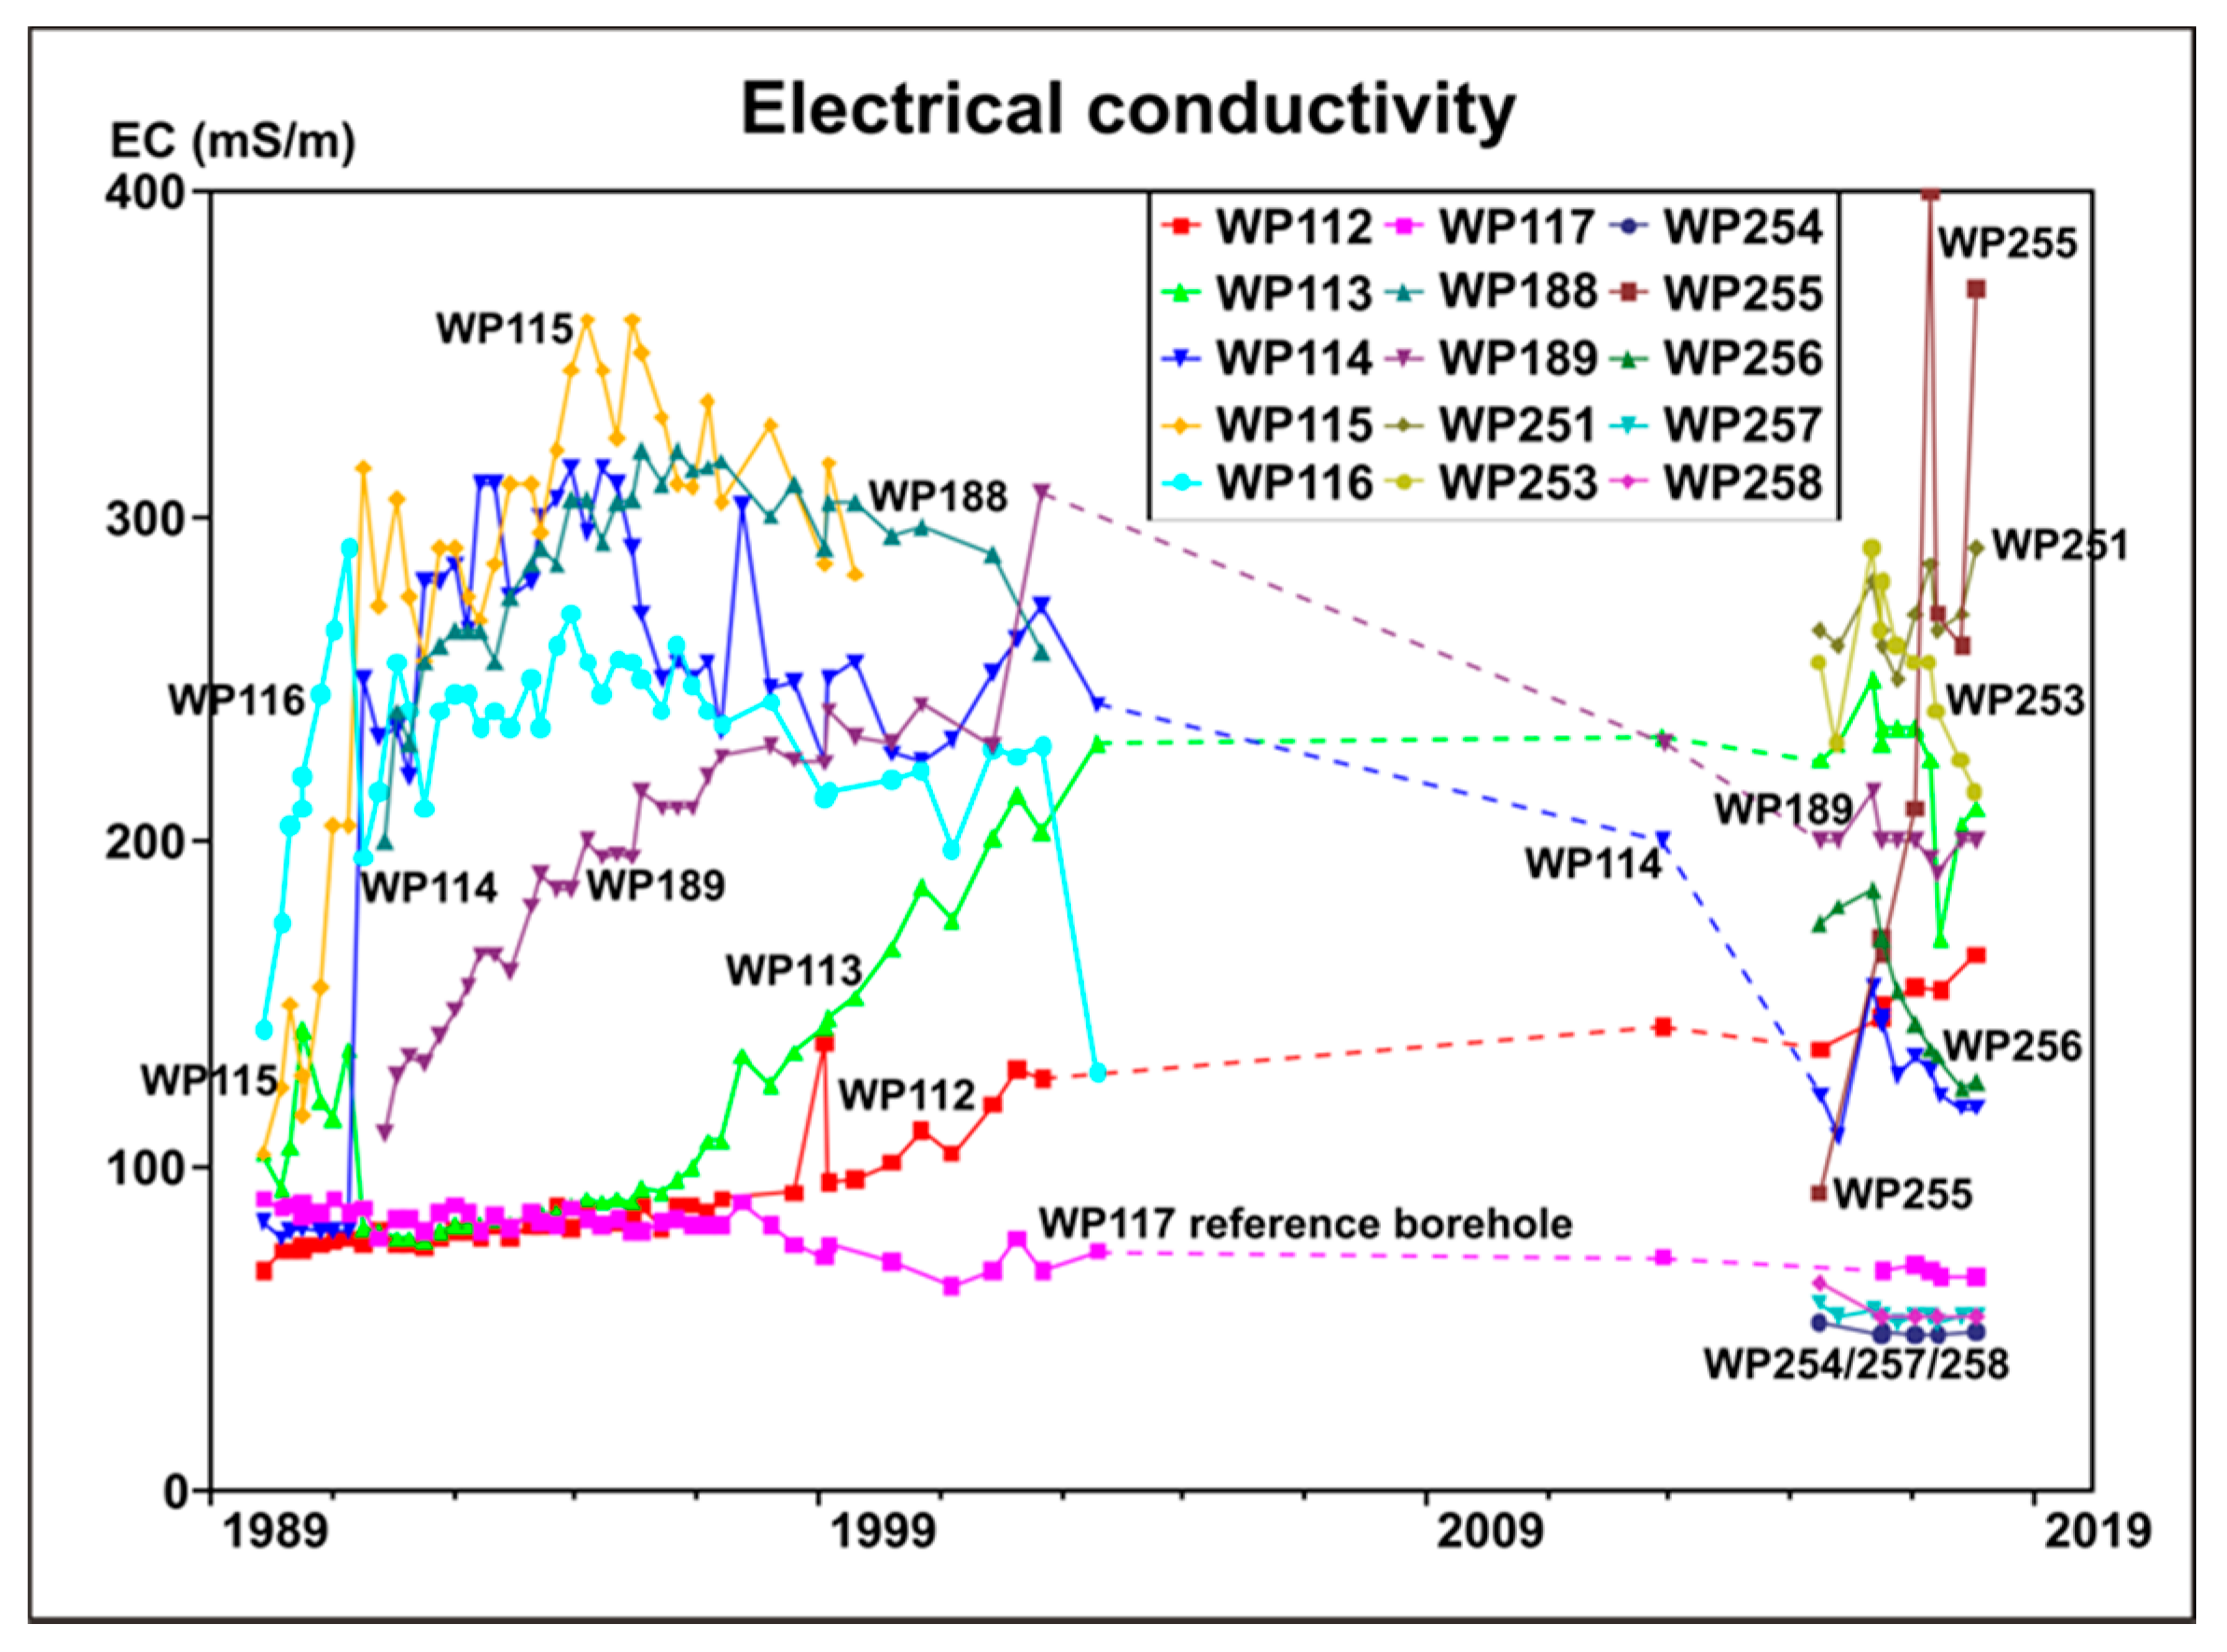
The long-term trends in EC at most of the monitoring points are compared to the up-gradient reference borehole WP117 in a time-series graph covering approximately three decades (Figure 8). The graph shows early breakthrough of pollution at WP116 which was already polluted at the time of the first sampling in November 1989. This borehole was located within 5 m of the waste pile and eventually disappeared under the waste. At WP116, the pollution levels levelled out and then decreased until the time of the last sampling in 2003. Borehole WP115 was located in another direction some 15 m from the waste pile. At the first sampling, pollution was also observed but at a slightly lower level. However, it eventually reached EC levels up to 360 mS m−1, exceeding those at WP116. Borehole WP115 was destroyed in 2000.
The first breakthrough from background levels was recorded at WP114, in a south-westerly direction some 70 m from the waste pile (Figure 8). It occurred in July 1991 when the EC tripled from 80 mS m−1 to 250 mS m−1. This was caused by a three-fold increase in Na+, Ca2+ and Cl−, while Mg2+ and HCO3- increased more than four times. K+ increased from 0.8 to 47 mg L−1, NH4+ from 0.1 to 29.3 mg L−1 (as N), and TOC from 7 to 36 mg L−1. Although borehole WP115 was already slightly polluted at the first sampling and not directly in the line between WP114 and the waste pile, it would seem that it took less than two years for the pollution plume to reach WP 114 (70 m from the waste pile) after reaching WP115 (some 15 m from the pile). Thus it is possible that close to the waste pile the plume travelled at least 50 m in less than two years at more than 25 m a−1.
The next borehole in the SW direction is WP113 at about 170 m from the waste pile, i.e., 100 m further than WP114. Breakthrough occurred in December 1996 when the EC was 10% above the original value at this borehole (Figure 8). Also in this case, all the major ions (Na+, Ca2+, Cl− and HCO3−) showed similar or higher increases. However, TOC took another two years before showing an increase while K+ and NH4+ lagged four to five years before showing significant increases. Based on the major ions, the pollution plume travel time between WP114 and WP113 was approximately five years, giving a rate of some 20 m a−1 for the spreading of the plume.
Whereas all the boreholes (WP112 to WP117) were shallow, the new borehole WP253, located in a SW direction some 220 m from the waste pile between WP113 and WP112, was drilled deeper. When it was drilled in 2015, it showed signs of pollution at slightly higher levels than the shallow borehole WP113 indicating that plume breakthrough had occurred long before. The consequence of deeper drilling is discussed below.
Borehole WP112 is located in a SW direction some 270 m from the waste pile and about 100 m beyond WP113. Pollution plume breakthrough was confirmed in March 2000 (Figure 8). This is somewhat less than four years after breakthrough occurred at WP113 which implies that the plume progressed slightly faster than 25 m a−1. As observed at the boreholes closer to the waste pile, the major ions, Na+, Ca2+, Cl− and HCO3−, all increased virtually at the same time. By September 2002 when the sampling was interrupted, none of the other parameters (TOC, K+ and NH4+) had shown any increase in their concentrations. However, at the time of the once-off sampling in November 2012, K+ already showed a ten-fold increase compared to the unpolluted groundwater. Ammonium and TOC did not show any significant change. The lag in the transport of K+, NH4+ and TOC is discussed under their specific headings below.
The new, deeper borehole WP254, further down-gradient in the SW direction, and 370 m from the waste pile still has a low salinity (January 2018) and there is no indication that the plume has reached this point. Considering the fact that the pollution plume has not reached WP254 at less than 400 m after some four decades implies that the pollutants are transported on average at less than 10 m a−1 in the south-westerly direction. Although it is possible that the sand characteristics may have caused a deviation in the plume movement, monitoring should continue at this point as the salinity component of the plume has reached WP112 some 100 m closer to the waste pile, after approximately two decades.
The boreholes extending in a southerly direction from the waste pile were only drilled in 1991. In November 1991, when WP188 (100 m from waste pile edge) was first sampled, it already showed pollution at levels only slightly lower than those of WP114 (Figure 8). This implies that in this direction the plume had already moved beyond this borehole and no possibility exists to determine any breakthrough. In fact, the graph shows that plume had reached WP189 shortly before November 1991 at 190 m from the waste pile and the EC was gradually increasing (Figure 8). At WP188 the major constituents were all elevated as well as K+, NH4+ and TOC. The EC at borehole WP251 confirms that the pollution level in the area of the vandalized borehole WP188 is still high although it seemed that the EC level was decreasing in 2002 to 2003. There is, however, an important difference between the two boreholes as WP188 was only 7.75 m deep while WP251 is 24 m deep.
At WP189, only the four major constituents, Na+, Ca2+, Cl−, and HCO3− were increased while K+, NH4+ and TOC were only very slightly elevated initially and increased moderately with time but never reached the same levels as at WP188.
At the second sampling of the new borehole WP255 in June 2016, some 260 m from the waste pile, it was evident that the pollution plume had arrived (Figure 8). In addition to the major ions, K+ was already significantly elevated, as well as SO42−, with a slight presence of nitrate, and a low TOC. WP255 is only 70 m further down-gradient from WP189 but it seems the plume took 25 years to cover this distance, i.e., less than 3 m a−1. There are three possible explanations, the first being that the plume was by-passing WP255 to the west. Secondly, this may not have been the first arrival of the plume but rather a new “pulse” that followed an earlier “breakthrough”. This would be supported by the fact that K+ was already elevated when the high major ions were observed and the EC increased. The third possibility is that the stand of Blue gum trees (Eucalyptus spp.) between WP189 and WP255 formed a barrier to plume movement by abstracting groundwater through root water uptake, until they were felled by woodcutters in 2015. This could also explain the high concentrations due to the removal of water by the trees that would leave the salts behind.
It is noteworthy that the boreholes WP254, WP257 and WP258 to the south and south-west of the landfill have lower EC values than the reference borehole. This is evident from the EC graph (Figure 8). As stated previously, this implies that either the pollution plume has not reached that area or the plume may be migrating in another direction. However, the fact that the pollutant concentrations are increasing at WP255 may indicate that the plume may still reach WP257 and WP258. The fact that the EC is lower at the three boreholes WP254, WP257 and WP258, compared to the reference borehole, WP117, may be due to variations in the locations of groundwater recharge zones or stratification caused by variation of aquifer matrix composition. The mud rotary drilling techniques employed made it impossible to sample the groundwater during drilling. The Bredasdorp Formation in the area consists of the Springfontein Member and the overlying Witzand Member. Whereas the Springfontein Member consists of fairly pure quartz sand, the Witzand Member is more calcareous. Hence groundwater obtained from shallow boreholes would tend to have higher Ca(HCO3)2 contents. The slightly higher Ca(HCO3)2 content of the reference borehole (WP117) compared to the low EC boreholes in the south and south-west would seem to corroborate this possibility.
The importance of the depth of the monitoring boreholes is illustrated by the time series graphs of the EC levels recorded at shallow and deep boreholes occurring in the same vicinity (Figure 8). WP189 (shallow), which is located up-gradient of WP255 (deep), did not exhibit any increases in EC in the recent past compared to WP255 which had substantial increases during 2017. A similar situation is observed at WP114 (shallow) where EC is decreasing while the EC remains high at WP253 (deep). It would, therefore, seem that the main plume may occur at a depth greater than 8 m below surface, especially further away from the waste pile.
The water quality and particularly the trends observed at WP256 are perceived to be anomalous but may indicate that the pollution could be moving in another direction. Alternatively, the contaminants at this point (mainly salinity) could also be derived from other unidentified source(s) as waste disposal also took place outside the confines of the landfill.
The interpreted distances of plume transport were within the order of magnitude of those reported in the literature for similar hydrogeological settings. For example, Christensen et al. [3] reported that lengths of pollution plumes in the order of 400–3000 m were measured at different locations over decades in sand, coarse sand and silt aquifers, with mass reduction processes driven by natural attenuation. Concerning published case studies, MacFarlane et al. [14] found a plume length of about 700 m and a maximum depth of 20 m from a landfill operating for about 40 years at Borden, in the vicinity of Toronto (Canada). Geophysical and geochemical tests indicated that the contaminant plume from a landfill in Mexicali (Mexico) extended 80 m from the edges and at least 7 m below the ground surface [10]. Cozzarelli et al. [5] estimated that a conservative tracer would take 4.5–20 years to travel 230 m in the Canadian River sand bed alluvium (Oklahoma, USA), depending on the hydraulic conductivity. These literature studies, providing wide ranges of travel time of contaminants and plumes, corroborate the limitations in the estimation of pollution plume transport due to variabilities in the hydrogeological properties, and underline the importance of appropriate monitoring network design.
6.2. Chloride
In the Cl− contour map for 2017, the deeper and shallower monitoring boreholes are identified (Figure 9). From the figure, it is evident that the higher Cl− concentrations are associated with the deeper boreholes, i.e., WP251 and WP255 on the southern side, and WP259 and WP253 in the south-west, while the Cl− concentrations in the adjacent shallow boreholes are consistently lower. This demonstrates clearly that the plume tends to migrate to deeper strata as it moves away from the waste pile. It is even more pronounced further away from the waste site.
Comparatively, in a study done in Canada [14], Cl− profiles were irregular near the landfill and became more uniform with distance down-gradient from the landfill, with higher concentrations at greater depths. Vertical heterogeneities were also observed in a well beneath a waste mound in Oklahoma (USA) [5].
6.3. Potassium
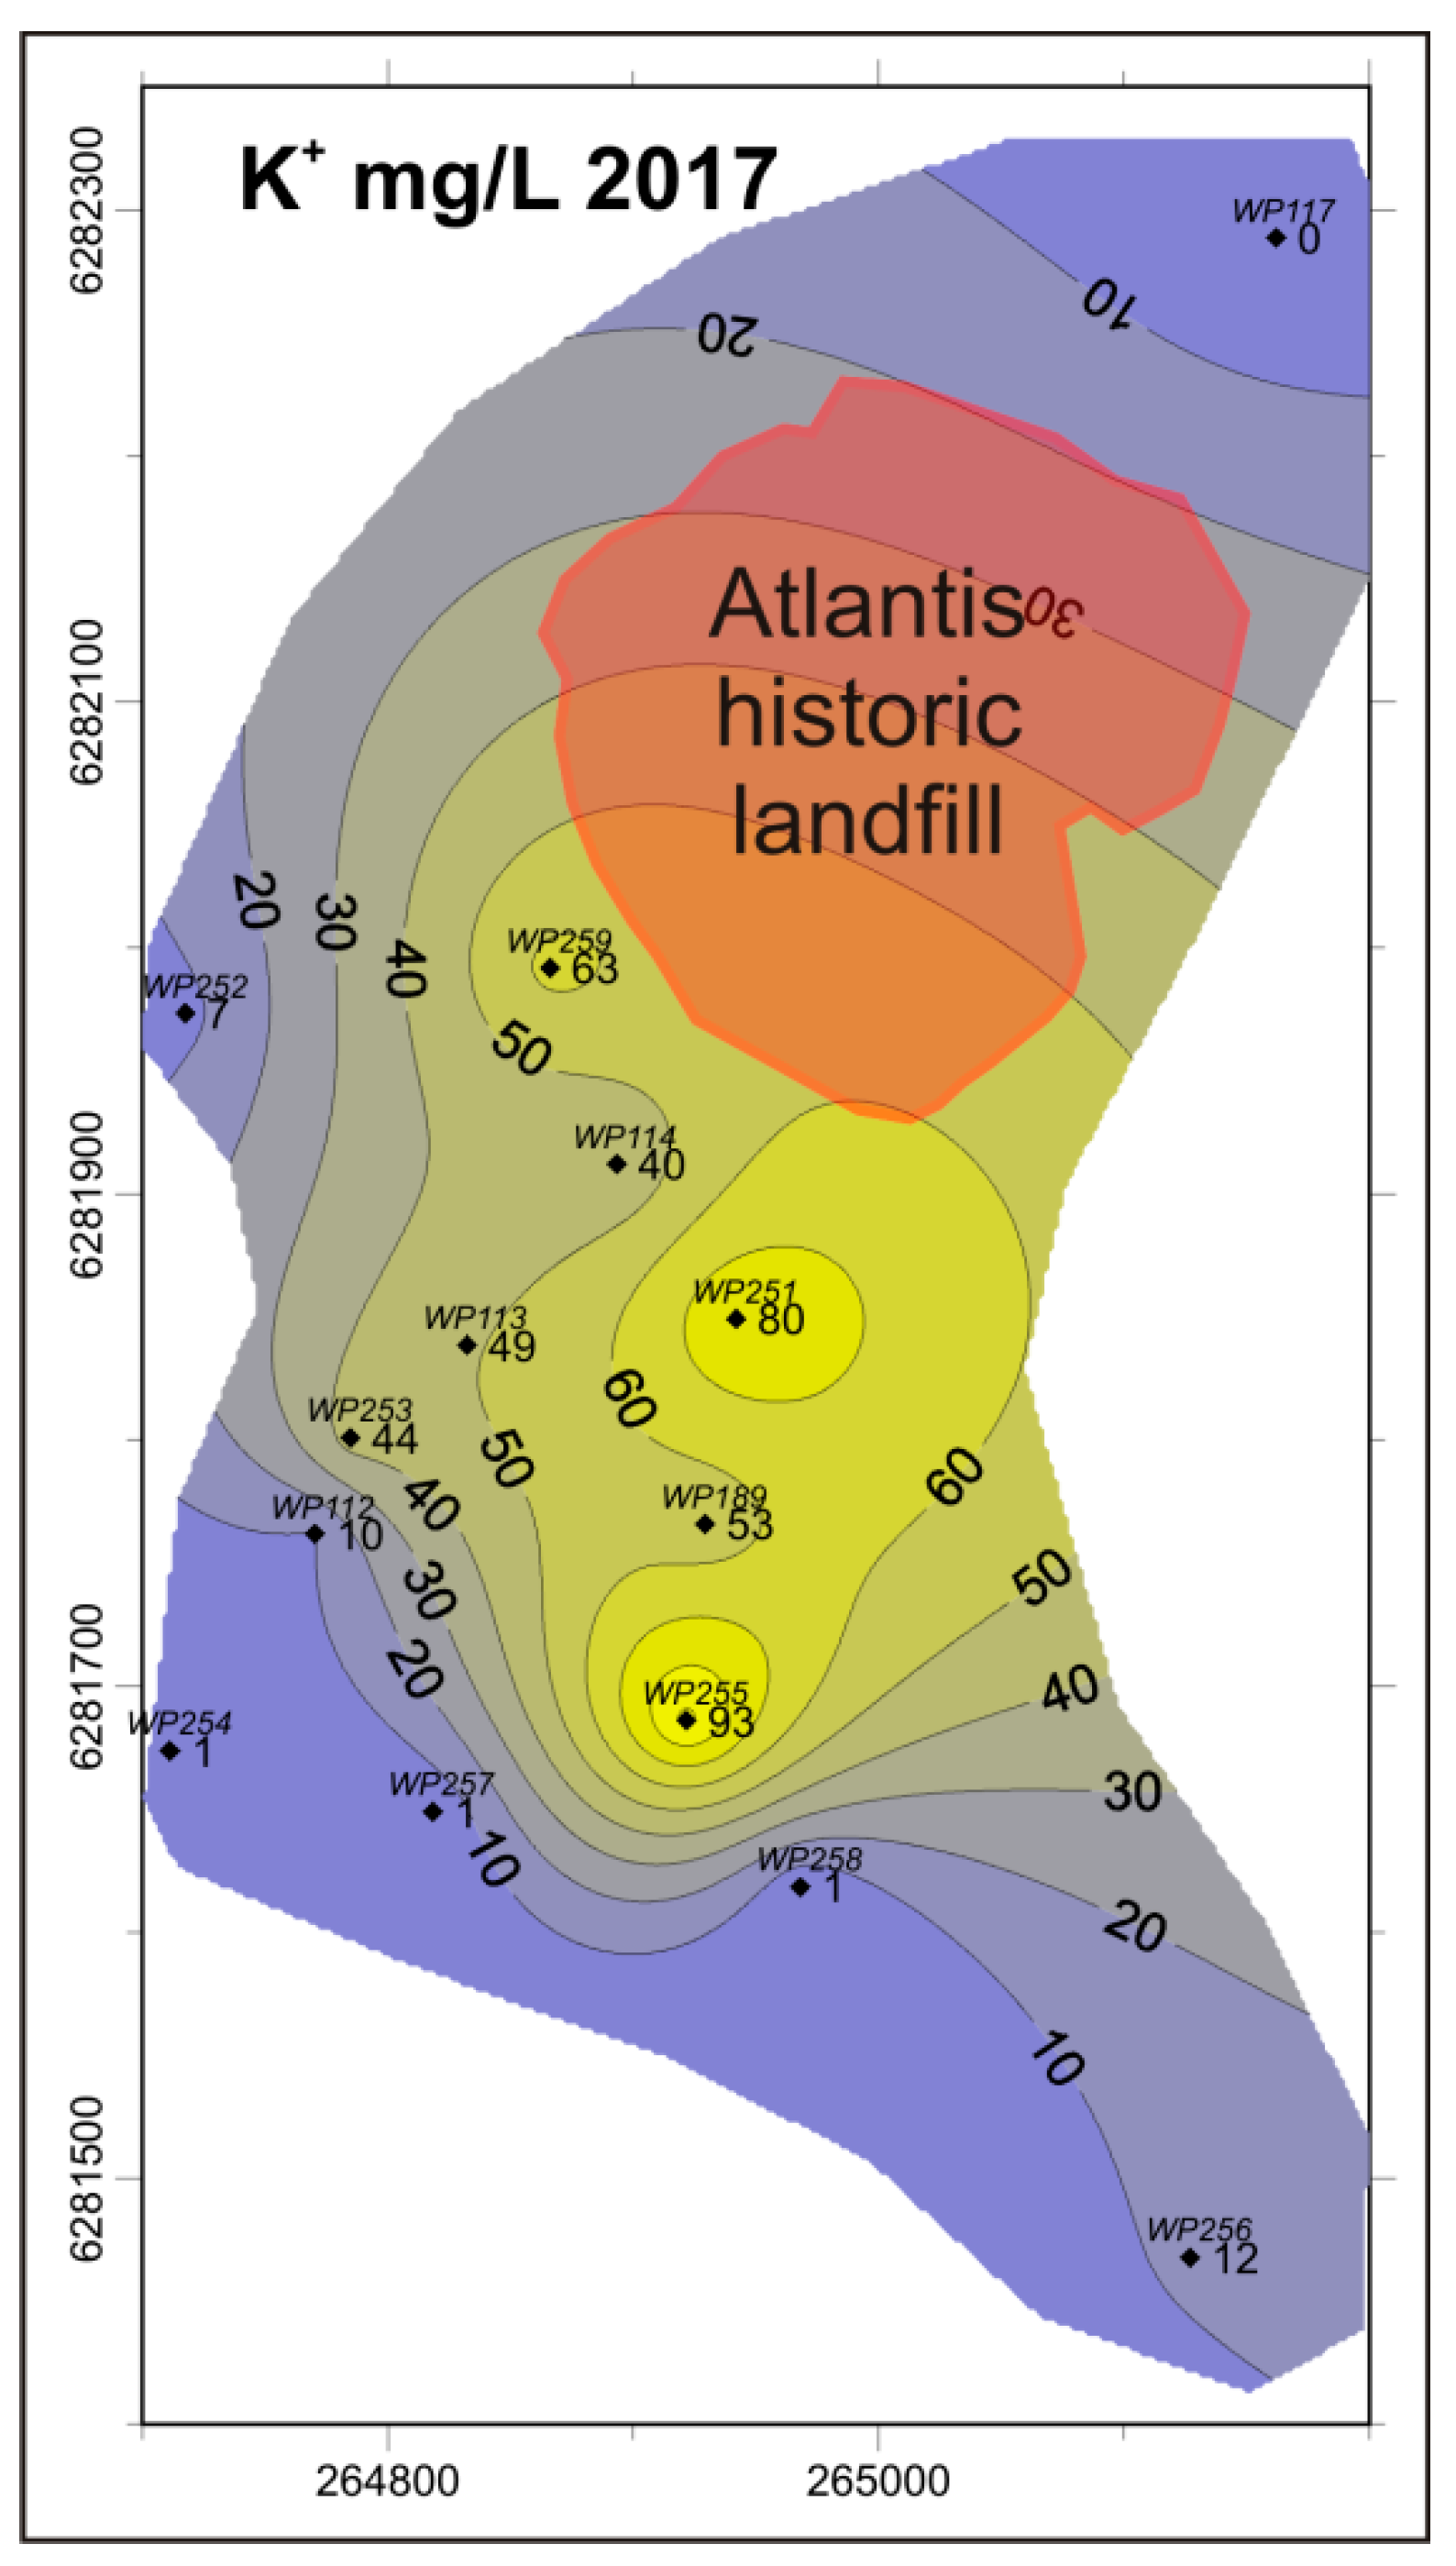
Even though K+ is not a pollutant as such, it is a useful indicator of pollution. For landfills, Kerndorff et al. [43] developed a methodology using “contamination factors” that are based on the ratio of pollutant concentrations up- and down-gradient of contaminated sites. The approach could be applied to any point source of contamination, provided that the affected groundwater has concentrations of pollutants that are significantly higher than background levels in the aquifer. K+ ranks second on their list and was usable at nearly 75% of landfill sites. The distribution of K+ in 2017 is presented in Figure 10. It is noteworthy that it has migrated several hundred meters over the past three to four decades. This is mainly due to the fact that the aquifer consists of good quality silica sand with only a small percentage of clay that could remove K+ by means of ion exchange. As in the case of Cl−, it is essentially the deeper boreholes that show the highest concentrations of K+. Vegetation, particularly the Blue gum trees and other alien species with deep root systems, may intercept K+ and this should eventually largely be removed from the groundwater. However, a portion may pass below the root zone of the Coastal Fynbos and, therefore, not all of the K+ is intercepted by the plants. The slight lag in K+ breakthrough may be dependent on these two main factors, i.e., ion exchange on clay minerals, and uptake by vegetation.
6.4. Ammonium
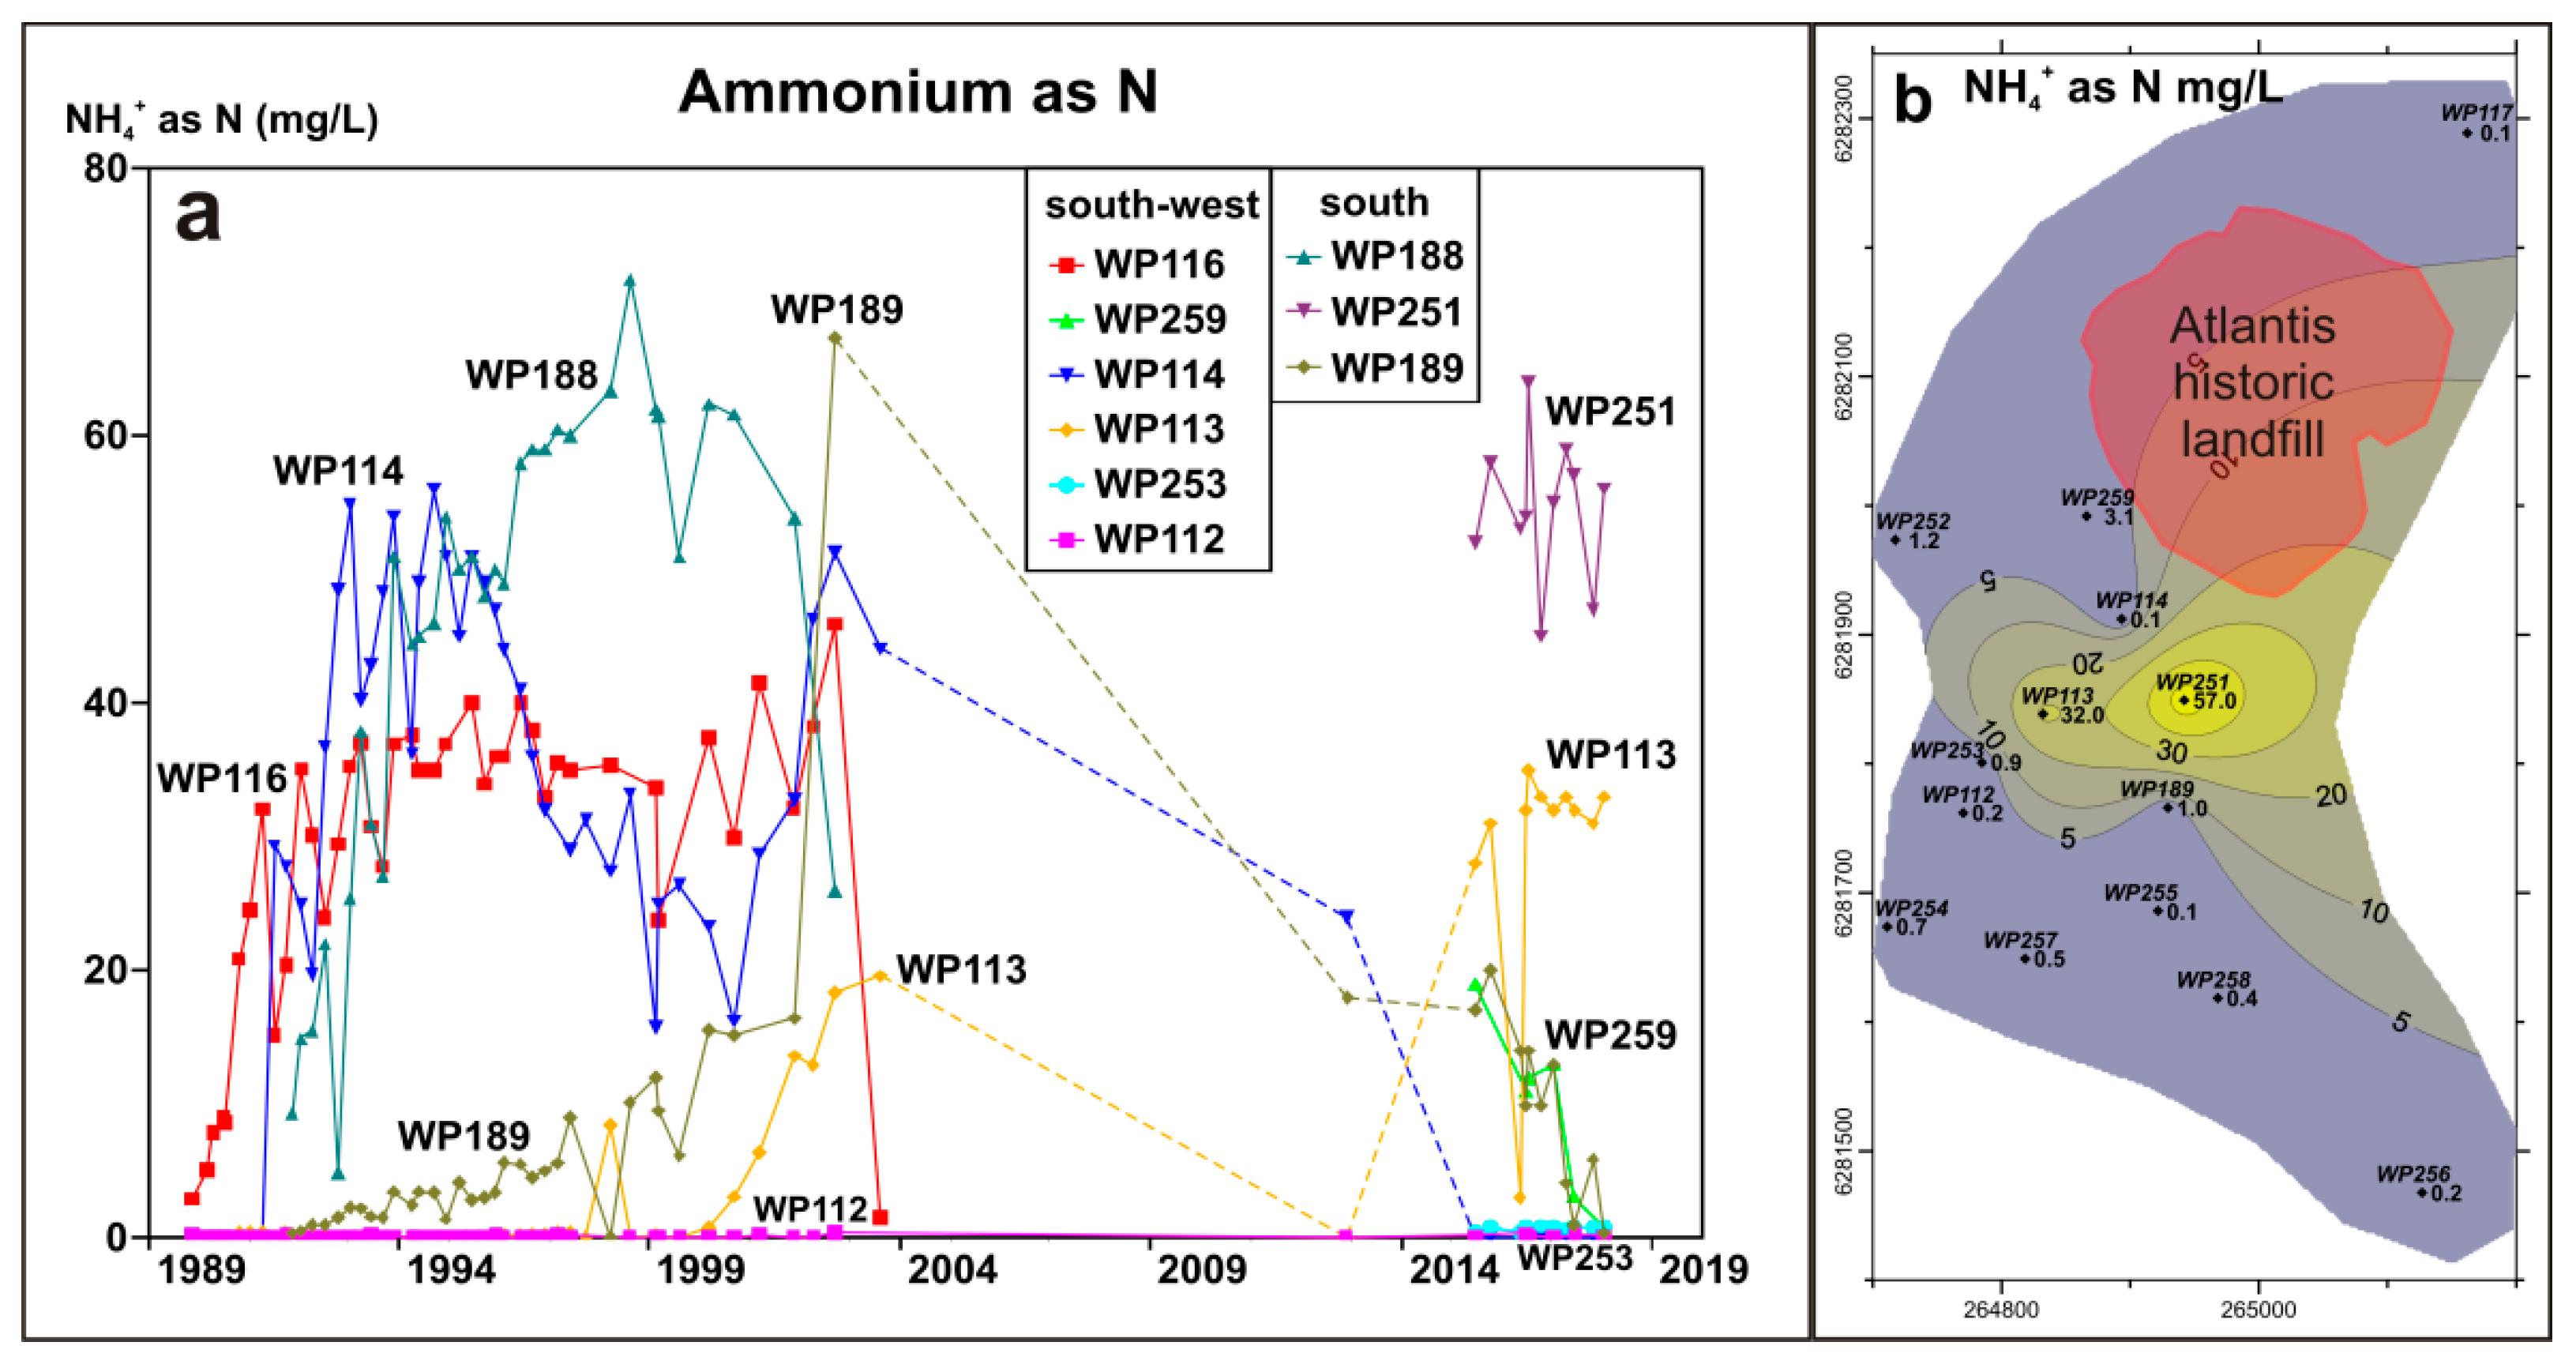
NH4+ ranks third on the list of contamination factors [43] based on the median value of the factors at waste disposal sites. It is generated by the decomposition of nitrogenous organic compounds, such as protein, under anaerobic conditions. As the intensity of leachate production decreases with time, oxic conditions will set in and NH4+ will be subject to bacterially mediated redox reactions and it can be oxidized to nitrate or other nitrogen species. It is also a plant nutrient and it is taken up by vegetation. These are possibly the reasons why it was only detected at some 50% of old waste sites [43]. At the Atlantis landfill, generation of NH4+ is continuing as it is still (2017) present in appreciable quantities at some of the closer boreholes, particularly WP251 and WP113, respectively at 100 m and 170 m from the waste pile (Figure 11a,b). The graphs also show how the pollution has decreased at most of the monitoring points. This is ascribed to the development of the necessary populations of bacteria that convert the NH4+ to other nitrogen compounds. As pollution levels in the aquifer decrease, the aquifer conditions will change from anaerobic to anoxic and eventually to oxic (see discussion on SO42− below). The limited distribution of NH4+ in groundwater around the landfill shows that it has not migrated very far from the waste pile due to the bacterially mediated conversion to nitrate and reduction to nitrogen gas. It is expected that as the generation of NH4+ in the waste pile decreases, and oxic conditions are established, it will eventually be eliminated from the groundwater due to the processes listed above (Figure 11b).
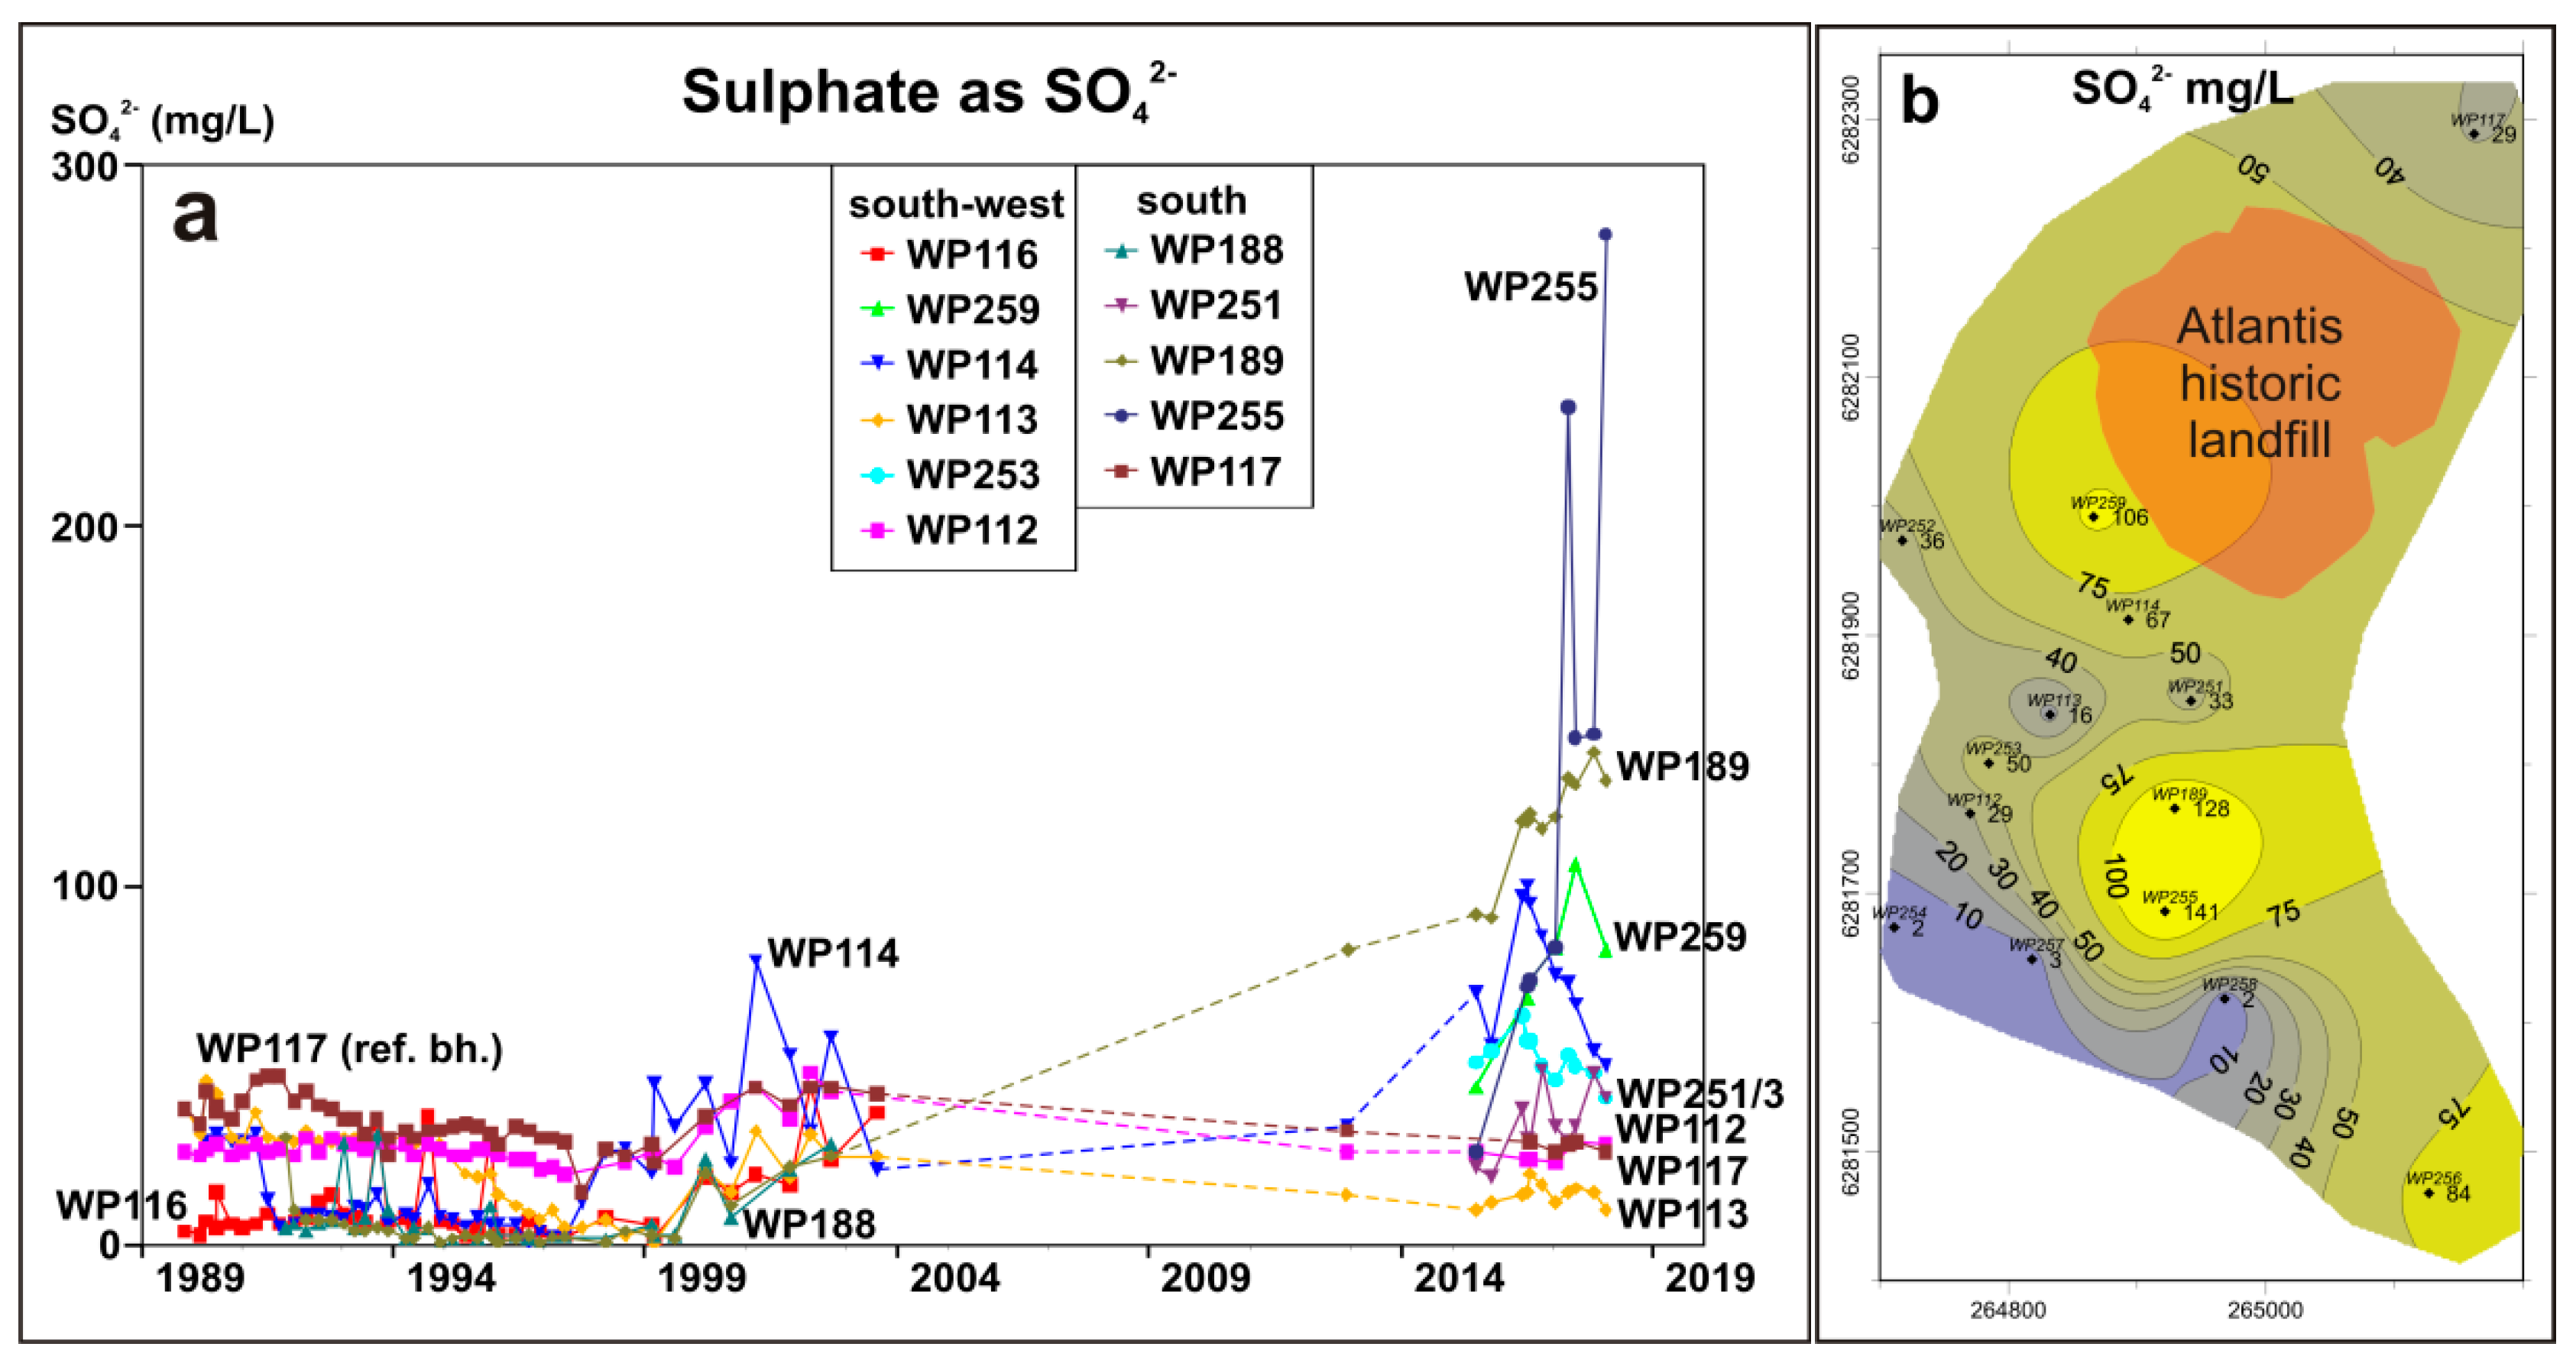
6.5. Sulfate
The distribution of SO42− in the aquifer and the plume is more complex; natural SO42− reduction in the unpolluted aquifer is possibly due to the presence of significant levels of organic carbon derived from Fynbos vegetation. However, at the up-gradient reference borehole, SO42− is 29 mg L−1, which possibly relates to the fact that the borehole ends in the Witzand Member that does not have the same reducing environment as the underlying Springfontein Member accessed by the newer deep boreholes. The three southern and south-westerly deep boreholes, which have not been affected by the plume, have very low SO42− concentrations of 2 to 3 mg L−1.
At borehole WP116, located in a south-westerly direction adjacent to the waste pile, only trace concentrations of SO42− were noted over the first decade of monitoring but subsequently it increased gradually until the borehole was lost (Figure 12a,b). At borehole WP114 located 70 m from the waste pile, the SO42− concentration was initially at the background level (cf. reference borehole WP117 in Figure 12b), but once impacted by the leachate plume in 1991 as anaerobic conditions developed, the SO42− concentration was reduced to virtually zero. By 1998, the reducing conditions had changed and SO42− was again present at higher concentrations than before, which implies that SO42− produced in the waste pile was now breaking through. Borehole WP113, located 170 m from the waste pile, showed a similar sequence at a slightly later stage, with the decrease in SO42− in 1996 and the recovery in 1999. Whereas the period of reducing conditions lasted seven years at WP114, it lasted only three years at WP113 some 100 m further from the waste pile. At borehole WP112, some 270 m from the waste pile, the presence of SO42− in the groundwater follows a pattern very similar to that of the up-gradient reference borehole, WP117 (Figure 12a). This would imply that the reducing conditions due to the pollution plume did not extend that far from the waste disposal site in a south-westerly direction. It should be stressed that all boreholes from WP112 to WP117 are shallow and such boreholes in this area generally have a low natural SO42− concentration between 25 and 40 mg L−1. Generally, groundwater from the deeper strata of the aquifer contains hydrogen sulfide. Although the concentration of H2S is generally well below 1 mg L−1, it still signifies natural reducing conditions occurring at depth with bacteria-mediated SO42− reduction. This is ascribed to the wide-spread presence of dissolved organic carbon in the groundwater serving as substrate for the bacteria. The organic carbon is derived from the Fynbos and also the alien vegetation cover. Nevertheless, the newer deep borehole WP259, located 33 m south-west of the waste pile, had significant SO42− concentrations similar to those of WP114 at 70 m from the waste pile, but lagging by about one year. Thus, closer to the waste site it took longer for oxic conditions to be re-established in the subsurface. The deep borehole WP253, located between shallow boreholes WP112 and WP113, also showed SO42− concentrations above background levels confirming that SO42− transported in the pollution plume was present at depth at that point.
The SO42− concentration trends at the monitoring boreholes stretching southwards are also shown in Figure 12a. Whereas borehole WP188 had very low SO42− concentrations from the outset, borehole WP189 in 1991 showed SO42− concentrations at a level similar to those of the up-gradient reference borehole. By 1999, the reducing conditions started to subside and these two shallow boreholes showed a similar increase in SO42− concentrations. Borehole WP188 was lost, but at WP189 SO42− concentrations continued rising until 2018. The deep borehole WP251 replacing WP188 still had relatively low SO42− concentrations indicating that at depth close to the waste pile the reducing conditions were only beginning to subside. However, at the deeper borehole WP255 at a distance of 260 m from the waste pile, there was a significant breakthrough of SO42− reaching several hundred mg L−1 demonstrating the extent of the SO42− concentration in the leachate plume. The maximum values are three times higher in this direction compared to those at a similar distance south-west of the waste pile.
The occurrence of an increasing SO42− concentration in the groundwater in the vicinity of the landfill as shown in the contour map (Figure 12b) is an encouraging development as it indicates that the pollution load is diminishing even though SO42− pollution itself can also be a problem. The high SO42− concentrations (and those of other parameters) in the deeper boreholes indicate that the plume is changing the nature of the aquifer hydrochemistry and the contrast is clearly visible in the south where the natural groundwater is still showing extremely low SO42− concentrations at depth at boreholes WP254, WP257 and WP258.
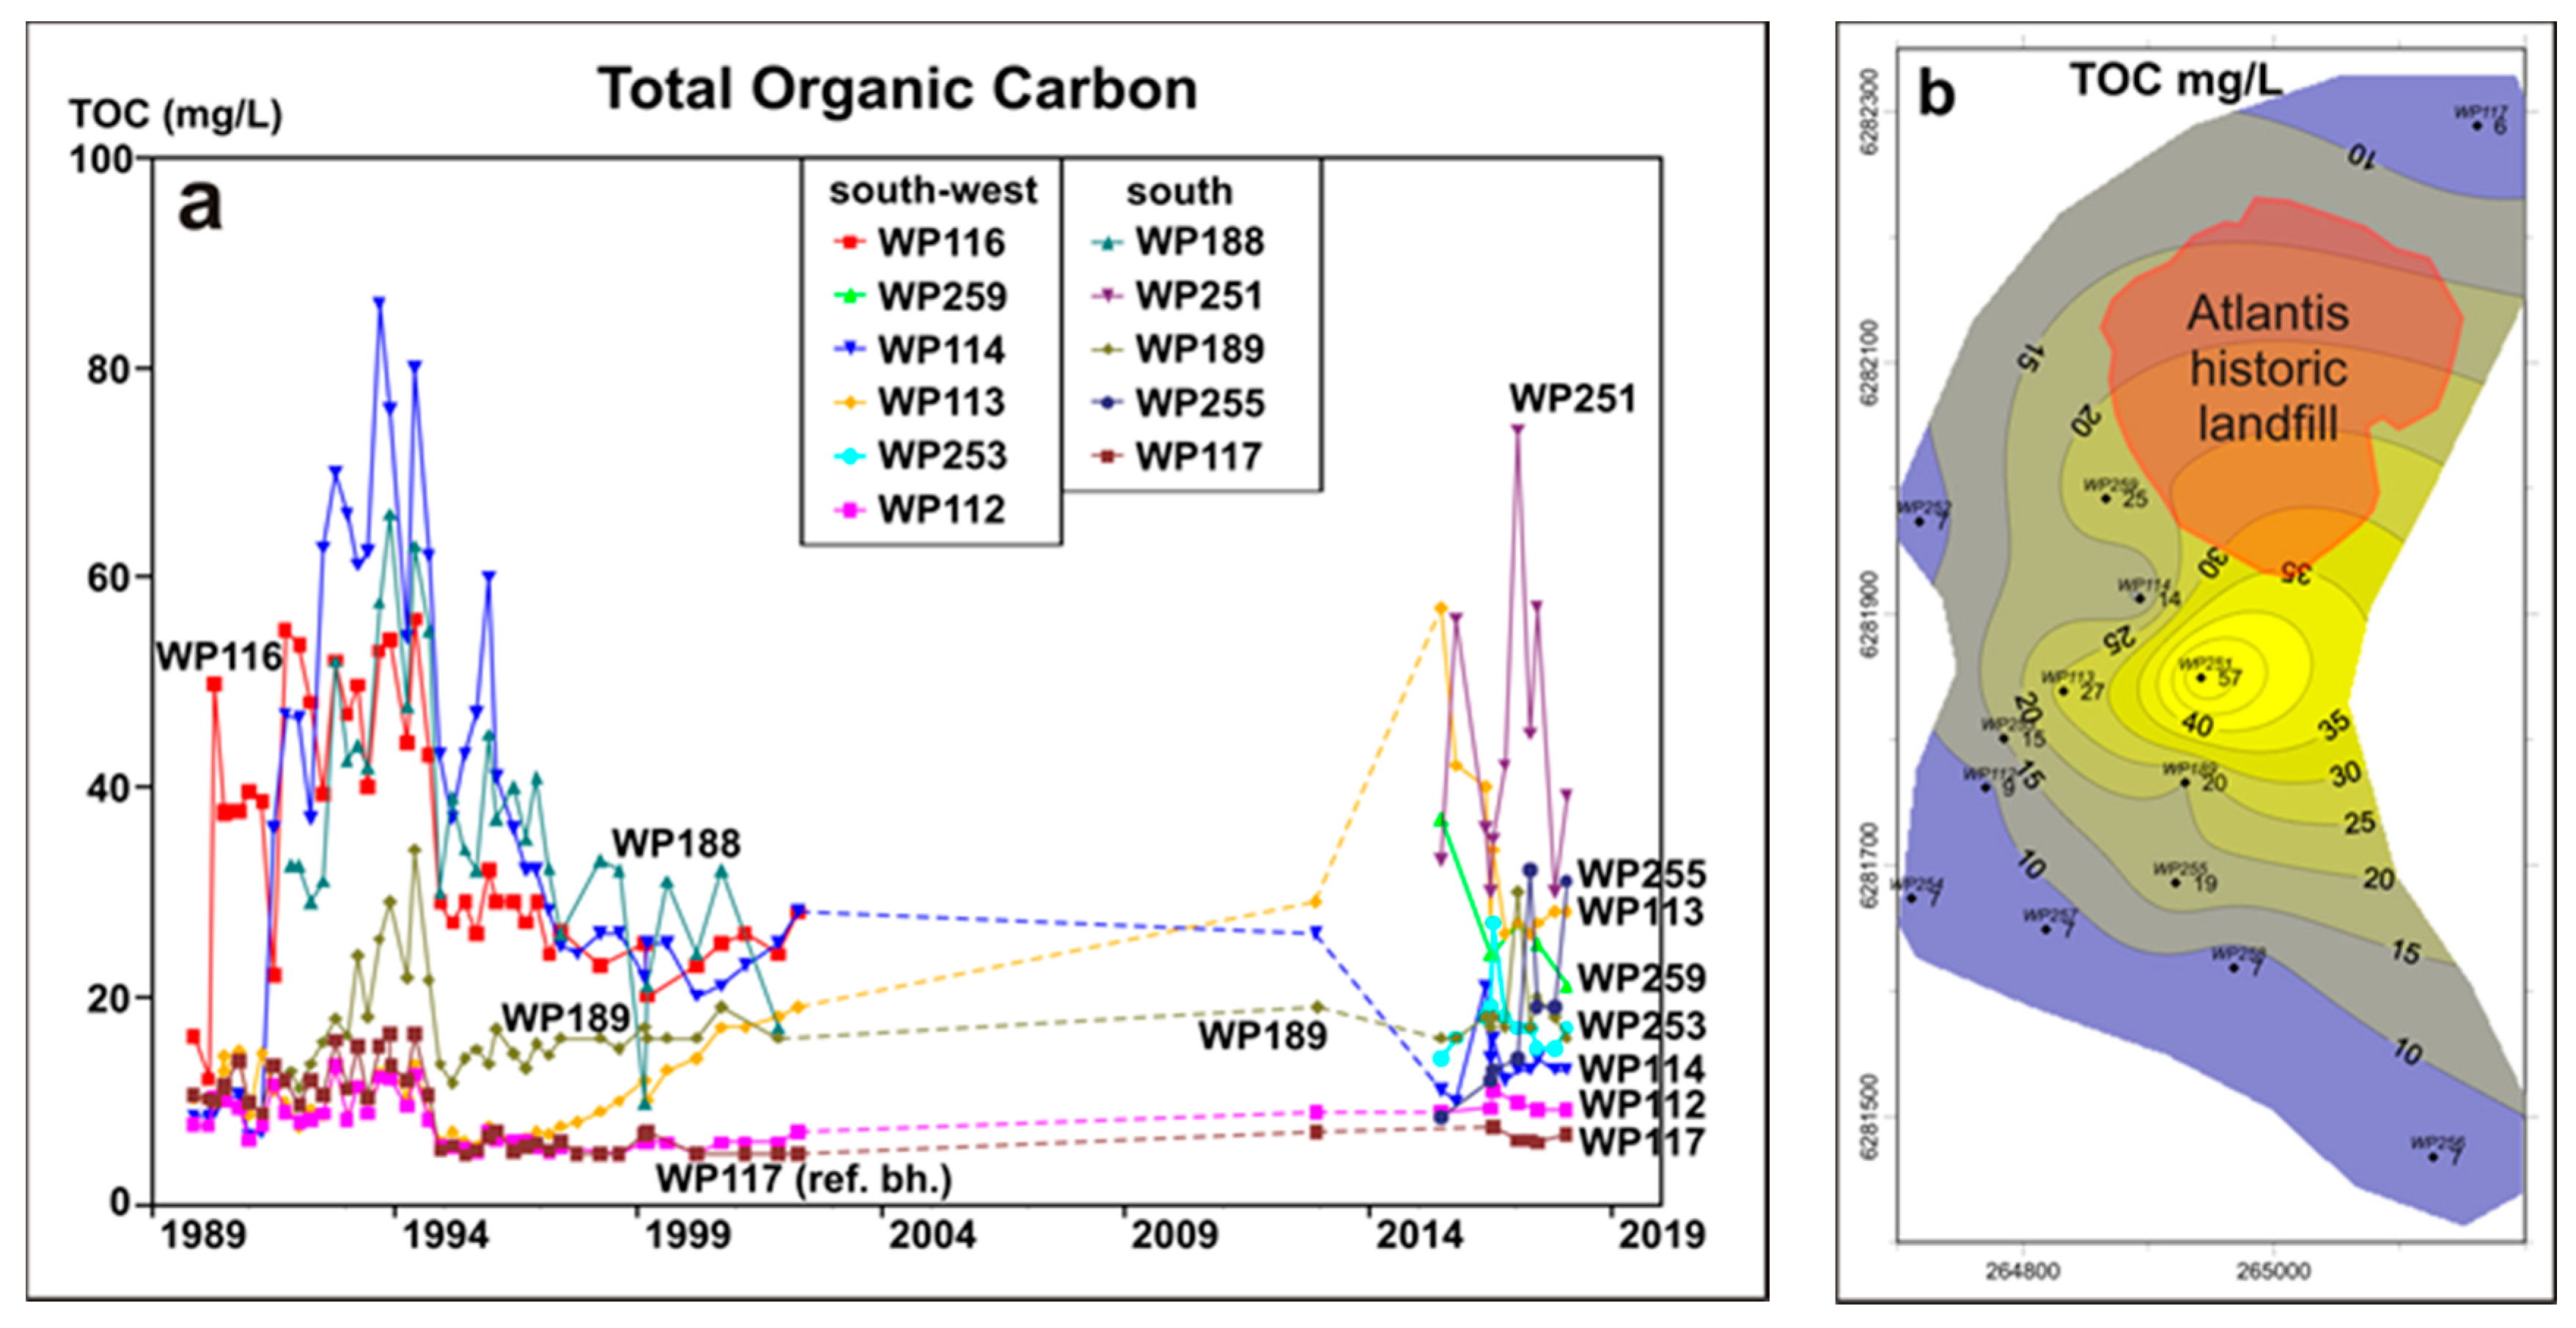
6.6. Total Organic Carbon
Determining TOC is a useful indicator to describe the total content of organic compounds in the water, especially while concentrations are still relatively low. However, it is not an alternative for identifying specific hazardous organic compounds in the leachate. In this case, it helped to describe the “organic load” in the groundwater and the extent to which it was mobilized in the aquifer. The only individual compound that was analyzed in this case was cyanide and it was always below 0.05 mg L−1.
Borehole WP116, located next to the waste pile in a SW direction, showed appreciable concentrations of TOC from the first sampling in 1989 indicating that the effect of the plume was already measurable at the time (Figure 13a). However, by 1995 it had already subsided possibly due to the bacterial population decomposing these organic compounds being fully established in the underground. Breakthrough of TOC occurred in 1991 at WP114 (70 m from the waste pile) but by 1997 it also subsided reaching much lower levels. By 1997, a gradual breakthrough could be observed at WP113 at 170 m from the waste pile. This gradual increase seemingly continued until 2012 but it reached the peak concentration only in 2015. At the time, bush clearing was taking place in the area and it is possible that the effect of the plume was enhanced by decomposing plant debris that was left on the surface. The inorganic part of the plume (as represented by the EC) had reached the shallow borehole WP112 already by the year 2000 but by January 2018 there was still no real indication that the TOC was increasing. In contrast, the deep borehole WP253, located between shallow boreholes WP112 and WP113, showed a slightly elevated TOC since 2015 when it was drilled. This implies that in the deeper strata there could still be a slightly elevated TOC due to the pollution plume even at a distance of 220 m in the south-westerly direction.
In 1991, when borehole WP188 at 100 m south of the waste pile was first sampled, the TOC was already elevated (Figure 13a). At WP189, approximately 190 m south of the waste pile, the TOC had already started increasing in 1992. However, at both these shallow boreholes the TOC concentration started decreasing in 1995 and at WP189 it subsequently increased at a low rate. When the deep borehole WP251 was installed in 2015 to replace WP188, higher levels of TOC were found at depth indicating that the plume was still present at somewhat greater depth. At borehole WP255 (deep), breakthrough of low levels of TOC occurred in 2016 with levels similar to those of WP189. It was in this period that the stand of Blue gum trees in the area between these two boreholes was felled and it is possible that the TOC could be ascribed to the decomposition of plant debris left on the surface.
The distribution of TOC in the area surrounding the waste site is shown in Figure 13b. This illustrates that the highest TOC concentration was found at the deep borehole WP251 south of the waste pile in 2017. The 10 mg L−1 contour gives a good idea of the extent of the impact of organic compounds on the aquifer assuming that the natural TOC concentration in the aquifer is 6 to 7 mg L−1 as C.
In their review on modelling transport and geochemical processes, Brun and Engesgaard [12] reiterated that different redox environments and associated biogeochemical process affect the transformation of inorganic compounds (e.g., NH4+, SO42−) as well as the biodegradation of soluble organic compounds. The mechanisms and effects of these redox processes were discussed in detail in [44], although much of the biogeochemical reactions are not yet fully understood and provide an opportunity for further research.
7. Conclusions
The results indicated that after more than three decades, the Atlantis historical landfill is still generating pollution as nearby monitoring points still show appreciable levels of contaminants and even temporary increases. It is possible that rainwater infiltration was enhanced and leachate generation facilitated by the recent excavation and capping operations which disturbed the waste pile. The most concentrated part of the pollution plume is still relatively close to the site, which implies that plume movement has been slow over the past three decades.
The NNE–SSW groundwater level gradient across the site is the most important driver for the plume movement. However, it would seem that inhomogeneity of the aeolian sand deposits is causing slight deviations from the expected direction of leachate migration based on the general (regional) water level gradient in the vicinity of the site. The variation in the sand characteristics also seems to affect the rate of groundwater movement and plume migration in specific directions. Based on the time lag until breakthrough of specific indicators, it was estimated that the plume movement in the SW direction could be as fast as 25 m a−1 close to the waste pile but on average it could also be slower than 10 m a−1 over several hundreds of meters. Due to the fact that the intensity of the plume subsided over some 400 m to such an extent that it essentially consisted of salinity and hardness, while the distance to the Witzand Wellfield is 6 km, remediation was not indicated at this stage.
Down-the-hole temperature logs indicated anomalies in the subsurface which are ascribed to the heat developed by exothermic chemical reactions in the waste pile. The electromagnetic (EM-34) surveys contributed significantly to the determination of the extent of the pollution plume and the placement of the monitoring boreholes. Although the plume was initially found close to the surface, the installation of deeper monitoring boreholes in 2015 confirmed that the plume is transported at greater depths in the aquifer further away from the waste pile due to the relatively high transmissivity and the density of the plume.
Detailed evaluation of the chemical data showed that the characteristics and composition of the pollution plume change as it migrates away from the waste pile. The plume initially contains high levels of NH4+, TOC, K+, Cl−, HCO3− (measured as total alkalinity), Na+ and Ca2+. However, the NH4+ is gradually eliminated (or partly converted to NO3−), the TOC is significantly reduced relatively close to the waste site except possibly for persistent compounds, K+ transport is somewhat delayed due to ion exchange, but Cl− is transported advectively, while total alkalinity, Na+, and Ca2+ follow closely. The differences in transport rates also depend on molecular weight and size, e.g., hydration of ions. Sulphur compounds derived from the waste pile are, at least partly, converted to sulfide in the anaerobic conditions in the leachate. Conversely, as redox conditions change, some of the sulfide will be oxidized to SO42− and, hence, the SO42− concentration will increase down-gradient. The eventual pollution plume at a distance of 350–400 m from the landfill consists, therefore, of high levels of Na+, Ca2+, Cl−, and HCO3−, as well as raised SO42−, K+, and possibly NO3−. TOC levels may be marginally above background concentrations. The impact of pollution migration from this unlined historical landfill may not, however, be generalized. Since the promulgation of the Minimum Requirements of the Department of Water and Sanitation in 1994, newer landfills, including those still to be built, have to be lined to prevent pollution migration.
Author Contributions
Conceptualization, G.T., R.B. and N.J. Methodology, G.T., R.B. and S.I.; Formal Analysis, G.T.; Investigation, G.T., R.B. and S.I.; Resources, City of Cape Town/CSIR. Data Curation, G.T. and R.B.; Writing-Original Draft Preparation, G.T.; Writing-Review & Editing, R.B. and N.J.; Visualization, G.T. and R.B.; Supervision, G.T. and N.J.; Project Administration: R.B. Funding Acquisition, R.B.
Funding
The studies were largely funded by the City of Cape Town and its predecessors, the Cape Divisional Council and the Western Cape Regional Services Council. The City of Cape Town has given permission to publish the results.
Acknowledgments
The diligent contributions of many CSIR colleagues with regard to sampling and analysis of the groundwater over many years are gratefully acknowledged. The authors acknowledge the South African National Space Agency (SANSA) Earth Observation Directorate as data supplier and the Centre National d’Etudes Spatiales (CNES) as property owner of the SPOT 5 background image in Figure 4.
Conflicts of Interest
The authors declare no conflict of interest. The funding sponsors have given permission for the design of the study; the collection, analyses, or interpretation of data; the writing of the manuscript, and the decision to publish the results.
References
- Kjeldsen, P.; Barlaz, M.A.; Rooker, A.P.; Baun, A.; Ledin, A.; Christensen, T.H. Present and long-term composition of MSW landfill leachate: A review. Crit. Rev. Environ. Sci. Technol. 2002, 32, 297–336. [Google Scholar] [CrossRef]
- Bjerg, P.L.; Albrechtsen, H.-J.; Kjeldsen, P.; Christensen, T.H.; Cozzarelli, I.M. The biogeochemistry of contaminant groundwater plumes arising from waste disposal facilities. In Treatise on Geochemistry, 2nd ed.; Elsevier Science: New York, NY, USA, 2014; Volume 11, pp. 573–605. [Google Scholar]
- Christensen, T.H.; Bjerg, P.L.; Kjeldsen, P. Natural attenuation: A feasible approach to remediation of ground water pollution at landfills? Groundw. Monit. Remediat. 2000, 20, 69–77. [Google Scholar] [CrossRef]
- Cozzarelli, I.M.; Bolkhe, J.K.; Masoner, J.; Breit, J.N.; Lorah, M.M.; Tuttle, M.L.W.; Jaeschke, J.B. Biogeochemical evolution of a landfill leachate plume, Norman, Oklahoma (Review). Ground Water 2011, 49, 663–687. [Google Scholar] [CrossRef] [PubMed]
- Mukherjee, S.; Mukhopadhyay, S.; Hashim, M.A.; Gupta, B.S. Contemporary environmental issues of landfill leachate: Assessment and remedies. Crit. Rev. Environ. Sci. Technol. 2015, 45, 472–590. [Google Scholar] [CrossRef] [Green Version]
- Kjeldsen, P. Groundwater pollution source characterization of an old landfill. J. Hydrol. 1993, 42, 349–371. [Google Scholar] [CrossRef]
- Fatta, D.; Papadopoulos, A.; Loizidou, M. A study on the landfill leachate and its impact on the groundwater quality of the greater area. Environ. Geochem. Health 1999, 21, 175–190. [Google Scholar] [CrossRef]
- Porowska, D. A simple method for delineation of leachate plumes. Periodica Polytech. Chem. Eng. 2017, 61, 156–162. [Google Scholar] [CrossRef]
- Rosqvist, H.; Dahlin, T.; Fourie, A.; Rohrs, L.; Bengtsson, A.; Larsson, M. Mapping of leachate plumes at two landfill sites in South Africa using geoelectrical imaging techniques. In Proceedings of the Ninth International Waste Management and Landfill Symposium, S. Margherita di Pula, Cagliari, Italy, 6–10 October 2003. [Google Scholar]
- Reyes-López, J.A.; Ramírez-Hernández, J.; Lázaro-Mancilla, O.; Carreón-Diazconti, C.; Martín-Loeches Garrido, M. Assessment of groundwater contamination by landfill leachate: A case in México. Waste Manag. 2008, 28, S33–S39. [Google Scholar] [CrossRef] [PubMed]
- Rahim Bahaa-Eldin, E.A.; Yusoff, I.; Abdul Rahim, S.; Wan Zuhairi, W.Y.; Abdul Ghani, M.R. Tracing subsurface migration of contaminants from an abandoned municipal landfill. Environ. Earth. Sci. 2011, 63, 1043–1055. [Google Scholar] [CrossRef]
- Brun, A.; Engesgaard, P. Modelling of transport and biogeochemical processes in pollution plumes: Literature review and model development. J. Hydrol. 2002, 256, 211–227. [Google Scholar] [CrossRef]
- Kulikowska, D.; Klimiuk, E. The effect of landfill age on municipal leachate composition. Bioresour. Technol. 2008, 99, 5981–5985. [Google Scholar] [CrossRef] [PubMed]
- MacFarlane, D.S.; Cherry, J.A.; Gillham, R.W.; Sudicky, E.A. Migration of contaminants in groundwater at a landfill: A case study 1. Groundwater Flow and Plume Delineation. J. Hydrol. 1983, 63, 1–29. [Google Scholar] [CrossRef]
- Masoner, J.R.; Cozzarelli, I.M. Spatial and temporal migration of a landfill leachate plume in alluvium. Water Air Soil Pollut. 2015, 226. [Google Scholar] [CrossRef]
- Parsons, R. Geohydrological Description of the Area around the Atlantis Solid Waste Disposal Site; Report No. 30/91; CSIR, Watertek: Stellenbosch, South Africa, 1991. [Google Scholar]
- Parsons, R. Groundwater Monitoring: Atlantis Solid Waste Disposal Site; Report No. 5 to WCRSC; CSIR, Watertek: Stellenbosch, South Africa, 1993. [Google Scholar]
- Weaver, J.M.C. Groundwater Monitoring: Atlantis Solid Waste Disposal Site; Report No. 1 to WCRSC; CSIR, Watertek: Stellenbosch, South Africa, 1989. [Google Scholar]
- Weaver, J.M.C. Groundwater Monitoring: Atlantis Solid Waste Disposal Site; Report No. 2 to WCRSC; CSIR, Watertek: Stellenbosch, South Africa, 1990. [Google Scholar]
- Weaver, J.M.C. Groundwater Monitoring: Atlantis Solid Waste Disposal Site; Report No. 3 to WCRSC; CSIR, Watertek: Stellenbosch, South Africa, 1991. [Google Scholar]
- Wright, A. Groundwater Monitoring: Atlantis Solid Waste Disposal Site; Report No. 4 to WCRSC; CSIR, Watertek: Stellenbosch, South Africa, 1992. [Google Scholar]
- Parsons, R.; Pietersen, K. Groundwater Monitoring: Atlantis Solid Waste Disposal Site; Report No. 5 to WCRSC; CSIR, Watertek: Stellenbosch, South Africa, 1994. [Google Scholar]
- Parsons, R. Groundwater Monitoring: Atlantis Solid Waste Disposal Site; Report No. 7 to CMC; CSIR, Watertek: Stellenbosch, South Africa, 1995. [Google Scholar]
- Cavé, L.C.; Parsons, R.P. Groundwater Monitoring: Atlantis Solid Waste Disposal Site; Report No. ENV/S-C96019 to CMC; CSIR, Environmentek: Stellenbosch, South Africa, 1996. [Google Scholar]
- Cavé, L.C. Groundwater Monitoring: Atlantis Solid Waste Disposal Site; Report No. ENV/S-C97080; CSIR, Environmentek: Stellenbosch, South Africa, 1997. [Google Scholar]
- Soltau, L.; Hobbs, P.J.; Tredoux, G. Report on Resistivity Surveys at the Defunct Atlantis Solid Waste Disposal Site to Determine the Extent of Groundwater Pollution; Report No. CSIR/NRE/WR/ER/2007/0017/C; CSIR, Natural Resources and Environment: Stellenbosch, South Africa, 2007. [Google Scholar]
- National Environmental Management: Waste Act No. 59 of 2008. 2009; Environmental Affairs Republic of South Africa. Available online: https://www.environment.gov.za/sites/default/files/legislations/ nema_amendment_act59.pdf (accessed on 21 June 2018).
- Environment Conservation Act No. 73 of 1989. 1989; Environmental Affairs Republic of South Africa. Available online: https://www.environment.gov.za/sites/default/files/legislations/environment_ conservation_ act73of1989.pdf (accessed on 21 June 2018).
- Tredoux, G.; Cavé, L.C. Atlantis Aquifer: A Status Report on 20 Years of Groundwater Management at Atlantis; Report No. ENV-S-C 2002-069 to the City of Cape Town; CSIR, Environmentek: Stellenbosch, South Africa, 2002. [Google Scholar]
- Van der Merwe, A.J. Explorasie, Ontginning en Evaluering van Grondwater van die Sandafsetting in die Atlantisgebied vir Watervoorsiening aan die Atlantisgroeipunt. Master’s Thesis, University of the Orange Free State, Bloemfontein, South Africa, 1983. [Google Scholar]
- Rogers, J. First Report on the Cenozoic Sediments between Cape Town and Elands Bay; Report No. 1980-0249; Geological Survey: Pretoria, South Africa, 1980.
- Land Type Survey Staff. Land Types of South Africa: Digital Map (1:250 000 Scale) and Soil Inventory Databases; ARC-Institute for Soil, Climate and Water: Pretoria, South Africa, 2001. [Google Scholar]
- Food and Agriculture Organization of the United Nations (FAO). World Reference Base for Soil Resources; Food and Agriculture Organization of the United Nations: Rome, Italy, 1998. [Google Scholar]
- Vandoolaeghe, M.A.C.; Bertram, W.E. Atlantis Grondwatersisteem: Herevaluasie van Versekerde Lewering; Technical Report Gh3222; Department of Water Affairs: Pretoria, South Africa, 1982.
- Fleisher, J.N.E. The Geohydrology of the Witzand Field; Report No. 2/90; CSIR, Watertek: Stellenbosch, South Africa, 1990. [Google Scholar]
- Bredenkamp, D.B.; Vandoolaeghe, M.A.C. Die Ontginbare Grondwater Potensiaal van die Atlantisgebied; Technical Report Gh3227; Department of Water Affairs: Pretoria, South Africa, 1982.
- Wright, A. Atlantis Groundwater Management Programme. An Investigation of the Geohydrological Divide between the Artificial Recharge Area and the Atlantis Industrial Area; Internal Report 1/90; CSIR, Watertek: Stellenbosch, South Africa, 1990. [Google Scholar]
- Du Toit, A.J.; Weaver, J.M.C. Geohydrological and Hydrogeochemical Studies at the Pilot-Scale Artificial Recharge Site for Treated Industrial Effluent; Interim Progress Report; CSIR, Watertek: Stellenbosch, South Africa, 1987. [Google Scholar]
- Bertram, W.E.; Havenga, P.L.; Timmerman, K.M.G.; Vandoolaeghe, M.A.C. Atlantis: Witzand Wellfield Extension; Technical Report Gh3317; Department of Water Affairs: Pretoria, South Africa, 1983.
- Ehrig, H.J. Treatment of sanitary landfill leachate: Biological treatment. Waste Manag. Res. 1984, 2, 131–152. [Google Scholar]
- Bugan, R.; Tredoux, G.; van Schoor, S.; Israel, S. Groundwater Assessment and Monitoring: Atlantis Historic Landfill; Report No. ECHS048-1; CSIR, Natural Resources and the Environment: Stellenbosch, South Africa, 2015. [Google Scholar]
- Tredoux, G.; Cavé, L.C.; Engelbrecht, J.F.P. Groundwater pollution: Are we monitoring appropriate parameters? Water SA 2004, 30, 662–667. [Google Scholar] [CrossRef]
- Kerndorff, H.; Schleyer, R.; Milde, G.; Plumb, R.H., Jr. Geochemistry of groundwater pollutants at German waste disposal sites. In Groundwater Contamination and Analysis at Hazardous Waste Sites; Lesage, S., Jackson, R.E., Eds.; Marcel Dekker Inc.: New York, NY, USA, 1992; pp. 245–271. [Google Scholar]
- Christensen, T.H.; Kjeldsen, P.; Bjerg, P.L.; Jensen, D.L.; Christensen, J.B.; Baun, A.; Albrechtsen, H.-J.; Heron, G. Biogeochemistry of landfill leachate plumes. Appl. Geochem. 2001, 16, 659–718. [Google Scholar] [CrossRef]
Figure 1.
Geology, main features of the Atlantis town area, wastewater treatment works (WWTW), water recycling infrastructure and location of the Atlantis historical waste site.
Figure 1.
Geology, main features of the Atlantis town area, wastewater treatment works (WWTW), water recycling infrastructure and location of the Atlantis historical waste site.

Figure 2.
Annual rainfall recorded at the Atlantis wastewater treatment works (WWTW).

Figure 3.
Schematic geological cross section of the Atlantis coastal area with stratigraphic sequence.
Figure 3.
Schematic geological cross section of the Atlantis coastal area with stratigraphic sequence.

Figure 4.
Atlantis historical landfill site layout showing monitoring points and geophysical profiles of 1997, 2007 and 2015.
Figure 4.
Atlantis historical landfill site layout showing monitoring points and geophysical profiles of 1997, 2007 and 2015.

Figure 5.
Groundwater level (WL) trends over the past 30 years around the historical Atlantis landfill.
Figure 5.
Groundwater level (WL) trends over the past 30 years around the historical Atlantis landfill.

Figure 6.
Contour map of interpolated groundwater level (WL) in June 2017 around the Atlantis historical landfill.
Figure 6.
Contour map of interpolated groundwater level (WL) in June 2017 around the Atlantis historical landfill.

Figure 7.
Down-the-hole logs of electrical conductivity (EC) and temperature for the deep monitoring boreholes around the Atlantis historical landfill (October 2017).
Figure 7.
Down-the-hole logs of electrical conductivity (EC) and temperature for the deep monitoring boreholes around the Atlantis historical landfill (October 2017).

Figure 8.
Electrical conductivity (EC) trends at monitoring boreholes around the Atlantis historical landfill.
Figure 8.
Electrical conductivity (EC) trends at monitoring boreholes around the Atlantis historical landfill.

Figure 9.
Contour map of interpolated Cl− concentrations around the Atlantis historical landfill in 2017.
Figure 9.
Contour map of interpolated Cl− concentrations around the Atlantis historical landfill in 2017.

Figure 10.
Contour map of interpolated K+ concentrations around the Atlantis historical landfill in 2017.
Figure 10.
Contour map of interpolated K+ concentrations around the Atlantis historical landfill in 2017.

Figure 11.
Groundwater concentrations of NH4+ (as N)- around the Atlantis historical landfill: (a) NH4+ (as N) concentrations over time; (b) contour map of interpolated NH4+ (as N) concentrations in 2017.
Figure 11.
Groundwater concentrations of NH4+ (as N)- around the Atlantis historical landfill: (a) NH4+ (as N) concentrations over time; (b) contour map of interpolated NH4+ (as N) concentrations in 2017.

Figure 12.
Groundwater concentrations of SO42− around the Atlantis historical landfill: (a) SO42− concentrations over time; (b) contour map of interpolated SO42− concentrations in 2017.
Figure 12.
Groundwater concentrations of SO42− around the Atlantis historical landfill: (a) SO42− concentrations over time; (b) contour map of interpolated SO42− concentrations in 2017.

Figure 13.
Total organic carbon (TOC) in groundwater around the Atlantis historical landfill: (a) TOC over time; (b) contour map of interpolated TOC in 2017.
Figure 13.
Total organic carbon (TOC) in groundwater around the Atlantis historical landfill: (a) TOC over time; (b) contour map of interpolated TOC in 2017.


Table 1.
Hydraulic conductivities of the Atlantis aquifer.
| Stratigraphic Unit | Horizontal Hydraulic Conductivity (m d−1) | Vertical Hydraulic Conductivity (m d−1) |
|---|---|---|
| Witzand Member | 25 | 15 |
| Springfontein Member | 25 | 35 |
| Varswater Formation | 1–3.5 | ND |
| Duynefontein Member | ND | 25 |
| Silwerstroom Member | ND | 13 |
Table 2.
Monitoring boreholes drilled around the Atlantis waste disposal site.
| Borehole | Depth (m) | Aquifer 1 | Approx. Distance 2 (m) | Notes |
|---|---|---|---|---|
| WP112 | 8.59 | Witzand | 270 | Down-gradient—south-westerly |
| WP113 | 3.77 | Witzand | 170 | Down-gradient—south-westerly |
| WP114 | 8.8 | Witzand | 70 | Down-gradient—south-westerly |
| WP115 | 7.95 | Witzand | 15 | Destroyed |
| WP116 | 8.05 | Witzand | 5 | Down-gradient—south-westerly Destroyed 3 |
| WP117 | 7.7 | Witzand | 120 | Up-gradient reference borehole |
| WP188 | 7.75 | Witzand | 100 | Down-gradient—south-westerly Destroyed 4 |
| WP189 | 7.9 | Witzand | 190 | Down-gradient—southerly |
| WP251 | 24 | Springfontein | 100 | Down-gradient—southerly |
| WP252 | 20 | Springfontein | 210 | Down-gradient—westerly |
| WP253 | 20 | Springfontein | 220 | Down-gradient—south-westerly |
| WP254 | 20 | Springfontein | 373 | Down-gradient—south-westerly |
| WP255 | 20 | Springfontein | 260 | Down-gradient—southerly |
| WP256 | 18 | Springfontein | 470 | Down-gradient—southerly |
| WP257 | 24 | Springfontein | 340 | Down-gradient—southerly |
| WP258 | 25 | Springfontein | 323 | Down-gradient—southerly |
| WP259 | 25 | Springfontein | 33 | Down-gradient—south-westerly |
1 Witzand = upper; Springfontein = lower; 2 Approximate distance from edge of waste pile; 3 Replaced by WP259 (deep borehole); 4 Replaced by WP251 (deep borehole).
© 2018 by the authors. Licensee MDPI, Basel, Switzerland. This article is an open access article distributed under the terms and conditions of the Creative Commons Attribution (CC BY) license (http://creativecommons.org/licenses/by/4.0/).
Share and Cite
MDPI and ACS Style
Bugan, R.; Tredoux, G.; Jovanovic, N.; Israel, S. Pollution Plume Development in the Primary Aquifer at the Atlantis Historical Solid Waste Disposal Site, South Africa. Geosciences 2018, 8, 231. https://doi.org/10.3390/geosciences8070231
AMA Style
Bugan R, Tredoux G, Jovanovic N, Israel S. Pollution Plume Development in the Primary Aquifer at the Atlantis Historical Solid Waste Disposal Site, South Africa. Geosciences. 2018; 8(7):231. https://doi.org/10.3390/geosciences8070231
Chicago/Turabian StyleBugan, Richard, Gideon Tredoux, Nebo Jovanovic, and Sumaya Israel. 2018. "Pollution Plume Development in the Primary Aquifer at the Atlantis Historical Solid Waste Disposal Site, South Africa" Geosciences 8, no. 7: 231. https://doi.org/10.3390/geosciences8070231
Note that from the first issue of 2016, this journal uses article numbers instead of page numbers. See further details here.