Picking Up the Pieces—Harmonising and Collating Seabed Substrate Data for European Maritime Areas

 ,
,
Abstract
:1. Introduction
2. Materials and Methods
2.1. Data Sourcing
2.2. Harmonisation
2.3. Generalisation
2.4. Compilation
2.5. Confidence Assessment
3. Results
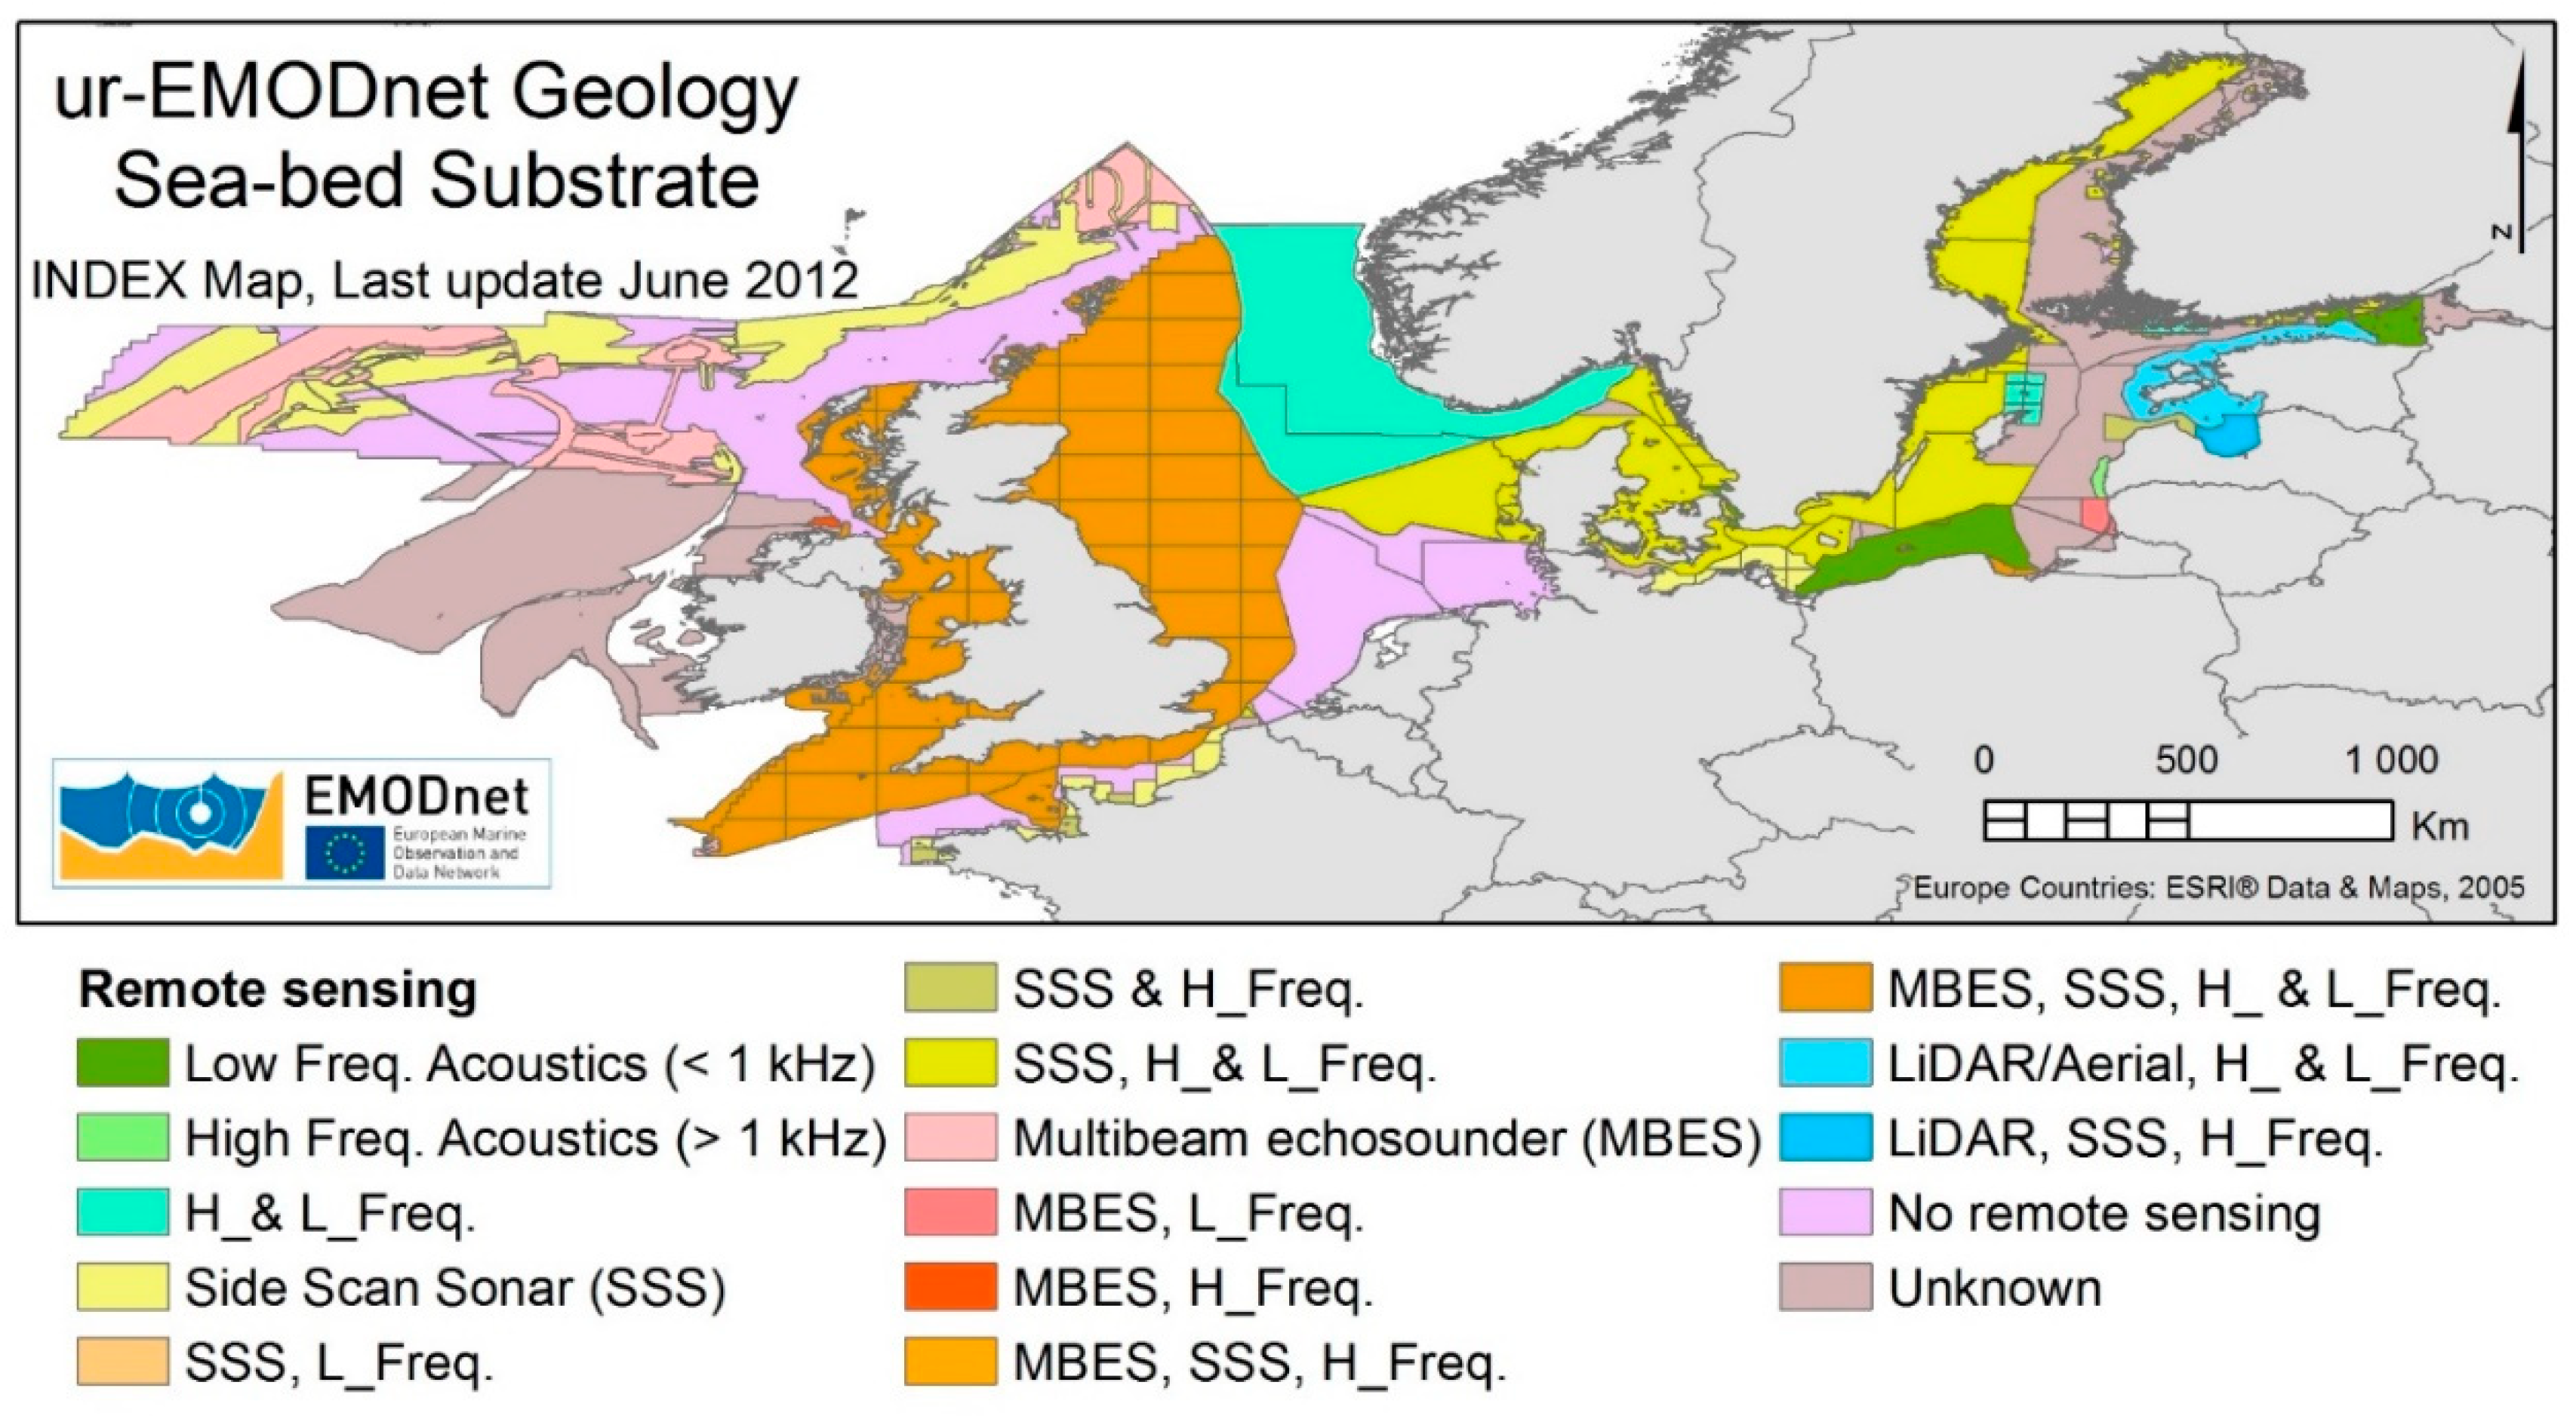
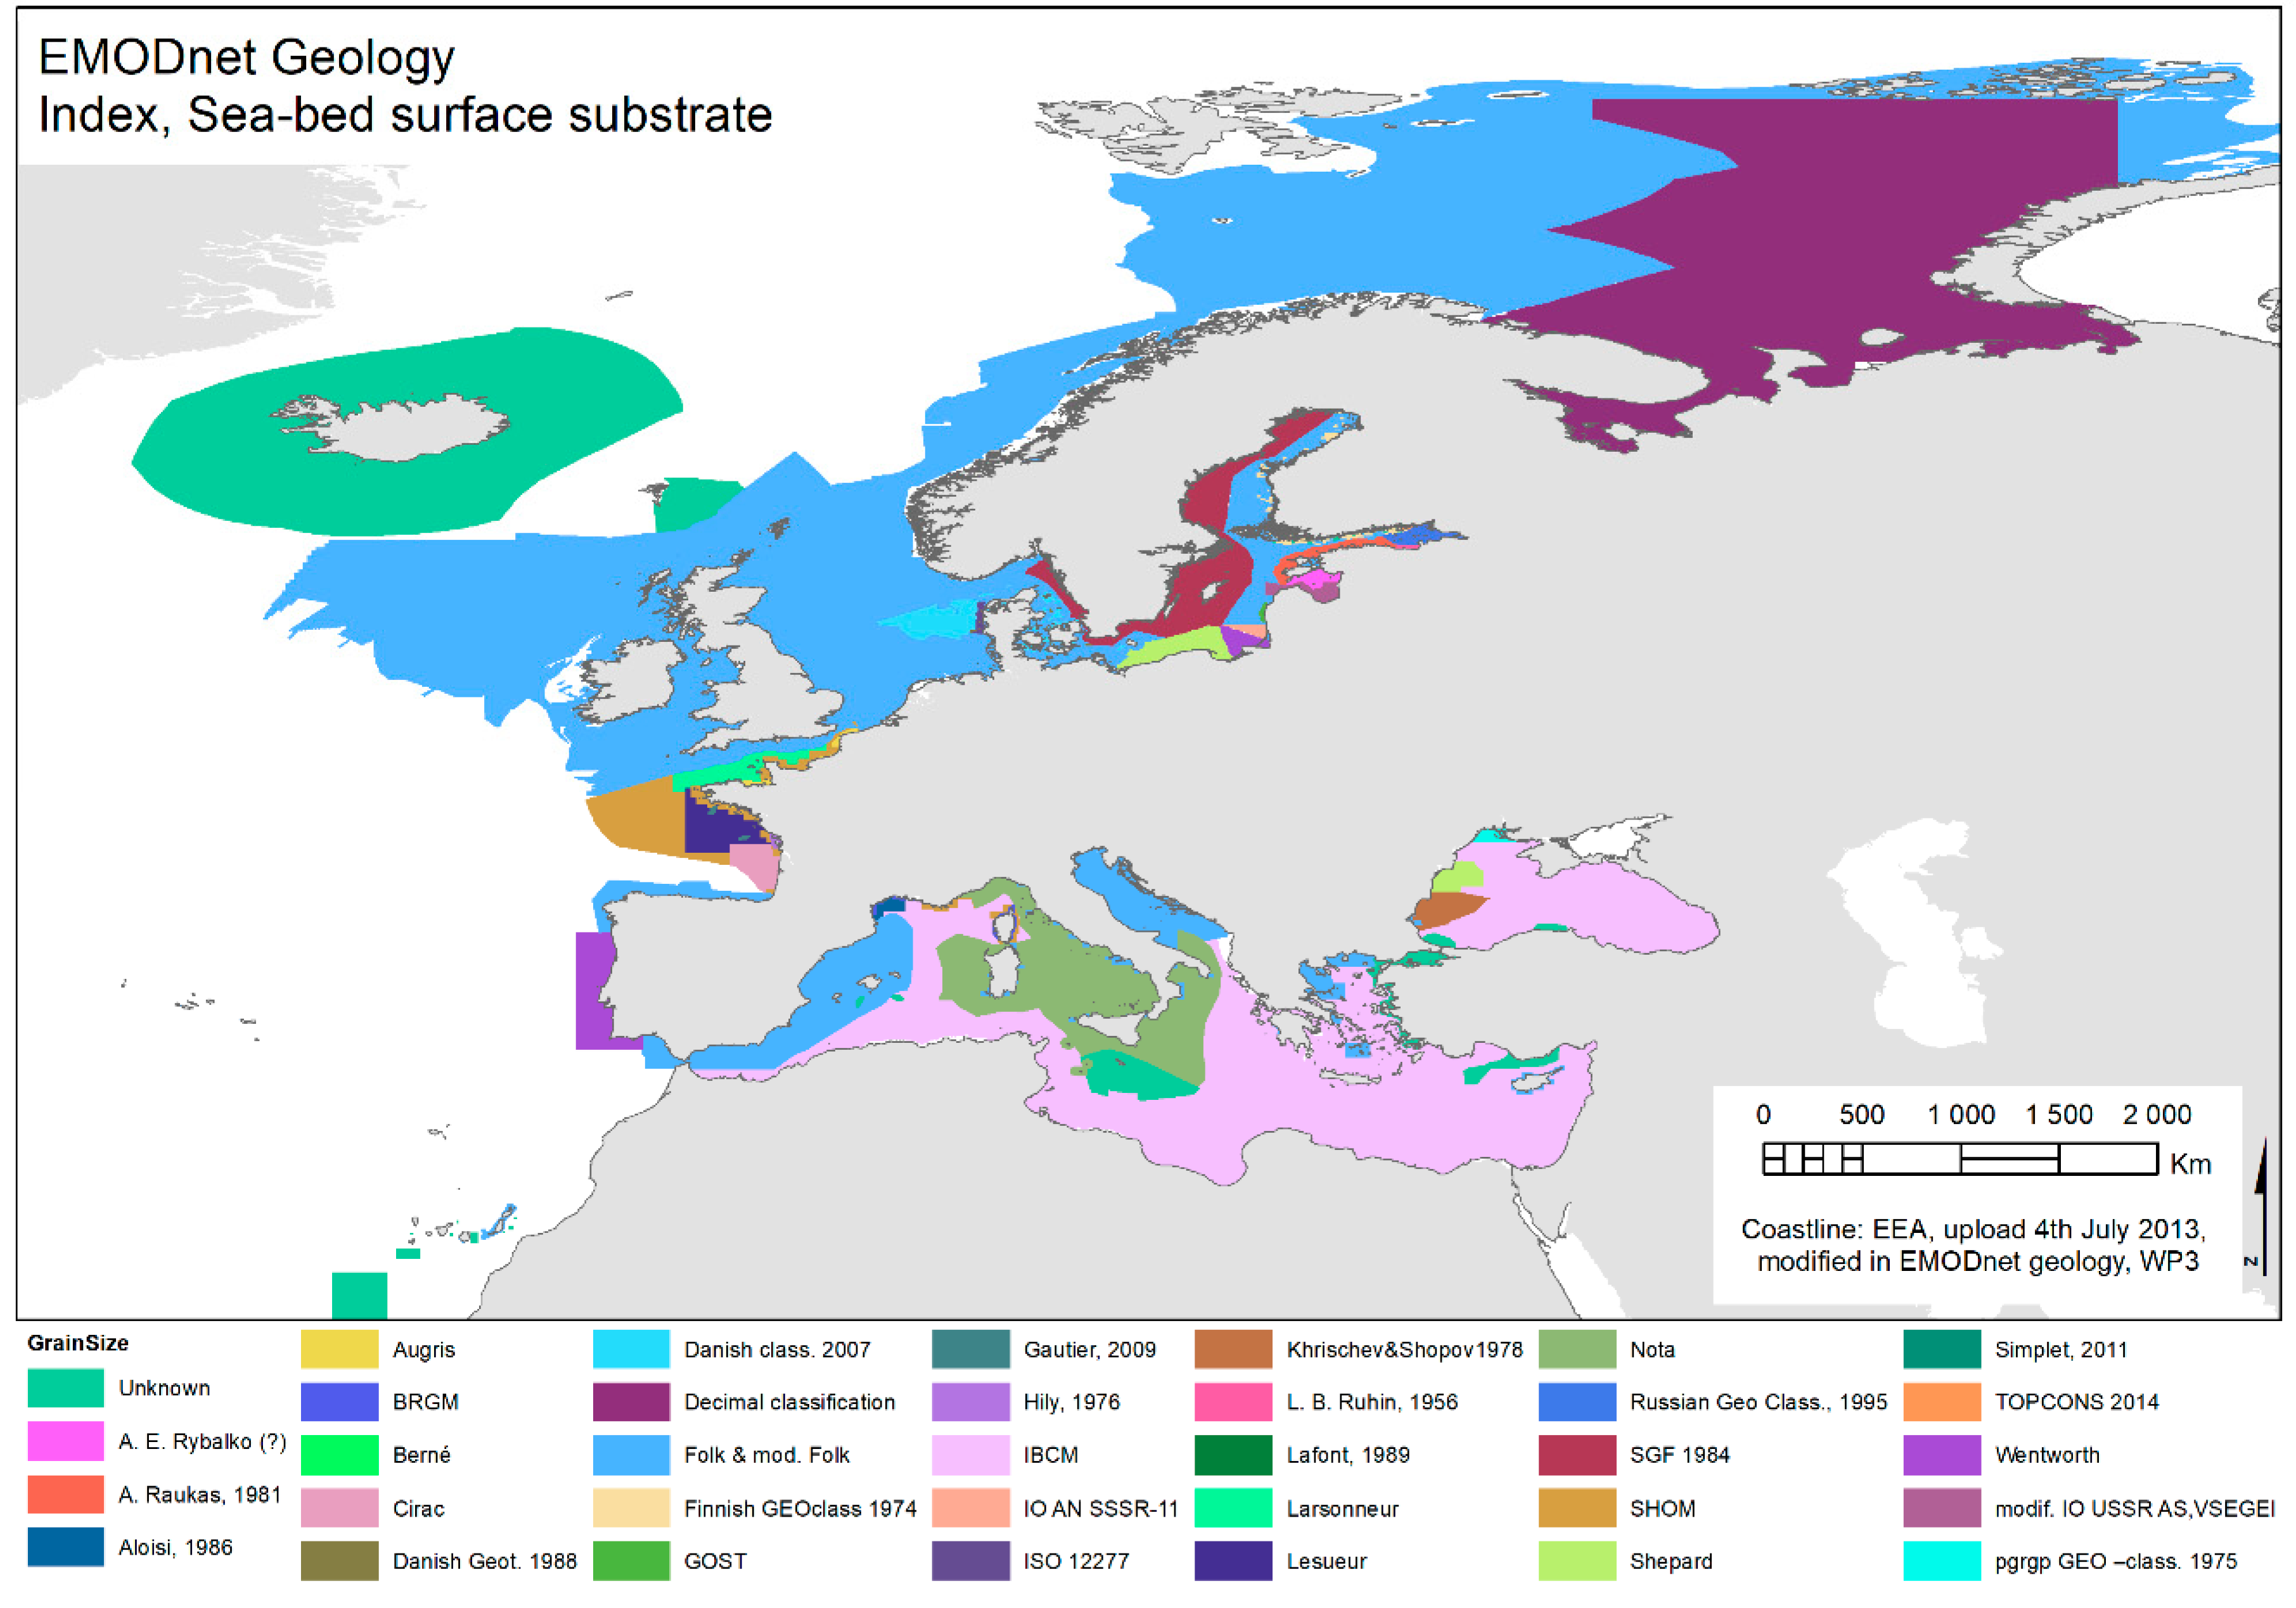
3.1. Index Data
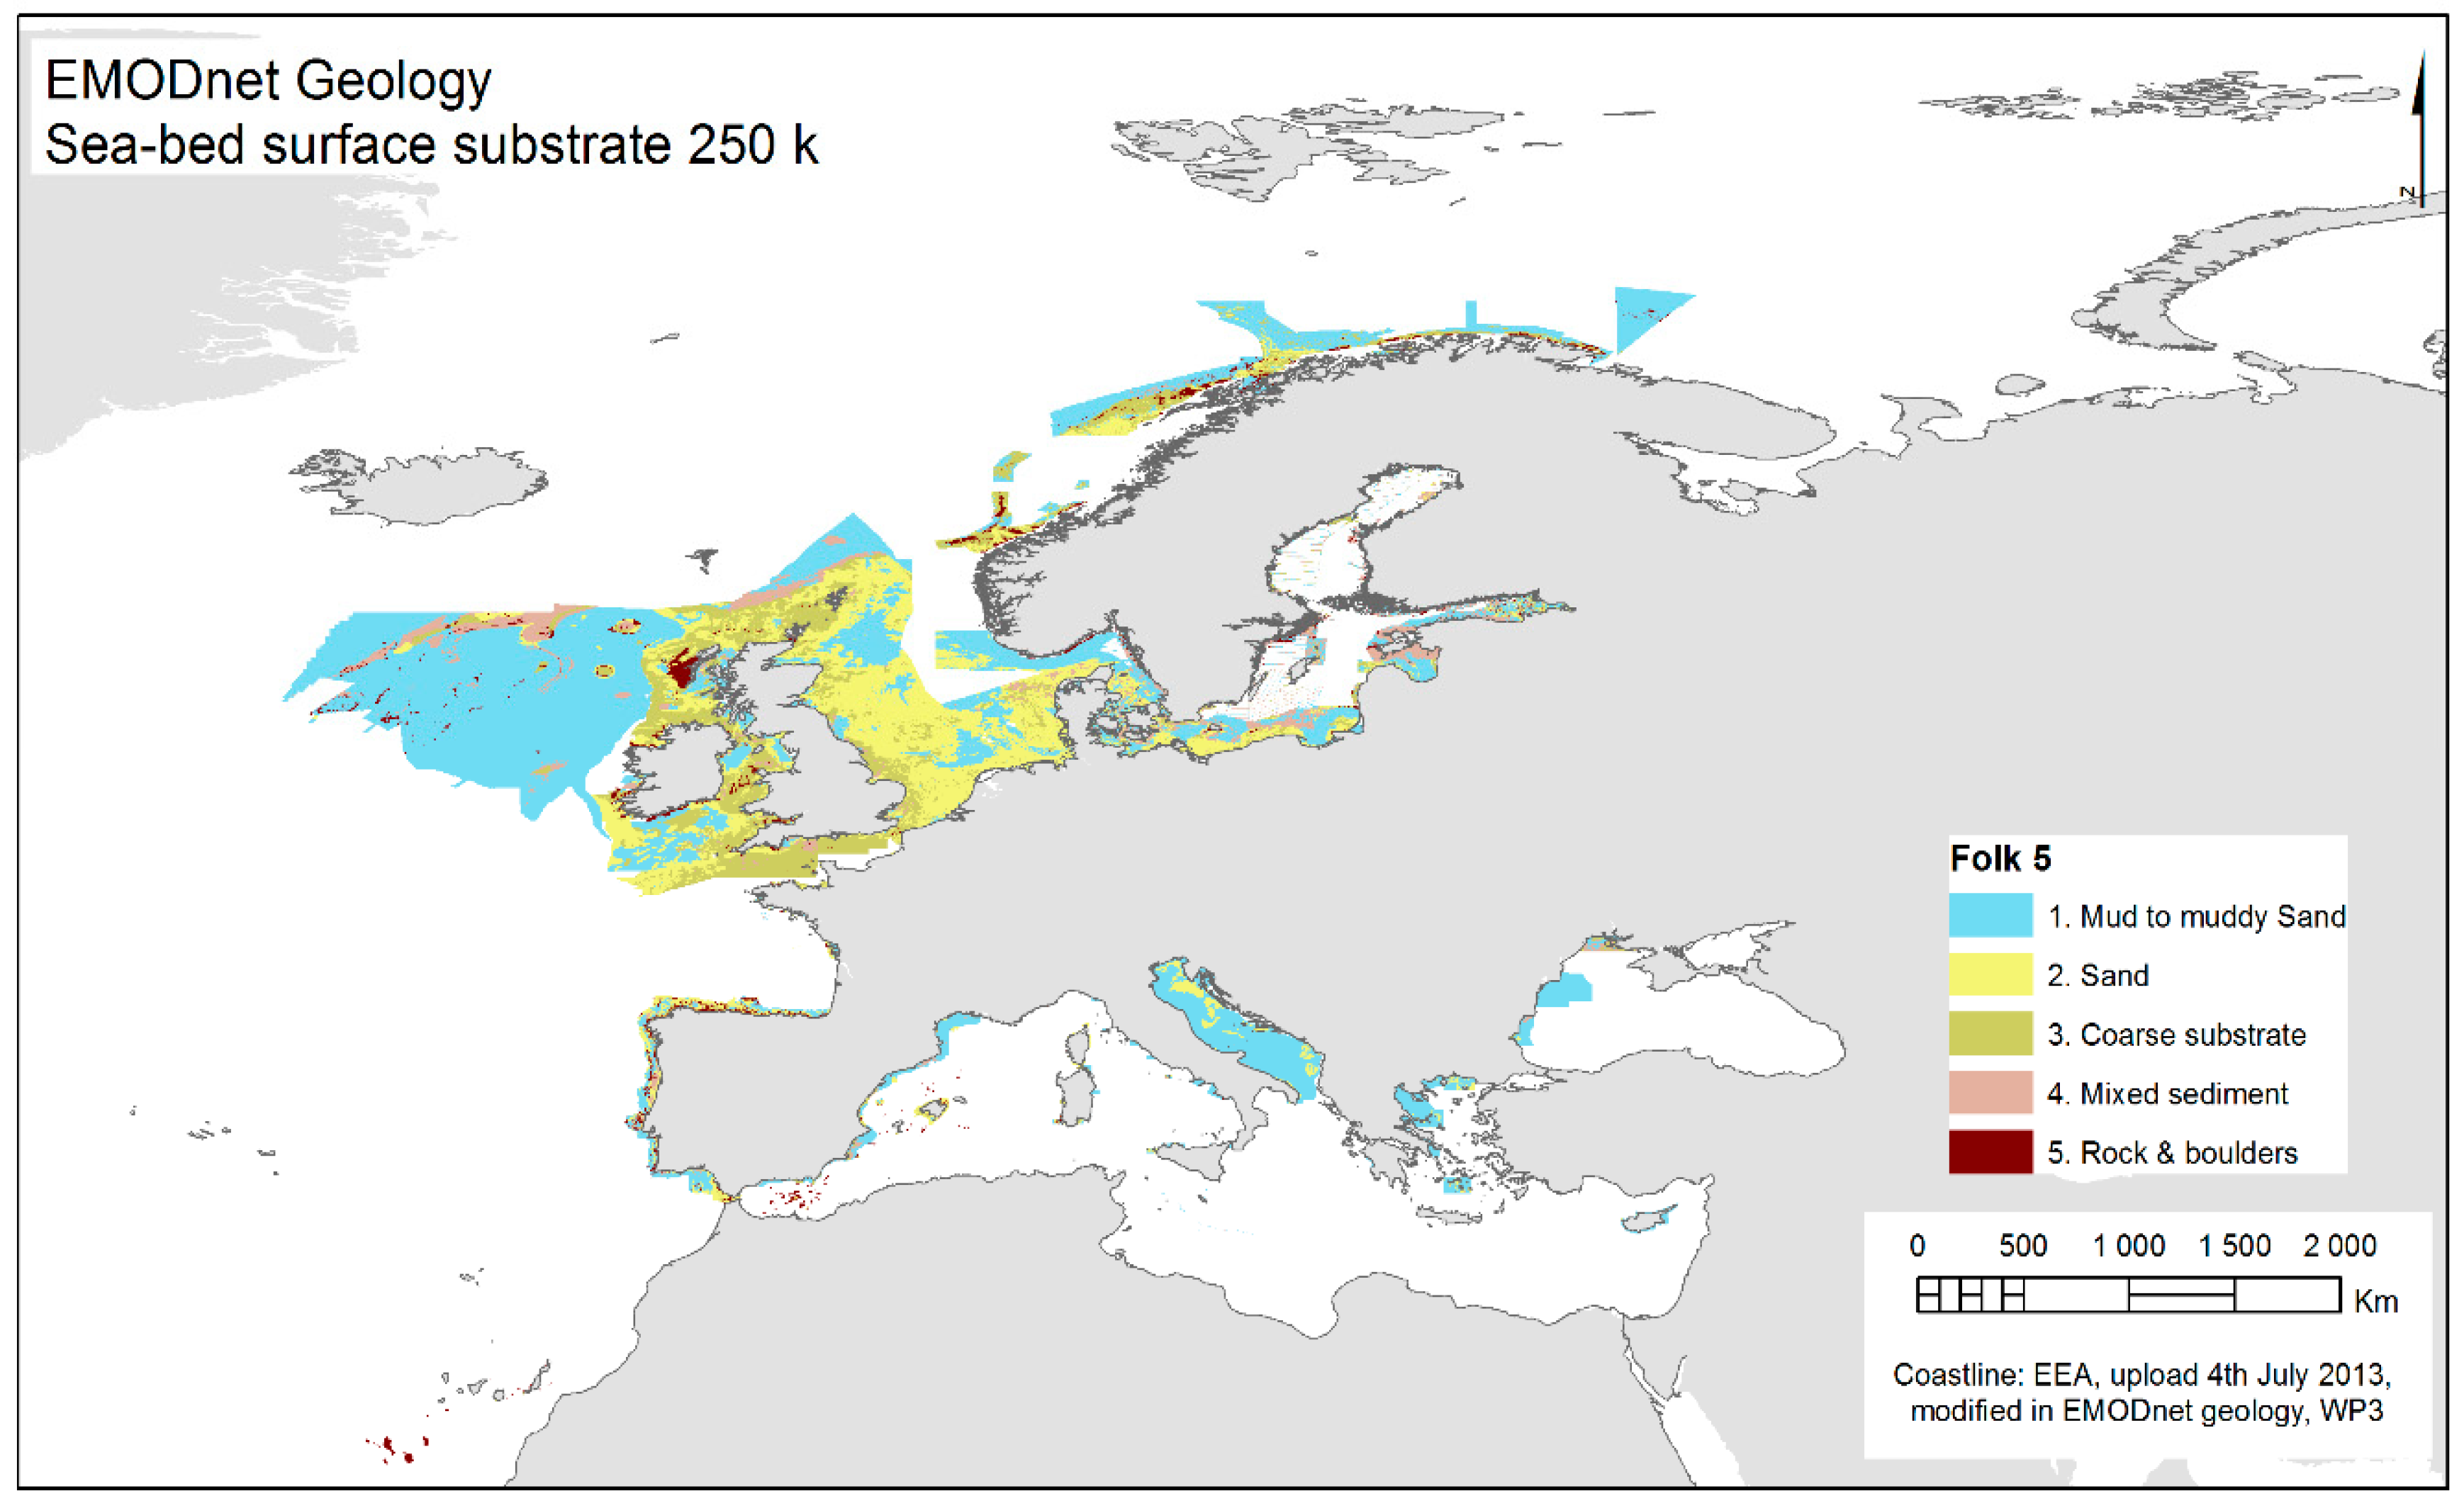
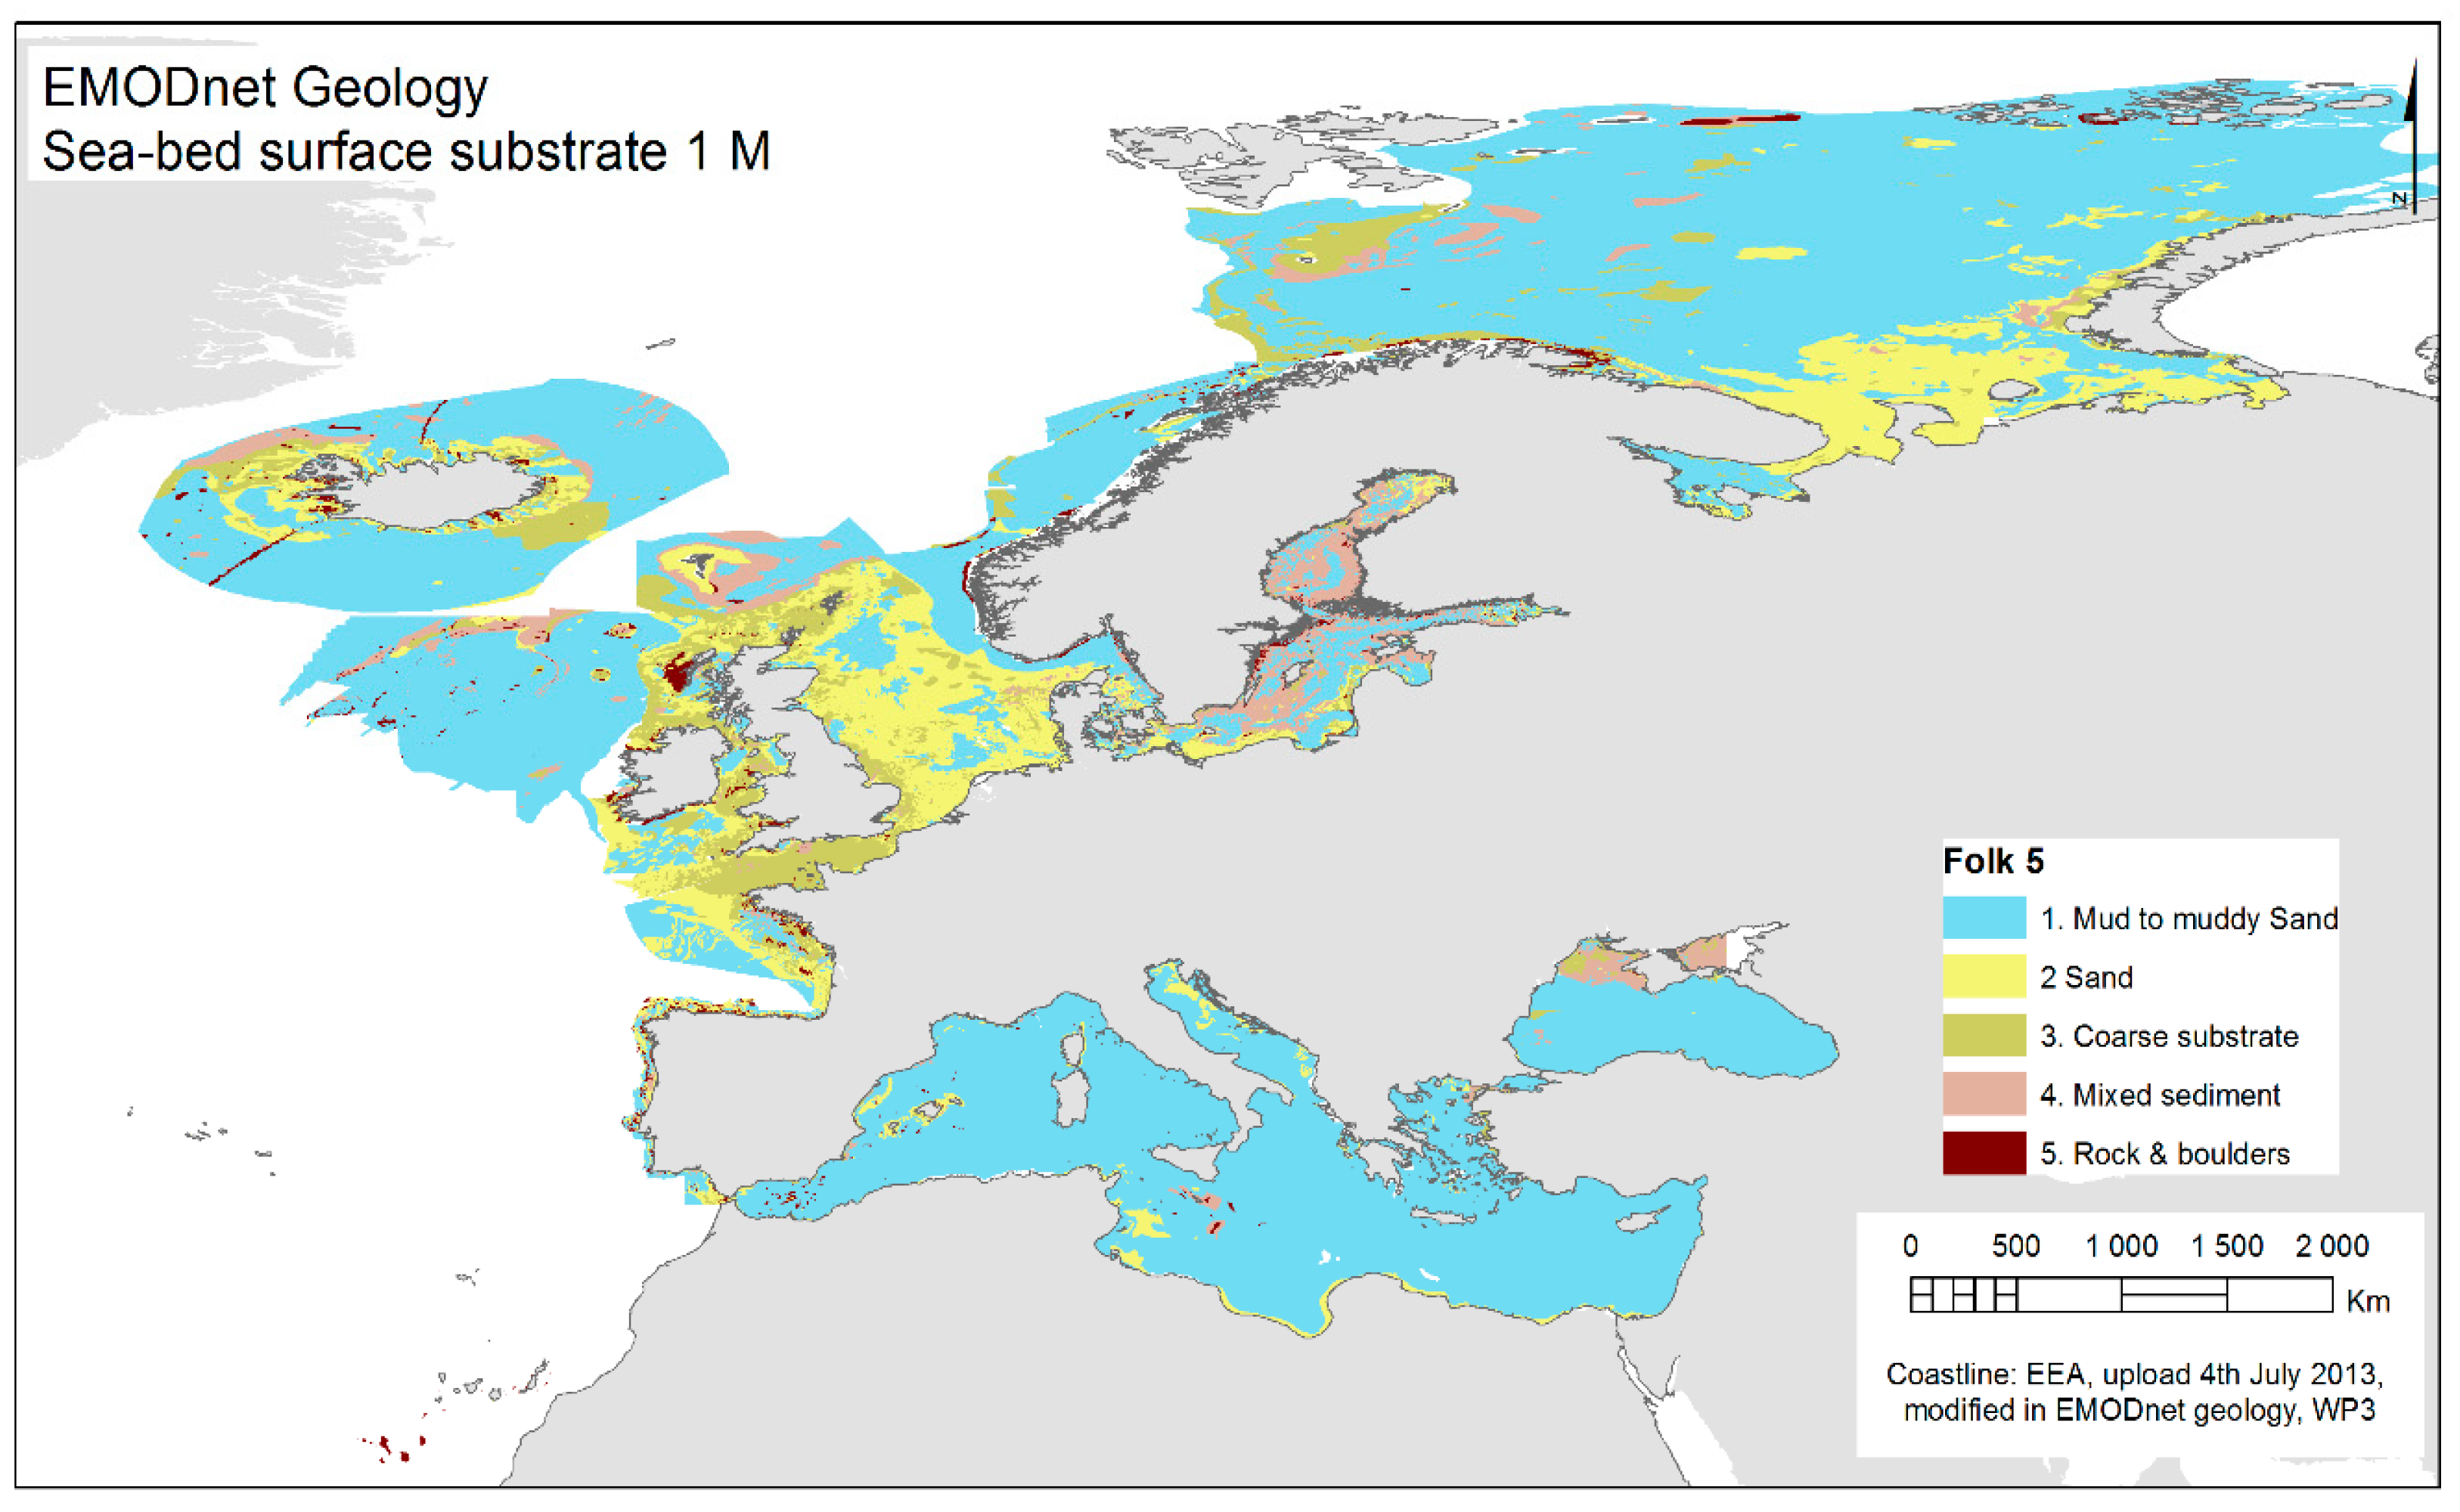
3.2. Seabed Substrate Data Products
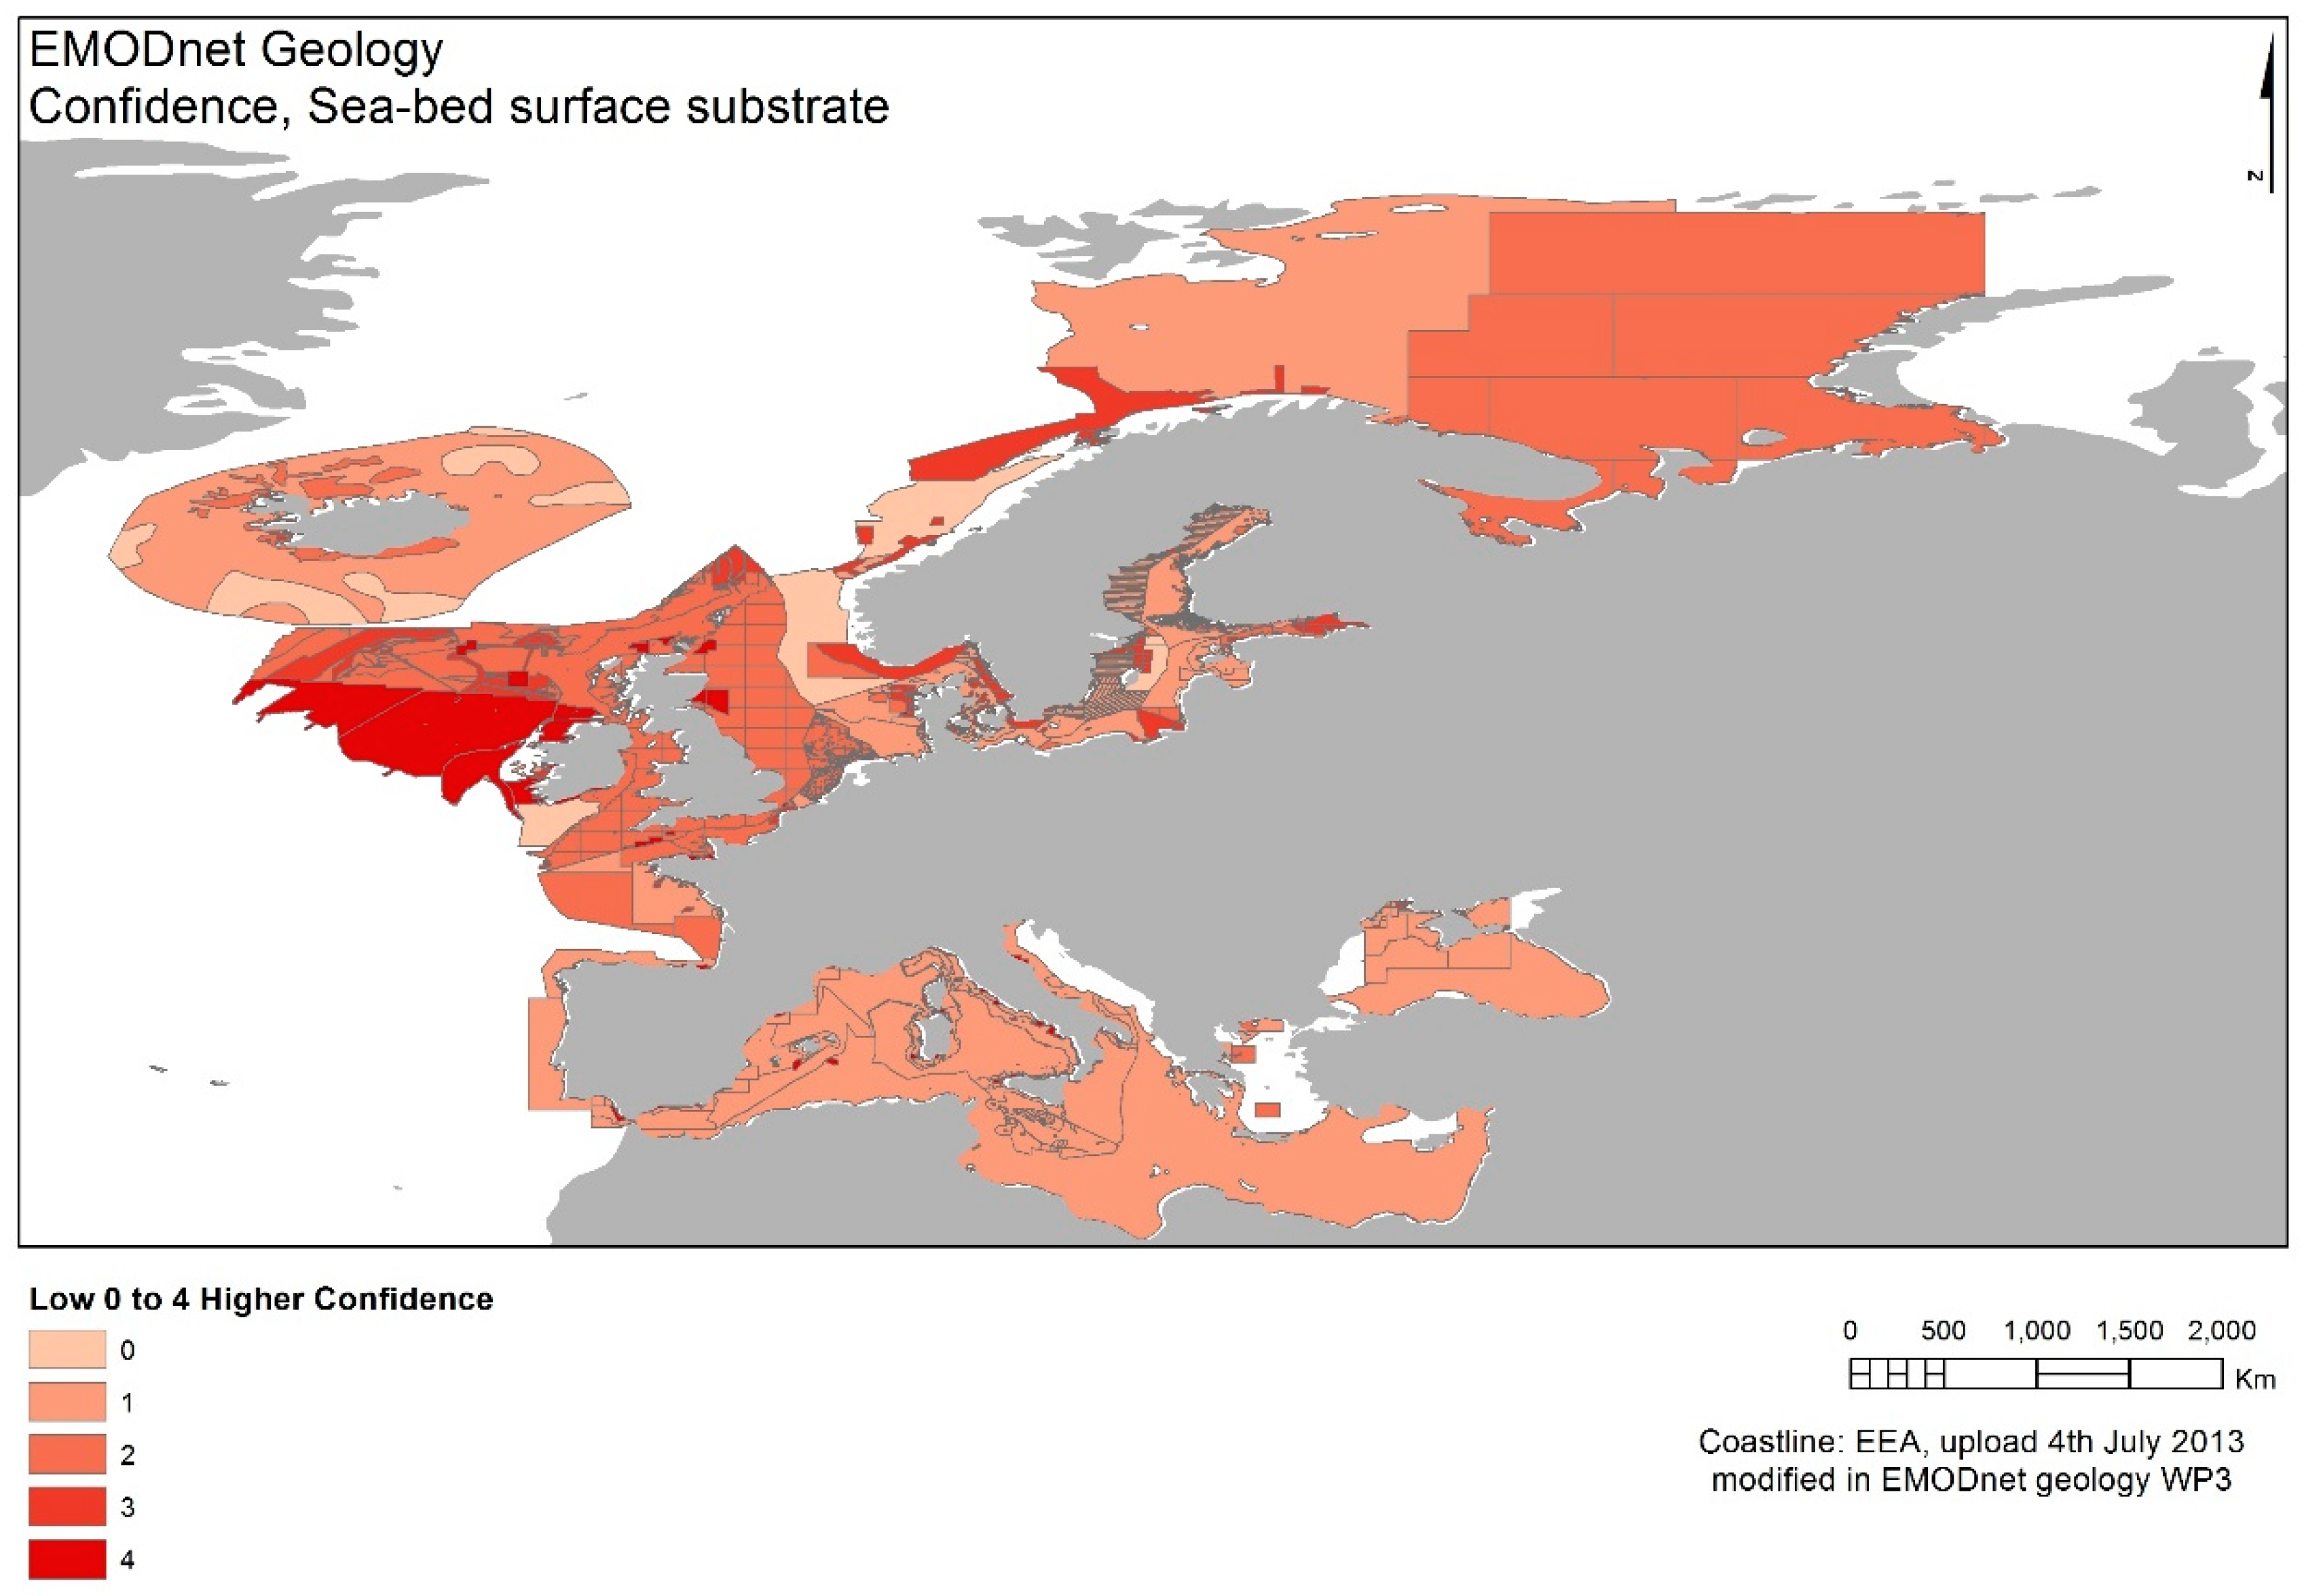
3.3. Confidence
4. Discussion
4.1. Harmonisation Process and Challenges
4.2. European Seabed Substrate Data Coverage and Gaps
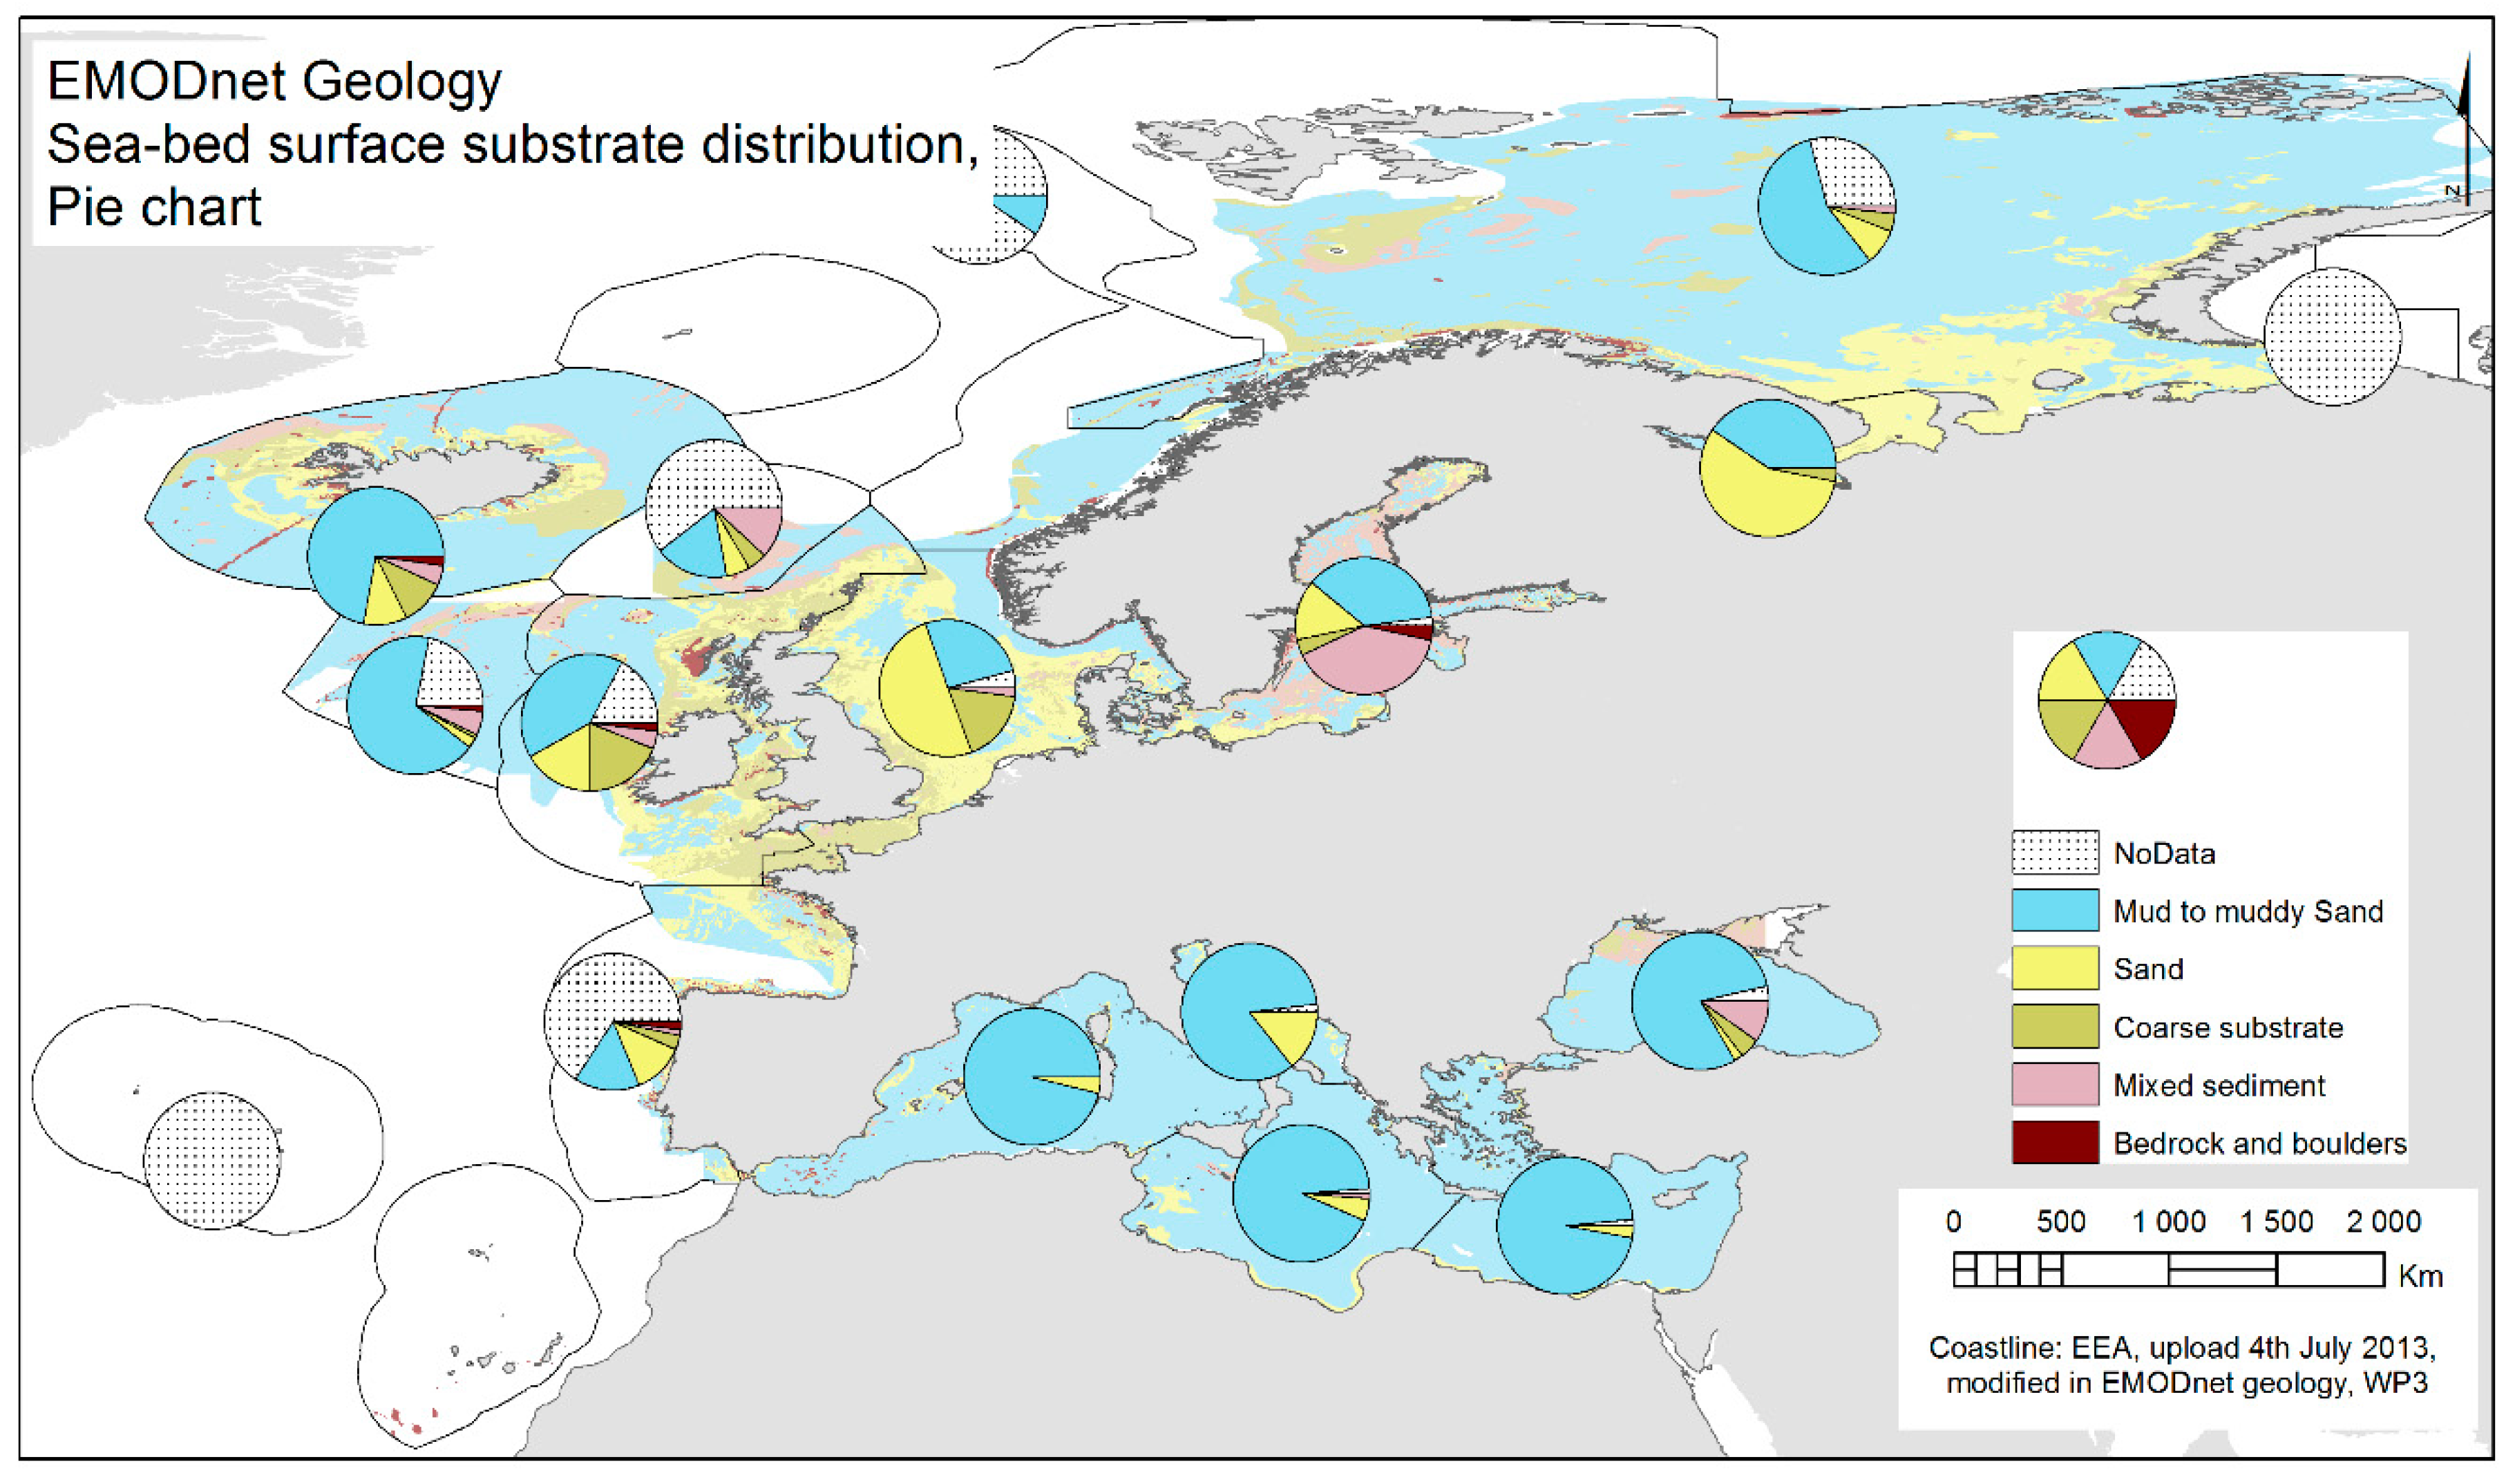
4.3. Visualisation of European Seabed, Differences and Similarities between Sea Basins
4.4. Applications
4.4.1. Seabed Substrates Characterising Seabed Ecosystems and Habitats
4.4.2. Seabed Substrates for Marine Spatial Planning and Research in the Gulf of Finland
4.5. Confidence
5. Conclusions
Supplementary Materials
Author Contributions
Funding
Acknowledgments
Conflicts of Interest
References
- Halpern, B.S.; Walbridge, S.; Selkoe, K.A.; Kappeli, C.V.; Micheli, F.; D’Argosa, C.; Bruno, J.F.; Casey, K.S.; Ebert, C.; Fox, H.E.; et al. A global map of human impact on marine ecosystems. Science 2008, 319, 948–952. [Google Scholar] [CrossRef]
- Halpern, B.S.; Frazier, M.; Potapenko, J.; Casey, K.S.; Koenig, K.; Longo, C.; Lowndes, J.S.; Rockwood, R.C.; Selig, E.R.; Selkoe, K.A.; et al. Spatial and temporal changes in cumulative human impacts on the world’s ocean. Nat. Commun. 2015, 6, 7615. [Google Scholar] [CrossRef] [Green Version]
- Lotze, H.K.; Lenihan, H.S.; Bourque, B.J.; Bradbury, R.H.; Cooke, R.G.; Kay, M.C.; Kidwell, S.M.; Kirby, M.X.; Peterson, C.H.; Jackson, J.B.C. Depletion, degradation, and recovery potential of estuaries and coastal seas. Science 2006, 312, 1806–1809. [Google Scholar] [CrossRef]
- Doney, S.C.; Ruckelshaus, M.; Duffy, J.E.; Barry, J.P.; Chan, F.; English, C.A.; Galindo, H.M.; Grebmeier, J.M.; Hollowed, A.B.; Knowlton, N.; et al. Climate Change Impacts on Marine Ecosystems. Annu. Rev. Mar. Sci. 2012, 4, 11–37. [Google Scholar] [CrossRef] [Green Version]
- European Commission. Communication from the Commission to the European Parliament, the Council, the European Economic and Social Committee and the Committee of the Regions. Innovation in the Blue Economy: Realising the Potential of our Seas and Oceans for Jobs and Growth. Brussels, 13.5.2014. COM 254. 2014. Available online: http://eur-lex.europa.eu/legal-content/EN/TXT/PDF/?uri=COM:2014:254:REV1&from=EN (accessed on 11 February 2017).
- Zaucha, J. Sea basin maritime spatial planning: A case study of the Baltic Sea region and Poland. Mar. Policy 2014, 50, 34–45. [Google Scholar] [CrossRef]
- European Parliament. Directive 2008/56/EC of the European Parliament and of the Council of 17 June 2008 Establishing a Framework for Community Action in the Field of Marine Environmental Policy (Marine Strategy Framework). 2008. Available online: http://eur-lex.europa.eu/legal-content/EN/TXT/?uri=CELEX%3A32008L0056 (accessed on 11 February 2017).
- European Parliament. Directive 2014/89/EC of the European Parliament and of the Council of 28 August 2014 Establishing a Framework for Maritime Spatial Planning (EU Maritime Spatial Planning Directive). 2014. Available online: https://eur-lex.europa.eu/legal-content/EN/TXT/HTML/?uri=CELEX:32014L0089&from=ES. (accessed on 22 February 2019).
- Davies, C.E.; Moss, D.; Hill, M.O. The EUNIS Habitat Classification Revised 2004; European Environment Agency: Dorset, UK, 2004. [Google Scholar]
- Puttonen, I.; Mattila, J.; Jonsson, P.; Karlsson, O.M.; Kohonen, T.; Kotilainen, A.; Lukkari, K.; Malmaeus, J.M.; Rydin, E. Distribution and estimated release of sediment phosphorus in the northern Baltic Sea archipelagos. Estuar. Coast. Shelf Sci. 2014, 145, 9–21. [Google Scholar] [CrossRef]
- Stevenson, A. The European marine observation and data network—geological data. Baltica 2012, 25, 87–90, Vilnius. ISSN 0067–3064. [Google Scholar] [CrossRef]
- European Environmental Agency. EEA Coastline for Analysis. 2013. Available online: http://www.eea.europa.eu/data-and-maps/data/eea-coastline-for-analysis (accessed on 12 February 2013).
- Foster-Smith, B.; Coltman, N.; Fitzpatrick, F. How good is my map? The MESH approach to confidence assessment. In MESH Guide: What Is Habitat Mapping? Foster-Smith, B., Connor, D., Davies, J., Eds.; Last Saved: 22/08/2007; Available online: http://www.emodnet-seabedhabitats.eu/default.aspx?page=1900. (accessed on 12 February 2017).
- Hughes Clarke, J.E.; Mayer, L.A.; Wells, D.E. Shallow-water imaging multibeam sonars: A new tool for investigating seafloor processes in the coastal zone and on the continental shelf. Mar. Geophys. Res. 1996, 18, 607–629. [Google Scholar] [CrossRef]
- Coggan, R.; Populus, J.; White, J.; Sheehan, K.; Fitzpatrick, F.; Piel, S. (Eds.) Review of Standards and Protocols for Seabed Habitat Mapping. MESH. 2007. Available online: http://www.emodnet-seabedhabitats.eu/default.aspx?page=1442 (accessed on 1 November 2016).
- Van Lancker, V.; van Heteren, S.; Leth, J.; Kupschus, S.; Coggan, R.; Mason, C.; Monteys, X.; Scott, G.; Hardy, D.; Glaves, H. Geo-Seas, Pan-European Infrastructure for Management of Marine and Ocean Geological and Geophysical Data. Deliverable 10.5: Standards for Seabed Habitat Mapping (Part A: Sediment). Standardisation and Harmonisation in Seabed Habitat Mapping: Role and Added Value of Geological Data and Information. Part A: Sediment Characterisation. 2013. Available online: http://www.geo-seas.eu/content/content.asp?menu=0380000_000000 (accessed on 14 January 2019).
- Jakobsson, M.; Gyllencreutz, R.; Mayer, L.A.; Dowdeswell, J.A.; Canals, M.; Todd, B.J.; Dowdeswell, E.K.; Hogan, K.A.; Larter, R.D. Mapping submarine glacial landforms using acoustic methods. Geol. Soc. Lond. Mem. 2016, 46, 17–40. [Google Scholar] [CrossRef] [Green Version]
- Folk, R.L. The distinction between grain size and mineral composition in sedimentary rock nomenclature. J. Geology 1954, 62, 344–359. [Google Scholar] [CrossRef]
- Al-Hamdani, Z.K.; Reker, J.; Leth, J.O.; Reijonen, A.; Kotilainen, A.T.; Dinesen, G.E. Development of marine landscape maps for the Baltic Sea and the Kattegat using geophysical and hydrographical para meters. Geolo. Surv. Den. Greenl. Bull. 2007, 13, 61–64. [Google Scholar]
- Coltman, N.; Golding, N.; Verling, E. Developing a broad-scale predictive EUNIS habitat map for the MESH study area. In MESH Guide to Marine Habitat Mapping; Joint Nature Conservation: Peterborough, UK, 2008. [Google Scholar]
- Greene, H.G.; Yoklavich, M.M.; Starr, R.M.; O’Connell, V.M.; Wakefield, W.W.; Sullivan, D.E. A classification scheme for deep seafloor habitats. Ocenaologica Acta 1999, 22, 663–678. [Google Scholar] [CrossRef]
- Greene, H.G.; Bizzarro, J.J.; O’Connell, V.M.; Brylinsky, C.K. Construction of digital potential marine benthic habitat maps using a coded classification scheme and its applications. Map. Seafloor Habitat Charact.: Geolo. Assoc. Can. Spec. P. 2007, 47, 141–155. [Google Scholar]
- Hyvönen, E.; Jakonen, M.; Kupila, J.; Lerrsi, J.; Leskinen, J.; Liwata, P.; Nevalainen, R.; Putkinen, S.; Virkki, H. Maaperän yleiskartan tulkinta- ja kartoitusprosessi. Maaperän yleiskartoitus –hankkeen sisäinen raportti (in Finnish); Väänänen, T., Ed.; Report; Geological Survey of Finland: Espoo, Finland, 2007; p. 17. [Google Scholar]
- VLIZ. IHO Sea Areas. 2014. Available online: http://www.marineregions.org/ (accessed on 27 March 2017).
- Lillis, H. A Three-Step Confidence Assessment Framework for Classified Seabed Maps; JNCC Report No. 591; JNCC: Peterborough, UK, 2016. [Google Scholar]
- Garlan, T.; Gabelotaud, I.; Lucas, S.; Marchès, E. A World Map of Seabed Sediment Based on 50 Years of Knowledge. In Proceedings of the 20th International Research Conference, New York, NY, USA, 3–4 June 2018. 20 (6) Part, I. [Google Scholar]
- Stevenson, A.; Kotilainen, A.; Kaskela, A.; Alanen, U.; Asch, K.; Schubert, C.; van Heteren, S.; van de Ven, T.; Thorsnes, T.; Verbruggen, K.; et al. EMODnet Geology Project Draft Final Report. Preparatory Actions for a European Marine Observation and Data Network; Lot No 2–Geological data. 40 pages; EMODnet Geology: Edinburgh, UK, 2011. [Google Scholar]
- Kaskela, A.M.; Kotilainen, A.T. Seabed geodiversity in a glaciated shelf area, the Baltic Sea. Geomorphology 2017, 295, 419–435. [Google Scholar] [CrossRef]
- Kotilainen, A.T.; Kaskela, A.M. Comparison of airborne LiDAR and shipboard acoustic data in complex shallow water environments: Filling in the white ribbon zone. Mar. Geol. 2017, 385, 250–259. [Google Scholar] [CrossRef]
- Svendsen, J.I.; Alexanderson, H.; Astakhov, V.I.; Demidov, I.; Dowdeswell, J.A.; Funder, S.; Gataullin, V.; Henriksen, M.; Hjort, C.; Houmark-Nielsen, M.; et al. Late quaternary ice sheet history of northern Eurasia. In: Quaternary Environments of the Eurasian North (QUEEN). Quat. Sci. Rev. 2004, 23, 1229–1271. [Google Scholar] [CrossRef]
- Stroeven, A.P.; Hättestrand, C.; Kleman, J.; Heyman, J.; Fabel, D.; Fredin, O.; Goodfellow, B.W.; Harbor, J.M.; Jansen, J.D.; Olsen, L.; et al. Deglaciation of Fennoscandia. Quat. Sci. Rev. 2016, 147, 91–121. [Google Scholar] [CrossRef] [Green Version]
- Inger, R.; Attrill, M.J.; Bearhop, S.; Broderick, A.C.; James Grecian, W.; Hodgson, D.J.; Mills, C.; Sheehan, E.; Votier, S.C.; Witt, M.J.; et al. Marine renewable energy: Potential benefits to biodiversity? An urgent call for research. J. Appl. Ecol. 2009, 46, 1145–1153. [Google Scholar] [CrossRef]
- Punt, M.J.; Groeneveld, R.A.; van Ierland, E.C.; Stel, J.H. Spatial planning of offshore wind farms: A windfall to marine environmental protection? Ecol. Econ. 2009, 69, 93–103. [Google Scholar] [CrossRef]
- Handley, S.J.; Willis, T.J.; Cole, R.G.; Bradley, A.; Cairney, D.J.; Brown, S.N.; Carter, M.E. The importance of benchmarking habitat structure and composition for understanding the extent of fishing impacts in soft sediment ecosystems. J. Sea Res. 2014, 86, 58–68. [Google Scholar] [CrossRef] [Green Version]
- Uścinowicz, S.; Jegliński, W.; Miotk-Szpiganowicz, G.; Nowak, J.; Pączek, U.; Przezdziecki, P.; Szefler, K.; Poręba, G. Impact of sand extraction from the bottom of the southern Baltic Sea on the relief and sediments of the seabed. Oceanologia 2014, 56, 857–880. [Google Scholar] [CrossRef] [Green Version]
- Connor, D.W.; Allen, J.H.; Golding, N.; Lieberknecht, L.M.; Northern, K.O.; Reker, J.B. The National Marine Habitat Classification for Britain and Ireland, Version 03.02 Copyright JNCC, Peterborough ISBN 1 86107 546 4. 2003. Available online: http://www.jncc.gov.uk/MarineHabitatClassification (accessed on 25 November 2012).
- Snickars, M.; Gullström, M.; Sundblad, G.; Bergström, U.; Downie, A.-L.; Lindegarth, M.; Mattila, J. Species–environment relationships and potential for distribution modelling in coastal waters. J. Sea Res. 2014, 85, 116–125. [Google Scholar] [CrossRef]
- Beaman, R.J.; Harris, P.T. Geophysical variables as predictors of megabenthos assemblages from the northern Great Barrier Reef, Australia. Mapp. Seafloor Habitat Charact.: Geol. Assoc. Can. Spe. P. 2007, 47, 241–257. [Google Scholar]
- Last, P.R.; Lyne, V.D.; Williams, A.; Davies, C.R.; Butler, A.J.; Yearsley, G.K. A Hierarchical framework for classifying seabed biodiversity with application to planning and managing Australia’s marine biological resources. Biol. Conserv. 2010, 143, 1675–1686. [Google Scholar] [CrossRef]
- Zajac, R.N.; Lewis, R.S.; Poppe, L.J.; Twichell, D.C.; Vozarik, J.; DiGiacomo-Cohen, M.L. Responses of infaunal populations to benthoscape structure and the potential importance of transition zones. Limnol. Oceanogr. 2003, 48, 829–842. [Google Scholar] [CrossRef] [Green Version]
- Post, A.L. The application of physical surrogates to predict the distribution of marine benthic organisms. Ocean Coast. Manag. 2008, 51, 161–179. [Google Scholar]
- Williams, A.; Althaus, F.; Dunstan, P.K.; Poore, G.C.B.; Bax, N.J.; Kloser, R.J.; McEnnulty, F.J. Scales of habitat heterogeneity and megabenthos biodiversity on an extensive Australian continental margin (100–1100 m depths). Mar. Ecol. 2010, 31, 222–236. [Google Scholar] [CrossRef]
- Buhl-Mortensen, L.; Buhl Mortensen, P.; Dolan, M.F.J.; Dannheim, J.; Bellec, V.; Holte, B. Habitat complexity and bottom fauna composition at different scales on the continental shelf and slope of Northern Norway. Hydrobiologia 2012, 685, 191–219. [Google Scholar] [CrossRef]
- Zajac, R.N.; Vozarik, J.M.; Gibbons, B.R. Spatial and Temporal Patterns in Macrofaunal Diversity Components Relative to Sea Floor Landscape Structure. PLoS ONE 2013, 8, e65823. [Google Scholar] [CrossRef]
- Rousi, H.; Peltonen, H.; Mattila, J.; Bäck, S.; Bonsdorff, E. Impacts of physical environmental characteristics on the distribution of benthic fauna in the Northern Baltic Sea. Boreal Env. Res. 2011, 16, 521–533. [Google Scholar]
- Weigel, B.; Andersson, H.C.; Meier, H.E.M.; Blenckner, T.; Snickars, M.; Bonsdorff, E. Long-term progression and drivers of coastal zoobenthos in a changing system. Mar. Ecol. Prog. Ser. 2015, 528, 141–159. [Google Scholar] [CrossRef]
- Post, A.L.; Beaman, R.J.; O’Brien, P.E.; Eléaume, M.; Riddle, M.J. Community structure and benthic habitats across the George V. Shelf, East Antarctica: Trends through space and time. Deep–Sea Res. II 2011, 58, 105–118. [Google Scholar] [CrossRef]
- Laine, A.O. Distribution of soft–bottom macrofauna in the deep open Baltic Sea in relation to environmental variability. Estuar. Coast. Shelf Sci. 2003, 57, 87–97. [Google Scholar] [CrossRef]
- Laine, A.O.; Andersin, A.-B.; Leiniö, S.; Zuur, A.-F. Stratification-induced hypoxia as a structuring factor of macrozoobenthos in the open Gulf of Finland (Baltic Sea). J. Sea Res. 2007, 57, 65–77. [Google Scholar] [CrossRef]
- Kaskela, A.M.; Rousi, H.; Ronkainen, M.; Orlova, M.; Babin, A.; Gogoberidze, G.; Kostamo, K.; Kotilainen, A.T.; Neevin, I.; Ryabchuk, D.; et al. Linkages between benthic assemblages and physical environmental factors: The role of geodiversity in Eastern Gulf of Finland ecosystems. Cont. Shelf Res. 2017, 142, 1–13. [Google Scholar] [CrossRef]
- Wennberg, S.; Lindblad, C.; Albertsson, J.; Bergström, U.; Isæus, M.; Kilnäs, M.; Mattisson, A.; Sandman, A. Sammanställning och Analys av Kustnära Undervattenmiljö (SAKU); Stockholm, Naturvårdsverket Rapport nr. 5591; Naturvårdsverket: Stockholm, Sweden, 2006; p. 99. [Google Scholar]
- Kymenlaakson Liitto. Kymenlaakson maakuntakaava. Kauppa- ja merialue. Kaavaselostus. (In Finnish). 2014. Available online: http://www.kymenlaakso.fi/images/Liitteet/MAAKUNTAKAAVA/Maakuntakaavakartat_ja_selosteet/Kauppa_ja_meri_kaavaselostus.pdf (accessed on 27 March 2017).
- Kaskela, A.; Kotilainen, A.; Korneev, O.; Ryabchuk, D.; Rybalko, A.; Suuroja, S.; Vallius, H. Geodiversity. In The Gulf of Finland Assessment; Raateoja, M., Setälä, O., Eds.; Reports of the Finnish Environment Institute; Finnish Environment Institute: Helsinki, Finland, 2016; pp. 62–64. [Google Scholar]
- Lecours, V.; Dolan, M.F.; Micallef, A.; Lucieer, V. A review of marine geomorphometry, the quantitative study of the seafloor. Hydrol. Earth Syst. Sci. 2016, 20, 3207–3244. [Google Scholar] [CrossRef] [Green Version]
- Montreale Gavazzi, G.; Roche, M.; Degrendele, K.; Lurton, X.; Terseleer, N.; Baeye, M.; Francken, F.; van Lancker, V. Insights into the short-term tidal variability of multibeam backscatter from field experiments on different seafloor types. Geosciences 2019, 1, 34. [Google Scholar] [CrossRef]


| Field | Content |
|---|---|
| FID | Feature Identification. An internally generated identification number for each polygon. |
| Shape | Polygon. Internally generated text. |
| Code | Two-letter country code and three digits (numbers) that identify each data patch. |
| Name | Name of the original map. |
| DataHolder | Abbreviation of the organization/institute. |
| Contact | E-mail address of the contact person. |
| Scale | Scale of the original data/map. |
| GrainSize | Original grain size classification system (e.g., Folk, Wentworth, MNCR). |
| Ref. | Reference to the map. |
| Comments | Comments or other information regarding the map. |
| Field | Comment/Advise |
|---|---|
| FID | Feature Identification. An internally generated identification number for each polygon. |
| Shape | Polygon. Internally generated text. |
| Code | Two-letter country code and three digits (numbers) that identify each data patch. The code should be the same as the code in the INDEX map. |
| Grain_Size | Original grain size classification system (e.g., Folk, Wentworth, MNCR). |
| (re)Classifi | (Re)Classification. If the surface substrates have been reclassified, were they reclassified on the basis of sample data or by expert judgement? |
| Method | Information if the substrate map is interpolated automatically from the surface samples or if the existing substrate polygons have been reclassified? |
| Sample_n | Sample number. Approximate the minimum number of samples used per original substrate category. |
| O_substrat | Original substrate category. Name of the original substrate category. |
| Relation | Relationship code. Code describes the relationship between two classification schemes (original versus reclassified) (adapted from [20]). |
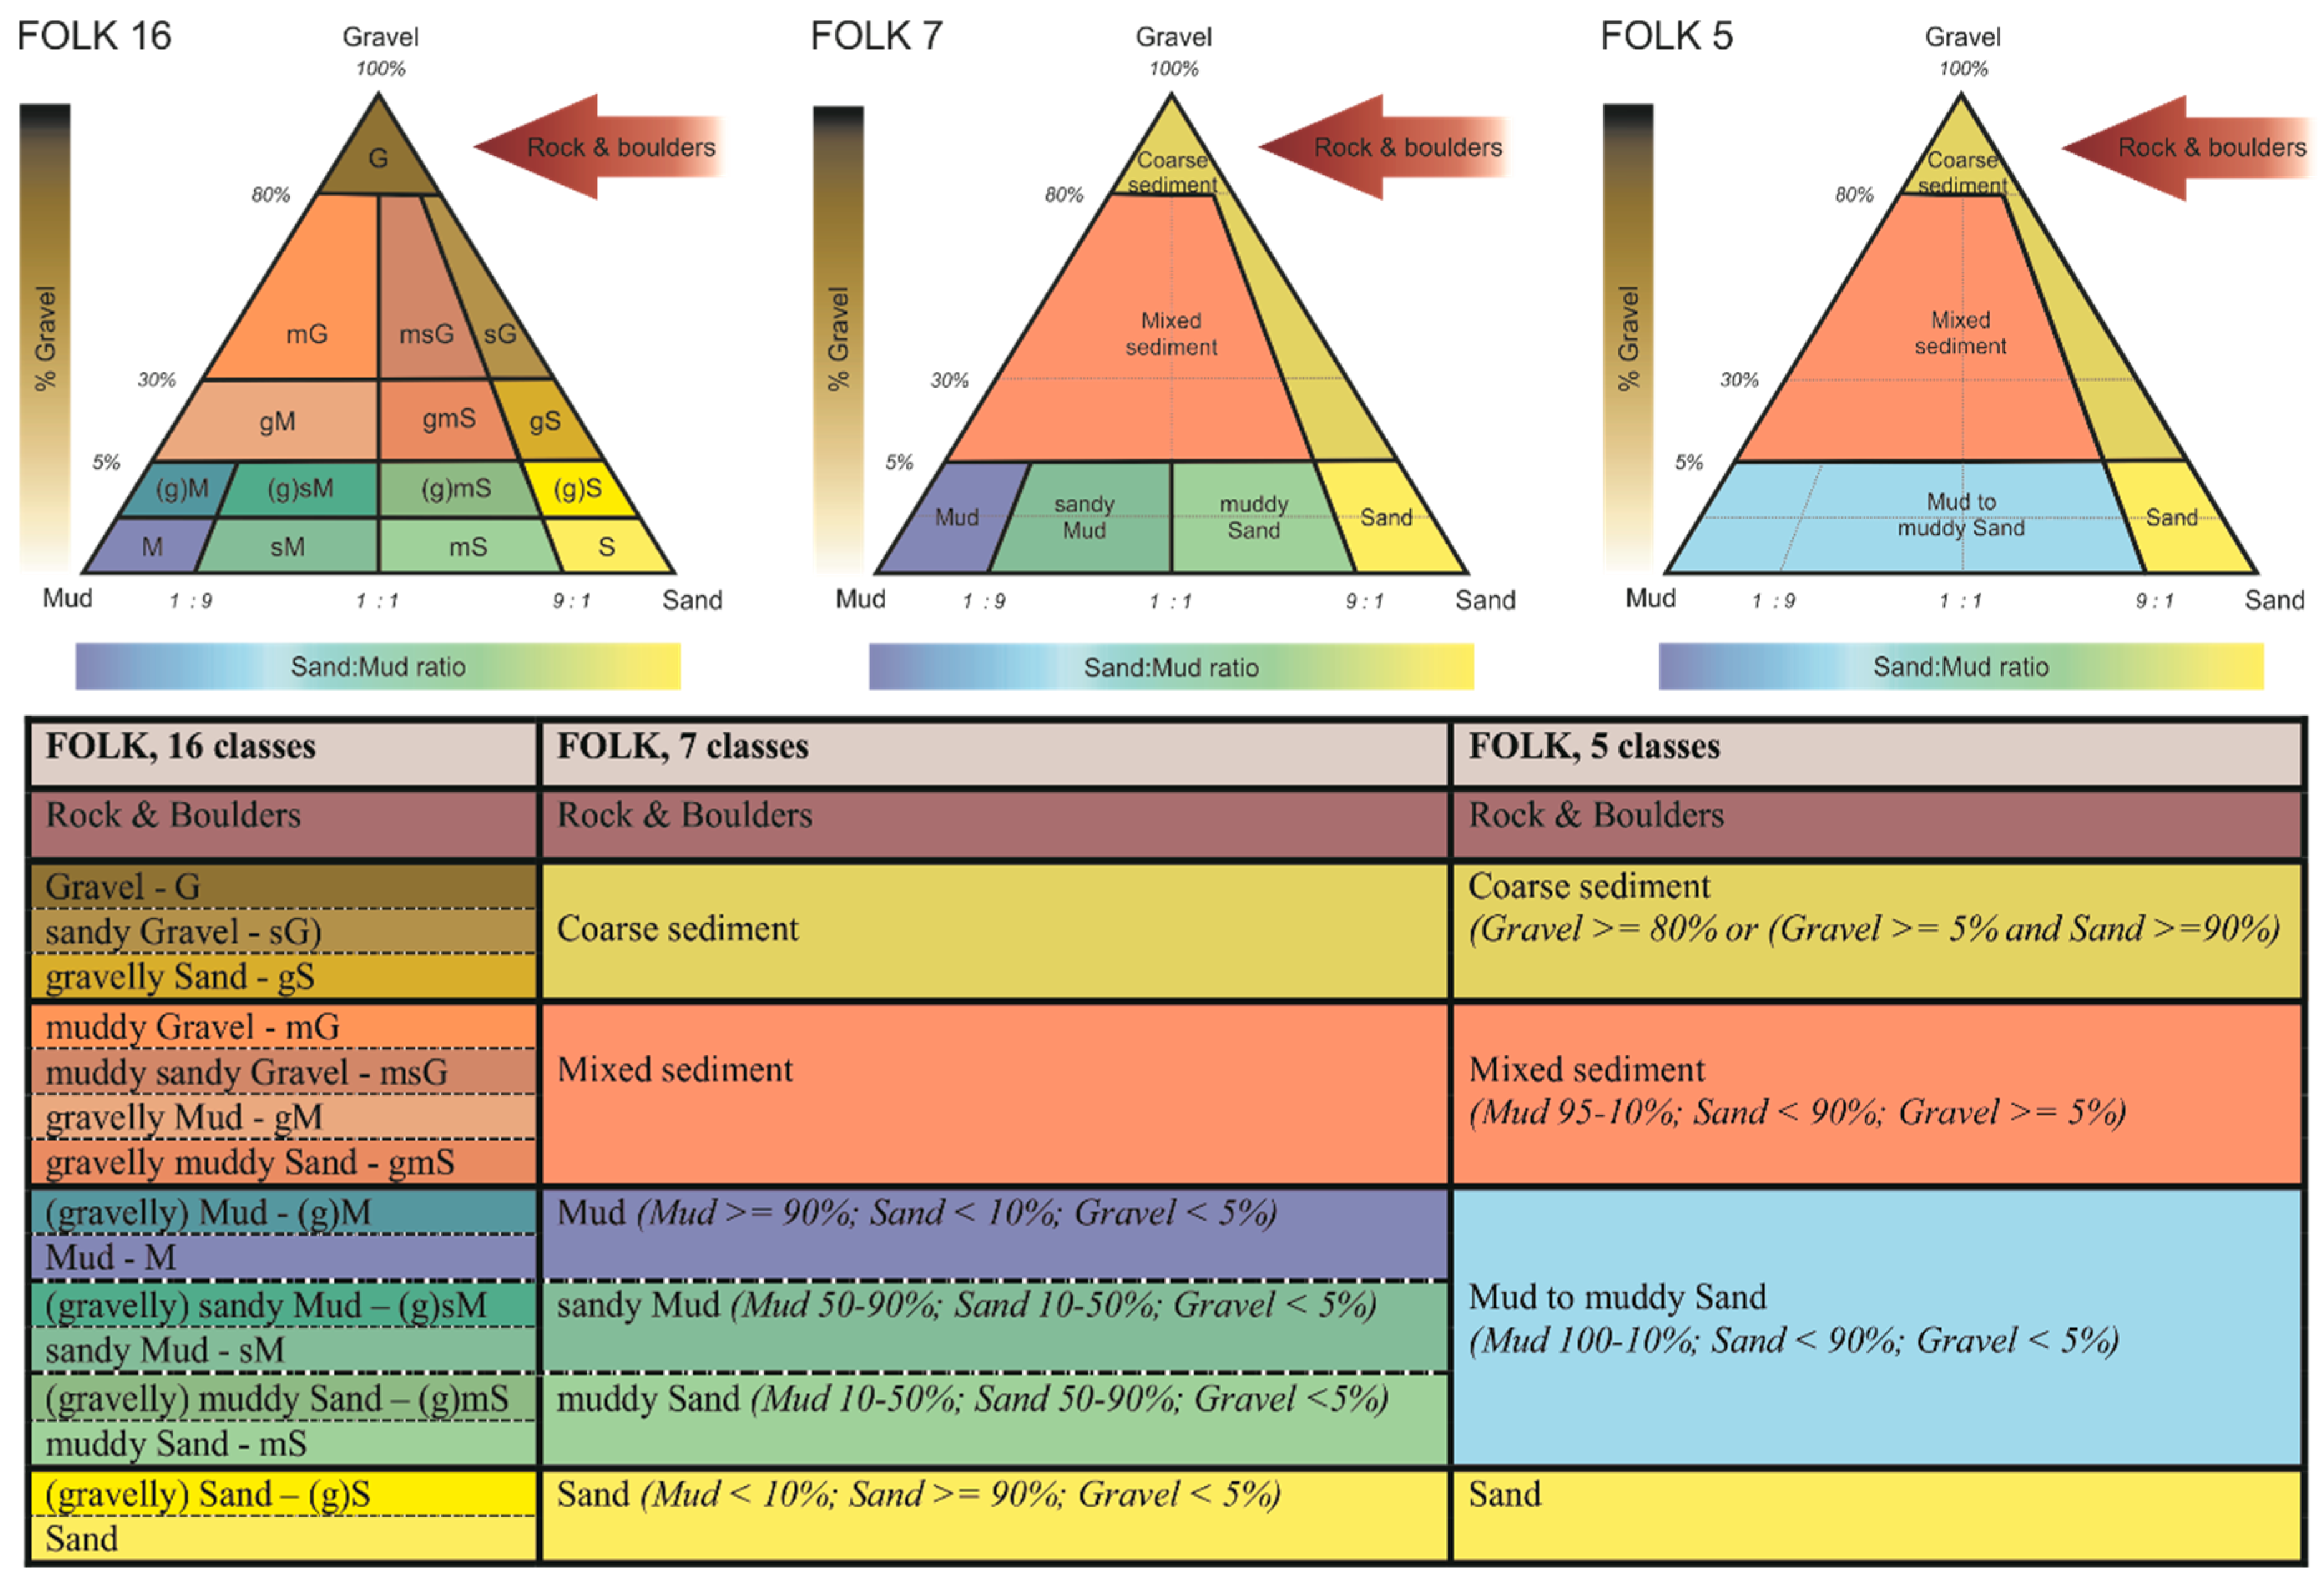
| FOLK_16cl | Substrate material based on the Folk classification with 16 classes. |
| FOLK_7cl | Substrate material based on the Folk classification with 7 classes. |
| FOLK_5cl | Substrate material based on the Folk classification with 5 classes. |
| Comments | Free comments. |
| References | References. |
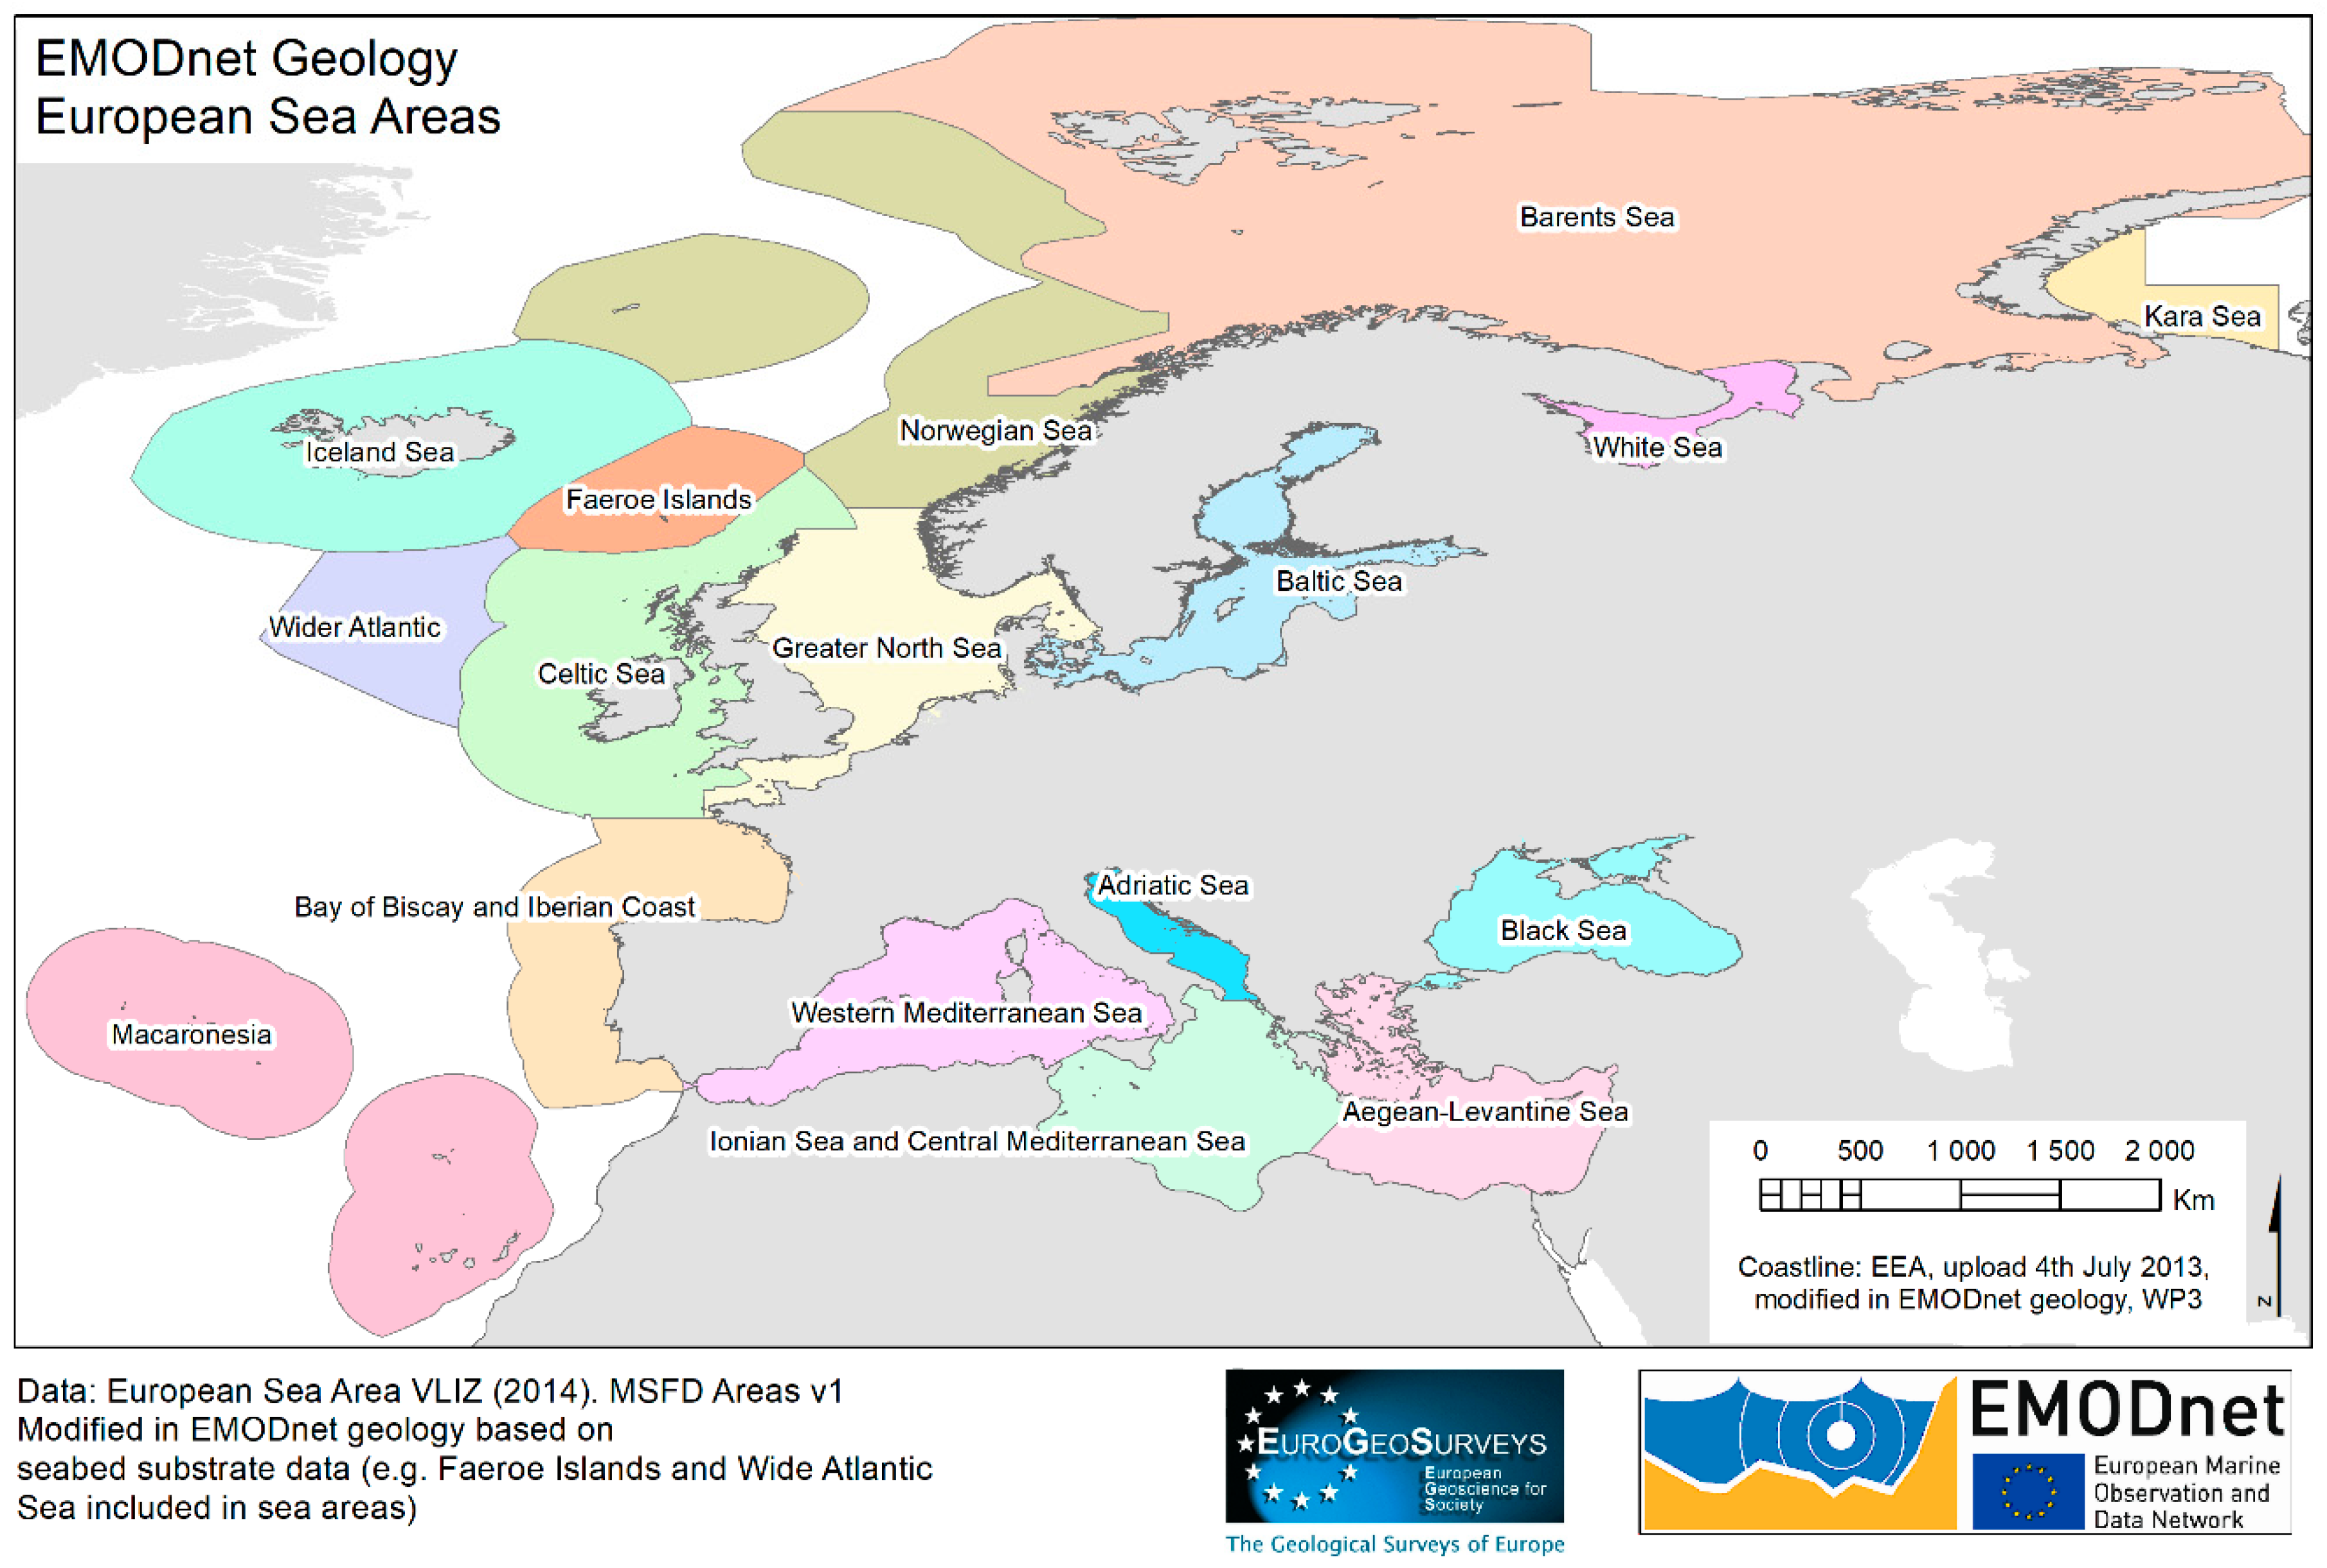
| SEAREGION | The sea region, represented by the data. |
| COUNTRY | The national exclusive economic zone (EEZ) area, where the data is located or the country of origin of the dataset. |
| DATA_HOLDER | Abbreviation of the organization/institute. |
| CONTACT | E-mail address of the contact person. |
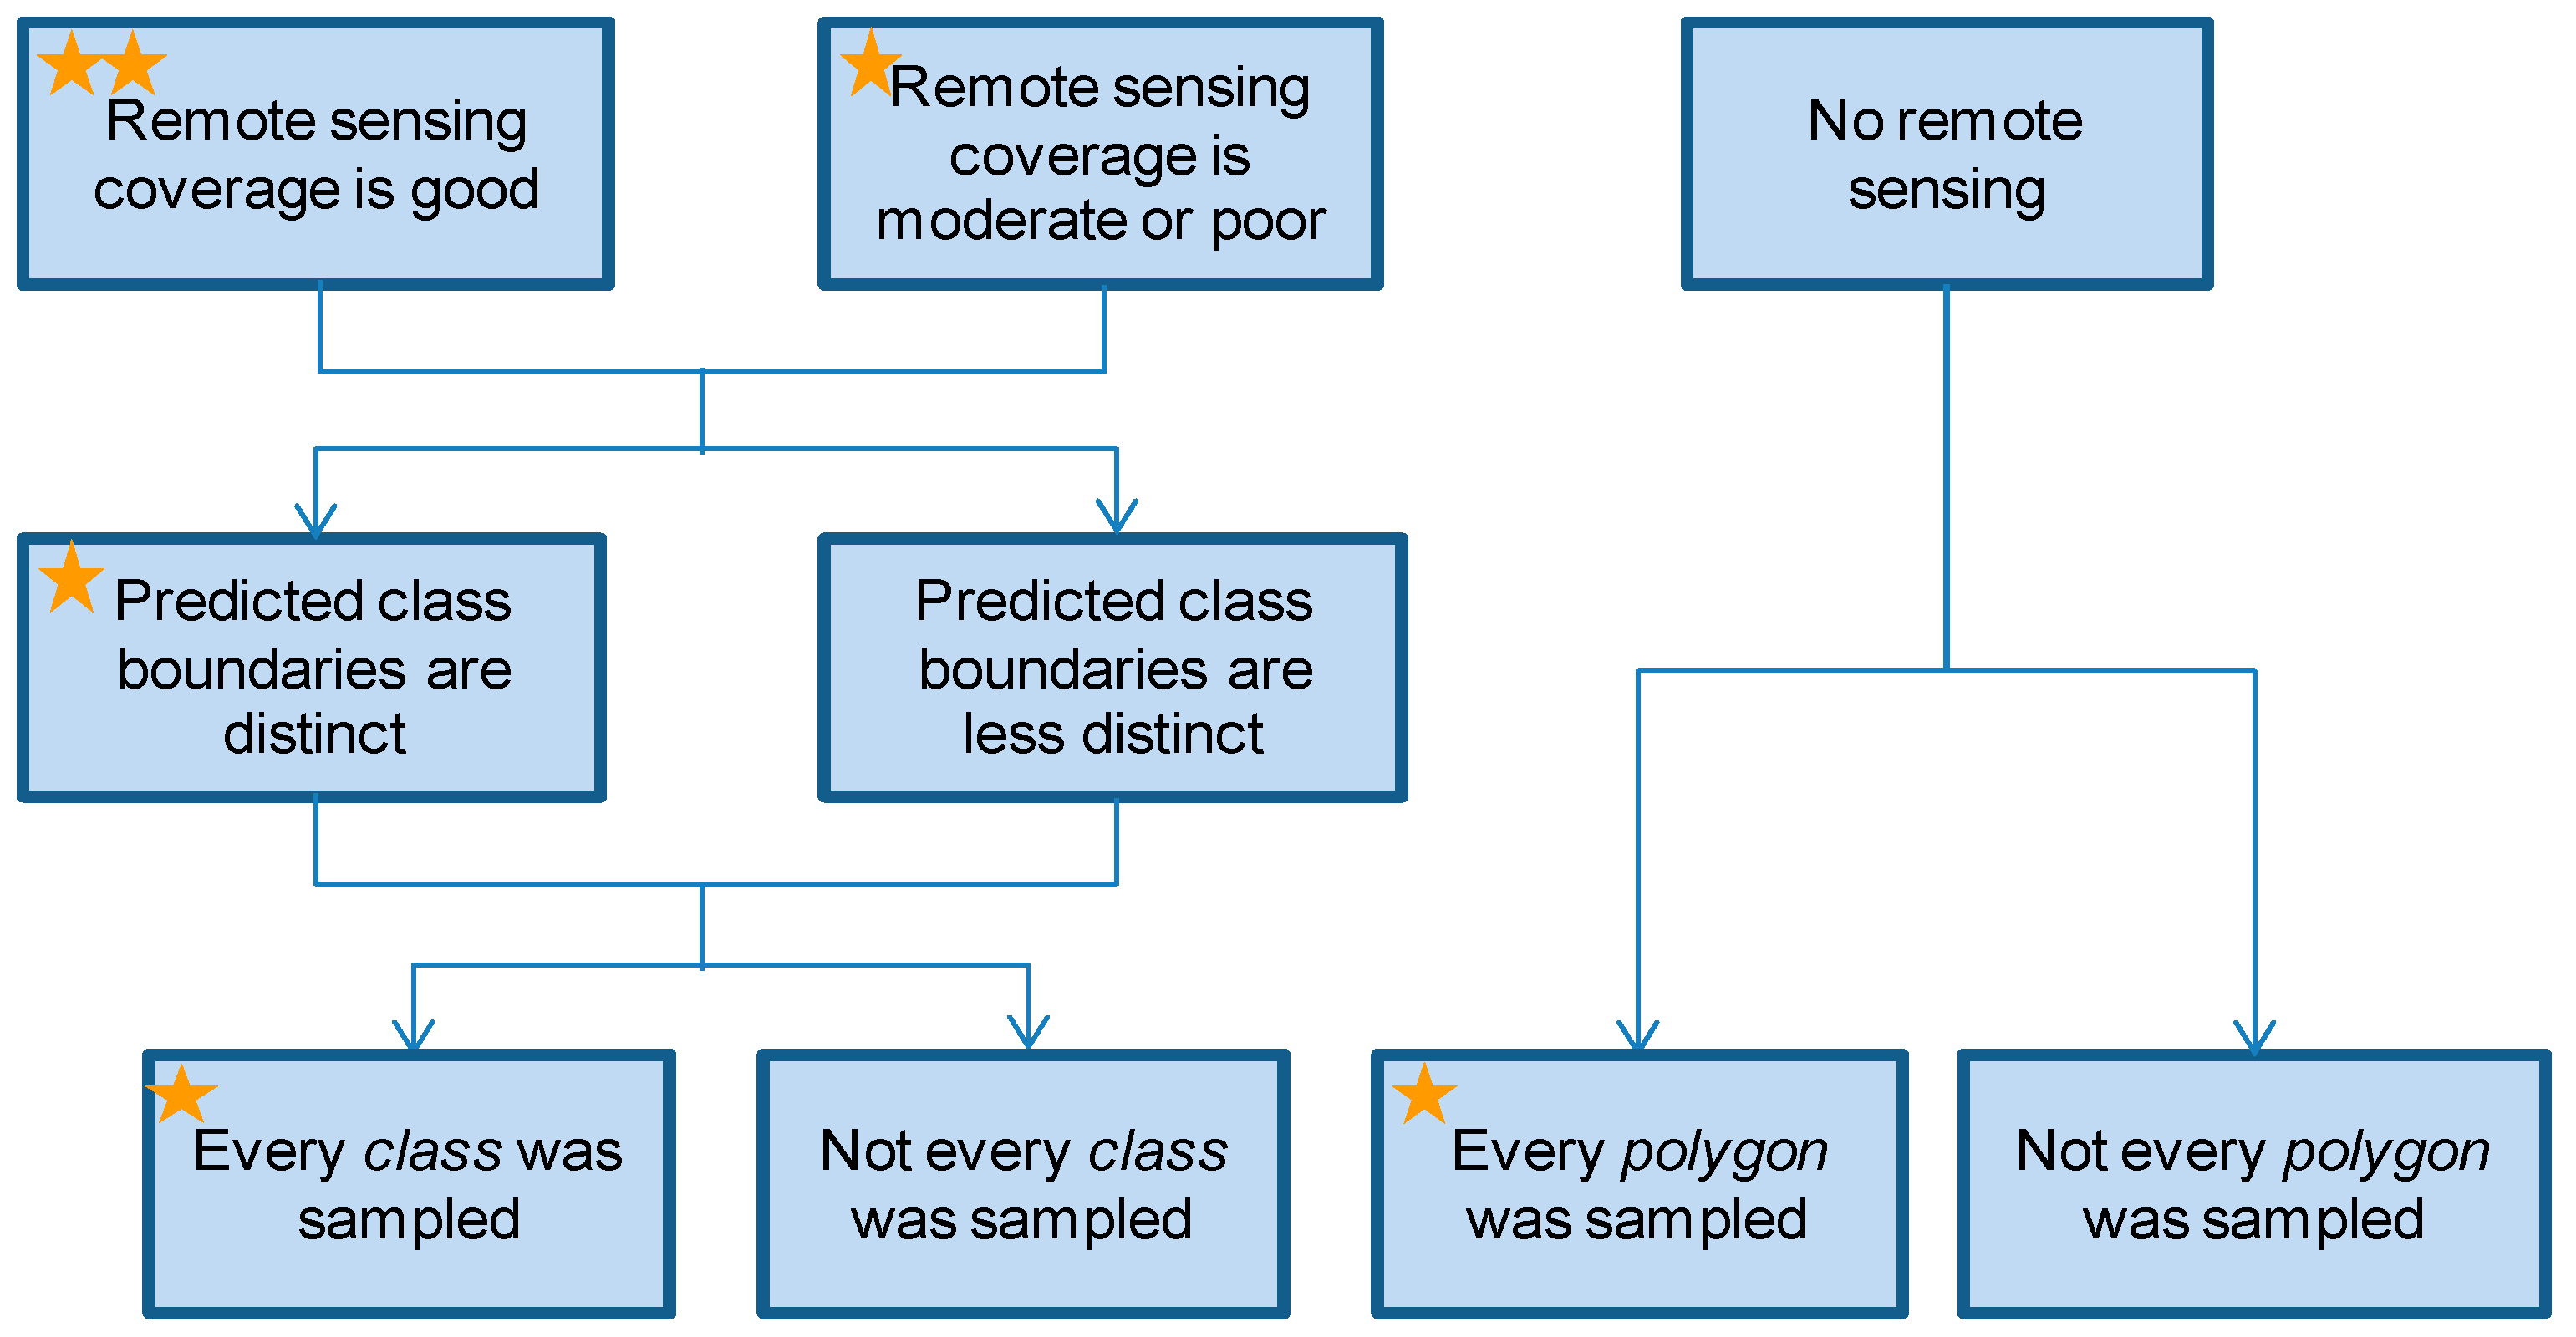
| Remote Sensing Coverage | Distinctness of Class Boundaries | Amount of Sampling | Total Score |
|---|---|---|---|
| ★★ | ★ | ★ | 4 |
| ★★ | ★ | 3 | |
| ★★ | ★ | ||
| ★ | ★ | ★ | |
| ★★ | 2 | ||
| ★ | ★ | ||
| ★ | ★ | ||
| ★ | 1 | ||
| ★ | |||
| 0 |
| Sea Region | Total Area (km2) | 250 k Coverage (%) | 250 k No Data (%) | 1 M Coverage (%) | 1 M No Data (%) | WGS 84, UTM Zone |
|---|---|---|---|---|---|---|
| Adriatic Sea | 140,400 | 91% | 9% | 98% | 2% | 34 N |
| Aegean-Levantine Sea * | 767,200 | 6% | 94% | 99% | 1% | 34 N |
| Baltic Sea | 394.200 | 47% | 53% | 98% | 2% | 34 N |
| Barents Sea | 1,980,200 | 6% | 94% | 78% | 22% | 37 N |
| Bay of Biscay and Iberian Coast | 807,800 | 12% | 88% | 34% | 66% | 29 N |
| Black Sea | 476,300 | 8% | 92% | 96% | 4% | 37 N |
| Celtic Sea | 917,600 | 79% | 21% | 82% | 18% | 29 N |
| Faeroe Islands EEZ | 267,400 | 0% | 100% | 39% | 61% | 29 N |
| Greater North Sea | 679,300 | 81% | 19% | 96% | 4% | 29 N |
| Iceland Sea | 761,700 | 0% | 100% | 100% | 0% | 29 N |
| Ionian Sea and Central Mediterranean Sea * | 778,000 | 0% | 100% | 99% | 1% | 34 N |
| Kara Sea | 113,500 | 0% | 100% | 0% | 100% | 37 N |
| Macaronesia | 1,940,800 | 0% | 100% | 0% | 100% | 29 N |
| Norwegian Sea | 890,100 | 4% | 94% | 14% | 86% | 34 N |
| Western Mediterranean Sea * | 885,100 | 9% | 91% | 99% | 1% | 29 N |
| White Sea | 90,500 | 0% | 100% | 100% | 0% | 37 N |
| Wider Atlantic | 405,300 | 77% | 23% | 77% | 23% | 29 N |
| Grand Total | 12,296,900 | 19% | 81% | 65% | 35% | 34 N |
© 2019 by the authors. Licensee MDPI, Basel, Switzerland. This article is an open access article distributed under the terms and conditions of the Creative Commons Attribution (CC BY) license (http://creativecommons.org/licenses/by/4.0/).
Share and Cite
Kaskela, A.M.; Kotilainen, A.T.; Alanen, U.; Cooper, R.; Green, S.; Guinan, J.; van Heteren, S.; Kihlman, S.; Van Lancker, V.; Stevenson, A.; et al. Picking Up the Pieces—Harmonising and Collating Seabed Substrate Data for European Maritime Areas. Geosciences 2019, 9, 84. https://doi.org/10.3390/geosciences9020084
Kaskela AM, Kotilainen AT, Alanen U, Cooper R, Green S, Guinan J, van Heteren S, Kihlman S, Van Lancker V, Stevenson A, et al. Picking Up the Pieces—Harmonising and Collating Seabed Substrate Data for European Maritime Areas. Geosciences. 2019; 9(2):84. https://doi.org/10.3390/geosciences9020084
Chicago/Turabian StyleKaskela, Anu Marii, Aarno Tapio Kotilainen, Ulla Alanen, Rhys Cooper, Sophie Green, Janine Guinan, Sytze van Heteren, Susanna Kihlman, Vera Van Lancker, Alan Stevenson, and et al. 2019. "Picking Up the Pieces—Harmonising and Collating Seabed Substrate Data for European Maritime Areas" Geosciences 9, no. 2: 84. https://doi.org/10.3390/geosciences9020084