Determining Shrinkage Cracks Based on the Small-Strain Shear Modulus–Suction Relationship

 , ,
, ,
Abstract
:1. Introduction
2. Materials and Methods
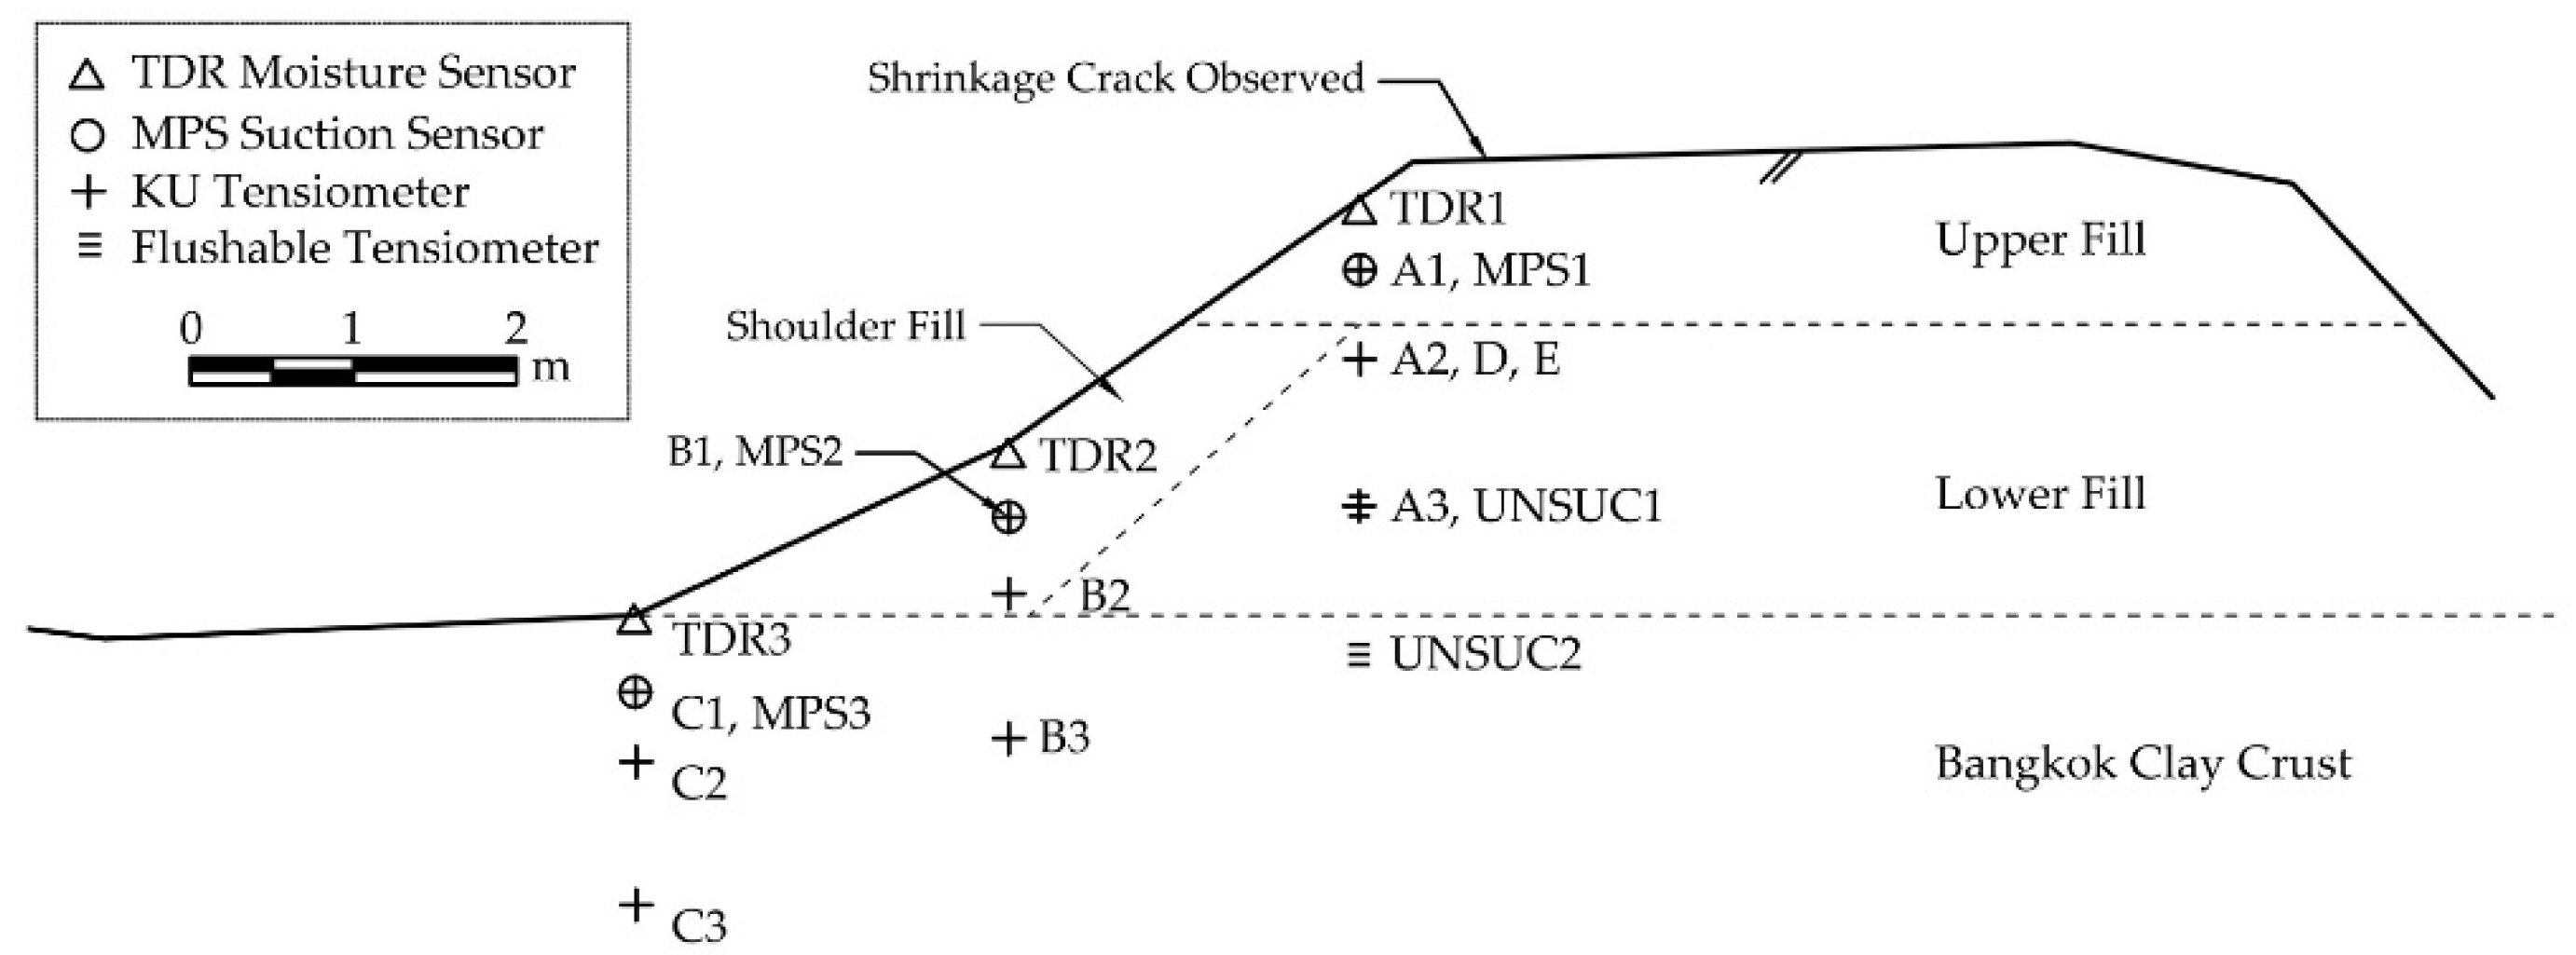
2.1. Study Area and Instrumentation
2.2. Soil Water Retention Curve (SWRC)
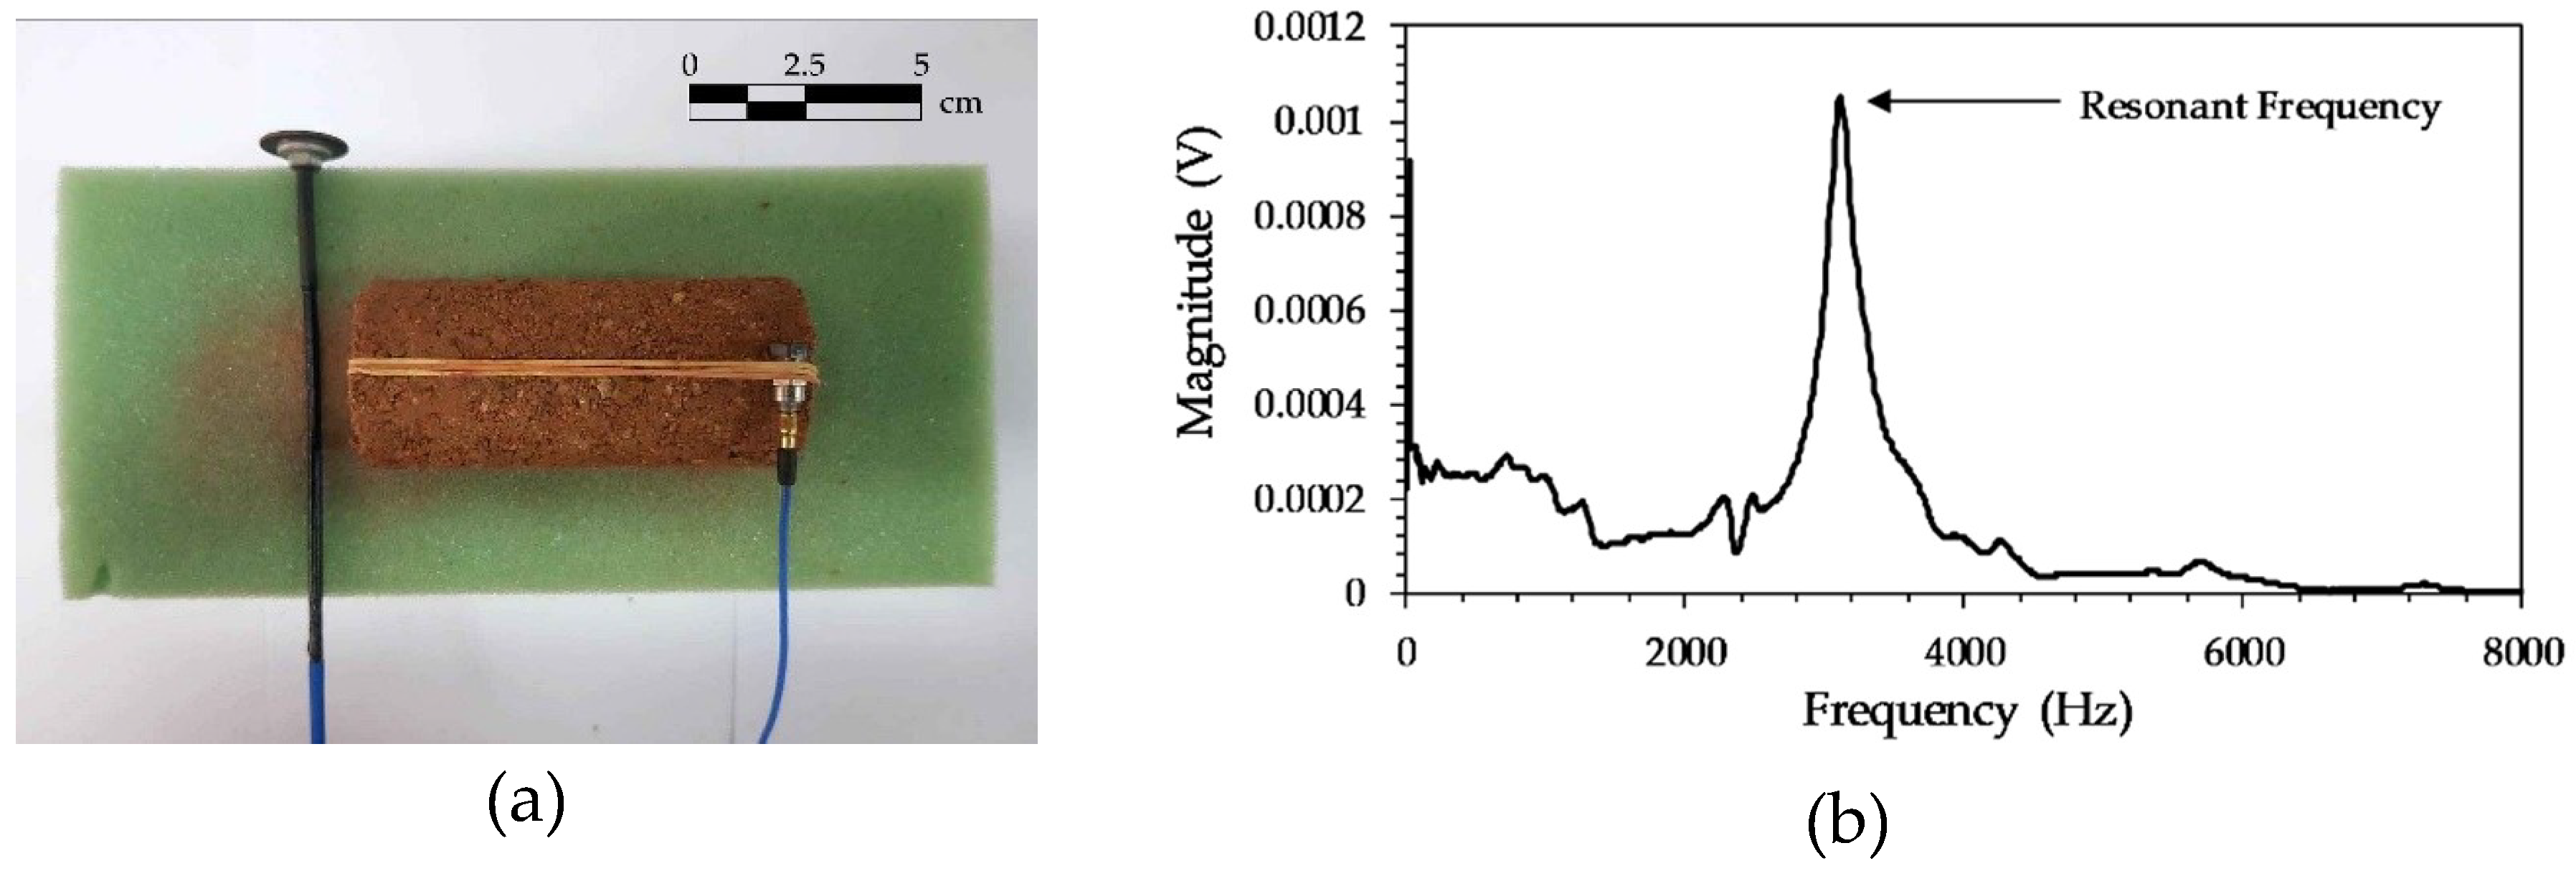
2.3. Free-Free Resonant Frequency (FFR) Test
2.4. Spectral Analysis of Surface Waves (SASW) Test
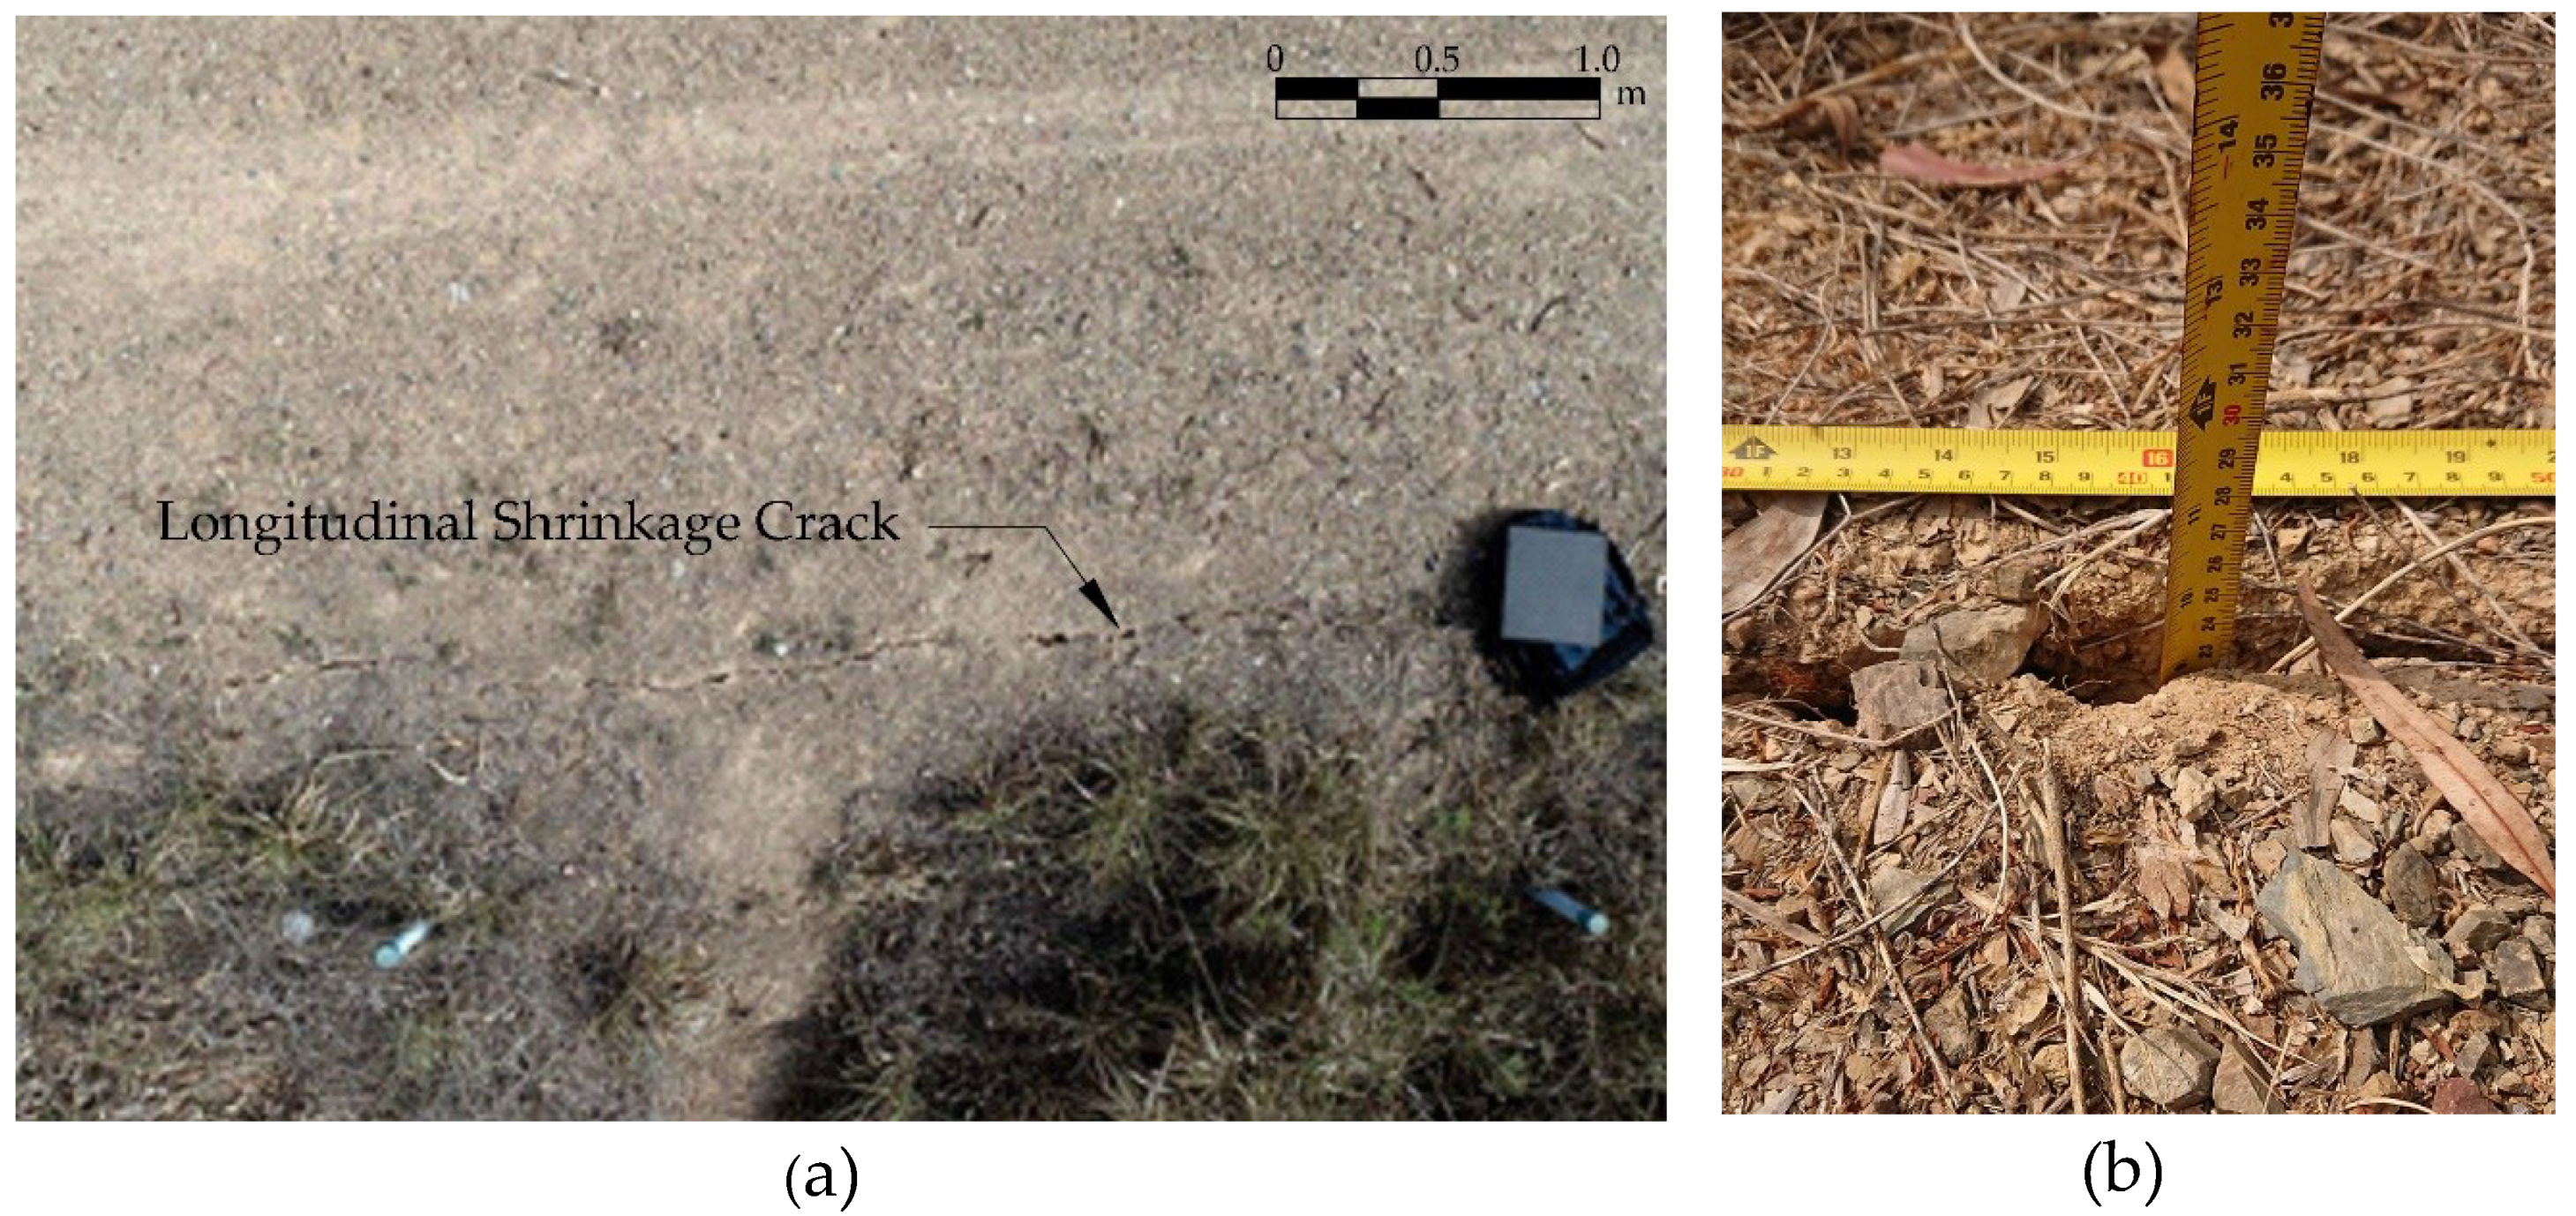
2.5. Measurement of Shrinkage Cracks
3. Results and Discussions
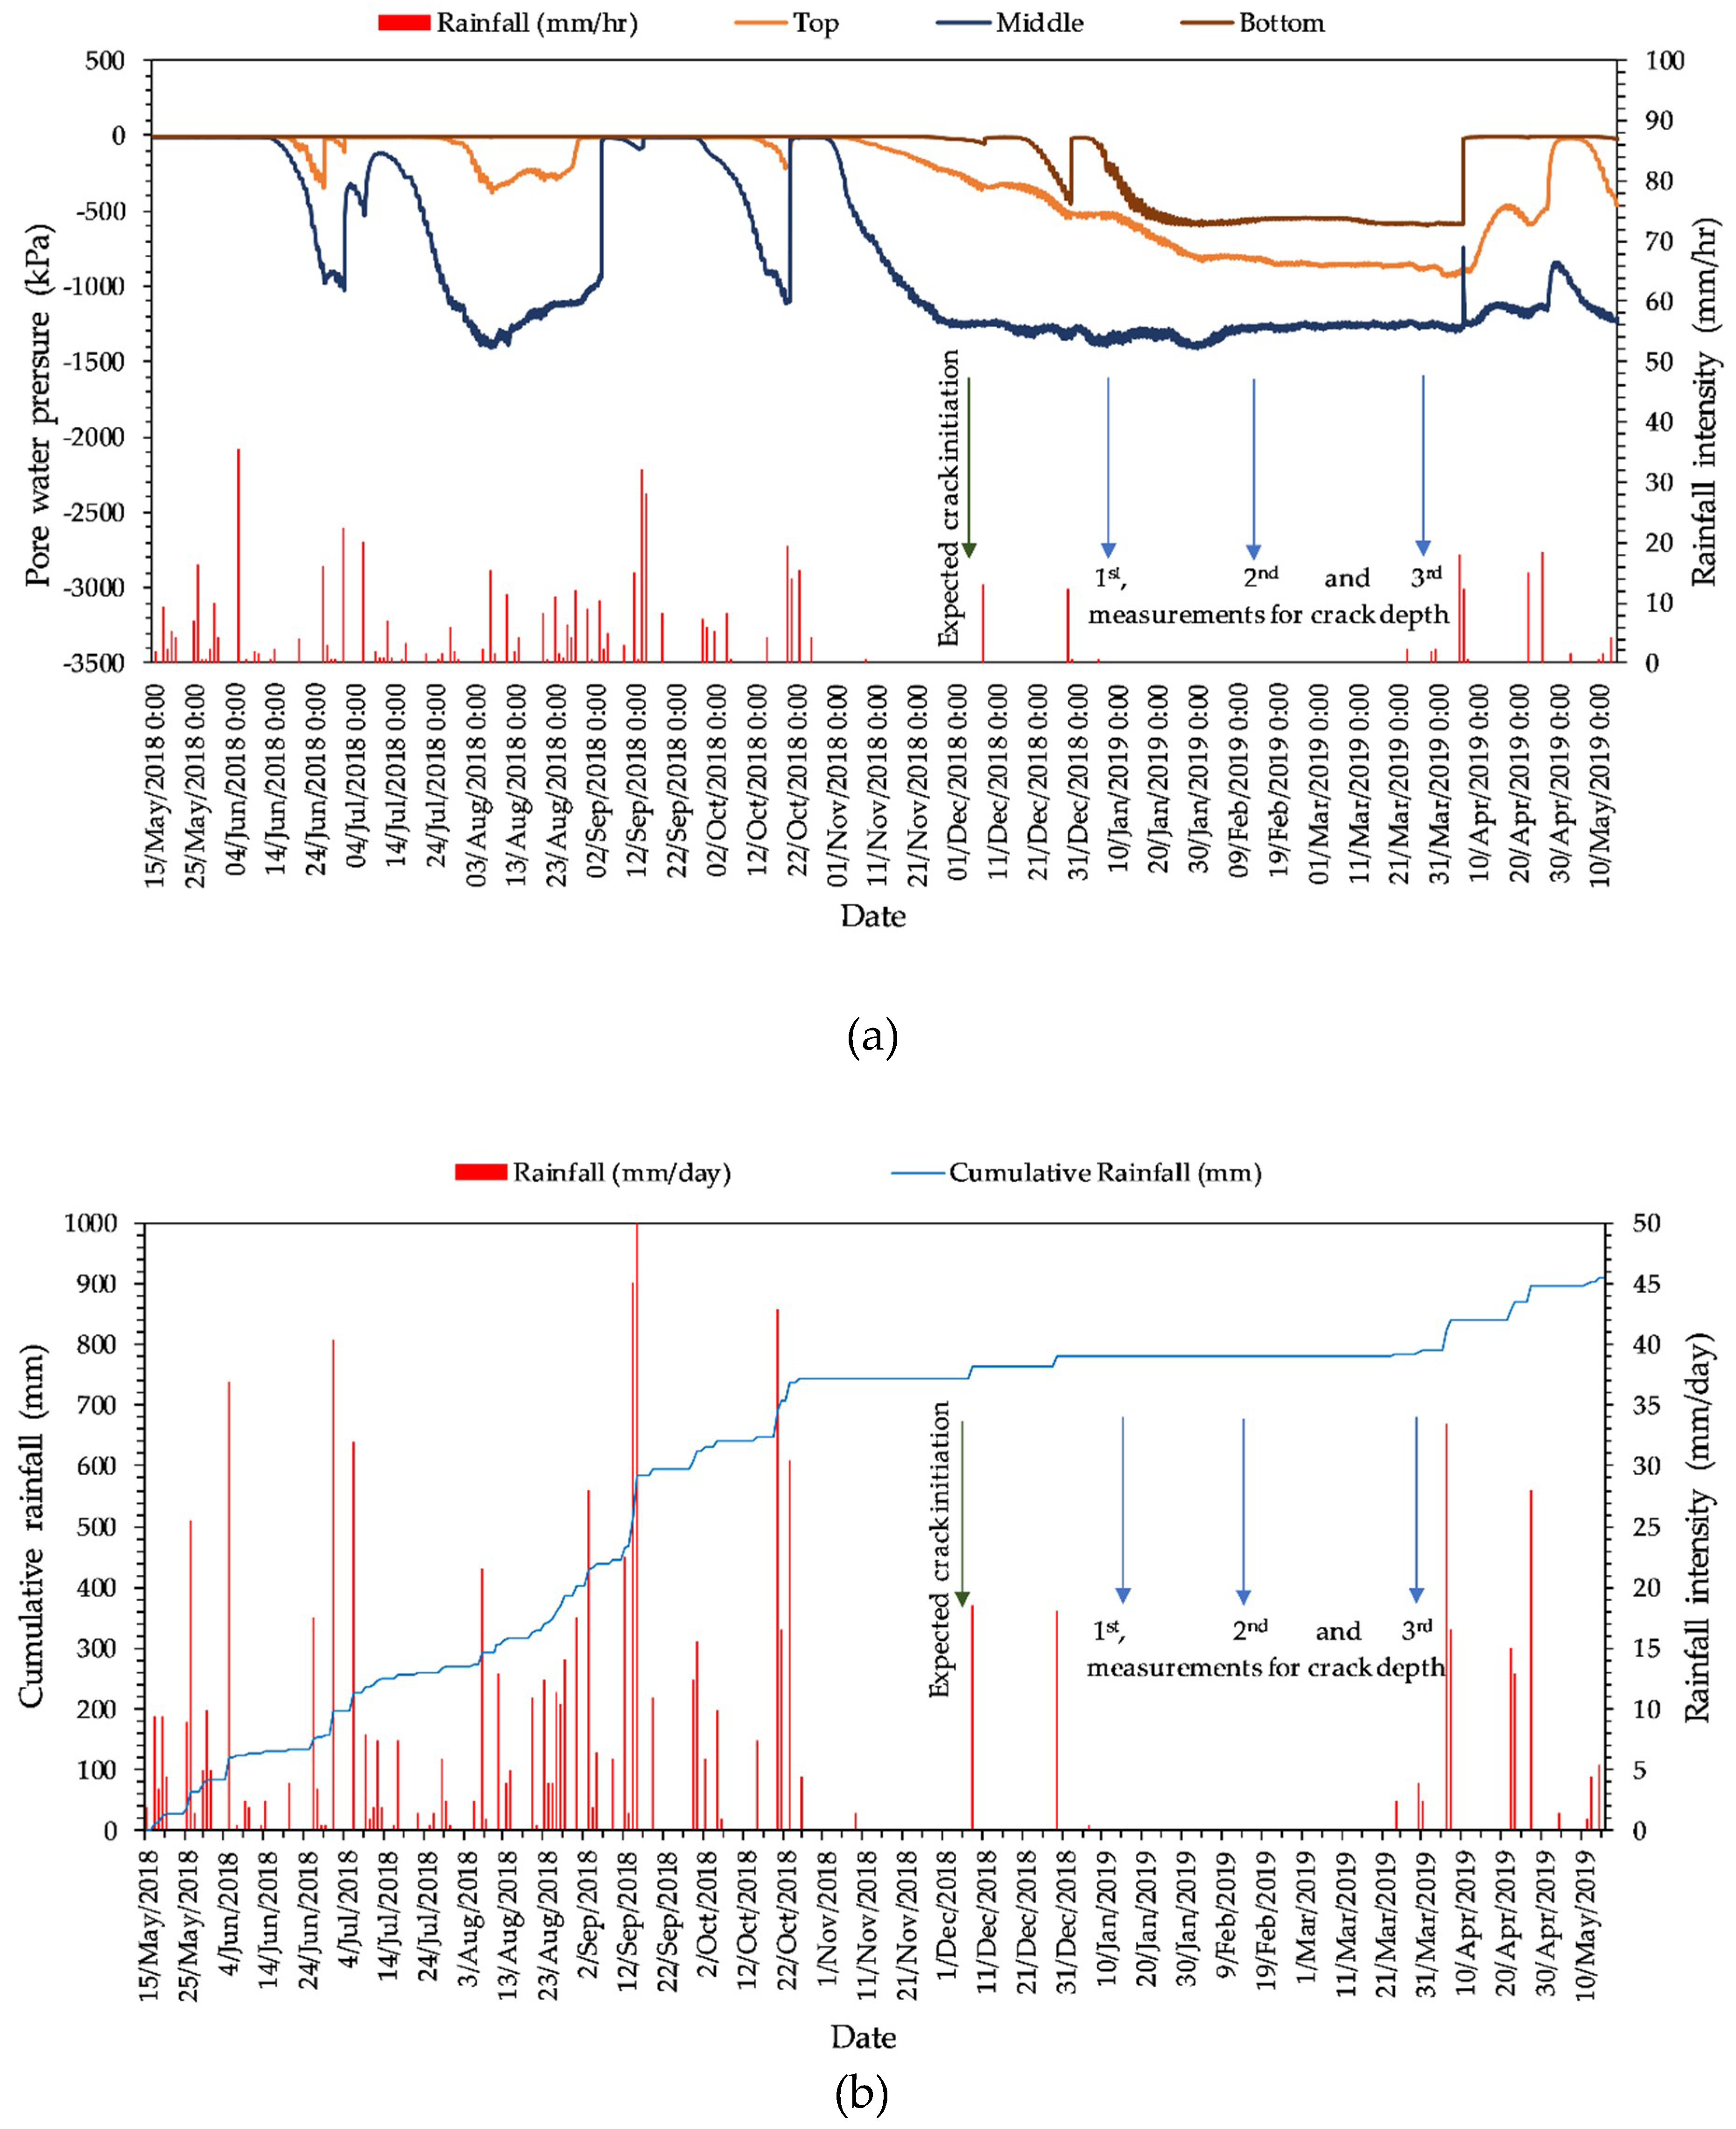
3.1. Instrumentation Results
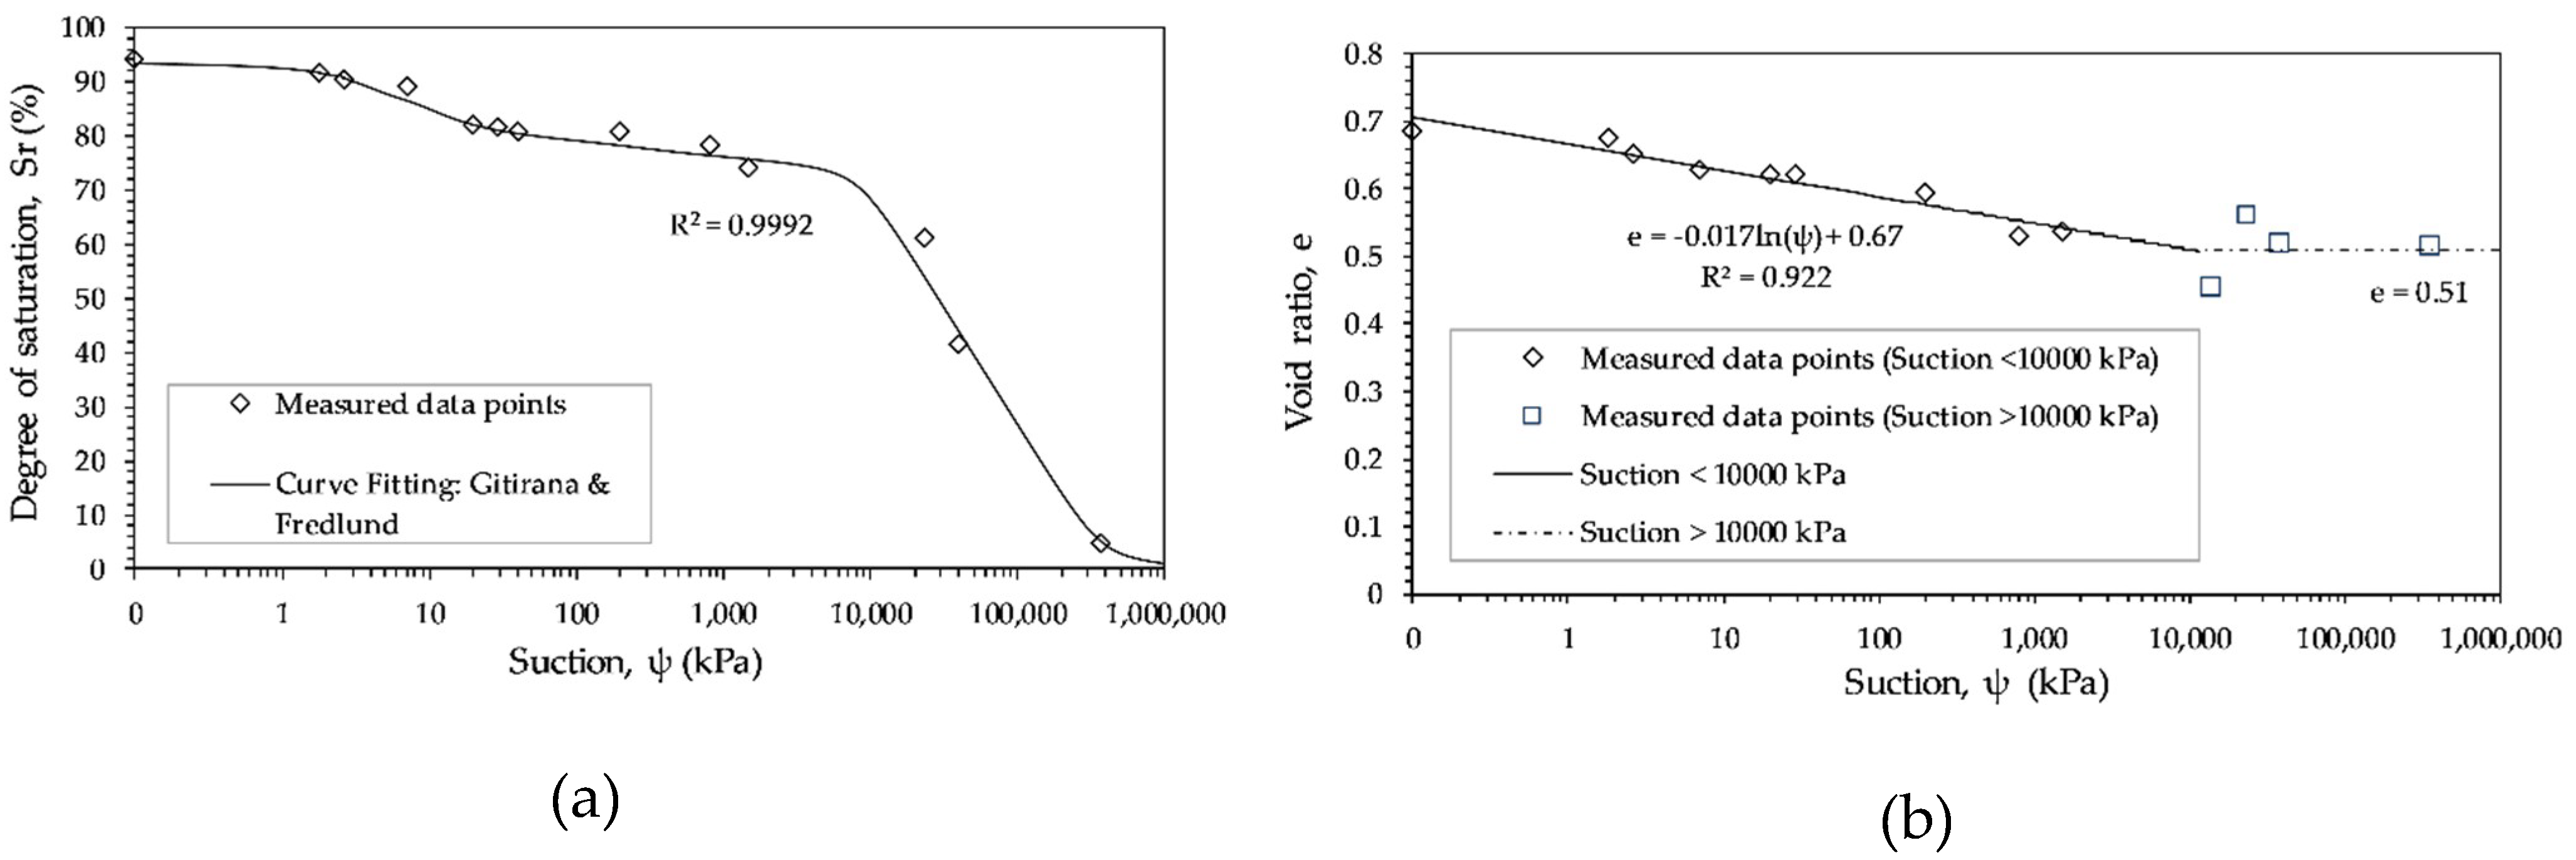
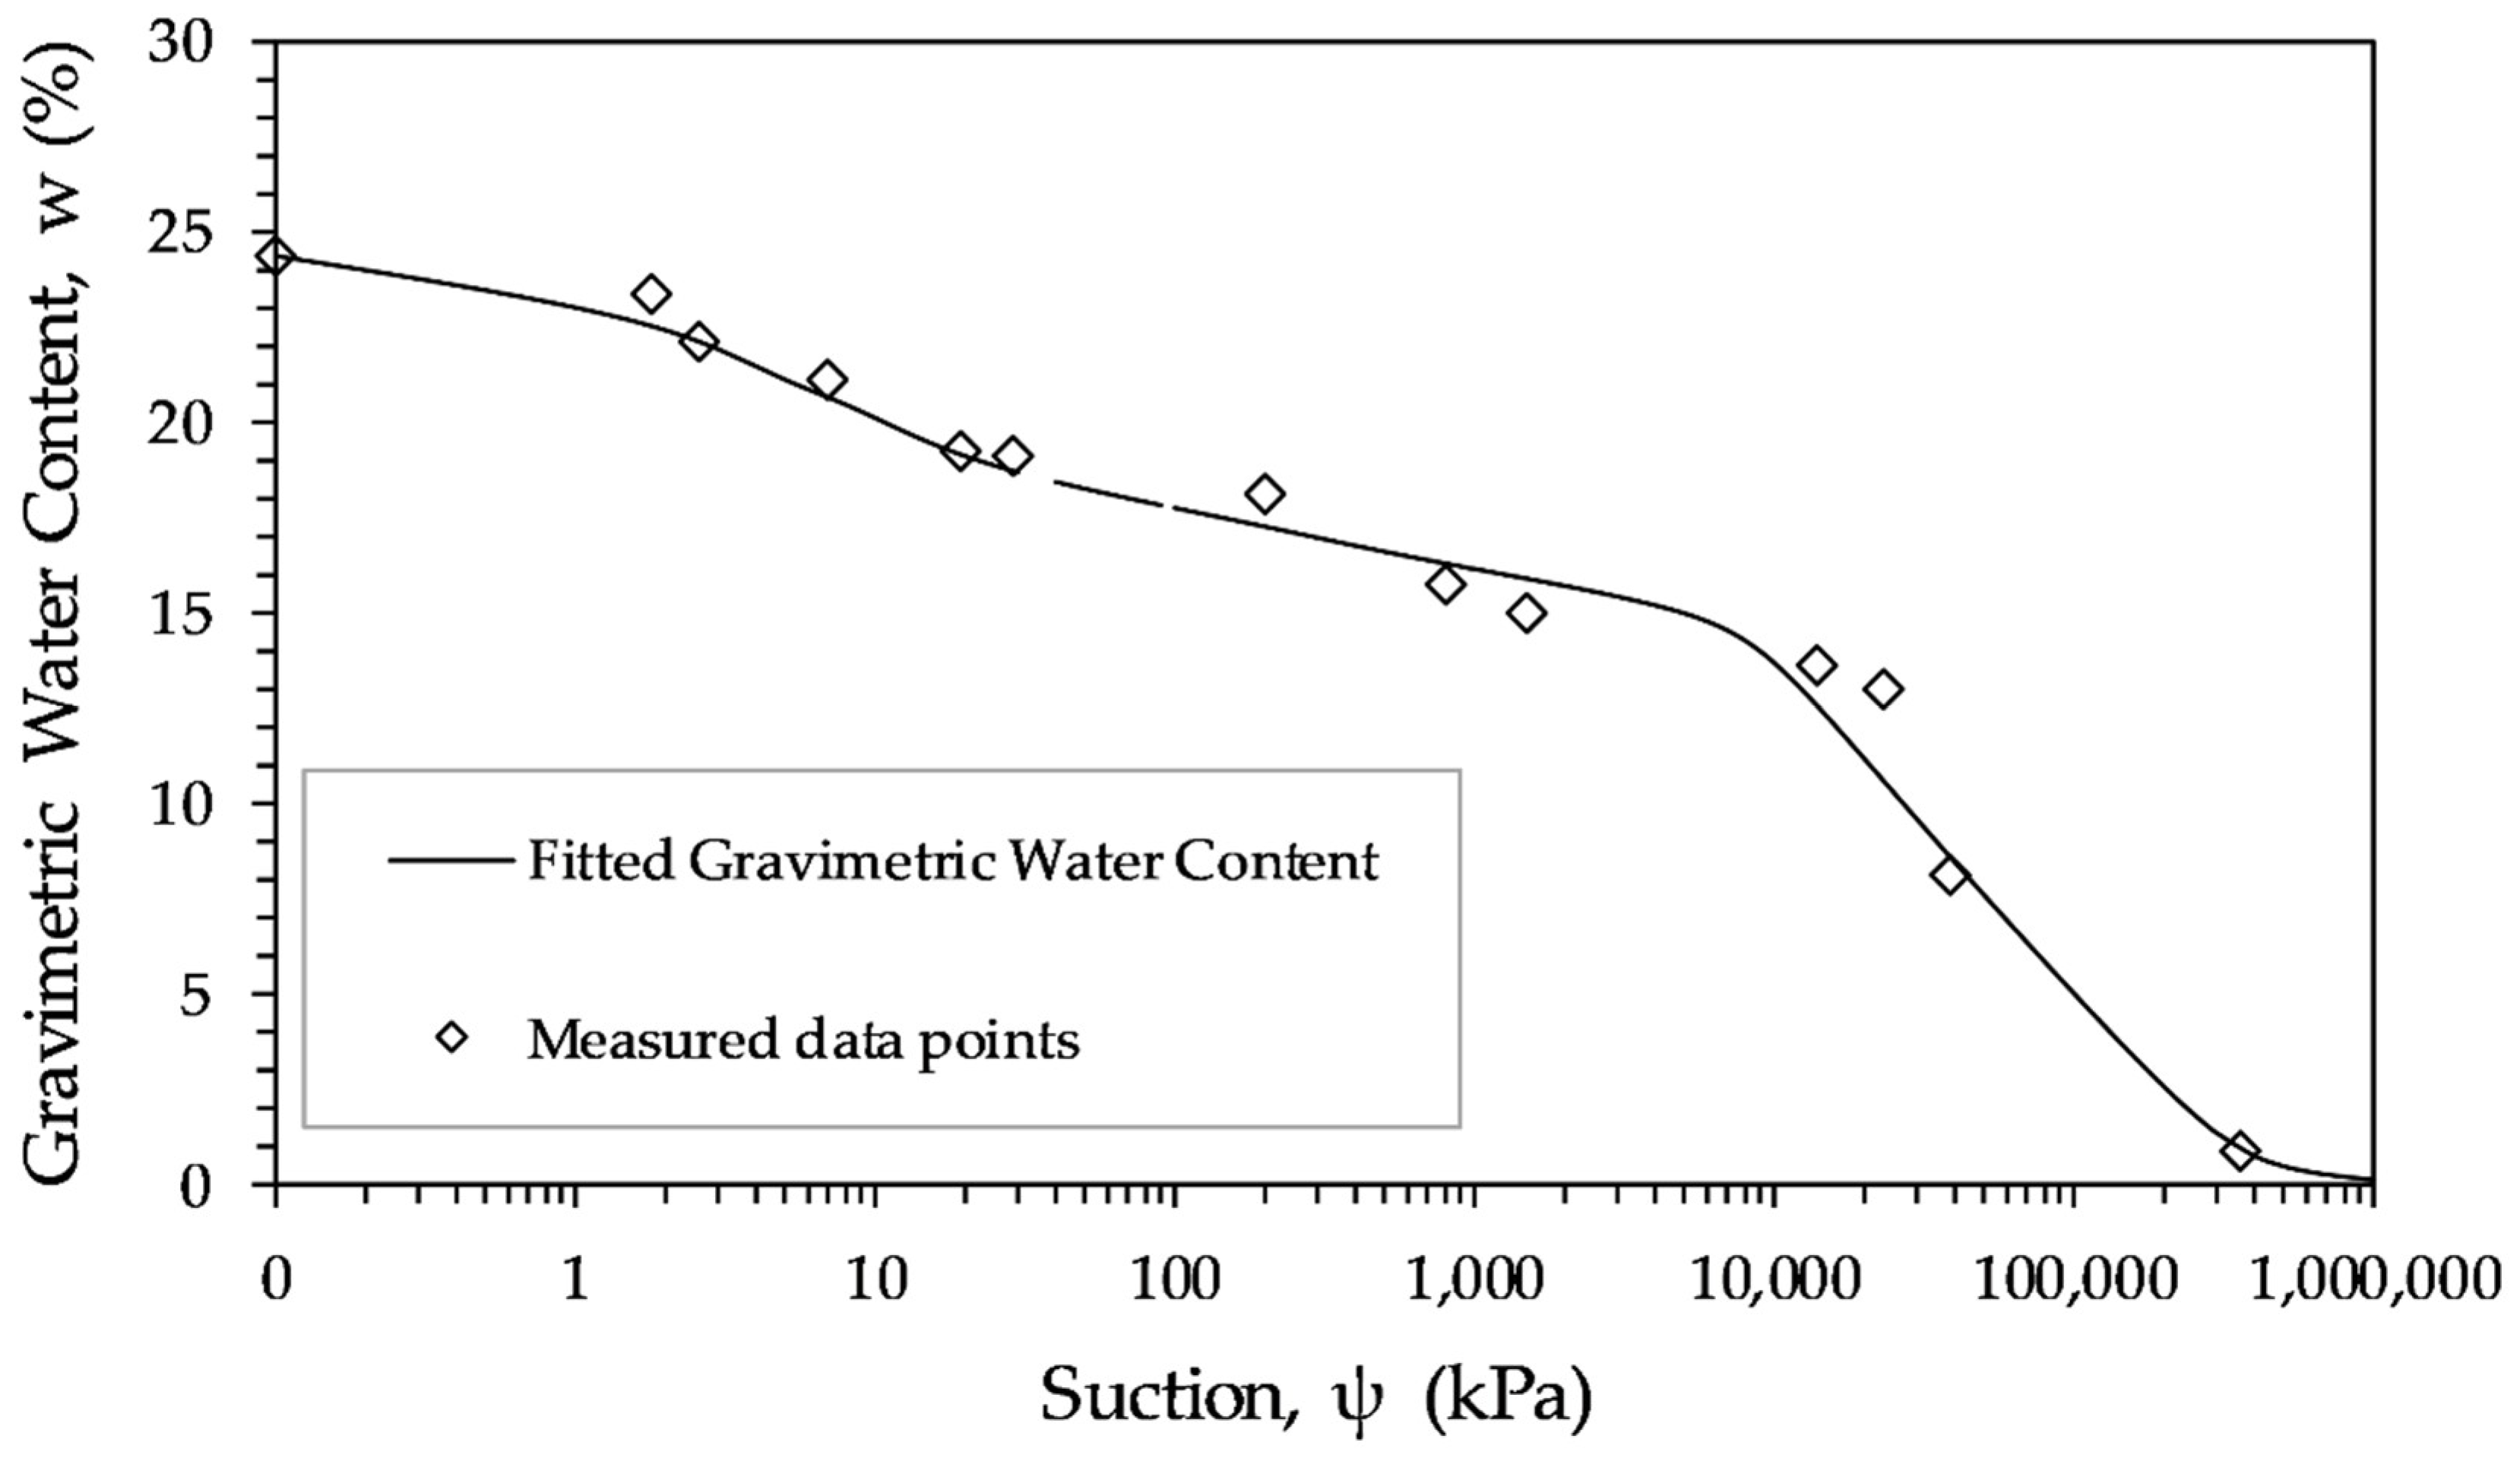
3.2. Soil Water Retention Curve (SWRC)
3.3. FFR Results
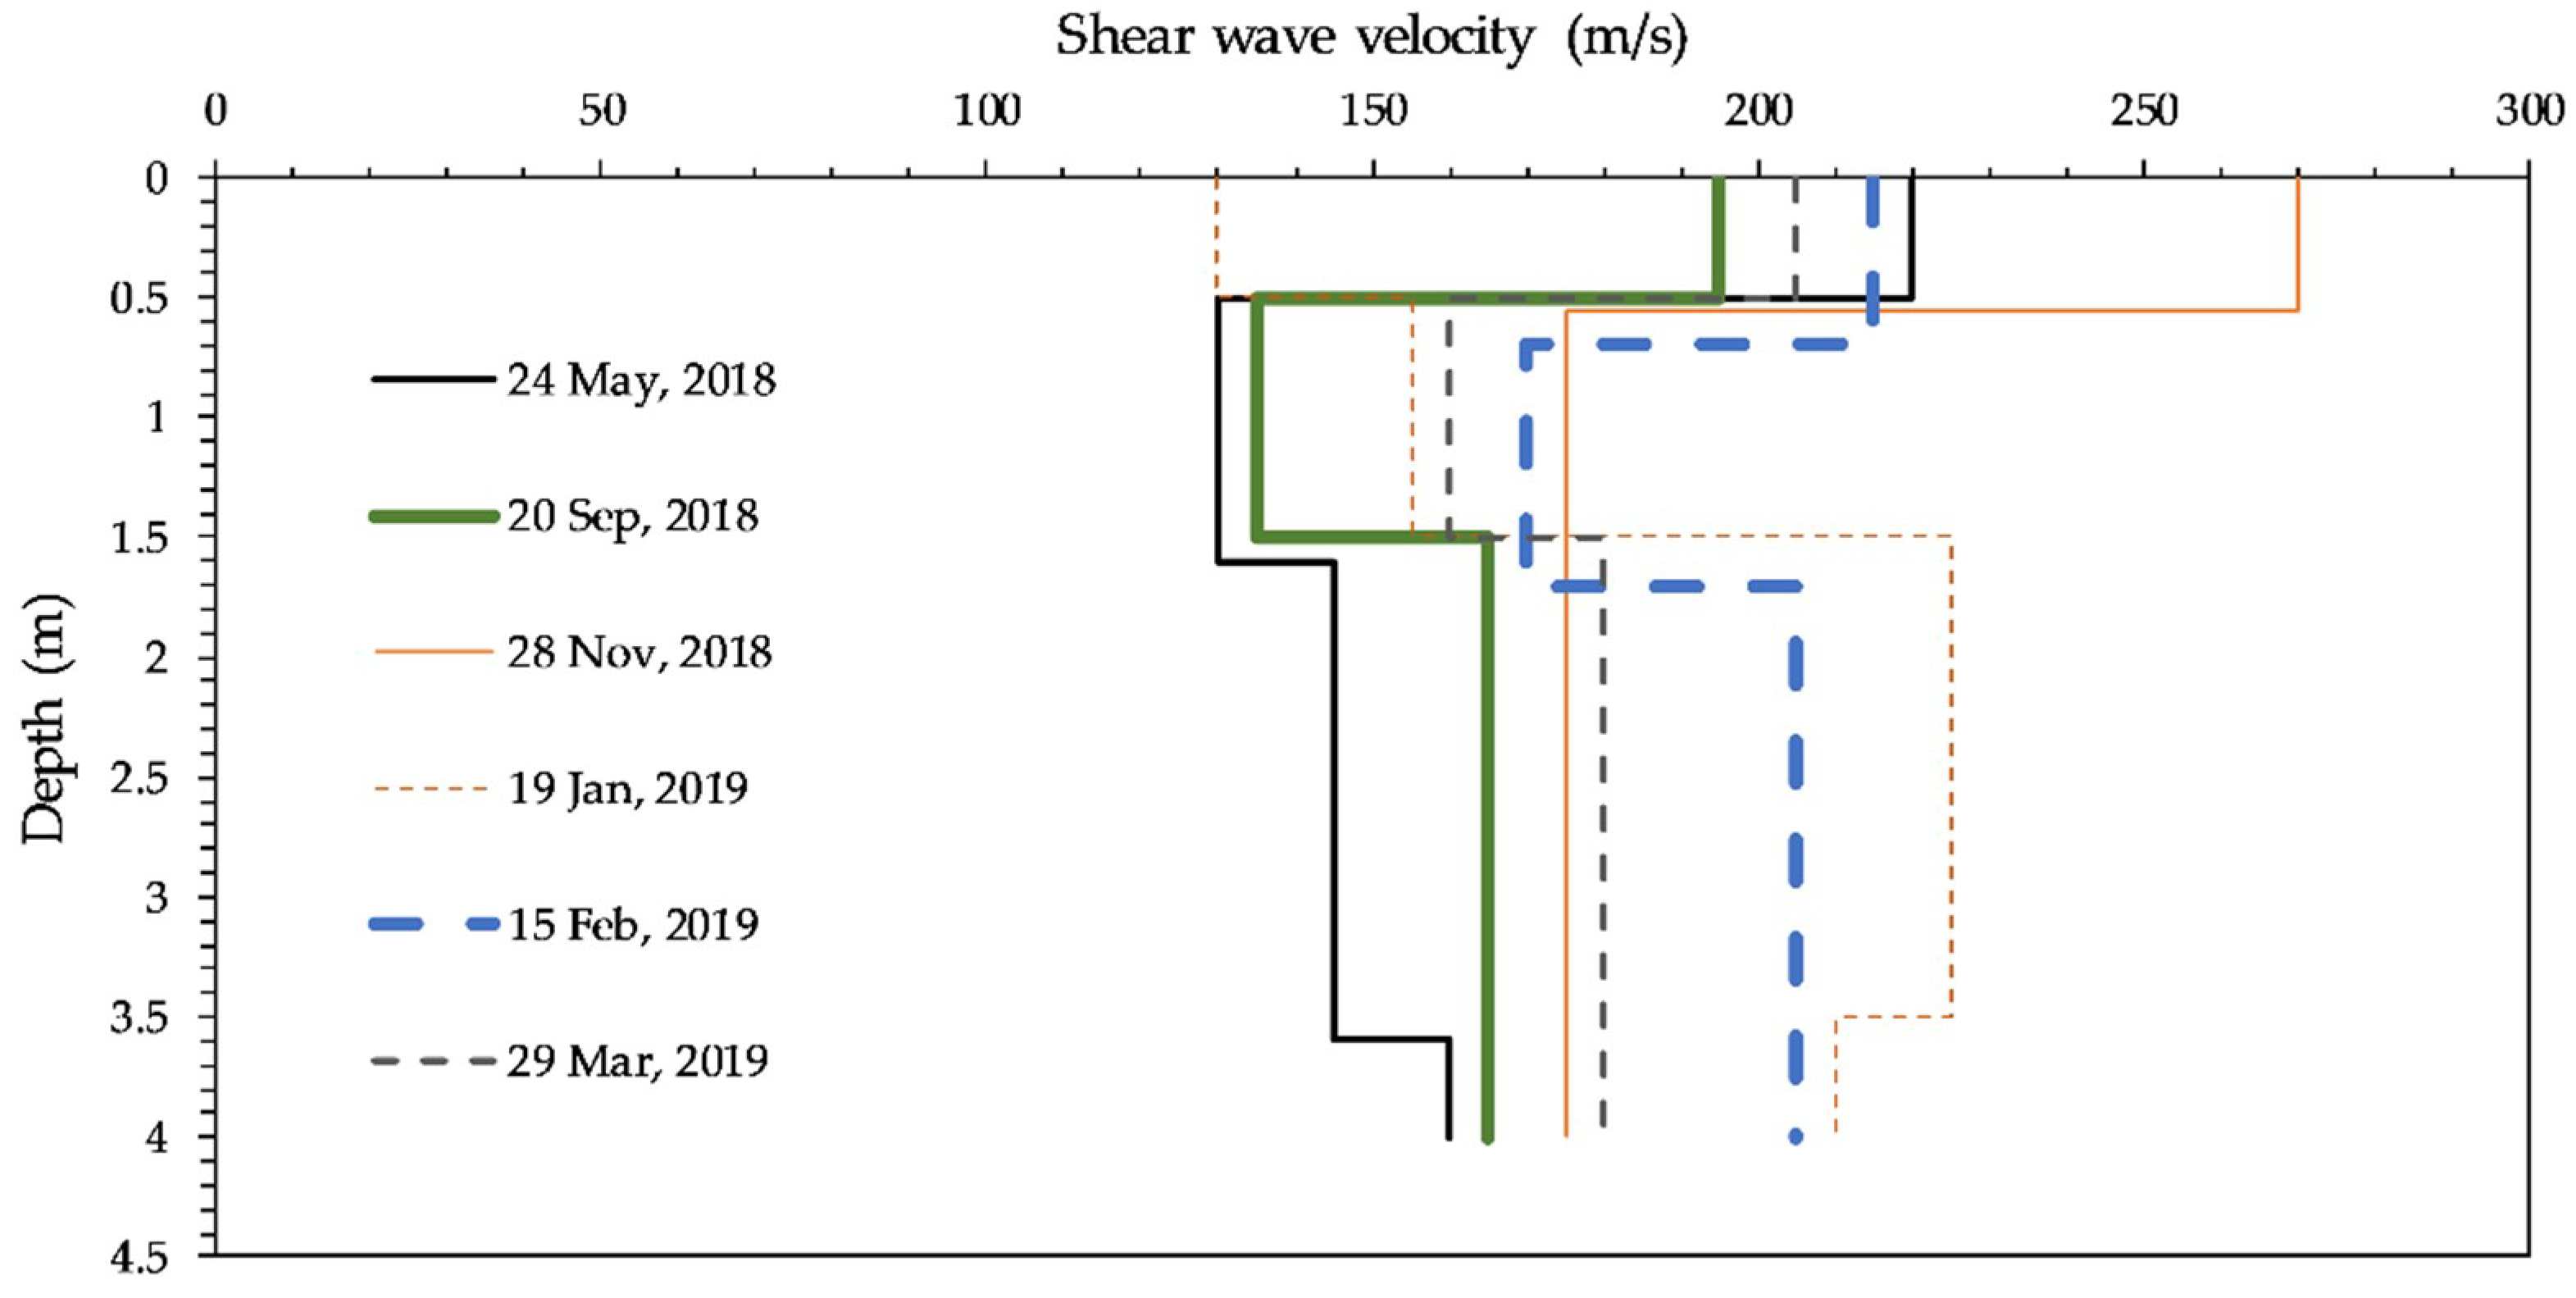
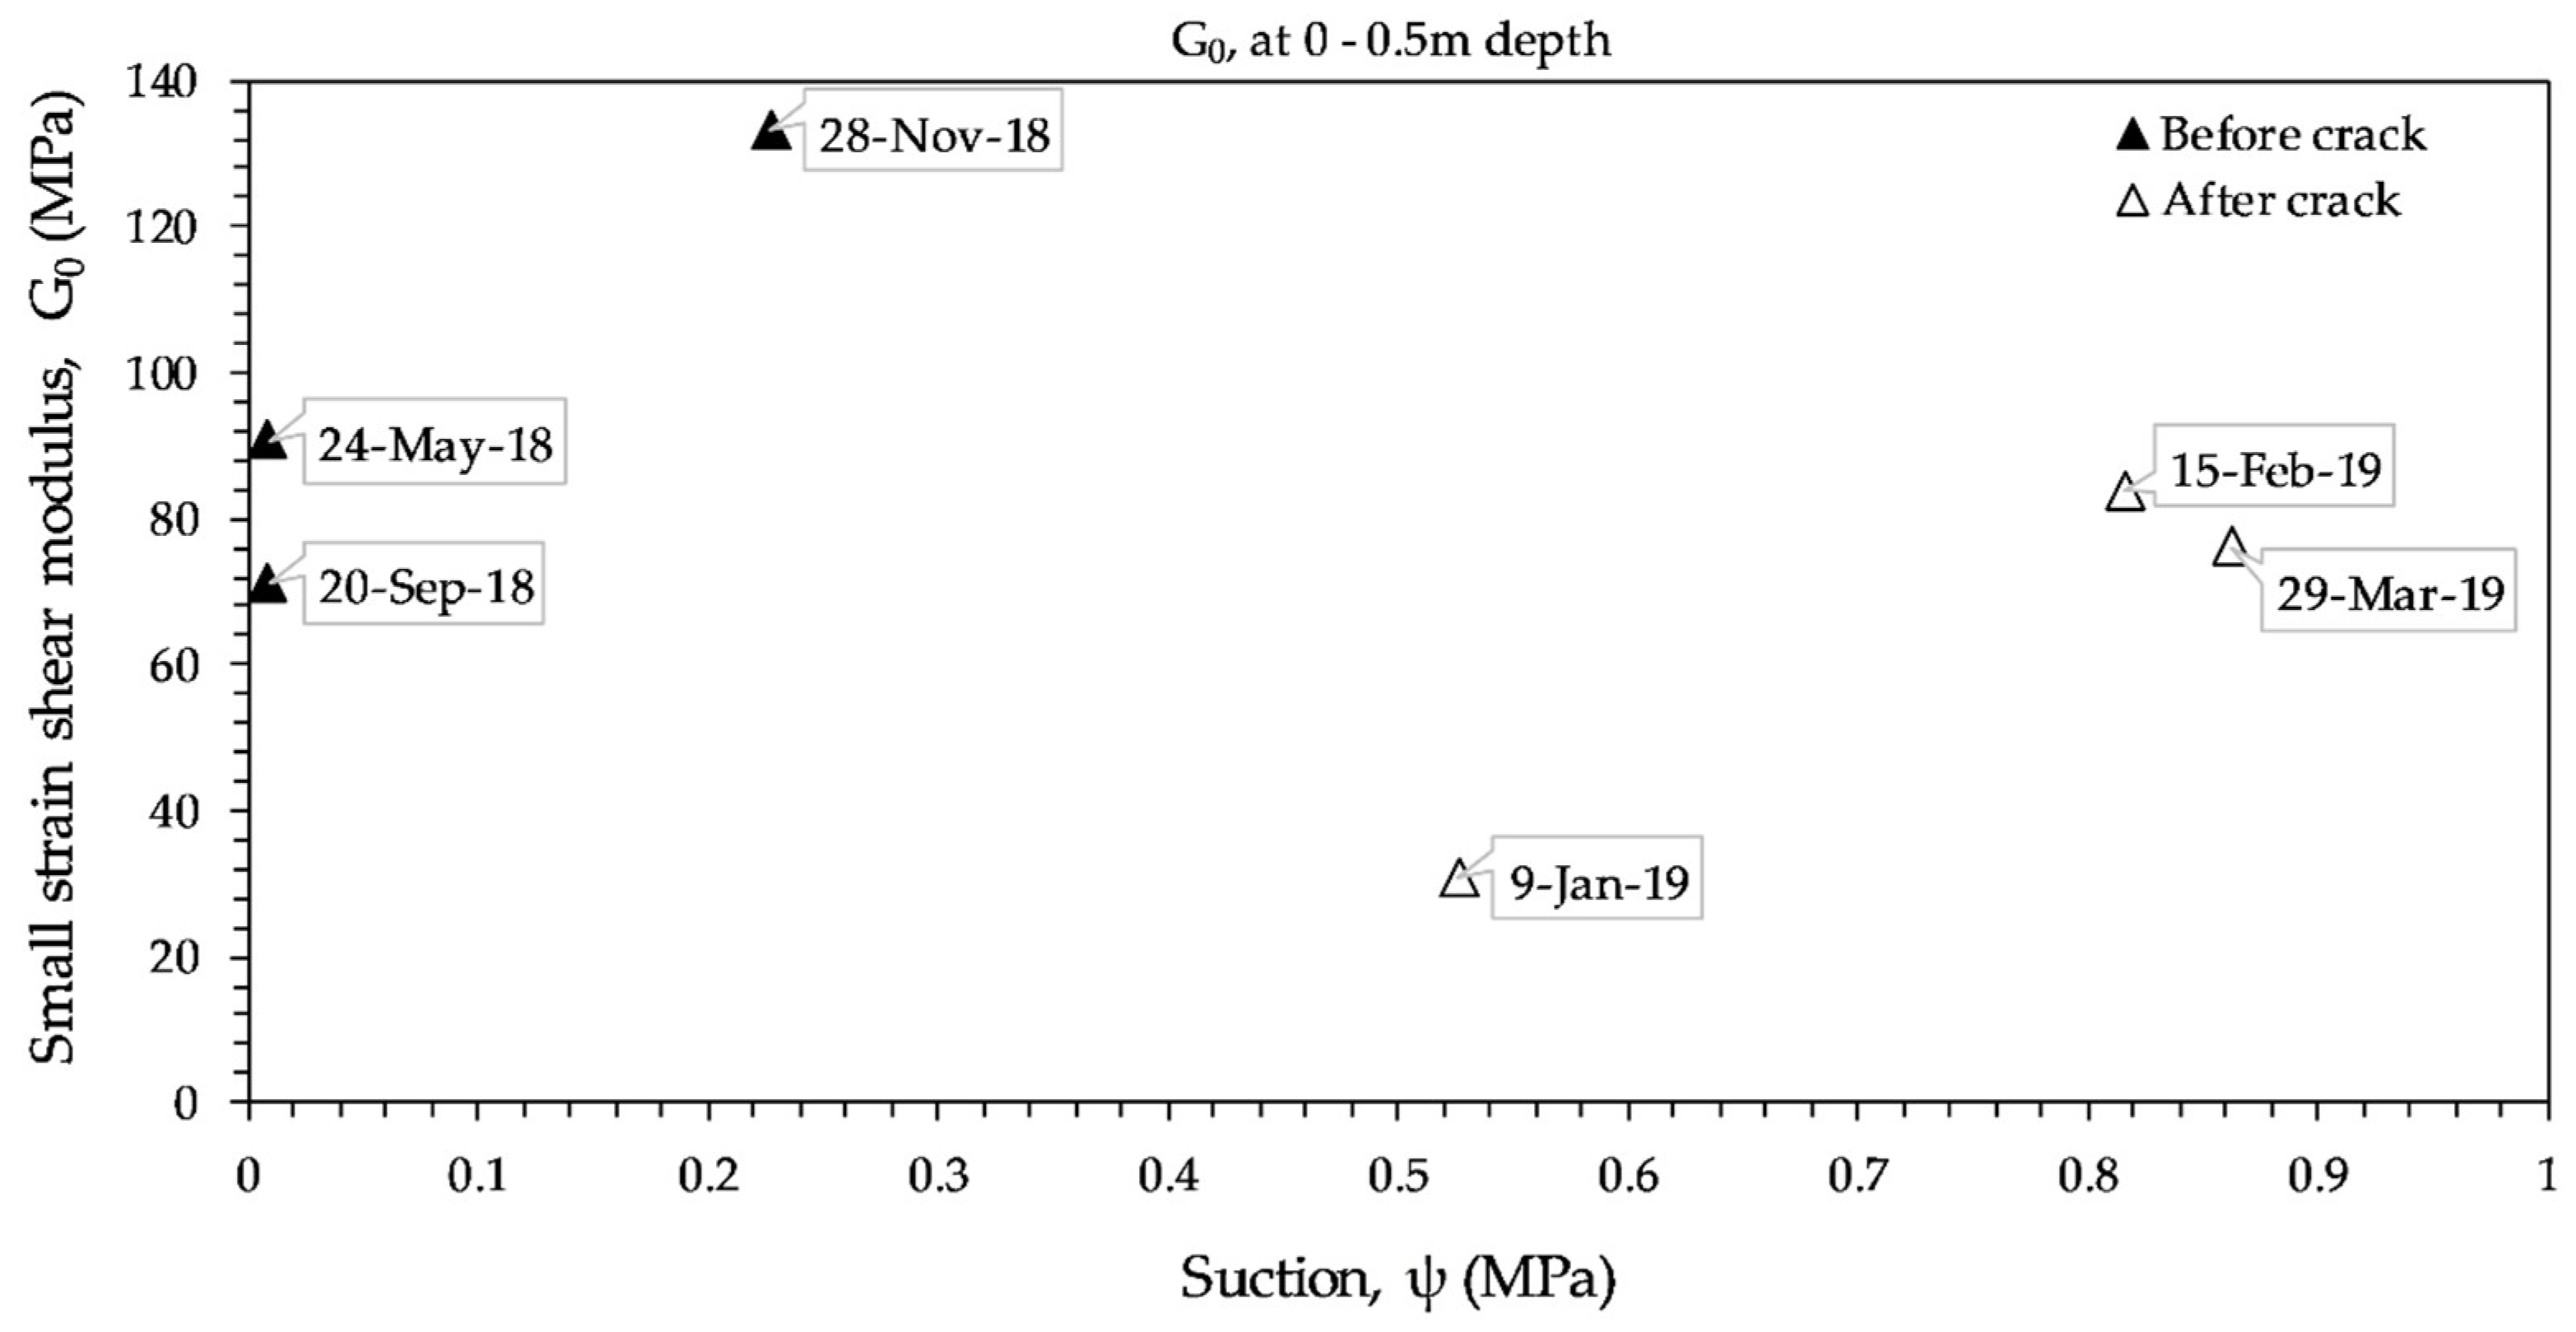
3.4. SASW Results
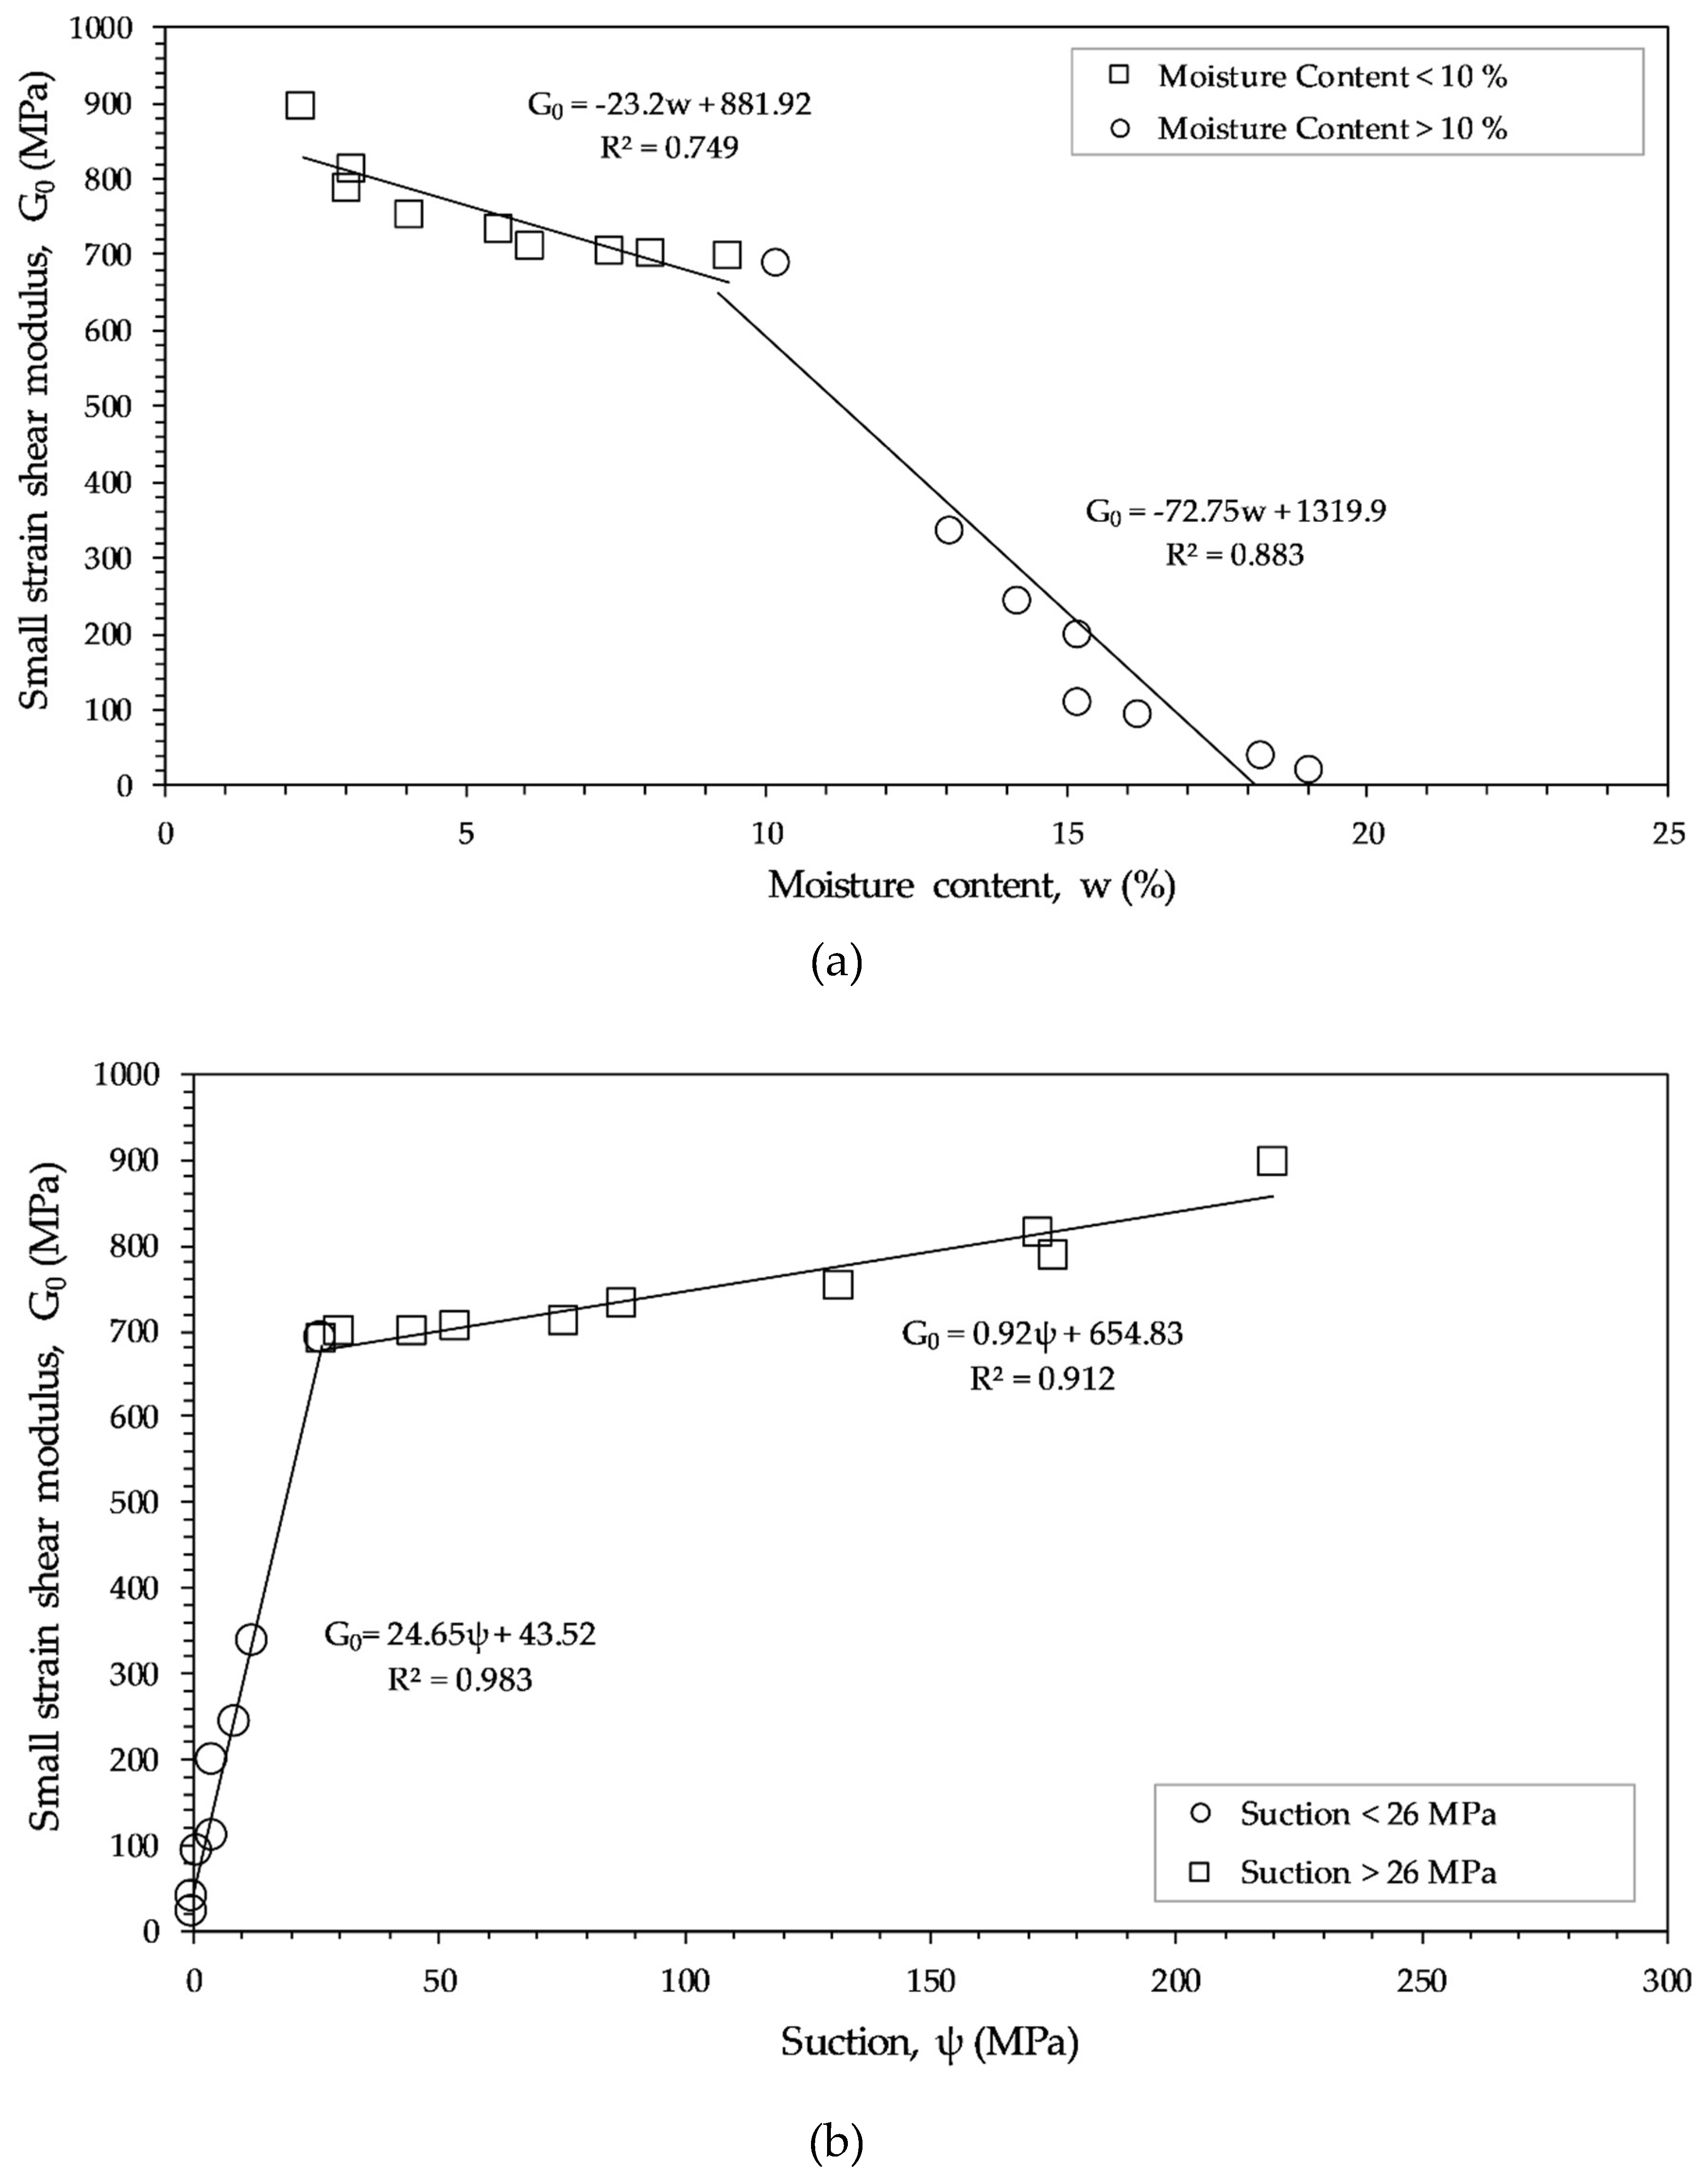
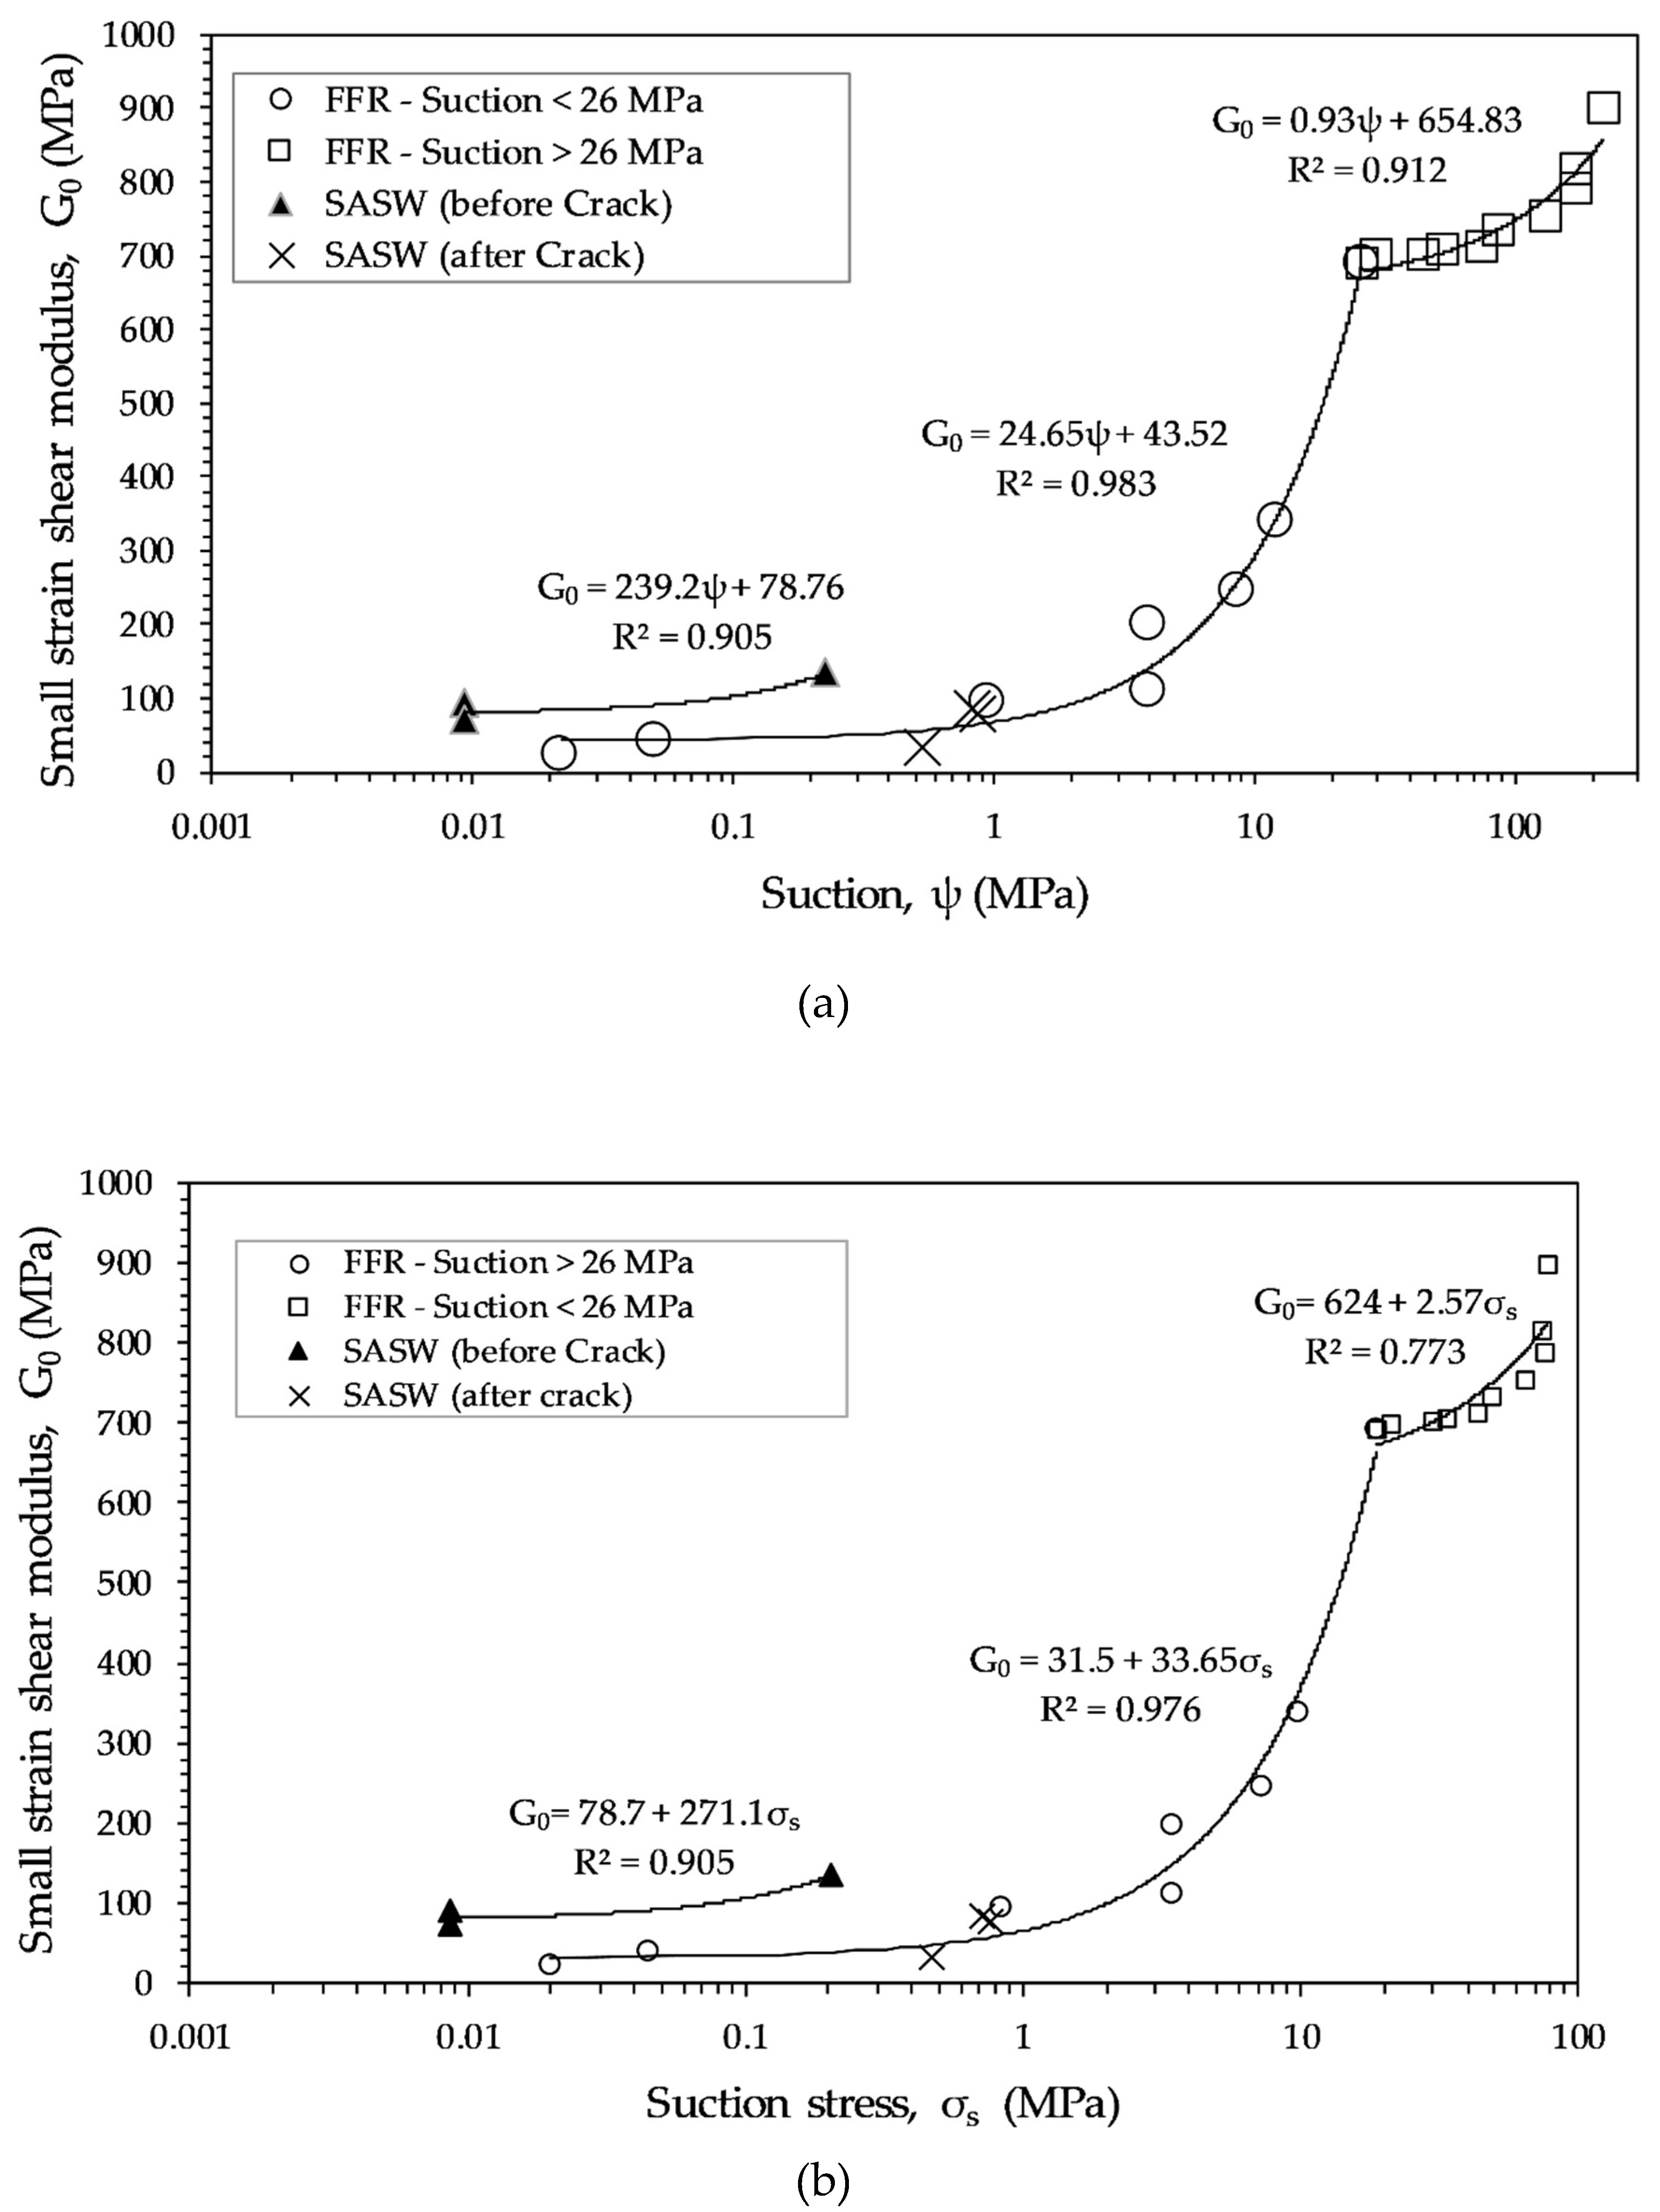
3.5. Suction–Small-Strain Shear Modulus Relationship
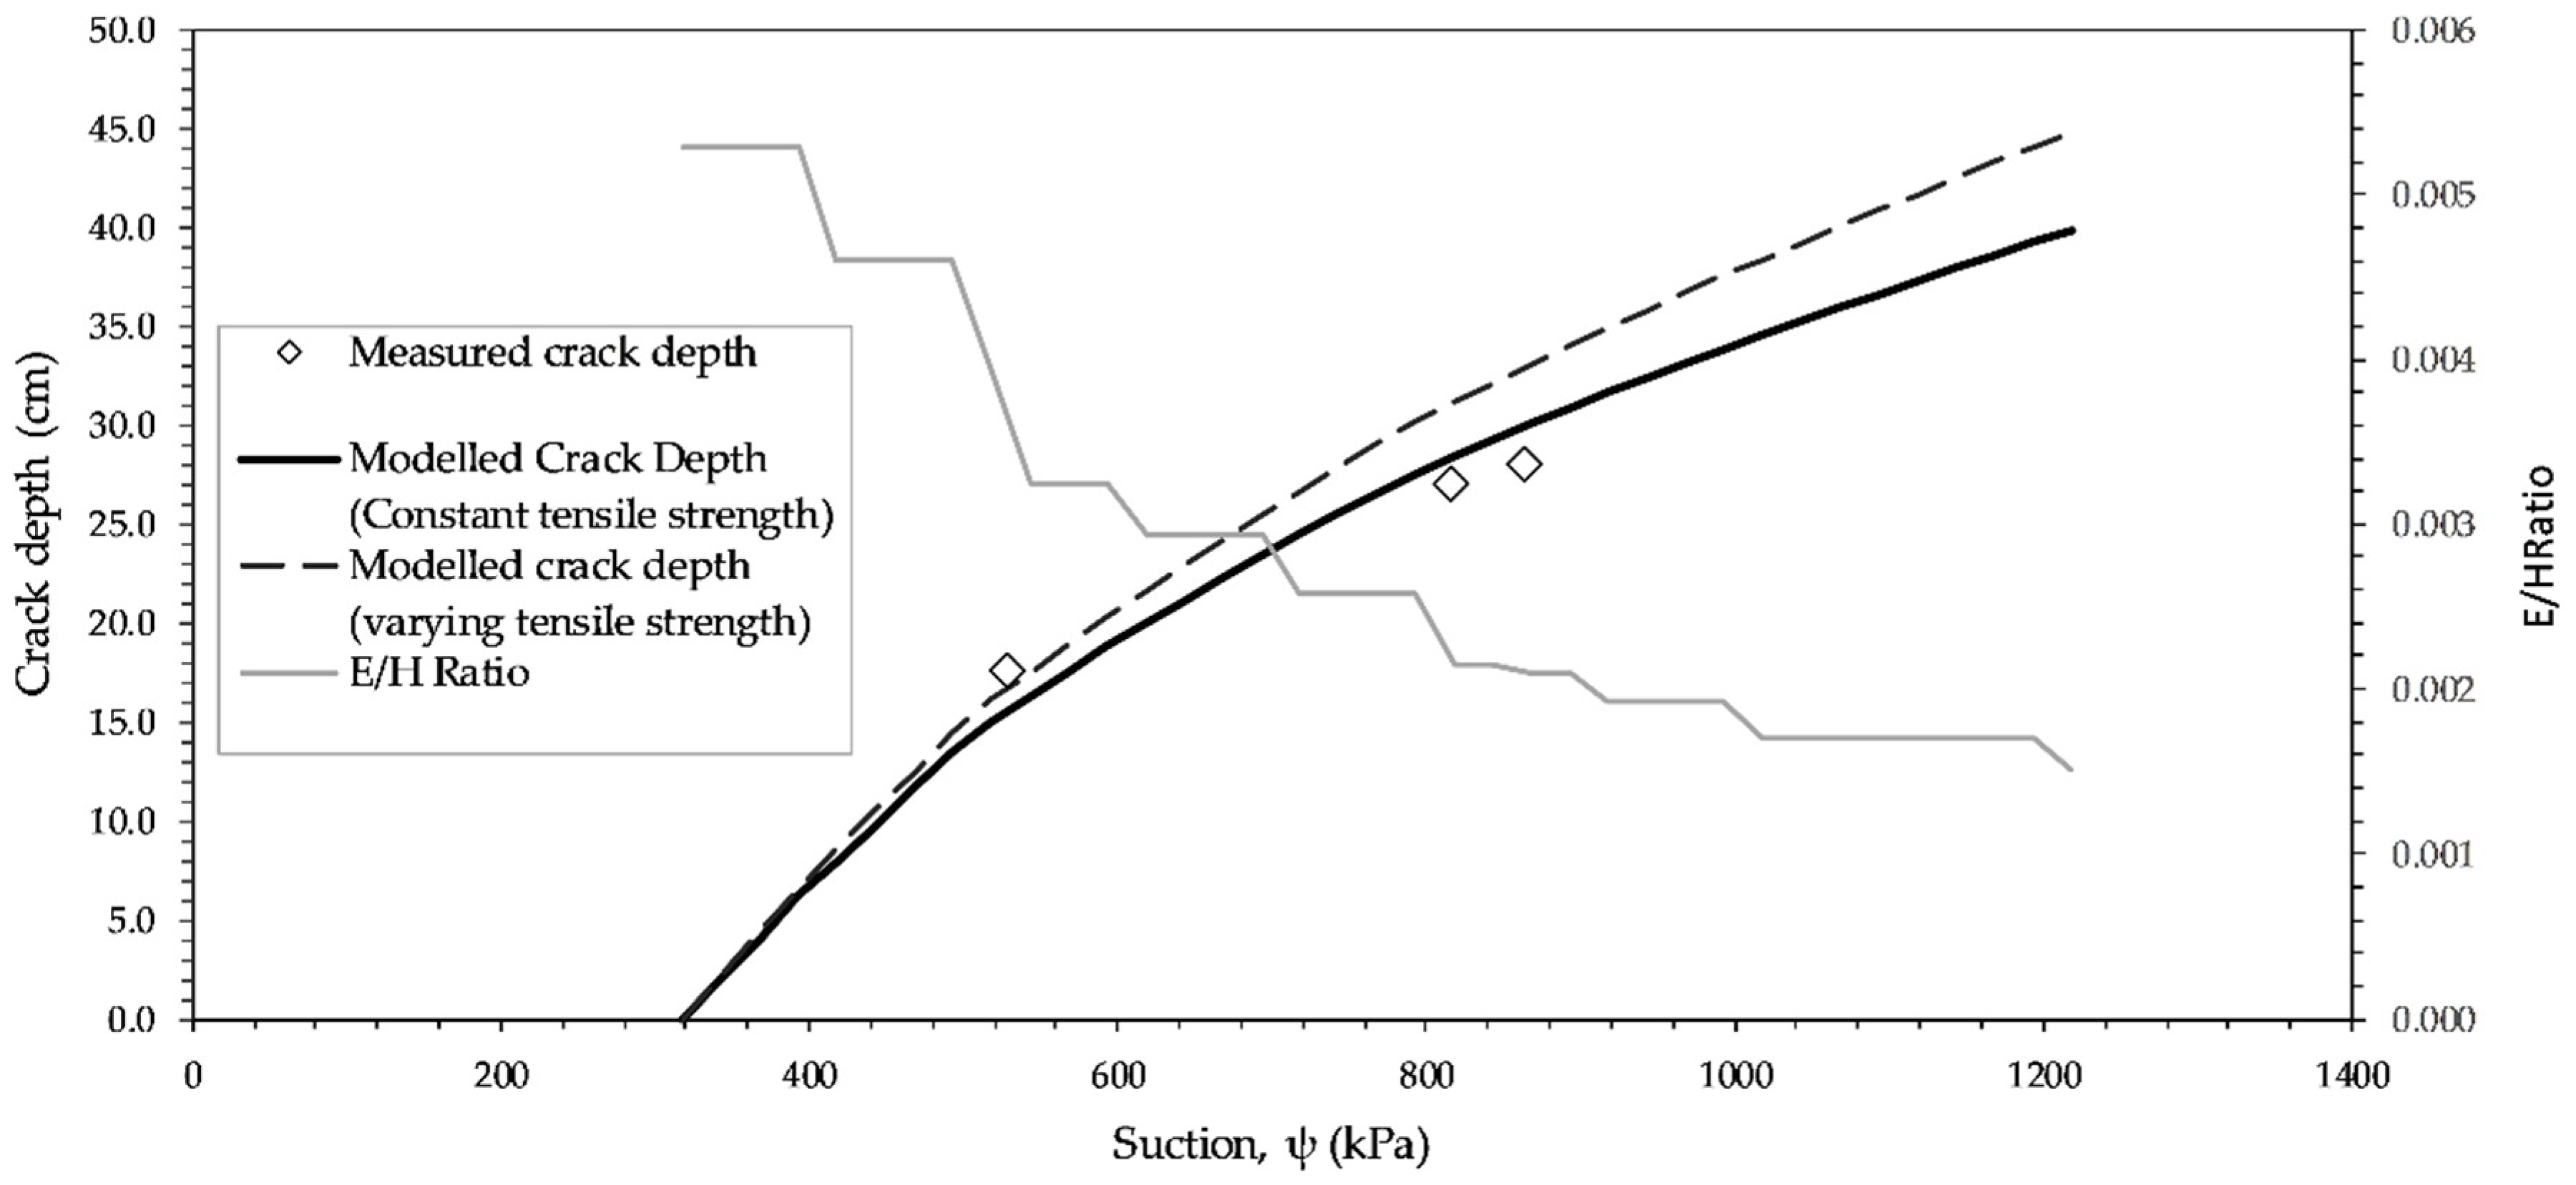
3.6. Modelling of Crack Depth
3.7. Potential Use of the Proposed Technique
4. Conclusions
Author Contributions
Funding
Acknowledgments
Conflicts of Interest
References
- Kaniraj, S.R.; Abdullah, H. Effect of berms and tension crack on the stability of embankments on soft soils. Soils Found. 1993, 33, 99–107. [Google Scholar] [CrossRef]
- Lee, F.H.; Lo, K.W.; Lee, S.L. Tension crack development in soils. J. Geotech. Eng. 1988, 114, 915–929. [Google Scholar] [CrossRef]
- Day, R.W.; Axten, G.W. Surficial stability of compacted clay slopes. J. Geotech. Eng. 1989, 115, 577–580. [Google Scholar] [CrossRef]
- Baker, R. Tensile strength, tension cracks, and stability of slopes. Soils Found. 1981, 21, 1–17. [Google Scholar] [CrossRef]
- Morris, P.H.; Graham, J.; Williams, D.J. Cracking in drying soils. Can. Geotech. J. 1992, 29, 263–277. [Google Scholar] [CrossRef]
- Pufahl, D.; Fredlund, D.; Rahardjo, H. Lateral earth pressures in expansive clay soils. Can. Geotech. J. 1983, 20, 228–241. [Google Scholar] [CrossRef]
- Jotisankasa, A.; Vadhanabhuti, B.; Lousuphap, K.; Sawangsuriya, A. Mechanisms of Longitudinal Cracks Along Pavement Shoulder in Central Thailand. In Unsaturated Soils: Theory and Practice; Kasetsart University: Bangkok, Thailand, 2011; pp. 699–705. [Google Scholar]
- Albright, W.H.; Benson, C.H.; Gee, G.W.; Abichou, T.; Tyler, S.W.; Rock, S.A. Field performance of three compacted clay landfill covers. Vadose Zone J. 2006, 5, 1157–1171. [Google Scholar] [CrossRef]
- Inoubli, N.; Raclot, D.; Moussa, R.; Habaieb, H.; Le Bissonnais, Y. Soil cracking effects on hydrological and erosive processes: A study case in Mediterranean cultivated vertisols. Hydrol. Proc. 2016, 30, 4154–4167. [Google Scholar] [CrossRef]
- Prendergast, J.B. Soil water bypass and solute transport under irrigated pasture. Soil Sci. Soc. Am. J. 1995, 59, 1531–1539. [Google Scholar] [CrossRef]
- Wijesooriya, R.M.S.D. Modelling of desiccation crack depths in clay soils. Ph.D. Thesis, Monash University, Melbourne, Australia, December 2012. [Google Scholar]
- Fredlund, D.G.; Rahardjo, H. Soil Mechanics for Unsaturated Soils; John Wiley & Sons: Austin, TX, USA, 1993. [Google Scholar]
- Miller, C.J.; Mi, H.; Yesiller, N. Experimental analysis of desiccation crack propagation in clay liners 1. JAWRA J. Am. Water Resour. Assoc. 1998, 34, 677–686. [Google Scholar] [CrossRef]
- Amarasiri, A.L.; Kodikara, J.K.; Costa, S. Numerical modelling of desiccation cracking. Int. J. Numer. Anal. Methods Geomech. 2011, 35, 82–96. [Google Scholar] [CrossRef]
- Vo, T.D.; Pouya, A.; Hemmati, S.; Tang, A.M. Modelling desiccation crack geometry evolution in clayey soils by analytical and numerical approaches. Can. Geotech. J. 2018, 56, 720–729. [Google Scholar] [CrossRef]
- Jotisankasa, A.; Pramusandi, S.; Nishimura, S.; Chaiprakaikeow, S. Field Response of an Instrumented Dyke subjected to Rainfall. Geotech. Eng. J. SEAGS AGSSEA 2019, 50. [Google Scholar]
- Mairaing, W.; Jotisankasa, A.; Soralump, S. Some applications of unsaturated soil mechanics in Thailand: an appropriate technology approach. Geotech. Eng. 2012, 43, 1–11. [Google Scholar]
- Peck, R.B.; Hanson, W.E.; Thornburn, T.H. Foundation Engineering; Wiley: New York, NY, USA, 1974; Volume 10. [Google Scholar]
- Skempton, A. The colloidal activity of clays. Sel. Pap. Soil Mech. 1953, 106–118. [Google Scholar]
- Nelson, J.D.; Chao, K.C.; Overton, D.D.; Nelson, E.J. Foundation Engineering for Expansive Soils; Wiley Online Library: Austin, TX, USA, 2015. [Google Scholar]
- Chen, F.H. Foundations on Expansive Soils; Elsevier: Berkeley, CA, USA, 2012; Volume 12. [Google Scholar]
- Sawangsuriya, A.; Jotisankasa, A.; Anuvechsirikiat, S. Classification of Shrinkage and Swelling Potential of a Subgrade Soil in Central Thailand. In Unsaturated Soils: Research and Applications; Springer: New York, NY, USA, 2012; pp. 325–331. [Google Scholar]
- Jotisankasa, A.; Mairaing, W. Suction-monitored direct shear testing of residual soils from landslide-prone areas. J. Geotech. Geoenviron. Eng. 2009, 136, 533–537. [Google Scholar] [CrossRef]
- Barus, R.M.N.; Jotisankasa, A.; Chaiprakaikeow, S.; Sawangsuriya, A. Laboratory and field evaluation of modulus-suction-moisture relationship for a silty sand subgrade. Transp. Geotech. 2019, 19, 126–134. [Google Scholar] [CrossRef]
- Nazarian, S.; Stokoe, K.H. In Situ Determination of Elastic Moduli of Pavement Systems by Spectral-Analysis-of-Surface-Waves Method: Practical Aspects; The Center: Austin, TX, USA, 1985. [Google Scholar]
- Chaiprakaikeow, S.; Soponpong, C.; Sukolrat, J. Development of a Quality Control Index of Cement Stabilized Road Structures using Shear Wave Velocity. In Proceedings of the 2nd World Congress on Civil, Structural, and Environmental Engineering (CSEE’17), Barcelona, Spain, 2–4 April 2017; pp. ICGRE113-110–ICGRE113-111. [Google Scholar]
- Ismail, M.; Samsudin, A.; Rafek, A.; Nayan, K. Road pavement stiffness determination using SASW method. J. Civ. Eng., Sci. Technol. 2012, 3, 9–16. [Google Scholar] [CrossRef]
- Nazarian, S.; Stokoe, I.; Kenneth, H.; Briggs, R.C.; Rogers, R.C. Determination of Pavement Layer Thicknesses and Moduli by SASW Method; Transportation Research Board: Washington, DC, USA, 1988. [Google Scholar]
- Bay, J.A.; Chaiprakaikeow, S. Spectral Analysis of Surface Waves (SASW) testing of Sirikit and Rajjaprabha Dams. In Electricity Generating Authority of Thailand (EGAT) Report, Bangkok, Thailand; Electricity Generating Authority of Thailand: Nonthaburi, Thailand, 2009. [Google Scholar]
- Chaiprakaikeow, S.; Bay, J.A.; Chaowalittrakul, N. Study of Dynamic Properties of Mae Chang Dam using Spectral Analysis of Surface Waves and Resonance Tests. In Proceedings of the 21th National Convention on Civil Engineering, Songkla, Thailand, 28–30 June 2016. [Google Scholar]
- Chaiprakaikeow, S.; Bay, J.A.; Chaowalittrakul, N.; Brohmsubha, P. Evaluation of the Effect of Concrete Blocks on Seismic Response of Bhumibol Dam using In-Situ Dynamic Tests. In Proceedings of the 85th Annual Meeting of International Commission on Large Dams (ICOLD2017), Prague, Czech Republic, 3–7 July 2017. [Google Scholar]
- Bay, J.A.; Chaiprakaikeow, S. Spectral Analysis of Surface Waves (SASW) testing of Srinakarind and Vajiralongkorn Dams. In Electricity Generating Authority of Thailand (EGAT) Report, Bangkok, Thailand; Electricity Generating Authority of Thailand: Nonthaburi, Thailand, 2006. [Google Scholar]
- Joh, S.H.; Stokoe, K.H. Advances in Interpretation and Analysis Techniques for Spectral-Analysis-of-Surface-Waves (SASW) Measurements; Offshore Technology Research Center: College Station, TX, USA, 1997. [Google Scholar]
- De FN Gitirana, G., Jr.; Fredlund, D.G. Soil-water characteristic curve equation with independent properties. J. Geotech. Geoenviron. Eng. 2004, 130, 209–212. [Google Scholar] [CrossRef]
- Mendoza, C.; Colmenares, J.; Merchan, V. Stiffness of an unsaturated compacted clayey soil at very small strains. In Proceedings of the International Symposium on Advanced Experimental Unsaturated Soil Mechanics, Trento, Italy, 27–29 June 2005; pp. 199–204. [Google Scholar]
- Kaewsong, R.; Zhou, C.; Ng, C. Modelling effects of recent suction history on small-strain stiffness of unsaturated soil. Can. Geotech. J. 2018, 56, 1–11. [Google Scholar] [CrossRef]
- Lu, N.; Likos, W.J. Suction stress characteristic curve for unsaturated soil. J. Geotech. Geoenviron. Eng. 2006, 132, 131–142. [Google Scholar] [CrossRef]
- Hardin, B.O.; Richart, F., Jr. Elastic wave velocities in granular soils. J. Soil Mech. Found. Div. 1963, 89, 3407. [Google Scholar]
- Sorensen, K.K.; Baudet, B.; Simpson, B. Influence of strain rate and acceleration on the behaviour of reconstituted clays at small strains. Géotechnique 2010, 60, 751. [Google Scholar] [CrossRef]
- Santos, J.; Correia, A.G. Shear modulus of soils under cyclic loading at small and medium strain level. In Proceedings of the 12th World Conference on Earthquake Engineering, Auckland, New Zealand, 30 January–4 February 2000. [Google Scholar]
- Khosravi, A.; Shahbazan, P.; Pak, A. Impact of hydraulic hysteresis on the small strain shear modulus of unsaturated sand. Soils Found. 2018, 58, 344–354. [Google Scholar] [CrossRef]
- Sawangsuriya, A.; Edil, T.B.; Bosscher, P.J. Modulus-suction-moisture relationship for compacted soils in postcompaction state. J. Geotech. Geoenviron. Eng. 2009, 135, 1390–1403. [Google Scholar] [CrossRef]
- Hardin, B.O. The nature of stress-strain behavior for soils. In Proceedings of the ASCE Geotechnical Engineering Division Specialty Conference, Pasadena, CA, USA, 19–21 June 1978. [Google Scholar]
- Miller, G.; Hassanikhah, A.; Varsei, M. Desiccation crack depth and tensile strength in compacted soil. In Proceedings of the 6th Asia Pacific Conference on Unsaturated Soils, Guilin, China, 23–26 October 2015. [Google Scholar]
- Picornell, M.; Lytton, R.L. Field measurement of shrinkage crack depth in expansive soils. Transp. Res. Rec. 1989, 1219, 121–130. [Google Scholar]


| Depth of Soil Sample Taken from on Top of the Embankment | Gravel (%) | Sand (%) | Silt (%) | Clay (%) | Liquid Limit (LL) % | Plasticity Index (PI) | Shrinkage Limit (SL) % | USCS |
|---|---|---|---|---|---|---|---|---|
| (>4.75 mm) | (4.75–0.074 mm) | (0.074–0.002 mm) | (<0.002 mm) | |||||
| 0.0–0.5 m | 12.0 | 22.8 | 23.9 | 41.3 | 43.8 | 22.4 | 13.5 | CL |
| Month | Crack Depth (cm) | Suction (kPa) |
|---|---|---|
| 09 January | 17.5 | 527.3 |
| 15 February | 27.0 | 815.9 |
| 29 March | 28.0 | 863.0 |
| 28 April | - | 167.9 |
| Fitting Parameters | ||||||||
|---|---|---|---|---|---|---|---|---|
| 0.05 | 3.5 | 12 | 0.85 | 8500 | 0.8 | 365621 | 0.007 | 0.94 |
| G0— Relationship | C | D (MPa) | R2 |
|---|---|---|---|
| SASW (before crack) | 271.1 | 78.7 | 0.905 |
| FFR ( = 0.02–26 MPa) | 33.65 | 31.5 | 0.976 |
| FFR ( = 26–220 MPa) | 2.57 | 624 | 0.773 |
| Properties | Values | Units |
|---|---|---|
| Suction value at the onset of crack | 318 | kPa |
| H modulus at that suction | 9683 | kPa |
| k0 | 0.53 | - |
| Poisson’s ratio, µ | 0.35 | - |
| Young’s Modulus, E (large-strain) | 650 | kPa |
| Total unit weight, γ | 18.3 | kN/m3 |
| σt/(k0*γ) | 3.36 | m |
© 2019 by the authors. Licensee MDPI, Basel, Switzerland. This article is an open access article distributed under the terms and conditions of the Creative Commons Attribution (CC BY) license (http://creativecommons.org/licenses/by/4.0/).
Share and Cite
Shrestha, A.; Jotisankasa, A.; Chaiprakaikeow, S.; Pramusandi, S.; Soralump, S.; Nishimura, S. Determining Shrinkage Cracks Based on the Small-Strain Shear Modulus–Suction Relationship. Geosciences 2019, 9, 362. https://doi.org/10.3390/geosciences9090362
Shrestha A, Jotisankasa A, Chaiprakaikeow S, Pramusandi S, Soralump S, Nishimura S. Determining Shrinkage Cracks Based on the Small-Strain Shear Modulus–Suction Relationship. Geosciences. 2019; 9(9):362. https://doi.org/10.3390/geosciences9090362
Chicago/Turabian StyleShrestha, Avishek, Apiniti Jotisankasa, Susit Chaiprakaikeow, Sony Pramusandi, Suttisak Soralump, and Satoshi Nishimura. 2019. "Determining Shrinkage Cracks Based on the Small-Strain Shear Modulus–Suction Relationship" Geosciences 9, no. 9: 362. https://doi.org/10.3390/geosciences9090362