Application of Cross-Hole Tomography for Assessment of Soil Stabilization by Grout Injection

JSC “Scientific Research, Design and Survey Institute” Lenmetrogiprotrans”, Saint Petersburg 191002, Russia
*
Authors to whom correspondence should be addressed.
Geosciences 2019, 9(9), 399; https://doi.org/10.3390/geosciences9090399
Submission received: 14 June 2019
/
Revised: 2 September 2019
/
Accepted: 9 September 2019
/
Published: 13 September 2019
Abstract
:Currently, the spread of megalopolises poses an ever-increasing necessity for underground space development for the purpose of the arrangement of transport communications, underground parking areas, trade areas, etc. The implementation of such projects entails a significant increase in the risk of accidents and damage to existing buildings within construction activity influence areas. The reduction of the risk of accidents during the construction of underground facilities within urban areas may only become possible with the identification of adverse factors negatively influencing existing buildings or a facility under erection and elaboration (to reduce such negative influence). The application of geophysical methods in complex assessments of the actual state of an encompassing mass significantly increases efficiency and the credibility of geotechnical monitoring. The application of seismic tomography significantly increases the resolution capability of surveys. Existing techniques, e.g., seismic tomography, allow for any depths to be investigated at a high resolution, even given constricted urban conditions. This article covers the practical applications of seismic tomography in qualitative assessments of actions and an efficiency evaluation of the injective stabilization of soil.
1. Introduction
The construction of complicated underground facilities such as underground stations involving multistage rock tunneling and the motorization complexity of rock tunneling activities is associated with the occurrence of significant ground subsidence. Buildings that are located within the construction activity influence area are exposed to strains that can lead to their collapse. Over many years, this has remained a vital issue for Saint Petersburg and other megalopolises [1,2].
Even a shallow depth of underground stations (60–80 meters) entails a relatively significant risk of large-scale ground subsidence across several hectares of urban area. The existing technologies of the construction of underground station facilities and sloped escalator tunnels lead to the deformation of the upper layer of soil and buildings/premises resting upon it, which sometimes entails a reduction in the strength of such structures and their consequent decommissioning [3]. For this, there is no possibility of protecting existing buildings from a strain development source with help enclosure structures or to set such buildings on piles with load transmissions to the soil layers below the underground facility under construction Other known methods of strengthening civil structures and basement soil also cannot guarantee that no deformations of these buildings occur [4,5,6,7,8,9].
Reduction of the ground surface deformation is achieved by undertaking actions involving injective grouting into the building base (preventive soil stabilization and compensative injections given non-uniform subsidence) located within the influence area of underground facilities under construction.
Techniques of injection action have widely and unambiguously proven their efficiency throughout the world, including in Russia [5,10,11,12,13,14,15]. Control of their implementation is usually carried out through geodetic monitoring using hydrostatic leveling sensors [12]. However, in this case, compensative actions are started only upon completion of the identification of all deformations. A lapse of time in this case may be critical.
Under such circumstances, the main task is the timely conduction of actions for filling any decompaction zones to prevent possible subsidence of the building. Making reasonable decisions regarding the determination places of stabilization as well as the amount and composition of grout mixtures is also important.
Another significant factor in building subsidence mitigation consists of analysis of grouting activity quality. Since grout mixtures go down the paths posing the lowest resistance to their flow, it is not sufficient to just count on theoretically correct organization of works. While having many advantages, the injective stabilization of soil has some shortages. The main shortage is the impossibility of predicting the obtained amounts, strength, and water impermeability of stabilized soil after grouting. There are some known cases where injective stabilization was followed by digging special check pit-holes to investigate the structure and condition of the stabilized soil, and these checks revealed nonconformity with the design expectations: the stabilized soil was not continuous (the stabilization zones represented separate monoliths that varied in size and scale mainly within the borehole location area) [16,17,18,19]. This has determined the necessity for observations allowing for the qualitative control of performed grouting actions. Such control can be implemented by means of seismic tomography in a version of cross-hole seismic tomography.
The application of seismic methods for solutions to these tasks is regarded as an advantageous approach mainly due to its economic benefits, mobility, performance rate, and, most importantly, the high correlation between seismic wave propagation velocity and the physical–mechanical properties of surveyed soil. First, the cross-hole seismic tomography method eliminates depth-related restrictions during observations compared to the surface methods, which allows for the conduction of surveys down in deep depths even given constricted conditions within an urban area. Second, it significantly increases the resolution capability of observations.
The main physical reason for using seismic methods to qualitatively control grouting is an obvious difference between values of seismic wave propagation velocity in loose sand and rocky or semirocky soil, such as sandstone. The structure of stabilized soil resembles compacted sedimentary rocks. Seismic wave velocity in stabilized soil always exceeds that in unstabilized soil. Factors influencing the longitudinal wave propagation velocity variation also affect the physical–mechanical properties of stabilized soil. This is why a soil stabilization quality assessment in the first approximation can be performed based on seismic wave variations while considering that given the maximum saturation, e.g., the saturation of sand with a grout mixture, the longitudinal wave velocity in the sand can reach 3.0 km/s. At that, zones that due to any reason totally or partially lack the grout mixture can be detected due to a decreased velocity increment that sometimes can be equal to or even below zero (in the case of decompaction).
To date, there are papers available that have been dedicated to the results of the application of cross-hole seismic tomography to an efficiency assessment of soil stabilization actions [20,21] as well as to the experience of applications of cross-hole seismic tomography in the assessment of the continuity of artificial retaining structures of the “slurry wall” type [22,23].
2. Survey Methods
The main idea of a cross-hole seismic survey consists of learning a subject medium through seismic rays to consequently plot a map of seismic wave propagation velocities. The results of such a survey have been proven to be useful for solutions of a wide range of engineering tasks.
The advantage of borehole-based seismic methods, compared to surface-based surveys, is that sources and receivers operate closely to the investigated structure and seismic signals are not distorted by traveling through highly heterogeneous and attenuated near-surface layers.
The seismic tomography principle consists of a solution to two basic mathematical problems: direct problems and reverse problems.
The direct problem solution ensures positive and effective radial tracing within models of a subject medium.
The inverse problem solution contains restrictions on the selection of the sough function in accordance with the permissible geological models class.
To solve the inverse tomographic problem, we applied the conjugate gradients method (CG), which is an optimization method that belongs to the class of iterative procedures of linear search. Such an approach is now used in a lot of software implementing methods of seismic tomography.
The method in essence consists of the following: A reference model is selected as the initial approximation, which is followed by a calculation of several successive iterations so that an improved model of previous iteration is used as the reference at the next stage. At that, one of the important methodological issues during the conduction of iterative tomographic processing is the cessation criterion determination, since excessive iterations lead to degradation of the resultant solution quality.
The main indicator of necessity of the iterative processing continuation is the ratio between the actual mean square discrepancy of travel times and the first arrivals measurements inaccuracy. The reliability of a seismic tomography-based solution obtained by this method is mostly subject to correctness of the first approximation model. In practice, the first approximation quite often represents the topographic problem solution result for a homogeneous medium in terms of a given elastic waves velocity profile. In an interhole space investigation, there is almost always some apriori information in existence.
The solution fairness of the posed task is significantly influenced by observation system selection for cross-hole shooting. The method theory assumes that observation systems meet a mandatory requirement consisting of a tendency toward denser angular coverage of a medium under study by seismic ray trajectories [22,24,25,26].
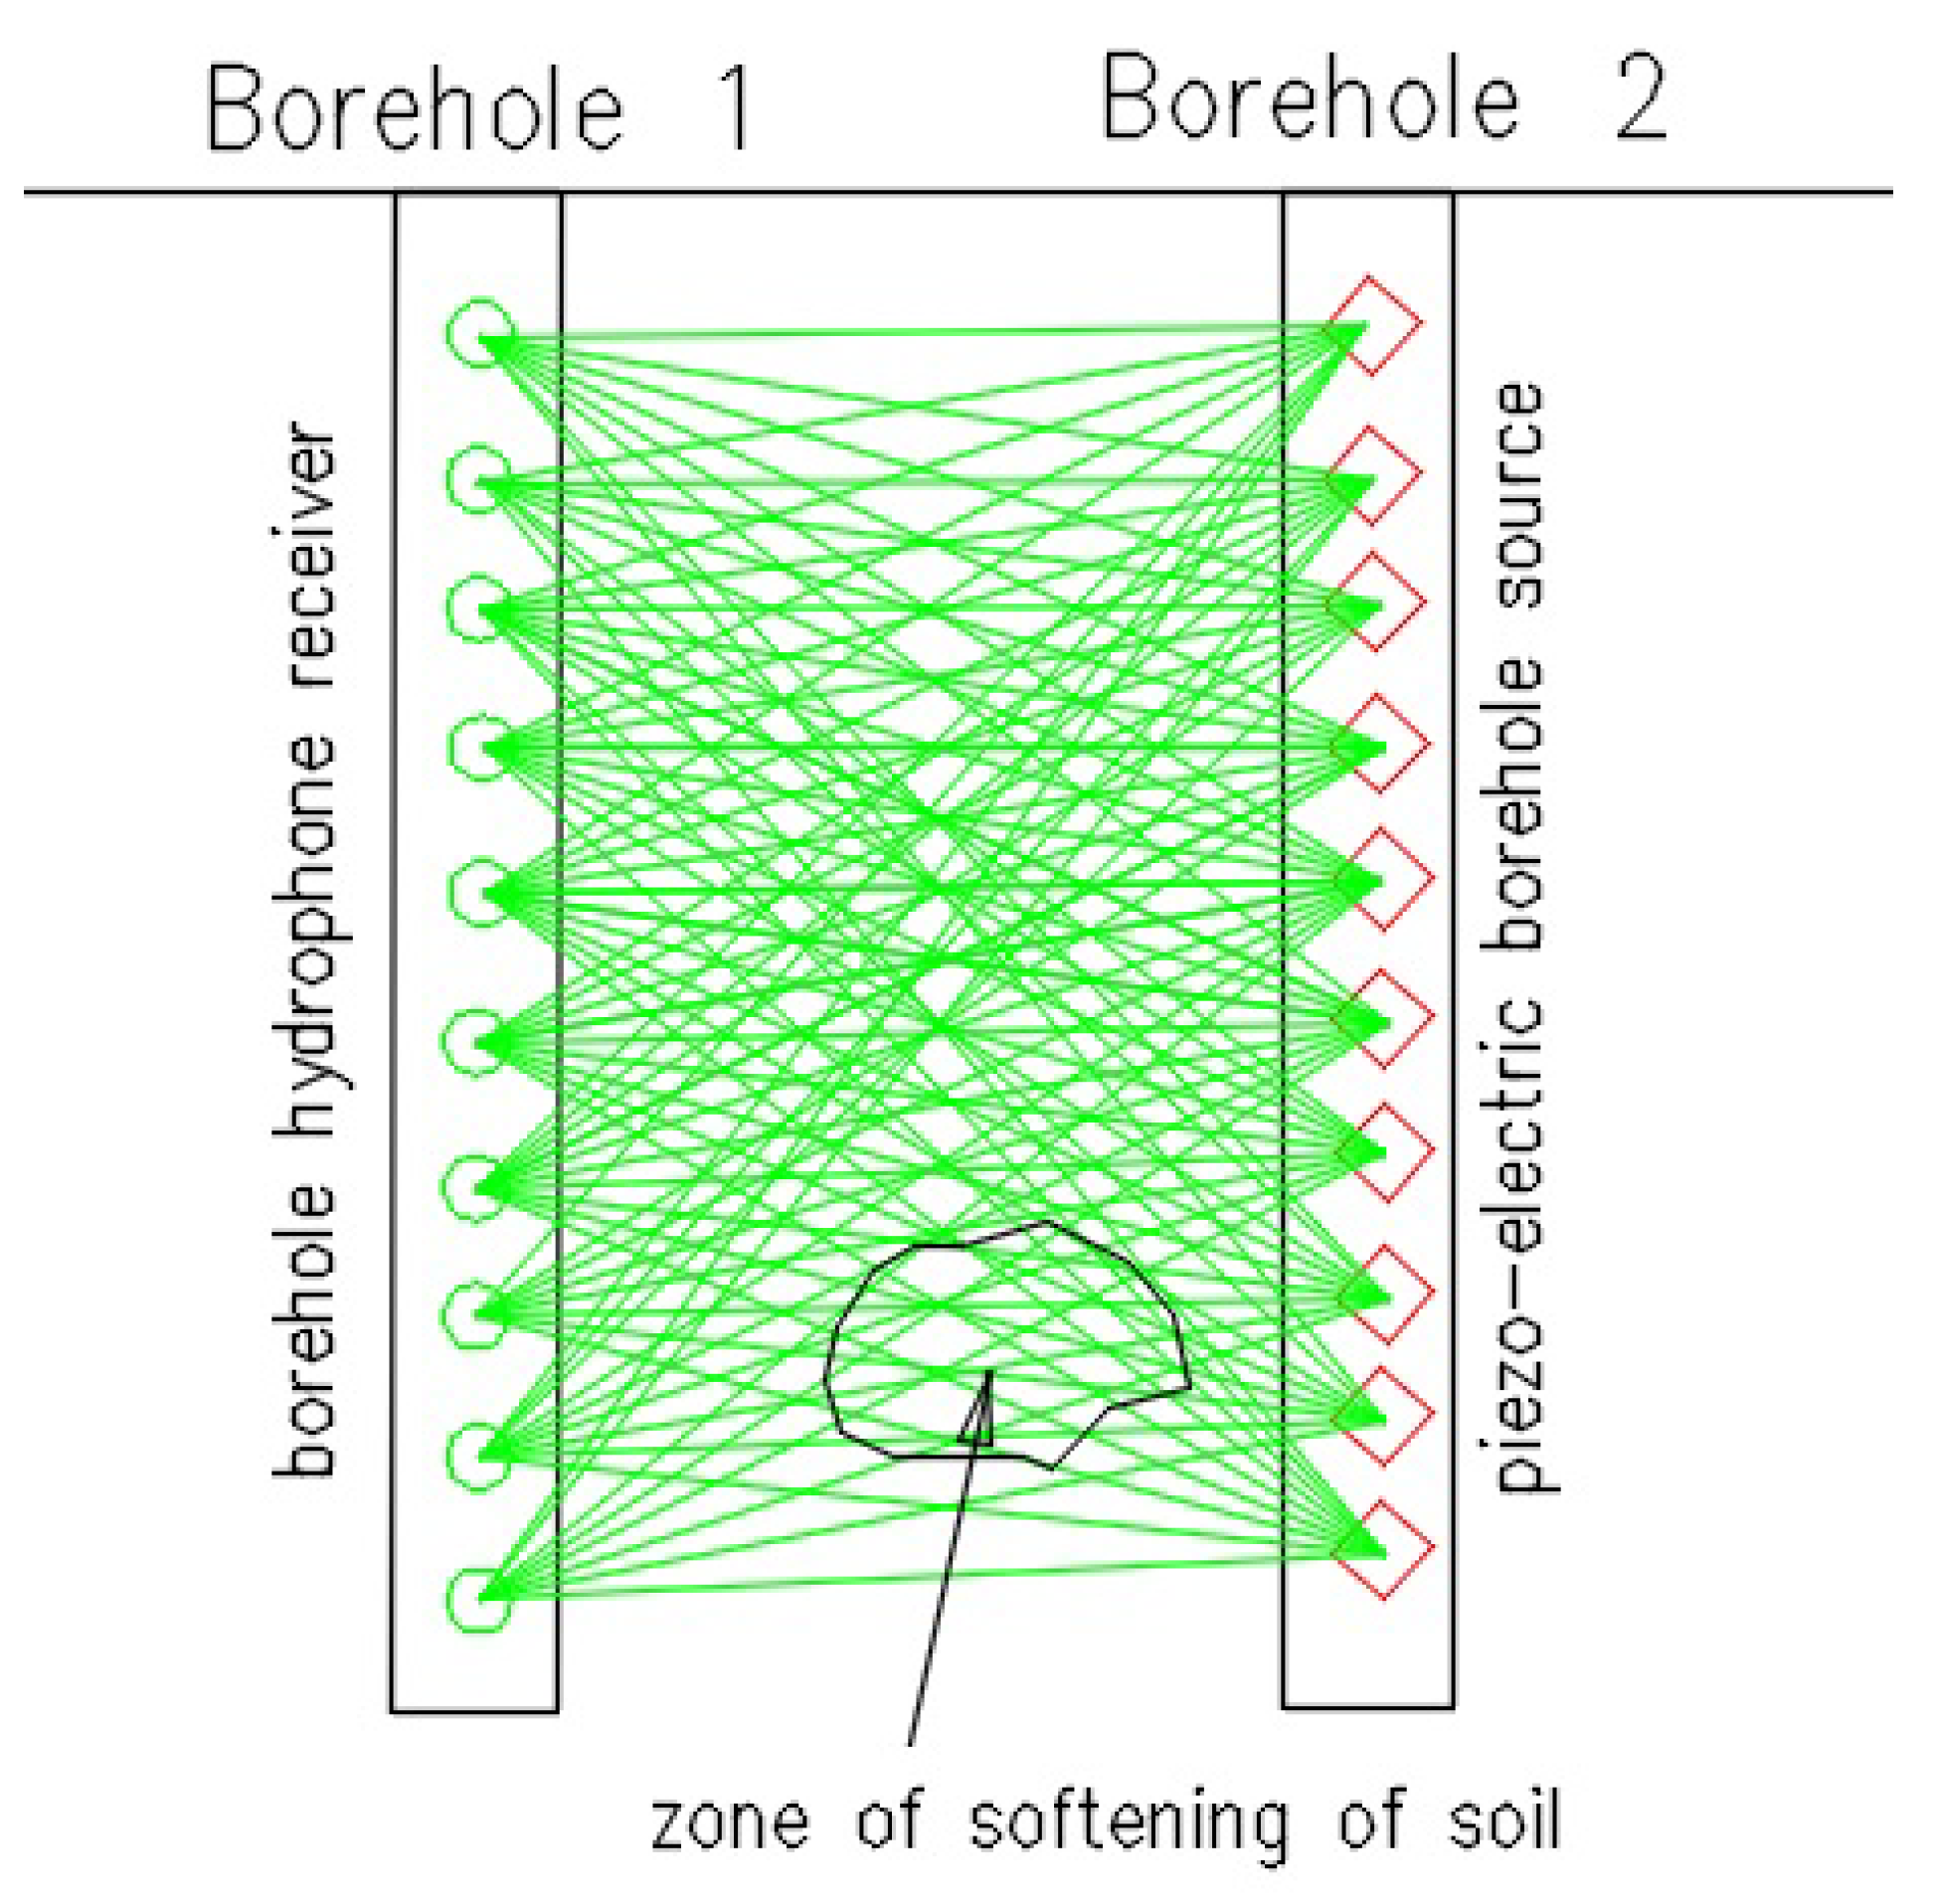
Studies within this research were conducted under the following parameters of the observation system (Figure 1):
- Receiver group interval (downhole disposition of hydrophones) of 1 m;
- Source point interval along borehole axis of 1 m;
- Interhole intervals of 3.8 m, 7.9 m, and 11.7 m;
- Quantity of active hydrophones at each position of a source of 10;
- Quantity of source positions along borehole axis of 10.
The hardware for cross-hole shooting during data production was relatively simple:
- A high-frequency seismic station (operating frequencies range: 1.75 Hz through 20 kHz);
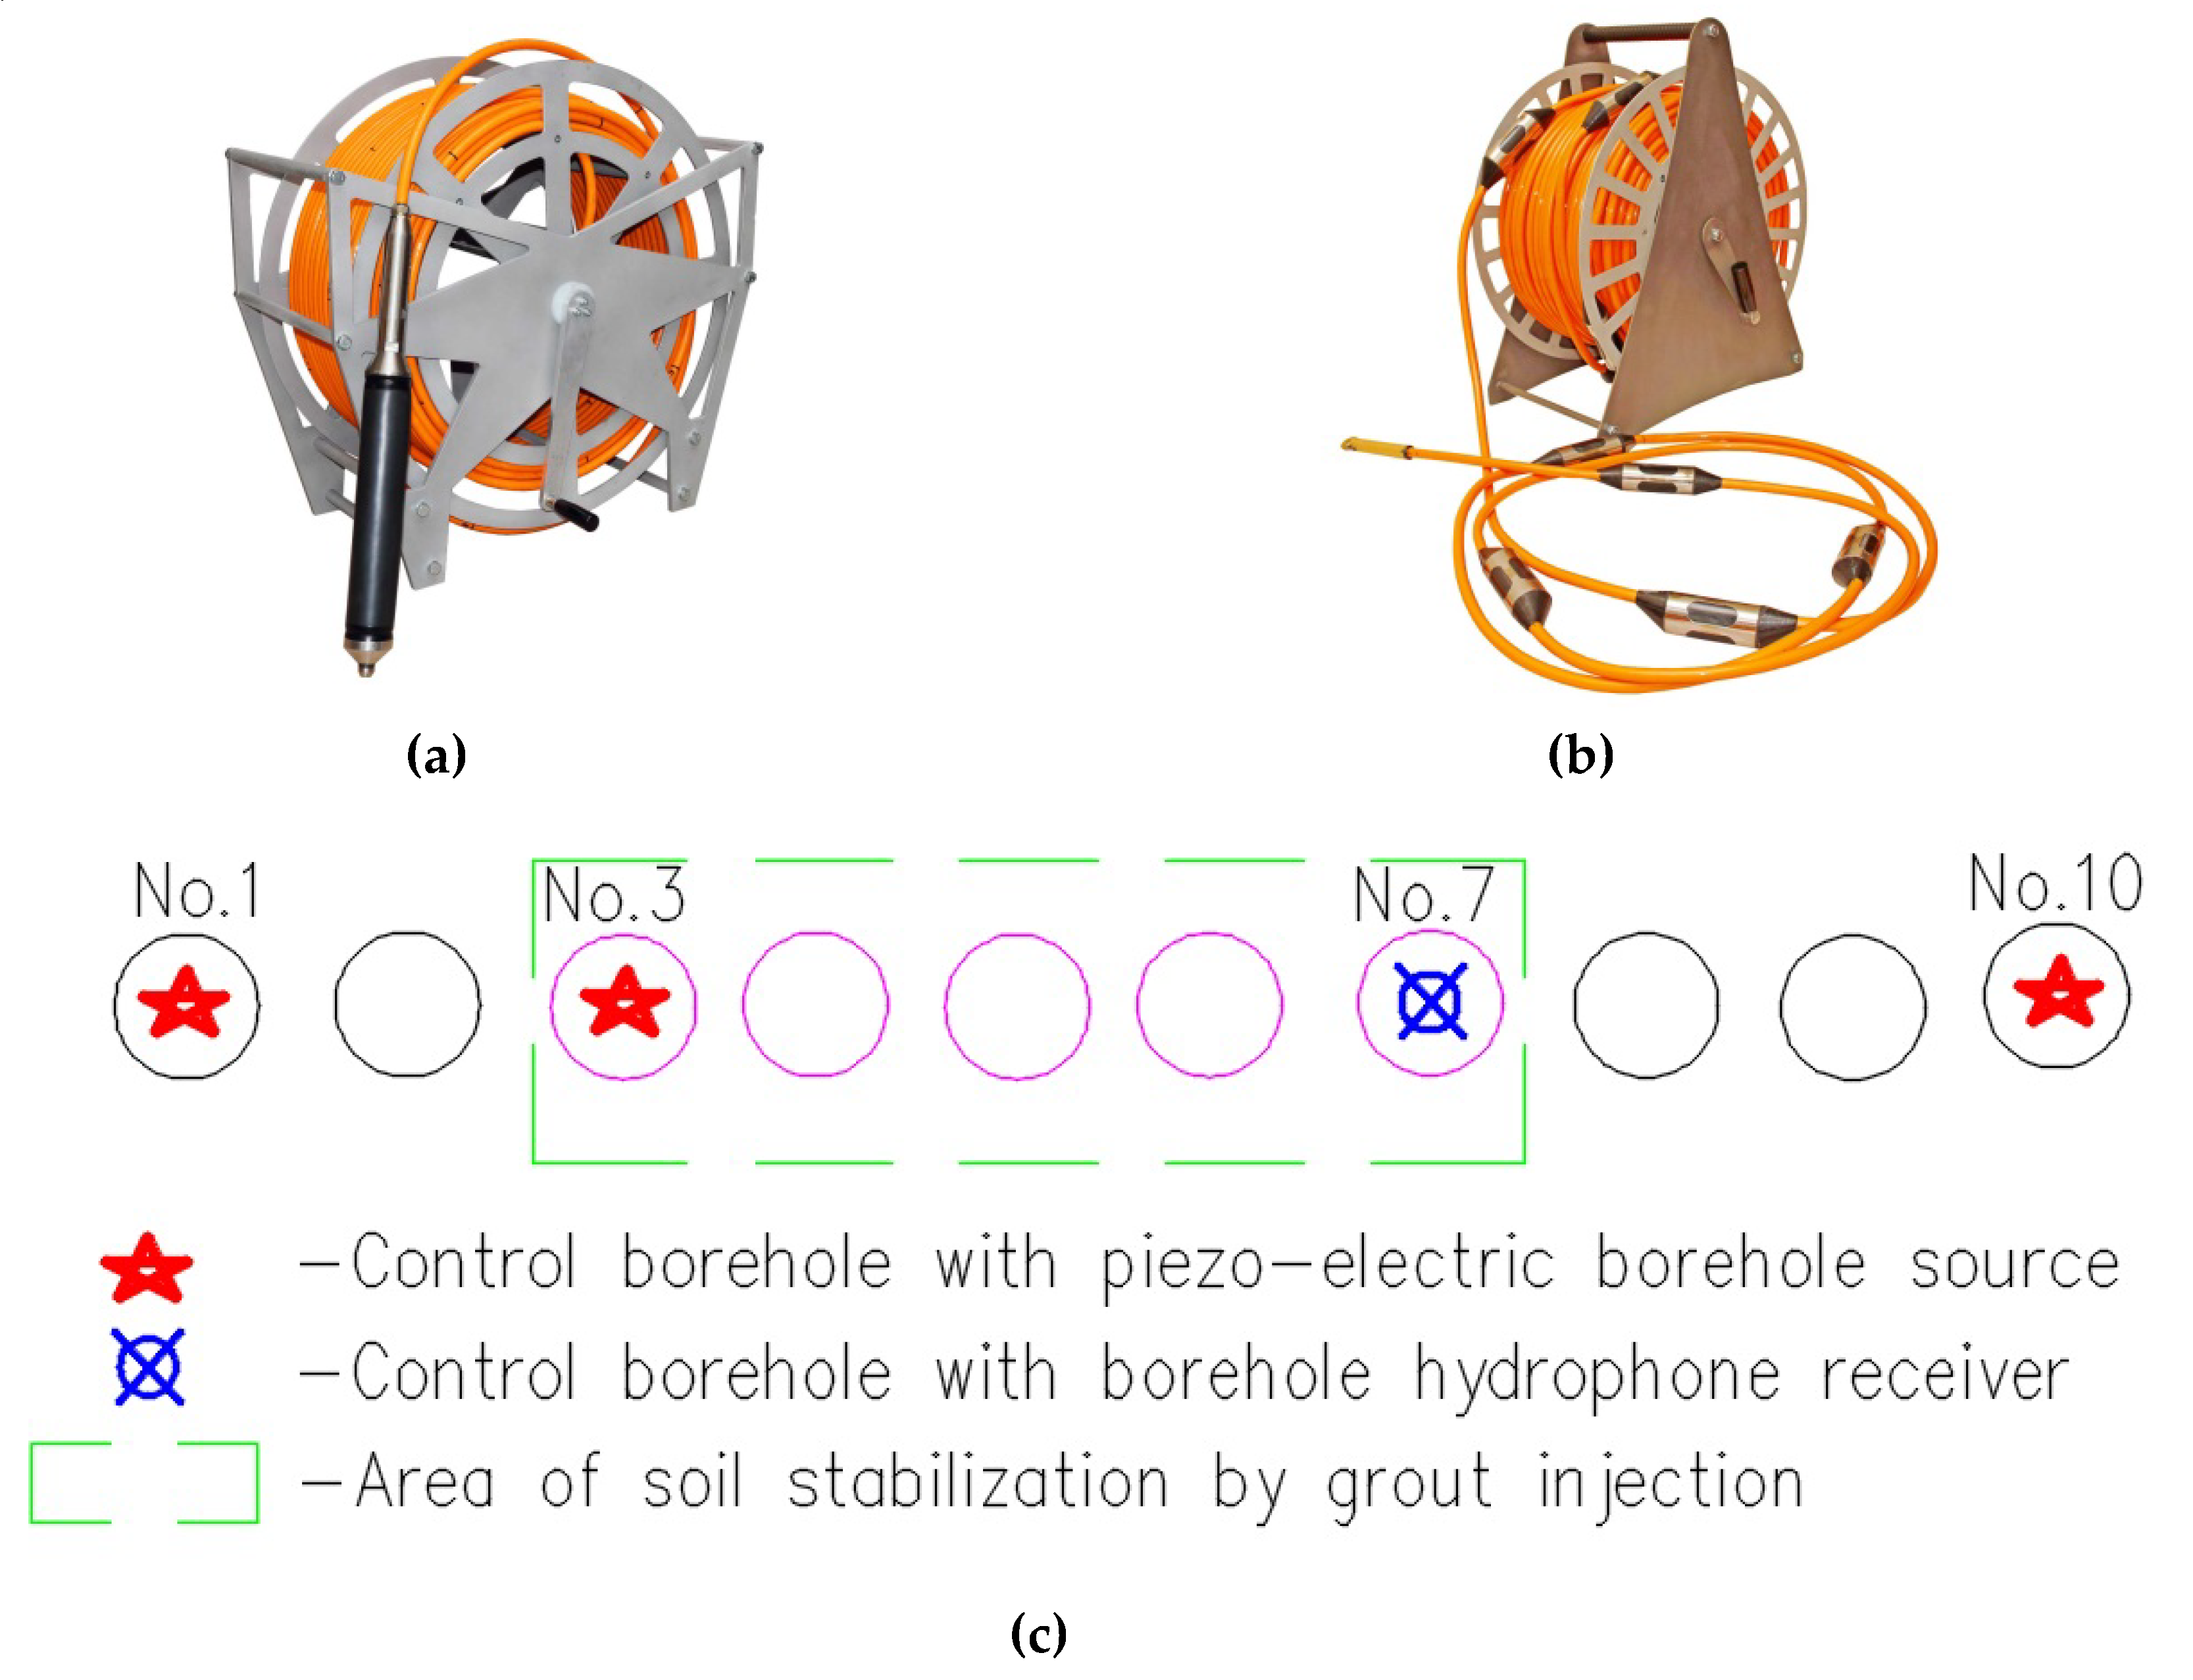
- A relatively lightweight cable line with 12 interrelated seismic chains and hydrophone modules (with an operating frequency range of 10 through 10,000 Hz and an instrument sensitivity of 180 ± 30 µV/Pa) (Figure 2b);
- An electric spark source set comprising energy storage (power of 1200 J) and a high-voltage cable line with a fixed electric spark source at the end, a so-called sparker (Figure 2b).
The use of a sparker and a hydrophone receiver gave the following benefits:
- A spherical chart of orientation of the source and receiver;
- A high frequency of signal (hundreds of hertz, 1–2 KHz), which ensured a high resolution;
- A high shooting speed.
To date, relevant hardware and software have already been developed to ensure the conduction of seismic tomography both with longitudinal (P) and transversal (S) waves [21,23,27,28,29,30,31,32]. However, field observations more often involve the generation and recording of longitudinal waves only (P). This is due to the relatively simple hardware and methodological implementation of observations, a high rate of work performance, and quite a quick processing of incoming data.
The physical limit of resolution capability in the seismic ray tomography method is commensurate with the size of the Fresnel zone h (1):
where is the wave length and is the ray length.
The use of Fresnel zone sizes for the evaluation of the resolution capability of seismic ray tomography is feasible in the presence of local and periodical anomalies of velocity. The detection of local velocity anomalies (single non-uniformities) is effective provided that their size is more or equal to the Fresnel zone diameter during the study of subhorizontal structures of a stratified earth [22,23,24]. However, it is worth mentioning that the qualitative study of the velocity anomalies structure is possible provided that the non-uniformity size is less than the Fresnel zone diameter, which is only possible with the condition of an ideal ray and angular coverage when the presence of a dense ray system is ensured. It is worth mentioning that this way of interpretation of seismic tomography also significantly increases the detail and resolution capability of surveys of fuzzy media arranged in a complicated way.
Eventually, cross-hole seismic tomography data processing is reduced to the acquisition of kinematic profiles characterizing structural features of a medium under study. At that, zones with medium characteristics somehow not corresponding to the design can be positively detected.
3. Results: Experiment on Cross-Hole Seismic Tomography for Assessment of Soil Stabilization by Grout Injection
Below, there is an example of the results of observations by way of cross-hole seismic tomography for the qualitative assessment of the injective stabilization of soil.
The experimental works involved the following actions and control methods:
- Drilling and preparation of injection boreholes located within a test site (Figure 3a), which were intended for passing an injected grout mixture. Boreholes No. 1, No. 3, No. 7, and No. 10 were used for cross-hole seismic tomography and an assessment of the real conditions of soil prior to the implementation of injective stabilization by way of interhole seismic tomography;
- Implementation of injective stabilization with a preliminarily prepared grout mixture being introduced into soil;
- Conduction of control observations by way of cross-hole seismic tomography for the evaluation of efficiency of the undertaken actions.
A design of manchette tubes in boreholes allowed for their multiple use both for repeated injection works and downhole geophysical surveys.
Grout mixture was injected into soil within the test site according to the following sequence: in turn in each borehole, from borehole No. 7 to borehole No. 3 (Figure 3a) along the borehole axis, the grout mixture injection was performed upwards at a pitch of 0.3 m.
The composition of the prepared grout mixture was as follows (per 1 m3 of the mixture): cement, 1200 kg; water, 560 L; liquid glass, 9.6 kg; superplasticizer, 2 kg.
According to designers’ analyses, this mixture, if injected in the amount of 0.11 m3·L at a pitch of 0.3 m into boreholes, increases the deformation characteristics of soil within the injection area (E0, deformation modulus) by at least 10%. At that, the continuity of the mass being formed is ensured.
Notwithstanding the design-assumed amount of the gout mix to be injected, the established procedure of injection was crucially violated with respect to borehole No. 7: within the depth range 9.3–9.0 m, the injected amount of grout mixture was 2.2 m3; within the depth range 8.7–6.0 m, the injected amount was 0.22 m3 in each stratum; within the depth range 6–2.7 m, the injected amount equaled the standard volume of 0.11m3 in each subject stratum.
In the case of subsequent boreholes (No. 3–No. 6), the injection was carried out within the depth range 9.3–4.5 m at a grout mixture average consumption rate of 0.22 m3 at each position of the packer.
An injection measure efficiency evaluation was carried out according to the following scheme (Figure 2a): a receiving cable with spaced hydrophone sensors with step 1 m was run in borehole No. 7 (~9.5 m deep), whereas in boreholes No. 1, No. 3, and No. 10, a downhole emitter was successively moved at a pitch of 1 m to generate seismic waves (Figure 2b).
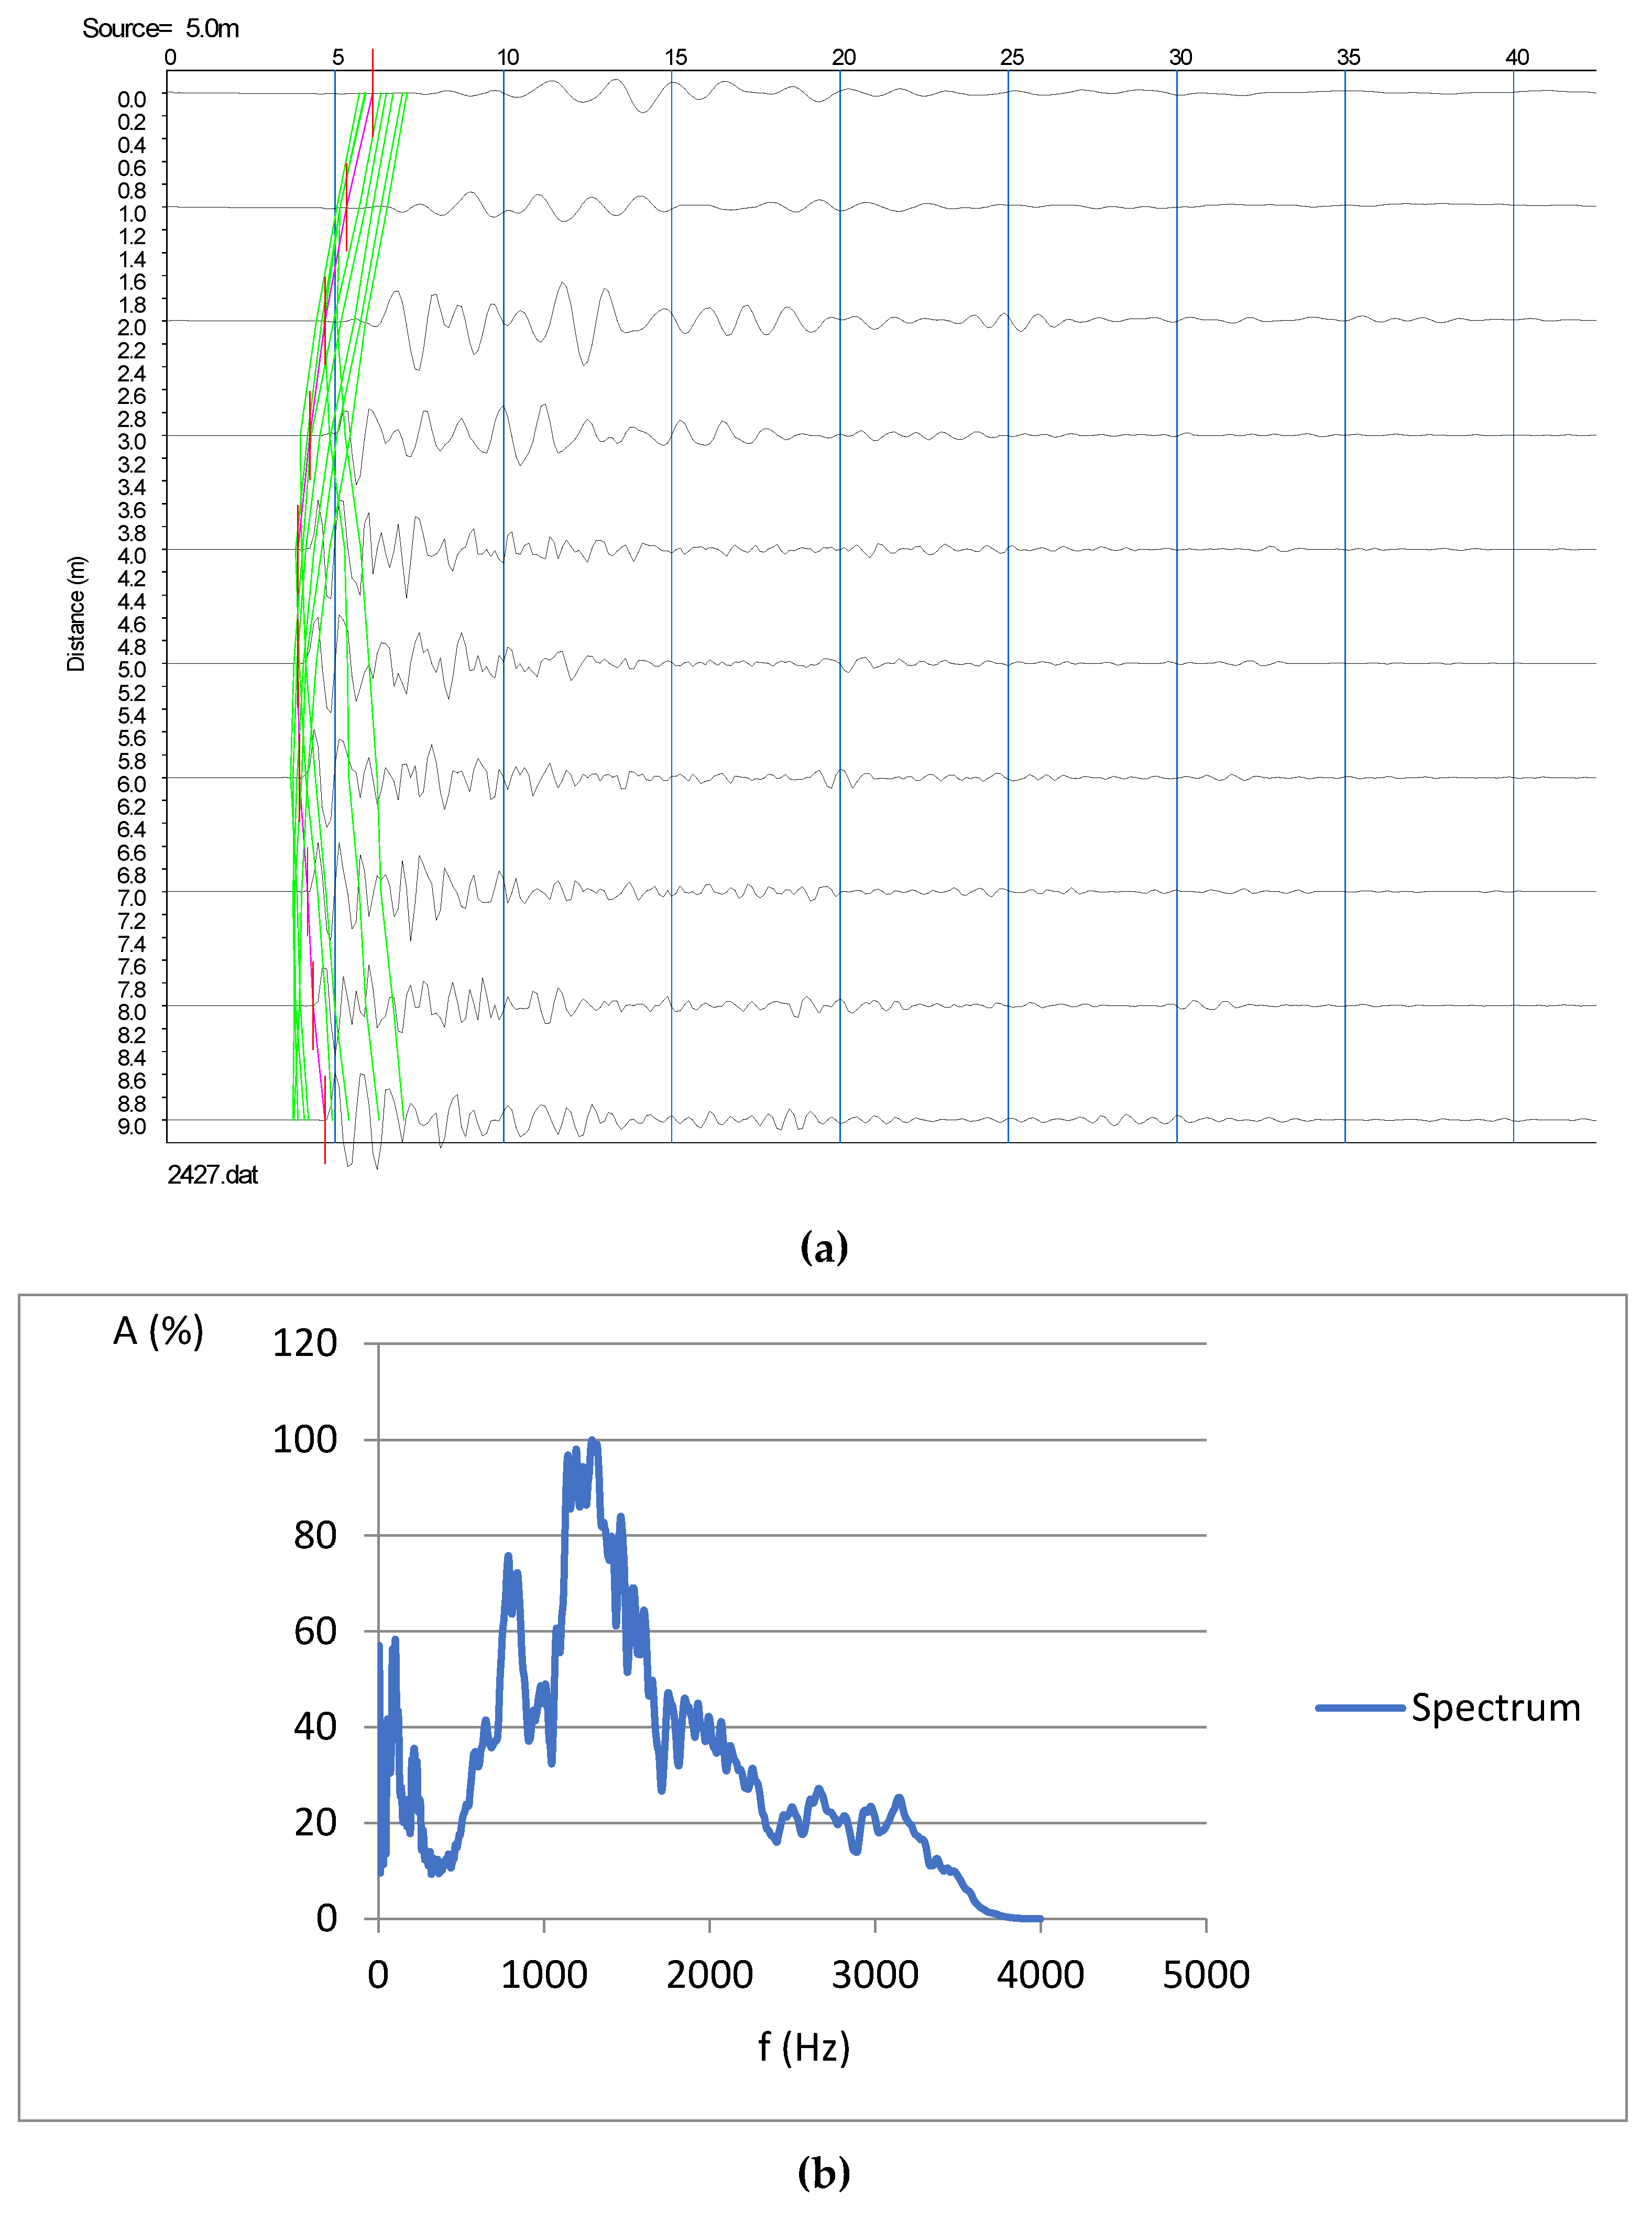
Figure 3 contains a seismic dataset fragment for one position of a sensor at a depth of 5 m. The distance between the emitting boreholes and the receiving one was 6.9 m.
The above sequence allowed for the detection of wave arrivals for each position of the source, in turn allowing for subsequent processing with consequent plotting of the kinematic profiles prior to and after soil body strengthening in the emitting borehole. Given the signal frequency and the wave travel velocity, it can be asserted that the survey resolution ranged within 1.5–2.0 m. Tomographic processing of data was performed by means of the software complex Firstomo (version 2.2e), with the quantity of cells along X = 22 units and along Y = 25 units. During the processing, the mean square discrepancy (the value equal to the difference Tobs – Tcalc, where Tobs is the experimental travel time and Tcalc is the theoretical travel time) was -0.638. Graphical representation of the data was performed by means of Surfer software (version 15.5.382) with the application of the method “Triangulation with Linear Interpolation”, which allowed for mathematical simulation.
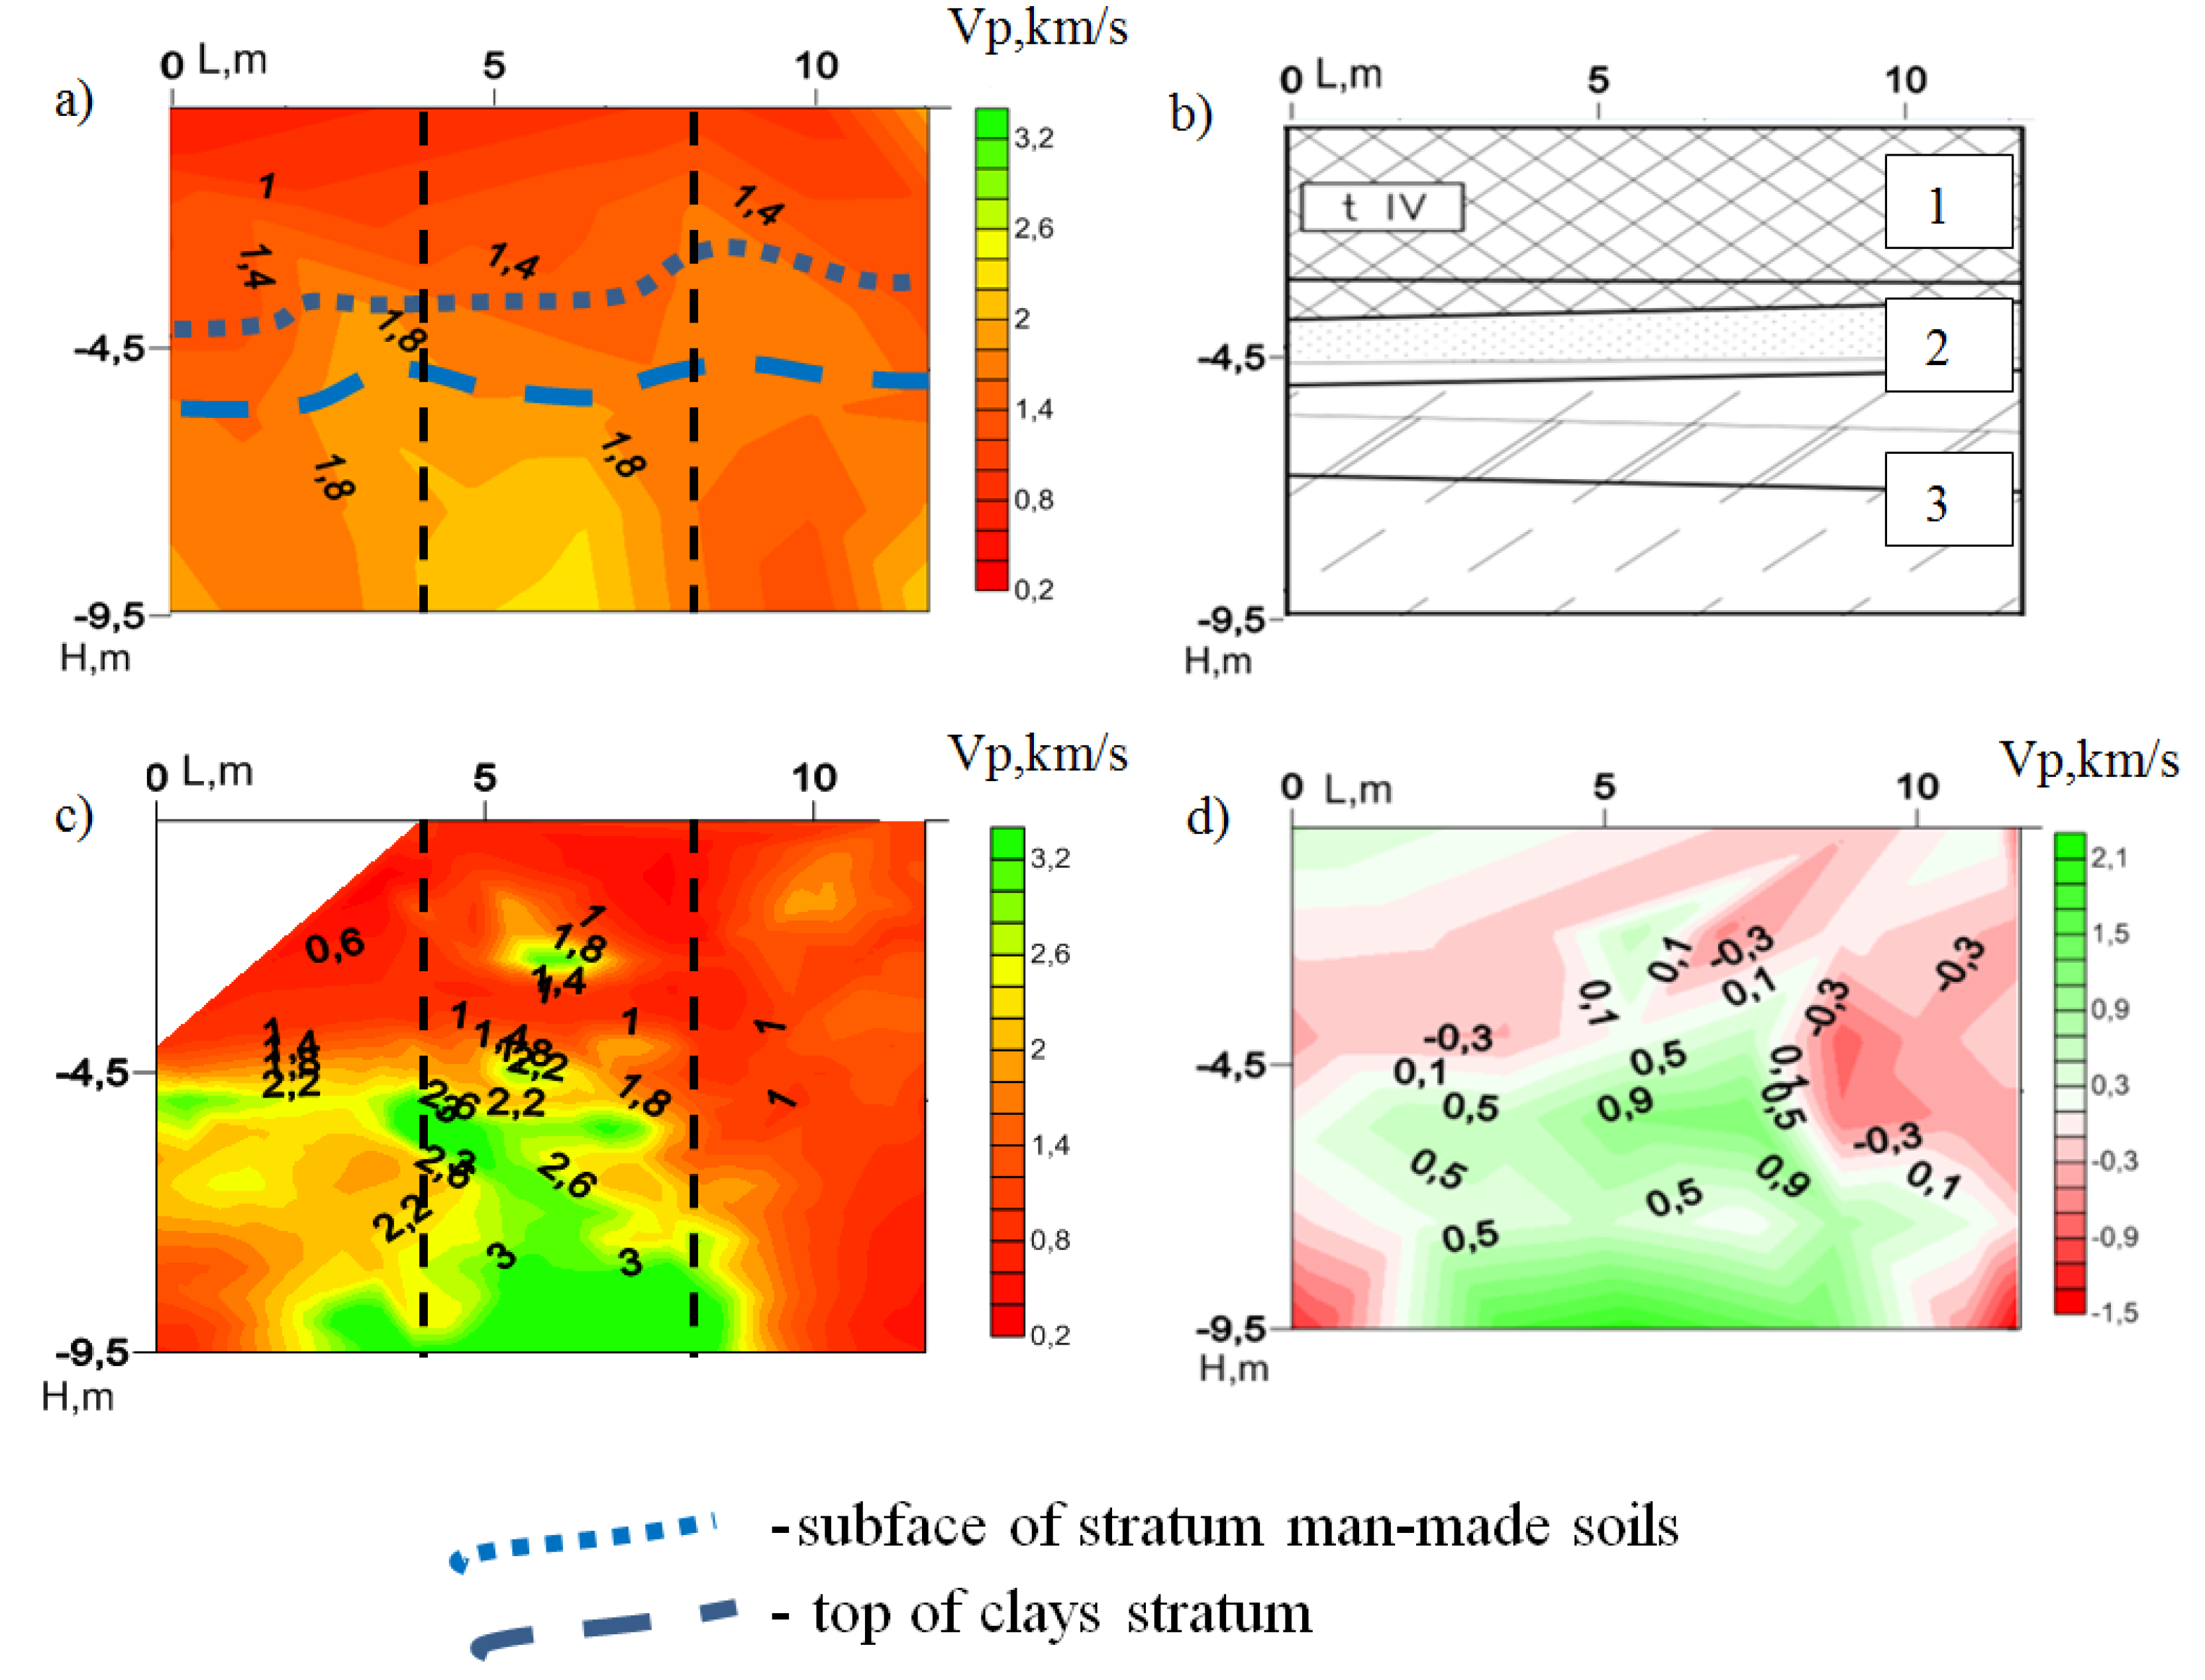
Figure 4a represents the results of interhole seismic tomography carried out prior to soil stabilization work implementation. The obtained profile satisfactorily correlated with geotechnical surveys (Figure 4b). The upper part of the profile is represented by man-made technogenic slightly disturbed soil (1), and below, there is a layer of water-saturated sand (2) underlying a loam layer (3). Figure 4c represents the results of interhole seismic tomography carried out 22 days after soil stabilization work implementation.
Figure 4d represents a differential velocity profile that characterizes variations in velocity-related features of the ground, as recorded 22 days after injection completion. The observation results analysis revealed that the stabilization of soil layers located at the bottom of the profile was a success, which was proven by an increase in longitudinal wave velocity (Vp) at an average of 0.7 km/h: the continuity within the stabilization area was traced across the range of 4.5–9.5 m, except for several abnormal zones at a depth of 6.8 m (Figure 4d).
On the contrary, velocities within the upper part of the profile decreased on average by 0.2 km/s, which indicated weakening in the upper part of the ground.
4. Discussion
Very probably, the changes that were revealed were the consequence of an incorrect injection activity procedure, namely the following:
- A beyond-design amount of grout mixture was injected into the bottom stratum (9.3–9.0 m) of the ground, entailing upheaval of the upper part of the profile;
- The injection upwards also caused “swelling” of the relatively weak upper part constituted of the man-made undisturbed ground;
- The appearance (effusion) of the slurry on the surface as detected during the injection (in the building basement, at mouths of adjacent boreholes) made stabilization of the entire mass up to the daylight surface unfeasible;
- Upon completion of the pumping, the injected slurry sublaterally spread throughout the soil, and the vertical component of the filled volume was reduced, which led to slight subsidence of the stabilized soil. The upper part also slightly subsided. The upheaval and subsidence of nonstabilized surface layers of soil led to decompaction accompanied by a reduction in strength, which resulted in the reduction of velocity-related features. The obtained data constitute the basis for issuing recommendations on the additional grouting of zones characterized by local discontinuities in boreholes No. 4, No. 5, and No. 6 (the depth range 6.5–7 m), a proposal for a more efficient injection procedure that assumes that the ground stabilization is performed without any losses in strength of the upper part of the soil profile;
- The implementation of the preventive stabilization of surface layers of the ground need for ensuring a kind of screen that could hamper both the injected slurry effusion and the upheaval of a weakened part of the surface;
- The injection amount should not significantly exceed the design-assumed values.
The continuity of stabilized soil should be ensured by way of the correct selection of the quantity of boreholes and interwell spaces within the stabilization implementation site rather than on account of the quantity of grout mixture to be injected. The results that are obtained during surveys at the subject test site allow for amending the procedure of grout mixture injection into soil underlying any buildings located within an area of underground construction influence.
5. Conclusions
The seismic tomography method allows for an effective evaluation of injection work efficiency and the identification of zones lacking soil stabilization strength and those requiring extra stabilization.
The parameters obtained during interhole seismic tomography are necessary for a determination of process parameters of grout mixture injection activities, including the injective slurry amount, the grout mixture composition, the necessity of preventive hydrological screening, etc.
The advantages of interhole seismic tomography in terms of the performance of the evaluation of injection activity efficiency are the following:
- A high-resolution capability of surveys;
- The ability to survey literally at any depth, even given constricted conditions within an urban area (depending just on the borehole depth).
The employment of geophysical control (in the form of interhole seismic tomography) allowed for increasing the efficiency of geotechnical monitoring during underground facility construction, including during the supervision of injection activities for the retention of buildings located within an area covered by construction activity influence.
Author Contributions
K.D. and M.L. carried out the calculations and analysis. К.D. and M.L., wrote the paper.
Funding
This research received no external funding.
Conflicts of Interest
The authors declare no conflict of interest.
References
- Ulitsky, V.M.; Shashkin, A.G.; Shashkin, K.G. Geotechnical support of urban development. In The Practical Guide to Designing Buildings and Underground Structures under Restrained urban Conditions; Group of Companies Georekonstruktsiya: St. Petersburg, Russia, 2010. [Google Scholar]
- Petrukhin, V.P. Geotechnical problems of construction in Moscow-the largest metropolis of Russia. In Geotechnical problems of megacities; Group of Companies Georekonstruktsiya: St. Petersburg, Russia, 2010. [Google Scholar]
- Bezrodny, K.; Lebedev, M.; Larionov, R. Preservation of urban historic centers. I Conference ACUUS 2016, St. Petersburg, Russia, 12–15 September 2016. [Google Scholar]
- Mangushev, R.A.; Osokin, A.I. Geotechnics of Saint Petersburg; Publishing House ASB: Moscow, Russia, 2010. [Google Scholar]
- Il’ichev, V.A.; Nikiforova, N.W.; Gotman, J.A.; Puffins, M.M.; Trofimov, E.Y. Analysis of passive and active methods of protection of existing buildings during underground construction. The Zhilishnoe Stroitel’stvo (Hous. Constr.) 2003, 12, 25–28. [Google Scholar]
- Bezrodny, K.P.; Salan, I.A.; Maslak, V.A.; Lebedev, M.O.; Starkov, A.Y.; Morozov, A.V. The Implementation of Bezusadochnye Technologies in the Construction of the St. Petersburg Metro; Transport of the Russian Federation: Moscow, Russia, 2010. [Google Scholar]
- Maslak, V.A.; Bezrodny, K.P.; Lebedev, M.O.; Markov, V.A.; Zakharov, G.R.; Ledyaev, A.P.; Stark, A.Y. Low-technology in the construction of the subway in the historic centre of St. Petersburg. Metro and Tunn. 2013, 12, 28–32. [Google Scholar]
- Maslak, V.A.; Bezrodny, K.P.; Lebedev, M.O.; Gendler, S.G. New technical and technological solutions for the construction of underground tunnels in a metropolis. Min. J. 2014, 12, 57–60. [Google Scholar]
- Bezrodny, K.P.; Lebedev, M.O.; Markov, V.A.; Starkov, A.Y. Geotechnical support in the construction of a double-track distillation tunnel with the help of tpmk. Subway Tunn. 2015, 12, 16–19. [Google Scholar]
- Bezrodny, K.P.; Matsegora, A.G.; Lebedev, M.O. Technology of construction of metro stations in dense urban areas. In Proceedings of the International Conference on Geotechnics urban Development and Geotechnical Construction, St. Petersburg, Russia, 16–19 June 2008; pp. 555–561. [Google Scholar]
- Bezrodny, K.P.; Matsegora, A.G.; Maslak, V.A.; Osokin, A.I.; Jaltintsev, V.B.; Elagin, V.N. Control injection fortifications in ground conditions of St. Petersburg. The Zhilishnoe Stroitel’stvo (Hous. Constr.) 2009, 12, 4–9. [Google Scholar]
- Lisin, V.P. Possibilities of inspection and monitoring of the ground bases of port terminals by shallow geophysical methods. In Journal Engineering survey 10–11/2015; Geomarketing: Moscow, Russia, 2015; pp. 86–95. [Google Scholar]
- Ertsalov, M.G.; Simutin, A.N.; Alexandrov, A.V. Technology of compensation injection for protection of buildings and structures. MGSU//Bulletin 2015, 6, 32–40. [Google Scholar]
- Meyr, R.; Khayt, D. Tekhnologiya kompensiruyushchego inetsirovaniya rastvorov v grunt, Digest of Foreign Information. Inf. Izdat. Cent. TIMR 1995, 2, 43–45. [Google Scholar]
- Schweiger, H.F.; Falk, E. Reduction of Settlements by Compensation Grouting, Numerical Studies and Experience From Lisbon Underground. In Proceedings of the World Tunnel Congress, Sao Paolo, Russia; 1998; pp. 1047–1052. [Google Scholar]
- Valet, J.L. Kompensationoe nagnetanie: Tekhnologiya v real’nom vremeni. Metro i tonneli 2002, 4, 16–19. [Google Scholar]
- Ibragimov, M.N.; Semkin, V.V.; Shaposhnikov, A.V. Some problems of grouting solutions from microcemento. Build. Sci. 2016, 4, 114–120. [Google Scholar]
- Korolev, V.M.; Smirnov, O.E.; Argal, E.S.; Ashikhmin, V.A. Experience of soil consolidation with the help of microcement. Bases, Found. Soil Mech. 2006, 4, 10–14. [Google Scholar]
- Ibragimov, M.N. Questions of design and production of works of compaction of soil by injection of solutions on hydraulic fracturing technology. Bases, Found. Soil Mech. 2015, 2, 22–27. [Google Scholar]
- Voznesenskaya, E.S.; Ermolaev, V.A.; Osokin, A.I.; Tatarinov, S.N. Strengthening of the bases of buildings and constructions by a method of hydraulic fracturing with use of cuff technology. Bases, Found. Soil Mech. 2014, 6, 19–24. [Google Scholar]
- Ogilvy, A.A. Fundamentals of engineering Geophysics; Bogoslovsky, V.A., Ed.; Nedra: Moscow, Russia, 1990. [Google Scholar]
- Bolgarov, A.G.; Roslov, Y.V. Inter-Well seismic tomography for solving engineering-geological problems. Seism. Explor. Technol. 2009, 1, 105–111. [Google Scholar]
- Shishkina, M.A.; Fokin, I.V.; Tikhotskii, S.A. Razreshayushchaya sposobnost’ mezhskvazhinnoj luchevoj sejsmicheskoj tomografii: rasstanovka, skorostnaya model’, konechnaya chastota signala. Information portal of the Institute of IPZ RAS. Available online: http://www.ifz.ru/lab-202/inverse-problems/tomo-resolution/ (accessed on 12 September 2019).
- Shishkina, M.A.; Fokin, I.V.; Tikhotsky, S.A. On the problem of resolution of inter-well radiation tomography. Seism. Explor. Technol. 2015, 1, 5–21. [Google Scholar]
- Dorokhin, K.A.; Boyko, O.V. Seismoacoustic monitoring to assess the quality of the execution of protective structures and compensatory strengthening of the soil rock. In Proceedings of the 14th Conference and Exhibition on Engineering and Mining Geophysics, Almaty, Kazakhstan, 23–27 April 2018; pp. 56–70. [Google Scholar]
- Dobróka, M.; Szegedi, H. On the generalization of seismic tomography algorithms. Am. J. Comput. Math. 2014, 4, 37–46. [Google Scholar]
- Kubota, K.; Kiho, K.; Mizohata, S.; Murakami, F. Development of directional drilling system and measurement method in the borehole application of seismic tomography between surface and the borehole. In Proceedings of the 10th IAEG Asian Regional Conference 2015, Kyoto, Japan, 26–29 September 2015. [Google Scholar]
- Li, Y.; Hewett, B. Borehole seismic quantitative diagnosis of a seismic velocity model for 3D seismic imaging of subsurface structures. Geophys. Prospecting 2014, 62, 719–739. [Google Scholar] [CrossRef]
- von Ketelhodt, J.K.; Fechner, T.; Manzi, M.S.; Durrheim, R.J. Joint inversion of cross-borehole P-waves, horizontally and vertically polarized S-waves: tomographic data for hydro-geophysical site characterization. Near Surf. Geophys. 2018, 16, 529–542. [Google Scholar] [CrossRef]
- Angioni, T.; Rechtien, R.D.; Cardimona, S.J.; Luna, R. Crosshole seismic tomography and borehole logging for engineering site characterization in Sikeston, MO, USA. Tectonophysics 2003, 368, 119–137. [Google Scholar] [CrossRef]
- Carrion, P.; Costa, J.; Pinheiro, J.E.; Schoenberg, M. Crossborehole tomography in anisotropic media. Geophysics 1992, 57, 1194–1198. [Google Scholar] [CrossRef]
- Dietrich, P.; Tronicke, J. Integrated analysis and interpretation of cross-hole P- and S-wave tomograms: A case study. Near Surf. Geophys. 2009, 7, 101–109. [Google Scholar] [CrossRef]
Figure 1.
Schematic diagram of the production of cross-hole seismic tomography.

Figure 2.
Description of borehole measurements, acquisition configuration, and logging instrumentation. (a) piezo-electric borehole source; (b) borehole hydrophone receiver; (c) the scheme of observations.
Figure 2.
Description of borehole measurements, acquisition configuration, and logging instrumentation. (a) piezo-electric borehole source; (b) borehole hydrophone receiver; (c) the scheme of observations.

Figure 3.
(a) A seismic dataset fragment with highlighted arrivals of P-waves (Pickwin, version 5.2.1.3). Red line: arrivals picked while the source was at a depth of 5.0 m; green line: arrivals picked at other positions of the source. (b) Spectrum of all the recorded signals: the useful signal is characterized by frequencies approximating 834 Hz.

Figure 4.
Results of seismic tomography: (a) before stabilization rock; (b) after stabilization rock; (c) log of hole; (d) analysis by velocity differences.
Figure 4.
Results of seismic tomography: (a) before stabilization rock; (b) after stabilization rock; (c) log of hole; (d) analysis by velocity differences.

© 2019 by the authors. Licensee MDPI, Basel, Switzerland. This article is an open access article distributed under the terms and conditions of the Creative Commons Attribution (CC BY) license (http://creativecommons.org/licenses/by/4.0/).
Share and Cite
MDPI and ACS Style
Lebedev, M.; Dorokhin, K. Application of Cross-Hole Tomography for Assessment of Soil Stabilization by Grout Injection. Geosciences 2019, 9, 399. https://doi.org/10.3390/geosciences9090399
AMA Style
Lebedev M, Dorokhin K. Application of Cross-Hole Tomography for Assessment of Soil Stabilization by Grout Injection. Geosciences. 2019; 9(9):399. https://doi.org/10.3390/geosciences9090399
Chicago/Turabian StyleLebedev, Mikhail, and Kirill Dorokhin. 2019. "Application of Cross-Hole Tomography for Assessment of Soil Stabilization by Grout Injection" Geosciences 9, no. 9: 399. https://doi.org/10.3390/geosciences9090399
Note that from the first issue of 2016, this journal uses article numbers instead of page numbers. See further details here.