The Influence of Magmatic Intrusions on Diagenetic Processes and Stress Accumulation
by
 ,
,
Magnhild Sydnes
1,2,*, 
Willy Fjeldskaar
1,
Ivar Grunnaleite
1,
Ingrid Fjeldskaar Løtveit
1 and
Rolf Mjelde
2 1
Tectonor AS, P.O. Box 8034, NO-4068 Stavanger, Norway
2
Department of Earth Science, University of Bergen, Box 7803, 5020 Bergen, Norway
*
Author to whom correspondence should be addressed.
Geosciences 2019, 9(11), 477; https://doi.org/10.3390/geosciences9110477
Submission received: 27 September 2019
/
Revised: 5 November 2019
/
Accepted: 11 November 2019
/
Published: 13 November 2019
(This article belongs to the Special Issue Future Advances in Basin Modeling: Suggestions from Current Observations, Analyses, and Simulations)
Abstract
:Diagenetic changes in sedimentary basins may alter hydrocarbon reservoir quality with respect to porosity and permeability. Basins with magmatic intrusions have specific thermal histories that at time of emplacement and in the aftermath have the ability to enhance diagenetic processes. Through diagenesis the thermal conductivity of rocks may change significantly, and the transformations are able to create hydrocarbon traps. The present numerical study quantified the effect of magmatic intrusions on the transitions of opal A to opal CT to quartz, smectite to illite and quartz diagenesis. We also studied how these chemical alterations and the sills themselves have affected the way the subsurface responds to stresses. The modeling shows that the area in the vicinity of magmatic sills has enhanced porosity loss caused by diagenesis compared to remote areas not intruded. Particularly areas located between clusters of sills are prone to increased diagenetic changes. Furthermore, areas influenced by diagenesis have, due to altered physical properties, increased stress accumulations, which might lead to opening of fractures and activation/reactivation of faults, thus influencing the permeability and possible hydrocarbon migration in the subsurface. This study emphasizes the influence magmatic intrusions may have on the reservoir quality and illustrates how magmatic intrusions and diagenetic changes and their thermal and stress consequences can be included in basin models.
Keywords:
magmatic intrusions; diagenesis; stress; porosity; permeability; basin modeling; stress modeling1. Introduction
Magmatic intrusions are commonly emplaced with much higher temperatures compared to their host rocks. Therefore, when emplaced into sedimentary basins, they may influence all parts of the petroleum system [1]. Several studies have shown how such intrusions influence the temperatures and hydrocarbon maturation in sedimentary basins (e.g., [2,3,4,5,6,7,8,9,10,11]). Other studies focus on the stress induced by the sills on the host rocks as they intrude (e.g., [12,13]). However, only a few studies have reported on the effect magmatic sill intrusions have on the diagenetic processes in sedimentary basins. Haile et al. [14] concluded in their work at Edgeøya (Svalbard) that conductive heat from intrusions did not seem to have affected the diagenetic products in the area. However, at Wilhelmøya (Svalbard) there is evidence suggesting that hydrothermal fluid flow originating from sills has affected the chemical transformations [15]. In a study of sandstones at Traill Ø (East Greenland) it was concluded that a combination of conductive and convective heat from magmatism enhanced the diagenetic process [16].
In essence, porosity and permeability determine the quality of petroleum reservoirs [17,18]. At the time of sediment deposition, the process of sediment lithification starts [19], driven by mechanical and chemical diagenesis. Mechanical alterations are related to compaction of the sediments by burial, while chemical alteration is the compaction occurring when chemical compounds are dissolved and re-deposited or new components are precipitated. While the mechanical changes are strictly a result of increasing burial depth and vertical loading, chemical changes are less predictable and highly dependent on the chemical compounds and the temperature (e.g., [20]). Diagenesis results in porosity loss, increased rock densities and seismic velocities (e.g., [21,22,23,24,25]). Due to the sensitivity of chemical diagenesis to temperature, basins subjected to magmatic intrusions are particularly prone to abrupt and sudden changes of physical properties. Laboratory measurements show an increase of physical rock strength (>100%) on the transition of opal A to opal CT [23], which imply that diagenetic processes may also affect the way the rocks respond to subsurface stresses.
Diagenetic transformations are reported from sedimentary basins worldwide (e.g., [26,27,28,29,30,31,32,33,34]). The Monterey Formation in California, USA, has been extensively studied with regard to the transformation of opal A to opal CT (e.g., [35,36,37,38,39]), but diagenetic alterations have also been observed several places in wells and on seismic data from the Norwegian Continental Shelf (e.g., [24,40,41,42,43,44,45,46,47]). All of the latter studies report observed transitions of either opal A to opal CT or smectite to illite in the Vøring Basin, offshore mid-Norway. We used a 2D section from the Vøring Basin with numerous sills as the basis for the modeling, as it represents the structures of a magmatic basin better as opposed to a synthetic profile. Modeling of a real 2D section will thus give more realistic results, even though the parameters are of global nature. A detailed case study of the effects of magmatic intrusions on diagenesis in the Vøring Basin is beyond the scope of this work.
The main goal of the study is to quantify the effect of magmatic intrusions on transitions of opal A to opal CT to quartz, smectite to illite, and quartz diagenesis which was done with basin modeling software (BMTTM, [48]). A second goal is to assess the influence of diagenetic processes and of the sills themselves on the stress field in a sedimentary basin and the potential impact on fracture and fault permeability, which is of significant importance for the petroleum systems. The results show that magmatic sills and related thermal effects might have notable implications for the porosity loss due to diagenesis in their vicinity. Diagenetic alterations and the sills themselves influence the location and magnitude of stress accumulations in the basin and thereby have implications for the fault and fracture development, and implicitly for the migration of fluids.
2. An Example of the Evolution of a Volcanic Basin—The Vøring Basin
The Vøring Basin is located offshore mid-Norway and is bounded by the Bivrost Lineament to the NE and the Vøring Transform Margin to the SW (Figure 1). The area consists of grabens, basins, and structural highs developed over three main rifting episodes from Carboniferous to Eocene times (e.g., [49] and references therein); (1) Carboniferous-Permian; coincided with the onset of rifting in the North Atlantic [40,50,51,52,53,54,55]; (2) Late-Mid Jurassic to Early Cretaceous; led to subsidence and development of accommodation space for the thick Cretaceous sedimentary sequence [56,57]; (3) Late Cretaceous to Early Eocene; coincided with the opening of the North Atlantic, development of the Vøring Marginal High, and intrusion of numerous sills in the Cretaceous basin fill [49,58]. Subsequent events were dominated by seafloor spreading and accretion of oceanic crust in the expanding Norwegian-Greenland/North Atlantic Sea [59,60]. In the post-rift phase, the Vøring area experienced localized tectonic uplift, erosion, sediment deposition, subsidence, flexure, and isostatic uplift partly due to numerous glaciations and deglaciations of the Fennoscandian landmasses [61,62].
The sedimentary deposits of the Vøring Basin mainly consist of marine to deep marine sediments (mainly shale) with intercalated shallow marine sediments (mainly sandstone) in the Upper Jurassic and Cretaceous [49]. The Paleocene consists of shale with minor sandstone and limestone deposits [63], and the Lower Eocene consists of shales. The magmatic intrusions were emplaced in lower Eocene time within the entire sedimentary sequence. Oligocene, Neogene, and Quaternary deposits are mainly shales with some ice rafted debris in the Plio-Pleistocene. The outer Vøring Basin was in the Miocene and early Pliocene dominated by deep-water deposits consisting of biosiliceous hemipelagic sediments [46,64].
The utilized 2D transect, VB-2-87-B (Figure 1), is about 100 km long and holds some 20 interpreted sills located at ~3–5 km depth with lateral extension of the sills varying from about 3 to 30 km (Figure 2). A velocity model by Hjelstuen et al. [64] was used for depth conversion of the section. The time of intrusion activity is estimated at ~56 Ma, which is supported by ages derived from zircon dating of magmatic sills in the Vøring area (55.6 ± 0.3 Ma and 56.3 ± 0.4 Ma, 6607/5-2 and Utgard wells; [65]).
From Carboniferous and up to the beginning of Eocene, the Vøring Basin was part of an active rift phase [49]. As the active rifting ceased the Vøring area subsequently experienced thermal subsidence and ridge push due to continental break up and opening of the North Atlantic. Repeated glaciations, mainly since 2.6 Ma, have led to sediment depositions in the Vøring Basin. Currently the regional stress field of coastal and mainland Norway is somewhat affected by post-glacial uplift and erosional unloading/loading [62,66,67,68,69,70] in addition to compressive ridge-push. To make our results generally applicable, the section from the Vøring Basin is solely used as a basis for the modeling, and site-specific parameters such as lithology and rock properties, are substituted by global values.
3. Methods and Results for Magmatic Intrusion’s Influence on Diagenetic Processes
To perform the modeling of structural evolution, geohistory, thermal development, maturation, and diagenesis, BMTTM (Tectonor AS) was used. All models are in 2D, which infer the third dimension to be infinite. This is a good approximation when sills and faults are modeled, as the third dimension commonly is much larger than the two others (e.g., [12]).
3.1. Geohistory, Temperature, Maturation, and Diagenesis
BMT is a high-resolution 2D basin modeling software utilizing a backstripping process, starting with present day geometry, in order to reconstruct the geohistory of an interpreted seismic section (Figure 2) [48,71,72]. One horizon at a time is stripped from the section and fault restoration and decompaction (based on the given porosity-depth trends assigned for the lithologies) of underlying sequences follow. This process is repeated all the way to the top basement, thus building the geohistory. The fault restoration in BMT is performed by vertical simple shear, a method that leaves no gaps in the geometry and allows for thermal and maturation calculations to be performed (cf. [48]).
BMT bases the thermal calculations on the finite difference method by conduction. The resulting temperature history depends on the thermal conductivity and specific heat capacity of the sediments as well as the basal heat flow from the mantle [48,71]. The surface temperature is the upper boundary condition in the calculations and is kept at 7 °C, whereas the lower boundary condition is the basal heat flow which is set to 47 mW∙m−2 over the profile and over time. With these settings, the BMT calculations generate the basis for the maturation and diagenetic modeling. Kerogen type II is assumed for the maturation modeling, and maturation is calculated using classical first-order kinetics [48].
3.1.1. Silica Diagenesis—Quartz Diagenesis
Quartz diagenesis occurs over three connected steps involving dissolution of quartz grains, transport of dissolved silica over short distances, and precipitation of quartz cement on clastic quartz grains [19,73]. BMT performs quantitative estimates of quartz cementation caused by dissolution of silica as described in Walderhaug [74,75] and Lander and Walderhaug [76]. The method is based on an empirically derived quantification of quartz precipitation as a function of temperature, and the precipitation is considered rate limiting for the whole cementation process (in [75] and references therein). This is a different approach than several other quantitative models where quartz dissolution is considered the limiting factor (e.g., [77,78,79,80,81]). As the diagenesis is thermally dependent (e.g., [74,75]), quartz cementation is an indicator of the maximum reached temperature and the burial depth.
Diagenesis is a complex process consisting of a number of transformations occurring simultaneously. According to Walderhaug [74,75], the rate limiting step is the precipitation, which is described by first-order kinetics and is proportional to the rate constant (k) given by the Arrhenius equation (Equation (1)).
where k is the rate constant of mineral precipitation per unit surface area (mol/cm2s), A0 is a pre-exponential constant/frequency factor (mol/cm2s), Ea is the activation energy (J/mol), R is the real gas constant (8.314 J mol−1 K−1), and T is the temperature. A0 is the number that describes how often molecules collide within the system under consideration. Ea is the energy needed for a specific chemical reaction to occur and both parameters are unique for any reaction [17]. The kinetic equation is integrated over temperature and time for a given timestep. By multiplying this with the available grain surface area obtained from the porosity history of the reconstructed geohistory, the mineral cement precipitated is calculated. However, increasing grain coating on quartz minerals reduces the possibility for precipitation of diagenetic minerals. The porosity loss calculations in this study assume zero grain coating, the porosity loss due to cementation might therefore be overestimated.
3.1.2. Silica Diagenesis—Opal A to Quartz Via Opal CT
Diatoms and radiolarian are two examples of siliceous plankton that after death enrich deep water sediments with dissolved non-crystalline silica known as opal A [82]. Such fragments are associated with low-energy deposition environments and amorphous silica is commonly found in deep water sediments amongst clay and silt deposits. Through burial and increased temperatures opal A converts to quartz via opal CT; this is observed in several basins worldwide, as documented in the introduction. The conversion of biogenetic/amorphous silica, opal A, to diagenetic/microcrystalline silica, opal CT, and subsequently to stable/crystalline silica, quartz, occurs through several dissolutions and precipitations as the burial depth increases (e.g., [39,83,84]). This reorganization from non-crystalline to crystalline silica causes changes in rock structures, mechanical properties, porosity, and permeability and may potentially generate traps for hydrocarbons (e.g., [23,38,39,84,85]).
One approach to determine the depth of these diagenetic processes is an empirical derived schematic presentation of the relation between temperature, rock composition, and silica-phase changes [86,87], which can be used in areas of known temperatures. Another approach is to determine experimentally the reaction kinetics under given chemical conditions which can be used for basins worldwide (e.g., [22,38,88]. A third approach was discovered by Neagu et al. [25] who found a connection between rotated fault planes and amount of porosity loss due to the conversion of opal A to opal CT.
Generally, each chemical reaction has its specific pre-exponential constant and activation energy which can be derived experimentally [17]. Additionally, all chemical reaction rates are temperature dependent [89]. Therefore, the method described above for quartz diagenesis was used to predict the precipitation rate for the transition of opal A to opal CT to quartz. Laboratory studies show that the activation energy for the opal A to opal CT transition is lower than for the transition of opal CT to quartz and this indicates that reorganization of amorphous silica to microcrystalline silica require lower temperature than the conversion of microcrystalline silica to crystalline silica [22]. This implies that the opal A/opal CT transition is expected to be located at shallower depths than the opal CT/ quartz boundary.
In this study the values reported by Dralus et al. [39] for the transition of opal A→ opal CT→ quartz was used (Table 1), as their study results in improved predictions of the opal A to opal CT boundary compared to other published kinetics [38]. They also found that high content of organic matter slows the transitioning of opal A to opal CT and that different kinetic parameters are required for rocks with high and low organic content.
3.1.3. Clay Diagenesis—Smectite to Illite
During burial diagenesis, illitization of smectite is a commonly occurring mineralogical reaction of clay rich sediments and shales. The conversion is a gradual process leading to mixed layers with different illite/smectite ratios [90] and is accompanied by volume loss and reduction in permeability [91]. With increasing burial depth and temperatures, the percentage of illitic beds in the illite/smectite mixed layers increases (e.g., [24,92]). The temperature is an important factor in the smectite to illite diagenetic process (e.g., [91]), but the presence of pore water and potassium (K+) are also essential for this transition to take place [42,93,94,95]. Smectite reacts with potassium, possibly sourced by K-feldspar, and the outcome is illite, silica, and water (e.g., [42]) from a complex dissolution/precipitation process where the precipitation is rate limiting (e.g., [96,97,98,99]). A common approach for modeling the conversion of smectite to illite is by using the Arrhenius equation and regarding the transformation as either a one step reaction with one reaction rate (e.g., [94,100]) or as several parallel reactions with rates spread over a defined range (e.g., [101]).
The method described above for quartz diagenesis is also applied for the estimation of smectite to illite diagenesis. However, it is important to note that this method does not take into account the presence of chemical components that can act as catalysts or quenchers. As for quartz diagenesis, precipitation is considered rate limiting for the smectite to illite transition and it is assumed that critical chemical components, e.g., potassium, are present for the reaction to occur. Kinetic data from three different studies were tested: (1) Roaldset et al. [95], (2) Huang et al. [94], and (3) Hillier et al. [102]. Their preferred parameters are given in Table 1.
3.2. Opal A to Opal CT—Testing of the Method
To test the quantification methods described above for the diagenetic processes, 1D modeling was performed on a well in the North Sea. Roaldset and Wei [23] observed the opal A to opal CT transition to be at 1740 m depth in well 30/9-B-50H (Figure 3) in the Oseberg area (North Sea). This area has experienced several millions of years of Cenozoic tectonic quiescence [104,105,106,107] and is presently close to maximum burial depth [95], which makes this particular well excellent for testing of the method. The stratigraphy was obtained from a well close by (well 30/6-2; Figure 3) consisting mainly of sandstones and claystones (see Table 2 for parameters).
Roaldset and Wei [23] showed that the opal A to opal CT transition zone coincided with a porosity reduction of around 20%. Results from the 1D model of well 30/9-B-50H shows that 20% porosity loss starts around 1740 m below seafloor (Figure 4). This coincides with the observations by Roaldset and Wei [23], which gives a strong indication that the method gives realistic results.
3.3. Example from the Vøring Basin, Section VB-2-87-B
To study the effect emplaced sills have on the diagenesis in basins, the methods described in Section 3.1 were used on the seismic line VB-2-87-B (Figure 2) in the Vøring Basin (Figure 1). This transect contains approximately 20 interpreted magmatic sills, as well as a horizon denoted opal CT (Figure 2). The sills were modeled to intrude in one pulse at 56 Ma, with a magma temperature of 1000 °C which is within normal magma temperature range [12]. Table 2 summarizes the parameters used in the modeling. The thermal effect of sills and the effect on the diagenetic processes are largest the first million years after intrusion [5,10]. The figures below show results for 1 Myr after the intrusion of the sills.
3.3.1. Quartz Cement
The resulting diagenetic effects (Figure 5) show large differences between models where sills are accounted for and when they are disregarded. It is well known that sill thickness plays a role in the size of the thermal aureole, as well as the amount of matured organic matter in the vicinity of sills (e.g., [5,10]). This is also clearly illustrated in Figure 5 where results for alternatives with no sills, 50 m and 100 m thick sills are shown. The entire basin is assumed to have sandstone lithology (see Table 2 for properties). Some areas show up to 40% difference in porosity loss between the models (Figure 5). The areas where the largest differences are found are located close to the sills and in the areas between clusters of sills. With increasing sill thickness a larger area between the sill clusters have increased porosity loss (Figure 5). This is in accordance with Sydnes et al. [10] who found that the vitrinite reflectance in a well in the Barents Sea is a function of the spacing and the possible heat exchange between neighboring sills. For single, relatively shallow lying sills, the sill thickness does not impact the size of the area of porosity loss to a significant degree. However, for deeper lying single sills, the sill thickness will impact the size of the diagenetically altered area (Figure 5).
Quartz diagenesis due to sill emplacement will have implications for the reservoir quality in the vicinity of sills, in particular for reservoirs lying between clusters of sills. For our basin with this particular geohistory and thermal development, sills intruding at any depth in the sedimentary rocks will enhance the porosity loss due to quartz diagenesis. The generated diagenetic changes as a result of intruding sills (as shown in Figure 5) should still be visible today, as the surrounding host rocks at the same depth have not yet reached the same amount of quartz diagenesis.
3.3.2. Opal A to Opal CT to Quartz
The transition from opal A to opal CT is considered to occur over some tens of meters and up to 200 m [41]. Roaldset and Wei [23] found the transition zone of opal A to opal CT to start where the porosity reduction is around 20%. Therefore, we assume that the transition zone starts where the modeling result show 20% porosity loss and ends around 200 m deeper down. The basin is now set as all shale and assumes presence of amorphous silica. Figure 6 shows the modeled opal CT transition zone for the studied transect in the Vøring Basin with and without sills included in the calculations. The largest contrast between the two models are found in the shallower areas and for sills situated at depths <1500 m below seafloor (Figure 6). For the scenario where sills are not included, the transition zone results in a more or less horizontal zone around 1200 m depth. When the thermal contribution of sills is included in the calculations, the opal A/CT boundary is found as shallow as approximately 700 m depth. This implies that the additional heat from the sills moved the transition zone up to 500 m shallower depths. The influence of sills on the further transition of opal CT to quartz is more or less the same as for opal A to opal CT and therefore not shown here.
3.3.3. Smectite to Illite
Transformation of smectite to illite may occur in sediments and rocks containing clay minerals, and the basin is therefore assumed to have only shale lithology. The results for all the tested kinetic values show that magmatic intrusions and their heat contribution influence the diagenesis and result in transition of smectite to illite at shallower depths than without sills (Figure 7). However, the published and used A0 and Ea values give significantly different results (Figure 7). The values proposed by Roaldset et al. [95] with high frequency factor (Table 1; Figure 7) give results similar to the result for the transition of opal A to opal CT (Figure 6). Without sills the transition from smectite to illite occurs around 1200 m depth and with sills this boundary lies about 500 m shallower. Results for the parameter values proposed by Hillier et al. (Table 1; [102]) show a porosity loss of 10% and increasing with depth, starting at >2000 m depths when sills are disregarded (Figure 7 pink, stippled lines lower left). For models where sills are included a porosity loss up to 40% is obtained in areas close to the sills (Figure 7). The results are quite similar to results displayed for quartz diagenesis (Figure 5). For the Vøring Basin, a transition in seismic velocity, porosity, and density, believed to resemble the smectite to illite transition, has been observed at depths corresponding to 80–90 °C [24]. The modeled isotherms of 80 and 90 °C for the model without sills are shown in Figure 7 (left). According to Peltonen et al. [24], the kinetic parameter values preferred by Roaldset et al [95] result in a transition of smectite to illite at a shallower depth than 80–90 °C. The kinetic values of Hillier et al. [102] result in a transition zone that lies deeper than the 80–90 °C isotherm.
From field observations it has been reported concurrent onset of oil generation and the conversion of smectite to illite (e.g., [110]). When comparing the resulting maturation assuming kerogen type II in the section from the Vøring Basin (Figure 8) with and without sills, there is a good correlation for both scenarios when compared to the smectite to illite conversion, when kinetic values by Hillier et al. [102] were used. Without sills the maturation starts at depths >2900 m at lateral location 50 km on the transect (Figure 8). At the same point in the transect without sills and Hillier et al. parameters ([102]; Figure 7), a porosity loss of 10% due to conversion of smectite to illite starts around 2700 m depth (Figure 7 pink, stippled lines lower left), which gives about 200 m difference in the location of the onset of hydrocarbon generation and smectite to illite conversion. For the modeled hydrocarbon maturation with sills (Figure 8) there is also a good correlation with the modeled porosity loss due to conversion to illite with the use of Hillier et al. [102] kinetic values (Figure 7).
4. Methods and Results for Stress Accumulation Influenced by Diagenetic Processes and Sills Themselves
As stated in the introduction, the physical properties of rocks subject to diagenesis will be altered (e.g., [22,23,95]. The increase in rock stiffness, as a consequence of diagenesis is of particular interest when studying how diagenesis may change the way the rocks respond to stresses. Additionally, the sills themselves are much stiffer than the host rocks in sedimentary basins and will accumulate stresses when subject to compressional or extensional loading [12,111].
4.1. Stress Modeling
To investigate how diagenesis and sills might affect stress accumulations in the subsurface, we used Comsol Multiphysics 5.2.a (www.comsol.com), a commercial finite element method (FEM) software that solves problems based on partial differential equations. The stress effects were studied on two synthetic cases and on the section from the Vøring Basin (Figure 2). All the models are in 2D and have fault zones divided into two separate units, consisting of a fault core which is surrounded by a damage zone with stiffnesses of 0.1 and 1 GPa, respectively (Figure 9). A typical Poisson’s ratio of 0.25 [112] was used in all the models and they were all subject to either horizontal compressional or extensional stress of 5 MPa to resemble horizontal regional or local stresses. All sills were assumed to be solidified and have Young’s modulus values resembling such a situation. Properties are as summarized in Table 3. The lower boundary was fastened in all models to avoid translation and rotation of the rock body.
4.2. Stress Effects of Sills and Diagenesis
In general, stress accumulations indicate areas prone to either opening of fractures or activation/reactivation of faults. Areas where tensile stresses accumulate may lead to opening of fractures or keep existing fractures open, whereas activation/reactivation of faults may occur in areas where shear stresses accumulate. Active faults and open fractures increase the permeability in the area where they are located. Typical global properties of rocks were used in the models (Table 3) and the results show the location of stress concentrations, and how sills and diagenesis affect stress accumulations. The models were based on the assumption that rocks behave as linear elastic up to 1%–3% strain at low temperature and pressure [113,114] depending on the rock strength. Strain exceeding 1%–3% commonly results in failure. Normally the shear strength of rocks lies between 1 and 12 MPa and the tensile strength is half of the shear strength, normally between 0.5 and 6 MPa [115,116,117]. Stresses exceeding these limits will commonly initiate fault movement and open fractures, respectively.
When comparing models where sills and sill-initiated diagenesis are accounted for versus when it is disregarded, it is possible to determine if and how these units may have influenced fracture and fault related permeability. Laboratory studies show that the physical strength of rocks increases by more than 100% on the transition of opal A to opal CT [23]. Therefore, the stiffness of the diagenetically altered area is doubled compared to the Young’s modulus value of the rocks not altered by diagenesis.
Synthetic Case
A synthetic case of arbitrary dimensions shows that in a homogeneous basin, stresses build up at and around the fault tips when subject to compression and extension (Figure 10). Red and yellow colors in the models represent areas where stresses concentrate, while blue colors are areas of small to no stress accumulations. Fractures may open and increase the permeability close to the sides of the fault tips where the tensile stresses concentrate (Figure 10). The direction of the fractures will follow the direction of σ1 (maximum principal compressive stress) and open in the direction of σ3 (minimum principal compressive stress or maximum principal tensile stress) [111]. Initiation of fault movement may occur at the fault tips where shear stresses accumulate, and as the shear stresses are larger at the upper tip, this is the area most likely for fault slip initiation (Figure 10).
As shown in Section 3.3.1, Section 3.3.2 and Section 3.3.3, magmatic sills will influence the diagenetic processes in their proximity (see Figure 5, Figure 6 and Figure 7). In order to include this impact in the synthetic model, a second model featuring the same fault, but with one sill surrounded by a diagenetically altered area was added. The results (Figure 11) show that in addition to accumulating shear and tensile stresses at the fault tips, due to compression, stresses mainly build up in the sill and in the area modified by diagenesis surrounding the sill. This occurs as stresses tend to build up in layers/zones of stiffer rocks in contrast to softer rocks in heterogeneous basins (e.g., [111,118,119]). These shear stress accumulations are also present in the fault zone, particularly where the sill crosses the fault, and consequently, potential fault reactivation may start in this area. The accumulated shear stresses in the sill and diagenetically modified area may result in linking of present weaknesses and potentially initiate growth of new faults within this area, if the shear strength of the rock is exceeded [111]. Tensile stresses concentrating in the area modified by diagenesis along the fault zone and within the diagenetically altered damage zone may, if the tensile strength of the rock is exceeded, open fractures [111]. Similar results are obtained for the same model subject to extension, however, the resulting tensile stresses will be much larger compared to when subject to compression (not shown here) and accordingly the chance of opening fractures will increase.
4.3. Example from the Vøring Area
For the transect VB-2-87-B in the Vøring Basin, the influence of sills and diagenetically altered area (as given in Section 3.3.1, Section 3.3.2 and Section 3.3.3) was included to investigate its effect on the stress accumulations. The mid-Norwegian margin is presently experiencing compression. However, this is not a specific study of the Vøring area, therefore, to study the response to compressive and tensile horizontal stresses the model was subjected to both. The area to the left (Figure 12a) with several faults and sills, is of particular interest as it displays the interaction between faults, sills, and areas modified by diagenesis. As the smectite to illite transition zones (Figure 7) show boundaries much like the one of opal A to opal CT (Figure 6) and quartz diagenesis (Figure 5), this transition was not included in the study, as the results are expected to be more or less the same as for the opal CT transition zone and quartz diagenesis.
The transformation zone of opal A to opal CT starts when the porosity reduction is around 20% (cf. Figure 6; [23]) and is modeled to end around 200 m deeper (cf. [41]). Five different scenarios were tested and subject to horizontal compressive and tensile stresses of 5 MPa: (1) the basin with both sills and diagenesis disregarded (Figure 12), (2) the basin with sills but diagenesis disregarded, (3) the basin without sills but with opal A to opal CT transition zone included, (4) the basin with sills and opal A to opal CT transition zone included (Figure 13 and Figure 14) and, (5) the basin with sills and quartz diagenesis (Figure 13 and Figure 14).
Common results for all the models, whether subject to compressive or tensile stress, is that stresses build up at the fault tips (like the synthetic models), and in particular at the lower tips (Figure 12a–c). This is due to the larger contrast in rock stiffness between the fault zones and the basement compared to the contrast between the fault zones and the host rock (cf. Table 3). Shear stresses are more or less the same with regard to location and strength of accumulations, whether they are subject to compression or extension. However, the tensile stresses are much lower for the models subject to compression (Figure 12b) than those subject to extension (Figure 12c).
When subject to both compression and extension, the synthetic models show that both shear and tensile stresses mainly concentrate in the sill and area modified by diagenesis, also where these features cross the fault zone (Figure 11). Figure 13 shows the results for the Vøring basin subject to compression and when sills and the opal CT transition zone are included (Figure 13a,c), as well as when sills and the quartz diagenetically modified area are accounted for (Figure 13b,d). For all cases, areas of increased tensile stresses are few and small, but potential fractures may open along the fault zone to the right and increase the permeability if the stresses become high enough (Figure 13c,d). In addition, areas indicated by white circles in Figure 13c,d, show elevated tensile stresses related to where the sill and diagenetically modified area cross the fault zone. Fractures may open or remain open if stress concentrations grow high enough, thereby contributing to increased permeability in these areas. The shear stresses tend to build up in the areas modified by diagenesis and in the sills. Where the sills cross the faults, stress concentrations are, without exceptions, particularly high (Figure 13a,b) and may reactivate the fault if they exceed the rock’s shear strength of 1–12 MPa. Elevated shear stresses in the opal CT transition zone and area modified by quartz diagenesis, may potentially initiate growth of new faults if the stresses become high enough, and thereby contribute to increased permeability.
When the basin is subject to extension the shear stresses concentrate in the same location with the same strength (Figure 14a,b), as when subject to compression (Figure 13a,b), for all scenarios. If the shear stresses exceed the shear strength of the rocks, fault slip will be initiated in some areas (colored red and yellow). However, the tensile stresses are much larger for the basin subject to extension (Figure 14c,d) as opposed to compression (Figure 13c,d). The entire sills tend to concentrate tensile stresses, not just when crossing fault zones (Figure 14c,d). Additionally, the diagenetically altered area of both opal CT and quartz accumulate higher tensile stresses compared to their surroundings. The high concentrations of tensile stresses show that the basin is prone to open fractures and increase the permeability in several areas. Due to the particularly high stress concentrations in the sills and the areas that have undergone diagenetic transitions, fractures are expected to first open in these places.
5. Discussion
Magmatic intrusions may influence the location and amount of porosity loss due to diagenesis, given that the necessary physical, biogenic, and/or chemical conditions are present. Two specific topics are addressed in this study: (1) quantification of the effect of magmatic intrusions on several diagenetic processes (opal A to opal CT to quartz, smectite to illite, and quartz diagenesis) and (2) the effect of sills and diagenetically altered areas on the fracture and fault permeability in basins with emphasis on the effect of these factors on petroleum systems.
5.1. Effects of Diagenesis on Petroleum Systems
Diagenesis contributes to loss of porosity and permeability in petroleum reservoirs and thus essentially harm the reservoir quality [90]. However, the same processes may also enhance the porosity and permeability through development of secondary porosity by dissolution, grain coating, and fracturing of layers that have become brittle [90]. All diagenetic products can aid in calibrating the thermal history of basins, as the transformation of each diagenetic product commonly occurs over a specific temperature range. Thereby, they are markers for maximum temperatures and burial depths and may uncover areas exposed to unusual environments, i.e., uncommon heat flow or uplift and erosion, and they can be used together with for instance vitrinite reflectance and fluid inclusion data to calibrate thermal predictions.
The thermal conductivity of sediments could rise 4–5 times when opal CT transitions to quartz [120], as a result of the porosity loss. In the Bjørnøya Basin (Barents Sea) this difference in thermal conductivity results in about 10 °C higher temperatures in the Paleocene/Eocene shales for opal CT rich shale compared to quartz rich shale [118]. This temperature difference is caused by the nature of clay minerals that have a flattened structure favoring horizontal over vertical heat transport [120]. This is an example of the importance of including diagenesis in basin modeling. Modeling of diagenesis will ensure good thermal models when assessing the petroleum potential of sedimentary basins [120].
When the effects of diagenetic processes on petroleum reservoirs are considered, it is important to realize that chemical compounds in subsurface fluids can be catalysts or quenchers for the processes. First of all, the transition of opal A to opal CT to quartz requires presence of amorphous silica in the sedimentary rocks. Kastner et al. [83] studied the chemical controls on the opal A to opal CT transition and found that the diagenetic process is increased in carbonate rocks and reduced in clay-rich rocks. The presence of magnesium and hydroxide ions was found to enhance the conversion of opal A to opal CT. Subsequent transformation of opal CT to quartz released magnesium and hydroxide ions [83] and fluids enriched in magnesium and hydroxide ions were expelled upwards along faults increasing the transformation of opal A to opal CT at shallower depths [121]. Conversion of smectite to illite requires the presence of clay minerals in the sedimentary rocks. Furthermore, the presence of potassium has proved to enhance this conversion process. The transformation rates of smectite to illite increases with high potassium concentrations and lower temperatures are needed to start the conversion [95]. The potassium is commonly sourced by k-feldspars, which requires such minerals to be present for diagenesis to occur [91]. On the other hand, laboratory studies indicate that the presence of magnesium ions retards the conversion process in the early phases of the smectite to illite conversion [94]. Therefore, although thermal requirements are met for diagenetic alterations to occur, it is ultimately the biogenic and/or chemical compounds in the rocks and pore fluids that determine the possible diagenetic processes.
5.2. Effect of Magmatic Sills on the Diagenetic Process in Reservoir Rocks
Earlier studies of magmatic intrusions and their effect on porosity evolution and diagenesis of reservoir rocks have come to contrasting conclusions (e.g., [14,15,122,123,124]). The diagenetic processes of sandstone reservoirs are likely to be controlled by the initial composition of the sand, original pore water composition, content of neighboring lithologies, burial and thermal history, and timing of cementation relative to accumulation of petroleum [17,47,82]. These criteria can largely explain the contrasting conclusions that are put forward in the referenced literature.
Haile et al. [14] conclude in their study at Edgeøya (Svalbard) that quartz cementation is unaffected by the short-lived heating of magmatic sills in reservoir rocks. They suggest that slow quartz cementation rates are in contrast to the relatively short-lived magmatic heating and will therefore not leave fingerprints on the diagenetic process. This conclusion contrasts from the results in our study which clearly show that magmatic sill intrusions affect the diagenesis in their proximity (Figure 5, Figure 6 and Figure 7). Nejbert et al. [125] state that most sills in the Svalbard area are about 10–30 m thick. The sills are relatively thin and the distances between the sills are unknown in the study by Haile et al. [14], which could explain the contrasting conclusions of their study and ours. The magmatic sill thickness, distance from sills, and clusters of sills are pointed out in several studies to have significant importance on the thermal effect of magmatic intrusions (e.g., [3,5,6,9,10,11]). Our study shows that thermal effects will also affect diagenetic transformations (i.e., Figure 5). The location of sampling in the study by Haile et al. [14] might also be too far from sills to be thermally affected by them.
Another aspect is the temperature of the intruding magma. As the thermal effect of sills is a function of the temperature of the intruding magma, a lower magma temperature than 1000 °C (used in this study), would result in smaller thermal aureole surrounding the sills and consequently decrease the area affected by diagenesis. This could also to some degree explain the contrasting conclusions. The host rock pre-intrusion temperature is identified to be crucial for the thermal effect of magmatic intrusions (e.g., [5,8,11]), and ultimately the effect of magmatic intrusions on diagenetic processes. Factors such as fault displacement, time span of faulting and sediment deposition, fault angle, rock thermal conductivity and specific heat capacity, basal heat flow, and restoration method used to simulate the fault movement through time, are all factors that influence the host rock pre-intrusion temperatures. For a specific, detailed area study, all these factors are crucial and require thorough assessment [11].
5.3. Silica Diagenesis
Silica diagenesis embraces two distinct types of chemical compaction processes, both of which are thermally dependent. The first studied here is quartz diagenesis and is related to pressure dissolution of quartz minerals, diffusion of dissolved silica and precipitation of quartz cement. Quartz cementation is the number one porosity reduction process in sandstones below 2000 m depth (e.g., [17,126,127]). Rapidly increasing porosity loss due to quartz cementation occurs when temperatures exceed 100–110 °C [75] and hydrocarbons do not seem to influence the porosity reduction process [91]. Grain coatings of clays have been found to inhibit quartz cementation and contribute to porosity preservation (e.g., [128,129,130]). Furthermore, at depths for peak mineral dissolution, such as quartz dissolution, the porosity is found to increase through secondary porosity production before it decreases again at deeper burial depth [130]. For basins without magmatic intrusions the porosity loss in petroleum reservoirs due to quartz diagenesis are expected to be found at depths corresponding to the mentioned temperature range (100–110 °C). As the results in this study show, magmatic intrusions in sedimentary basins contribute to abrupt changes in the diagenetic processes (Figure 5) and reservoirs with reduced porosity may thus be found at shallower depths than expected. Reservoirs located between sills in a cluster are particularly prone to porosity reduction due to quartz diagenesis.
The transition of siliceous sediments from opal A through opal CT to quartz, starts at lower temperatures than the silica transition discussed previously. Opal A dissolves and subsequently precipitates to opal CT at about 50–60 °C, and further transition into crystalline quartz starts around 80–90 °C [131]. These transformations are known to create hydrocarbon traps. In Onnagawa Formation, Yurihara oil and gas field (Japan) and Monterey Formation in California (USA), the opal CT/quartz boundary acts as a seal due to its low permeability, while the quartz rich layers underneath, with higher permeability, act as a reservoir [38,132]. For basins following the thermal development without particular interruptions, the transition zone of opal A to opal CT will normally be in the temperature range of 50–60 °C, and the opal CT to quartz transition at depths corresponding to 80–90 °C. Results from this study show that sills intruding at depths <1500 m moves the opal A/CT transition zone to significantly shallower depths. For basins with magmatic sill intrusions emplaced at shallow depths, such a hydrocarbon trap model would lie at shallower depths than basins without sills, and could possibly go undiscovered if sills are not included in the thermal and diagenetic calculations during basin modeling. The opal A/CT boundary has been mistaken for a flat spot as oil/water contact and drilled (e.g., [22]). When incorporating the diagenetic transition of opal A to opal CT in basin modeling, such errors may be avoided.
Opal CT Boundary in the Vøring Basin
The opal A to opal CT transition zone is found at surprisingly shallow depths in some areas of the Vøring Basin. Several reasons for this fossilized opal A/CT transition have been suggested. The transition zone is proposed to have developed during Miocene and died out in Early Pliocene (e.g., [44,49,133]). As the transition of amorphous silica to opal CT is a temperature dependent reaction (e.g., [22,24,73,74,75]) the fossilized transition is a record of peak paleo temperatures which may reflect max burial depth of the basin, uplift and erosion of the area, higher thermal gradient in the past, or another unknown thermal event [22,44,49,131]. The Eocene magmatic sills are, however, not the cause of the observed shallow opal A/CT zone because the extra heat provided by the intrusions did not affect the diagenesis as shallow as the Miocene/E Pliocene formations.
5.4. Smectite to Illite
The conversion of smectite to illite is one of many different clay diagenetic processes occurring in the subsurface. Illite has a fibrous texture and small amounts of this clay may dominate the pore space and largely reduce permeability [91]. The smectite to illite transition is of particular interest for the oil and gas industry as it may coincide with the onset of oil generation [90]. For the Vøring Basin, Peltonen et al. [24] found that major smectite to illite conversion occurred at depths corresponding to a temperature interval of 80–90 °C. For shales in the Gulf Coast (USA), the major rate of smectite to illite conversion was found at temperatures of 90–120 °C [134]. Other studies conclude that the illitization process starts at 50 °C and ceases around 100 °C [135]. These diverse temperature ranges for the smectite to illite conversion is also reflected in the modeling results in this study, when different published kinetic parameters are used (Figure 7). This emphasizes the complexity of the smectite to illite conversion, and possibly clay diagenesis in general. An area influenced by magmatic activity in western Pannonian Basin (Hungary), show a divergent effect of magmatic heating on clay minerals and the smectite to illite transformation [103]. Such results emphasize that, although thermal requirements are met for diagenetic processes to take place, other factors must also be fulfilled for chemical reactions to occur (cf., [136]). For the smectite to illite diagenetic functionality described here, caution must be exercised in the interpretation of the results. This means that the described method can be used to locate areas that fulfill the required kinetics for alterations to occur. This is a good first approximation in pin pointing areas prone to have undergone diagenetic changes in the basin. However, subsurface chemical knowledge is needed in order to examine if other necessary criteria are met for diagenetic alterations.
5.5. Influence of Sills and Diagenesis on Stress Accumulations
When sills have solidified and are subject to compressive and tensile stresses, this study shows that the sills and the diagenetically altered areas accumulate stress (Figure 10, Figure 11, Figure 12, Figure 13 and Figure 14). When stresses exceed the shear and/or tensile strengths of the rock, the rocks will fail and fault movement will be initiated or fractures will develop, respectively. This occurs because stresses tend to build up in the stiffer layers as opposed to softer rocks (e.g., [111,116,117]), which will be decisive for where fractures develop and faults could be reactivated. From the models (Figure 10, Figure 11, Figure 12, Figure 13 and Figure 14) it can be deduced that the higher the contrast in rock stiffness, the higher the stress concentration in the stiff layers. For diagenetically modified areas, with higher increase in rock stiffness than studied here (doubled the stiffness of the host rock), the potential stress accumulation in the area modified by diagenesis will be higher, and the likelihood of fault initiation and fracture opening is increased. On the other hand, in an opposite situation, the potential stress concentration will be lower and so will the likelihood of fault movement and fracture opening.
It has been proposed that diagenetic processes may affect the fluid flow properties in the subsurface (e.g., [14,47]), a statement which is confirmed by the results in this study. This is the case, not just due to how diagenesis modifies rocks porosity and permeability, but also to how these diagenetic alterations change the rock’s physical properties. An active fault may increase the temporary permeability many times, and faults and fractures may dominate the fluid transport in the rock masses if they are interconnected [111]. The results in this study show that sills or diagenetically altered areas (Figure 11, Figure 12, Figure 13 and Figure 14) could ultimately lead to opening of fractures or initiate fault movements if the tensile or shear stresses of the rocks are exceeded. For a petroleum system, such an outcome can be crucial, as opening of fractures and fault movement increase the permeability and supports fluid flow, possibly to new locations. Thus, we conclude that sills and their related diagenetically modified areas may influence the subsurface fluid migration pathways through time and space and increase the permeability, as opening of fractures and reactivation of faults may act as fluid conduits.
5.6. Limitations of the Calculations
All basins have their particular thermal and structural histories concerning e.g., sediment source, lithology, fluid circulation, pore fluid chemistry, and structural development. These variations all play a part in possible chemical alterations in the subsurface and lead to unique diagenetic development. Therefore, information regarding these elements must be included for more detailed local studies.
In numerical modeling there is a direct link between the quality of the input data and the quality of the output from the models. When studying a particular area, caution must be taken regarding various parameters. For instance, we only studied conductive heat transfer in the subsurface and heat convection by fluids is not accounted for. Convection by fluids could influence the resulting thermal and diagenetic calculations to various degrees (cf., [137,138,139,140,141]). The Vøring area shows proof of fluid convection (e.g., [142]), our results therefore show maximum porosity loss, at least for some areas. However, for basins that show little to no signs of convecting fluids, the presented estimations are adequate. We argue that the method presented here is a good approach to reveal areas needing further investigation of possible diagenetic alterations and thus possible alterations of reservoir properties.
6. Concluding Remarks
This study quantified the porosity loss due to the transition of opal A to opal CT to quartz, smectite to illite and quartz diagenesis and how magmatic intrusions may affect the diagenetic process. As the diagenetic alterations change the physical properties of the rock, it was shown how these alterations and the sills themselves influence location of stress accumulations in a basin and thus may contribute to changes in fracture and fault permeability. All these factors have implications for the petroleum system and the results are summarized as follows:
- Conductive thermal effects of sills significantly influence the diagenetic processes in sedimentary basins.
- The effect of magmatic intrusions on the diagenetic processes depends on the depth at which the magmatic sills intrude. Maximum diagenetic changes occur at different temperatures for the different processes. For sills to influence the transition of opal A to opal CT they must intrude at depths >1500 m.
- Sill thickness influences the size of the diagenetically altered area, particularly where clusters of sills are closely spaced.
- Sills and diagenetically modified areas influence location of stress accumulations and may contribute to initiation of fault movement and opening of fractures. As fractures and faults can act as conduits for fluid flow, sills and areas modified by diagenesis may therefore contribute to increased permeability.
- A thorough case study is required to determine the sill’s specific effect on diagenetic processes and stress accumulations in the Vøring Basin and other volcanic basins. This is now made possible with the work done in this study.
Author Contributions
Conceptualization, M.S., W.F., I.G. and I.F.L.; methodology, M.S., W.F. and I.G.; software, M.S., W.F. and I.G.; formal analysis, M.S. and I.G.; investigation, M.S.; writing—original draft preparation, M.S.; writing—review and editing, W.F., I.G., I.F.L. and R.M.; visualization, M.S.; supervision, W.F. and R.M.; project administration, I.F.L.; funding acquisition, I.F.L.
Funding
This research was partly funded by The Research Council of Norway and Tectonor AS as a part of the PhD project ‘Effects of magmatic intrusions on temperature history and diagenesis in sedimentary basins—and the impact on petroleum systems’, RCN project number 257492.
Acknowledgments
We want to express gratitude for the support received. Inspiring conversations with Professors Olav Eldholm and Elen Roaldset, and valuable discussions with Professor Leiv K. Sydnes are highly appreciated. Two anonymous reviewers and Academic Editor are thanked for constructive and helpful comments that improved the contents and design of the paper.
Conflicts of Interest
The authors declare no conflict of interest.
References
- Schutter, S.R. Hydrocarbon occurrence and exploration in and around igneous rocks. In Hydrocarbons in Crystalline Rocks, Special Publications; Petford, N., McCaffrey, K.J.W., Eds.; Geological Society: London, UK, 2003; Volume 214, pp. 7–33. [Google Scholar]
- Svensen, H.; Planke, S.; Malthe-Sørenssen, A.; Jamtveit, B.; Myklebust, R.; Eidem, T.R.; Rey, S.S. Release of methane from a volcanic basin as a mechanism for initial Eocene global warming. Nature 2004, 429, 542–545. [Google Scholar] [CrossRef] [PubMed]
- Fjeldskaar, W.; Helset, H.M.; Johansen, H.; Grunnaleite, I.; Horstad, I. Thermal modelling of magmatic intrusions in the Gjallar Ridge, Norwegian Sea: Implications for vitrinite reflectance and hydrocarbon maturation. Basin Res. 2008, 20, 143–159. [Google Scholar] [CrossRef]
- Galushkin, Y.I. Thermal effects of igneous intrusions on maturity of organic matter: A possible mechanism of intrusion. Org. Geochem. 1997, 26, 645–658. [Google Scholar] [CrossRef]
- Aarnes, I.; Svensen, H.; Connolly, J.A.D.; Podladchikov, Y.Y. How contact metamorphism can trigger global climate changes: Modeling gas generation around igneous sills in sedimentary basins. Geochim. Cosmochim. Acta 2010, 74, 7179–7195. [Google Scholar] [CrossRef]
- Aarnes, I.; Svensen, H.; Polteau, S.; Planke, S. Contact metamorphic devolatilization of shales in the Karoo Basin, South Africa, and the effects of multiple sill intrusions. Chem. Geol. 2011, 281, 181–194. [Google Scholar] [CrossRef]
- Peace, A.; McCaffrey, K.; Imber, J.; Hobbs, R.; van Hunen, J.; Gerdes, K. Quantifying the influence of sill intrusion on the thermal evolution of organic-rich sedimentary rocks in nonvolcanic passive margins: An example from ODP 210–1276, offshore Newfoundland, Canada. Basin Res. 2017, 29, 249–265. [Google Scholar] [CrossRef]
- Spacapan, J.B.; Palma, J.O.; Galland, O.; Manceda, R.; Rocha, E.; D’Odorico, A.; Leanza, H.A. Thermal impact of igneous sill-complexes on organic-rich formations and implications for petroleum systems: A case study in the northern Neuquén Basin, Argentina. Mar. Pet. Geol. 2018, 91, 519–531. [Google Scholar] [CrossRef]
- Spacapan, J.B.; D’Odorico, A.; Palma, O.; Galland, O.; Rojas Vera, E.; Leanza, H.A.; Medialdea, A.; Manceda, R. Igneous petroleum systems in the Malargüe fold and thrust belt, Río Grande Valley area, Neuquén Basin, Argentina. Mar. Pet. Geol. 2020, 111, 309–331. [Google Scholar] [CrossRef]
- Sydnes, M.; Fjeldskaar, W.; Løtveit, I.F.; Grunnaleite, I.; Cardozo, N. The importance of sill thickness and timing of sill emplacement on hydrocarbon maturation. Mar. Pet. Geol. 2018, 89, 500–514. [Google Scholar] [CrossRef]
- Sydnes, M.; Fjeldskaar, W.; Grunnaleite, I.; Løtveit, I.F.; Mjelde, R. Transient thermal effects in sedimentary basins with normal faults and magmatic sill intrusions—A sensitivity study. Geosciences 2019, 9, 160. [Google Scholar] [CrossRef]
- Gudmundsson, A.; Løtveit, I.F. Sills as hydrocarbon reservoirs: Examples and models. Geol. Soc. Lond. Spec. Publ. 2012, 374, 251–271. [Google Scholar] [CrossRef]
- Montanari, D.; Bonini, M.; Corti, G.; Agostini, A.; Del Ventisette, C. Forced folding above shallow magma intrusions: Insights on supercritical fluid flow from analogue modelling. J. Volcanol. Geotherm. Res. 2017, 345, 67–80. [Google Scholar] [CrossRef]
- Haile, B.G.; Klausen, T.G.; Jahren, J.; Braathen, A.; Hellevang, H. Thermal history of a Triassic sedimentary sequence verified by a multi-method approach: Edgeøya, Svalbard, Norway. Basin Res. 2018, 30, 1075–1097. [Google Scholar] [CrossRef]
- Haile, B.G.; Czarniecka, U.; Xi, K.; Smyrak-Sikora, A.; Jahren, J.; Braathen, A.; Hellevang, H. Hydrothermally induced diagenesis: Evidence from shallow marine-deltaic sediments, Wilhelmøya, Svalbard. Geosci. Front. 2019, 10, 629–649. [Google Scholar] [CrossRef]
- Therkelsen, J. Diagenesis and reservoir properties of Middle Jurassic sandstones, Traill Ø, East Greenland: The influence of magmatism and faulting. Mar. Pet. Geol. 2016, 78, 196–221. [Google Scholar] [CrossRef]
- Allen, P.A.; Allen, J.R. Basin Analysis: Principles and Application to Petroleum Play Assessment, 3rd ed.; Wiley-Blackwell: Chichester, UK, 2014. [Google Scholar]
- Gluyas, J.; Swarbrick, R. Petroleum Geosciences; Blackwell Publishing: Oxford, UK, 2015. [Google Scholar]
- Bjørlykke, K.; Ramm, M.; Saigal, G.C. Sandstone diagenesis and porosity modification during basin evolution. Geol. Rundsch. 1989, 78, 243–268. [Google Scholar] [CrossRef]
- Bjørlykke, K. Relationships between depositional environments, burial history and rock properties. Some principal aspects of diagenetic process in sedimentary basins. Sediment. Geol. 2014, 301, 1–14. [Google Scholar] [CrossRef]
- Nobes, D.C.; Murray, R.W.; Kuramoto, S.; Pisciotto, K.A.; Holler, P. Impact of silica diagenesis on physical property variations. In Proceedings of the Ocean Drilling Program, Scientific Results, College Station, TX, USA; 1992; Volume 127/128. [Google Scholar] [CrossRef]
- Roaldset, E.; Wei, H. Silica-phase transformation of opal-A to opal_CT to quartz, Part I: An experimental diagenetic approach to natural observations. Prepared for submittal to AAPG. 1997. [Google Scholar]
- Roaldset, E.; Wei, H. Silica-phase transformation of opal-A to opal-CT to quartz, Part II: Changes of physical properties. Prepared for submittal to AAPG. 1997. [Google Scholar]
- Peltonen, C.; Marcussen, Ø.; Bjørlykke, K.; Jahren, J. Clay mineral diagenesis and quartz cementation in mudstones: The effects of smectite to illite reaction on rock properties. Mar. Pet. Geol. 2009, 26, 887–898. [Google Scholar] [CrossRef]
- Neagu, R.C.; Cartwright, J.; Davies, R. Measurement of diagenetic compaction strain from quantitative analysis of fault plane. J. Struct. Geol. 2010, 32, 641–655. [Google Scholar] [CrossRef]
- Elliot, W.C.; Aronson, J.L.; Matisoff, G.; Gautier, D.L. Kinetics of the smectite to illite transformation in the Denver Basin; clay mineral, K-Ar data, and mathematical model results. AAPG Bull. 1991, 75, 436–462. [Google Scholar]
- Buryakovski, L.A.; Djevanshir, R.D.; Chilingar, G.V. Abnormally-high formation pressures in Azerbaijan and the South Caspian Basin (as related to smectite ↔ illite transformations during diagenesis and catagenesis). J. Pet. Sci. Eng. 1995, 13, 203–218. [Google Scholar] [CrossRef]
- Worden, R.H.; Charpentier, D.; Fisher, Q.J.; Aplin, A.C. Fabric development and the smectite to illite transition in Upper Cretaceous mudstones from the North Sea: An image Analysis Approach. In Understanding the Micro to Macro Behaviour of Rock-Fluid Systems; Shaw, R.P., Ed.; Geological Society, Special Publications: London, UK, 2005; Volume 249, pp. 103–114. [Google Scholar]
- Robin, V.; Hebert, B.; Beaufort, D.; Sardini, P.; Tertre, E.; Regnault, O.; Descostes, M. Occurrence of authigenic beidellite in the Eocene transitional sandy sediments of the Chu-Saryssu basin (South-Central Kazakhstan). Sediment. Geol. 2015, 321, 39–48. [Google Scholar] [CrossRef]
- Dou, W.; Liu, L.; Wu, K.; Xu, Z.; Feng, X. Diagenesis of tight oil sand reservoirs: Upper Triassic tight sandstones of Yanchang Formation in Ordos Basin, China. Geol. J. 2018, 53, 707–724. [Google Scholar] [CrossRef]
- Morley, C.K.; Maczak, A.; Rungprom, T.; Ghosh, J.; Cartwright, J.A.; Bertoni, C.; Panpichityota, N. New style of honeycomb structures revealed on 3D seismic data indicate widespread diagenesis offshore Great South Basin, New Zealand. Mar. Pet. Geol. 2017, 86, 140–154. [Google Scholar] [CrossRef]
- Higgins, J.A.; Blättler, C.L.; Lundstrom, E.A.; Santiago-Ramos, D.P.; Akhtar, A.A.; Crüger Ahm, A.-S.; Bialik, O.; Holmden, C.; Bradbury, H.; Murray, S.T.; et al. Mineralogy, early marine diagensis, and the chemistry of shallow-water carbonate sediments. Geochim. Cosmochim. Acta 2018, 220, 512–534. [Google Scholar] [CrossRef]
- Fawad, M.; Mondol, N.H.; Baig, I.; Jahren, J. Diagenetic related flat spots within the Paleogene Sotbakken Group in the vicinity of the Senja Ridge, Barents Sea. Pet. Geosci. 2019, 122. [Google Scholar] [CrossRef]
- He, J.; Wang, H.; Zhang, C.; Yang, X.; Shangguan, Y.; Zhao, R.; Gong, Y.; Wu, Z. A comprehensive analysis of the sedimentology, petrography, diagenesis and reservoir quality of sandstones from the Oligocene Xiaganchaigou (E3) Formation in the Lengdong area, Qaidam Basin, China. J. Pet. Explor. Prod. Technol. 2019, 9, 953–969. [Google Scholar] [CrossRef]
- Kruge, M.A. Biomarker geochemistry of the Miocene Monterey Formation, West San Joaquin Basin, California: Implications for petroleum generation. Org. Geochem. 1986, 10, 517–530. [Google Scholar] [CrossRef]
- Behl, R.J. Chert spheroids of the Monterey Formation, California (USA): Early-diagenetic structures of bedded siliceous deposits. Sedimentology 2011, 58, 325–351. [Google Scholar] [CrossRef]
- Weller, R.; Behl, R.J. Physical and Mechanical Characteristics of the Opal-A to Opal-CT Transition Zone: Enhanced Diatomite Permeabiltiy from Heterogeneous Diagenetic Embrittlement. Search Discov. Artic. 2015, #51112, adapted from poster presentation given at Pacific section AAPG, SEG and SEPM Joint Technical Conference, Oxnard, California, USA, 3–5 May, 2015. [Google Scholar]
- Dralus, D. Chemical Interactions between Silicates and Their Pore Fluids: How They Affect Rock Physics Properties from Atomic to Reservoir Scales. Ph.D. Thesis, Stanford University, Stanford, CA, USA, August 2013. [Google Scholar]
- Dralus, D.; Lewan, M.D.; Peters, K. Kinetics of the Opal-A to Opal-CT Phase transition in Low- and High-TOC Siliceous Shale Source Rocks. Search Discov. Artic. 2015, #41708, adapted form oral presentation given at AAPG Annual Convention & Exhibition, Denver, Colorado, USA, May 31–June 3, 2015. [Google Scholar]
- Blystad, P.; Brekke, H.; Færseth, R.B.; Larsen, B.T.; Skogseid, J.; Tørudbakken, B. Structural Elements of the Norwegian Continental Shelf, Part II: The Norwegian Sea Region; Technical Report for Norwegian petroleum Directorate; Norwegian Petroleum Directorate: Stavanger, Norway, 1995; Volume 8, ISBN 82-7257-452-7.
- Davies, R.J.; Cartwright, J.A. Kilometer-scale chemical reaction boundary patters and deformation in sedimentary rocks. Earth Planet. Sci. Lett. 2007, 262, 125–137. [Google Scholar] [CrossRef]
- Peltonen, C.; Marcussen, Ø.; Bjørlykke, K.; Jahren, J. Mineralogical control on mudstone compaction: A study of Late Cretaceous to Early Tertiary mudstones of the Vøring and Møre basins, Norwegian Sea. Pet. Geosci. 2008, 14, 127–138. [Google Scholar] [CrossRef]
- Davies, R.J.; Ireland, M.T.; Cartwright, J.A. Differential compaction due to the irregular topology of a diagenetic reaction boundary: A new mechanism for the formation of polygonal faults. Basin Res. 2009, 21, 354–359. [Google Scholar] [CrossRef]
- Neagu, R.C.; Cartwright, J.; Davies, R.; Jensen, L. Fossilisation of a silica diagenesis reaction front on the mid-Norwegian margin. Mar. Pet. Geol. 2010, 27, 2141–2155. [Google Scholar] [CrossRef]
- Davies, R.J.; Ireland, M.T. Initiation and propagation of polygonal fault arrays by thermally triggered volume reduction reactions in siliceous sediment. Mar. Geol. 2011, 289, 150–158. [Google Scholar] [CrossRef]
- Ireland, M.T.; Davies, R.J.; Goulty, N.R.; Carruthers, D. Structure of a silica diagenetic transformation zone: The Gjallar Ridge, offshore Norway. Sedimentology 2011, 58, 424–441. [Google Scholar] [CrossRef]
- Wrona, T.; Taylor, K.G.; Jackson, C.A.-L.; Huuse, M.; Najorka, J.; Pan, I. Impact of silica diagenesis on the porosity of fine-grained strata: An analysis of Cenozoic mudstones from the North Sea. Geochem. Geophys. Geosyst. 2017, 18, 1537–1549. [Google Scholar] [CrossRef]
- Fjeldskaar, W.; Andersen, Å.; Johansen, H.; Lander, R.; Blomvik, V.; Skurve, O.; Michelsen, J.K.; Grunnaleite, I.; Mykkeltveit, J. Bridging the gap between basin modelling and structural geology. Reg. Geol. Metallog. 2017, 72, 65–77. [Google Scholar]
- Brekke, H. The tectonic evolution of the Norwegian Sea Continental Margin with emphasis on the Vøring and Møre Basins. In Dynamics of the Norwegian Margin; Special Publications; Nøttvedt, A., Ed.; Geological Society: London, UK, 2000; Volume 167, pp. 327–378. [Google Scholar]
- Bukovics, C.; Cartier, E.G.; Shaw, N.D.; Ziegler, P.A. Structure and development of the mid-Norway Continental Margin. In Petroleum Geology of the North. European Margin; Spencer, A.M., Ed.; Norwegian Petroleum Society: Stavanger, Norway; Graham and Trotman: Bristol, UK, 1984; pp. 407–423. [Google Scholar]
- Gabrielsen, R.H.; Færseth, R.; Hamar, G.; Rønnevik, H. Nomenclature of the main structural features on the Norwegian Continental Shelf north of the 62nd parallel. In Petroleum Geology of the North European Margin; Spencer, A.M., Ed.; Norwegian Petroleum Society: Stavanger, Norway; Graham and Trotman: Bristol, UK, 1984; pp. 41–60. [Google Scholar]
- Price, I.; Rattey, R.P. Cretaceous tectonics off mid-Norway: Implications for the Rockall and Faeroe-Shetland troughs. J. Geol. Soc. 1984, 141, 985–992. [Google Scholar] [CrossRef]
- Surlyk, F.; Piasecki, S.; Rolle, F.; Stemmerik, L.; Thomsen, E.; Wrang, P. The Permian base of East Greenland. In Petroleum Geology of the North European Margin; Spencer, A.M., Ed.; Norwegian Petroleum Society: Stavanger, Norway; Graham and Trotman: Bristol, UK, 1984; pp. 303–315. [Google Scholar]
- Brekke, H.; Riis, F. Tectonics and basin evolution of the Norwegian shelf between 62°N and 72°N. Nor. Geol. Tidsskr. 1987, 67, 295–322. [Google Scholar]
- Doré, A.G.; Lundin, E.R. Cenozoic compressional structures on the NE Atlantic margin: Nature, origin and potential significance for hydrocarbon exploration. Pet. Geosci. 1996, 2, 299–311. [Google Scholar] [CrossRef]
- Swiecicki, T.; Gibbs, P.B.; Farrow, G.E.; Coward, M.P. A tectonostratigraphic framework for the Mid-Norway region. Mar. Pet. Geol. 1998, 15, 245–276. [Google Scholar] [CrossRef]
- Scheck-Wenderoth, M.; Raum, T.; Faleide, J.I.; Mjelde, R.; Horsfield, B. The transition from the continent to the ocean: A deeper view on the Norwegian margin. J. Geol. Soc. 2007, 164, 855–868. [Google Scholar] [CrossRef]
- Mjelde, R.; Kodaira, S.; Shimamura, H.; Kanazawa, T.; Shiobara, H.; Berg, E.W.; Riise, O. Crustal structure of the central part of the Vøring Basin, mid- Norway margin, from ocean bottom seismographs. Tectonophysics 1997, 277, 235–257. [Google Scholar] [CrossRef]
- Talwani, M.; Eldholm, O. Evolution of the Norwegian-Greenland Sea. GSA Bull. 1977, 88, 969–999. [Google Scholar] [CrossRef]
- Eldholm, O.; Thiede, J.; Taylor, E. The Norwegian continental margin: Tectonic, volcanic, and paleoenvironmental framework. In Proceedings of the Ocean Drilling Program, Scientific Results, College Station, TX, USA; 1989; Volume 104. [Google Scholar] [CrossRef]
- Stuevold, L.M.; Eldholm, O. Cenozoic uplift of Fennoscandia inferred from a study of the mid-Norwegian margin. Glob. Planet. Chang. 1996, 12, 359–386. [Google Scholar] [CrossRef]
- Grunnaleite, I.; Fjeldskaar, W.; Wilson, J.; Faleide, J.I.; Zweigel, J. Effect of local variations of vertical and horizontal stresses on the Cenozoic structuring of the mid-Norwegian shelf. Tectonophysics 2009, 470, 267–283. [Google Scholar] [CrossRef]
- Dalland, A.; Worsley, D.; Ofstad, K. A Lithostrategraphic Scheme for the Mesozoic and Cenozoic Succession Offshore Mid- and Northern Norway; Technical Report for Norwegian petroleum Directorate; Norwegian Petroleum Directorate: Stavanger, Norway, 1988; Volume 4, ISBN 82-7275-241-9.
- Hjelstuen, B.O.; Eldholm, O.; Skogseid, J. Ceonzoic evolution of the northern Vøring margin. GSA Bull. 1999, 111, 1792–1807. [Google Scholar] [CrossRef]
- Svensen, H.; Planke, S.; Corfu, F. Zircon dating ties NE Atlantic sill emplacement to initial Eocene global warming. J. Geol. Soc. 2010, 167, 433–436. [Google Scholar] [CrossRef]
- Bungum, H.; Alsaker, A.; Kvamme, L.B.; Hansen, R.A. Seismicity and Seismotectonics of Norway and Nearby Continental Shelf Areas. J. Geophys. Res. 1991, 96, 2249–2265. [Google Scholar] [CrossRef]
- Byrkjeland, U.; Bungum, H.; Eldholm, O. Seismotectonics of the Norwegian continental margin. J. Geophys. Res. 2000, 105, 6221–6236. [Google Scholar] [CrossRef]
- Fjeldskaar, W.; Lindholm, C.; Dejls, J.F.; Fjeldskaar, I. Post-glacial uplift, neotectonics and seismicity in Fennoscandia. Quat. Sci. Rev. 2000, 19, 1413–1422. [Google Scholar] [CrossRef]
- Hicks, E.C.; Bungum, H.; Lidholm, C.D. Stress inversion of earthquake focal mechanism solutions from onshore and offshore Norway. Nor. Geol. Tidsskr. 2000, 80, 235–250. [Google Scholar] [CrossRef]
- Bungum, H.; Olesen, O.; Pascal, C.; Gibbons, S.; Lindholm, C.; Vestøl, O. To what extent is the present seismicity of Norway driven by post-glacial rebound? J. Geol. Soc. 2010, 167, 373–384. [Google Scholar] [CrossRef]
- Lander, R.H.; Langfeldt, M.; Bonnell, L.; Fjeldskaar, W. BMT User’s Guide; Tectonor AS Proprietary Publication: Stavanger, Norway, 1994. [Google Scholar]
- Fjeldskaar, W. BMTTM—Exploration tool combining tectonic and temperature modeling: Business Briefing: Exploration & Production. Oil Gas Rev. 2003, 1–4. [Google Scholar]
- Walderhaug, O.; Lander, R.H.; Bjørkum, P.A.; Oelkers, E.H.; Bjørlykke, K.; Nadeau, P.H. Modelling Quartz Cementation and Porosity in Reservoir Sandstones: Examples from the Norwegian Continental Shelf. In Quartz Cementation in Sandstones, Special Publication; Worden, R.H., Morad, S., Eds.; International Association of Sedimentologists: Algiers, Algeria, 2000; Volume 29, pp. 39–49. [Google Scholar]
- Walderhaug, O. Precipitation rates for quartz cement in sandstones determined by fluid-inclusion microthermometry and temperature-history modeling. J. Sediment. Res. 1994, A64, 324–333. [Google Scholar] [CrossRef]
- Walderhaug, O. Kinetic Modeling of Quartz Cementation and Porosity Loss in Deeply Buried Sandstone Reservoirs. AAPG Bull. 1996, 80, 731–745. [Google Scholar]
- Lander, R.H.; Walderhaug, O. Predicting Porosity through Simulating Sandstone Compaction and Quartz Cementation. AAPG Bull. 1999, 83, 433–449. [Google Scholar]
- Angevine, C.L.; Turcotte, D.L. Porosity reduction by pressure solution: A theoretical model for quartz arenites. Geol. Soc. Am. Bull. 1983, 94, 1129–1134. [Google Scholar] [CrossRef]
- Dewers, T.; Ortoleva, P. A coupled reaction/transport/mechanical model for intergranular pressure solution, stylolites, and differential compaction and cementation in clean sandstones. Geochim. Cosmochim. Acta 1990, 54, 1609–1625. [Google Scholar] [CrossRef]
- Mullis, A.M. The Role of Silica Precipitation Kinetics in Determining the Rate of Quartz Pressure Solution. J. Geophys. Res. 1991, 96, 10007–10013. [Google Scholar] [CrossRef]
- Ramm, M. Porosity-depth trends in reservoir sandstones: Theoretical models related to Jurassic sandstones offshore Norway. Mar. Pet. Geol. 1992, 9, 553–567. [Google Scholar] [CrossRef]
- Stephenson, L.P.; Plumley, W.J.; Palciauskas, V.V. A model for sandstone compaction by grain interpenetration. J. Sediment. Res. 1992, 62, 11–22. [Google Scholar]
- DeMaster, D.J. The supply and accumulation of silica in the marine environment. Geochim. Cosmochim. Acta 1981, 45, 1715–1732. [Google Scholar] [CrossRef]
- Kastner, M.; Keene, J.B.; Gieskes, J.M. Diagenesis of siliceous oozes—I. chemical controls on the rate of opal-A to opal-CT transformation—An experimental study. Geochim. Cosmochim. Acta 1977, 41, 1041–1059. [Google Scholar] [CrossRef]
- Grau, A.; Sterling, R.; Kidney, R. Success! Using Seismic Attributes and Horizontal Drilling to Delineate and Exploit a Diagenetic Trap, Monterey Shale, San Joaquin Valley, California. In Proceedings of the AAPG Annual Convention, Salt Lake City, Utah, USA, 11–14 May 2003. [Google Scholar]
- Kidney, R.; Sterling, R.; Grau, A. Delineation of a diagenetic trap using P-wave and converted-wave seismic data in Miocene McLure Shale, San Joaquin Basin, CA. In SEG Technical Program Expanded Abstracts 2005; Society of Exploration Geophysicists: Tulsa, OK, USA, 2005; pp. 2329–2332. [Google Scholar]
- Isaacs, C.M. Influence of rock composition on kinetics of silica phase changes in the Monterey Formation, Santa Barbara area, California. Geology 1982, 10, 304–308. [Google Scholar] [CrossRef]
- Keller, M.A.; Isaacs, C.M. An Evaluation of Temperature Scales for Silica Diagenesis in Diatomaceous Sequences Including a New Approach Based on the Miocene Formation, California. Geo-Mar. Lett. 1985, 5, 31–35. [Google Scholar] [CrossRef]
- Ernst, W.G.; Calvert, S.E. An Experimental Study of the Recrystallization of Porcelanite and its bearing on the Origin of some bedded Cherts. Am. J. Sci. 1969, 267, 114–133. [Google Scholar]
- Castellan, G.W. Physical Chemistry, 3rd ed.; Addison-Wesley Publishing Company: Reading, MA, USA, 1969. [Google Scholar]
- Jiang, S. Clay Minerals from the Perspective of Oil and Gas Exploration. In Clay Minerals in Nature—Their Characterization, Modification and Application; Valaškova, M., Martynkova, G.S., Eds.; IntechOpen: London, UK, 2012. [Google Scholar] [CrossRef] [Green Version]
- Bjørkum, P.A.; Nadeau, P.H. Temperature Controlled Porosity/Permeability Reduction, Fluid Migration, and Petroleum Exploration in Sedimentary Basins. APPEA J. 1998, 38, 453–465. [Google Scholar] [CrossRef]
- Pevear, D.R. Illite and hydrocarbon exploration. Proc. Natl. Acad. Sci. USA 1999, 96, 3440–3446. [Google Scholar] [CrossRef] [PubMed] [Green Version]
- Boles, J.R.; Franks, S.G. Clay Diagenesis in Wilcox sandstones of southwest Texas: Implications of smectite diagenesis on sandstone cementation. J. Sediment. Res. 1979, 49, 55–70. [Google Scholar]
- Huang., W.-L.; Longo, J.M.; Pevear, D.R. An experimentally derived kinetic model for smectite-to-illite conversion and its use as a geothermometer. Clays Clay Miner. 1993, 41, 162–177. [Google Scholar] [CrossRef]
- Roaldset, E.; Wei, H.; Grimstad, S. Smectite to illite conversion by hydrous pyrolysis. Clay Miner. 1998, 33, 147–158. [Google Scholar] [CrossRef]
- Nadeau, P.H.; Wilson, M.J.; McHardy, W.J.; Tait, J.M. Interstratified Clays as Fundamental Particles. Science 1984, 225, 923–925. [Google Scholar] [CrossRef]
- Nadeau, P.H.; Wilson, M.J.; McHardy, W.J.; Tait, J.M. The conversion of smectite to illite during diagenesis: Evidence from some illitic clays from bentonites and sandstones. Mineral. Mag. 1985, 49, 393–400. [Google Scholar] [CrossRef]
- Nadeau, P.H.; Bain, D.C. Composition of some smectites and diagenetic illitic clays and implications for their origin. Clays Clay Miner. 1986, 34, 455–464. [Google Scholar] [CrossRef]
- Bjørlykke, K.; Aagaard, P.; Egeberg, P.K.; Simmons, S.P. Geochemical constraints from formation water analyses from the North Sea and the Gulf Coast Basins on quartz, feldspar and illilte precipitation in reservoir rocks. In The Geochemistry of Reservoirs; Special Publication; Cubitt, J.M., England, W.A., Eds.; Geological Society: London, UK, 1995; Volume 86, pp. 33–50. [Google Scholar]
- Eberl, D.; Hower, J. Kinetics of illite formation. Geol. Soc. Am. Bull. 1976, 87, 1326–1330. [Google Scholar] [CrossRef]
- Wei, H.; Roaldset, E.; Bjorøy, M. Parallel Reaction kinetics of smectite to illite conversion. Clay Miner. 1996, 31, 365–376. [Google Scholar] [CrossRef]
- Hillier, S.; Matyas, J.; Matter, A.; Vasseur, G. Illite/Smectite diagenesis and its variable correlation with vitrinite reflectance in the Pannonian Basin. Clays Clay Miner. 1995, 43, 174–183. [Google Scholar] [CrossRef]
- Sachsenhofer, R.F.; Rantitcsh, G.; Hasenhüttl, C.; Russegger, B.; Jelen, B. Smectite to illite diagenesis in early Miocene sediments from the hyperthermal western Pannonian Basin. Clay Miner. 1998, 33, 523–537. [Google Scholar]
- Anell, I.; Thybo, H.; Artemieva, I.M. Cenozoic uplift and subsidence in the North Atlantic region: Geological evidence revisited. Tectonophysics 2009, 474, 78–105. [Google Scholar] [CrossRef] [Green Version]
- Anell, I.; Thybo, H.; Stratford, W. Relating Cenozoic North Sea sediments to topography in southern Norway: The interplay between tectonics and climate. Earth Planet. Sci. Lett. 2010, 300, 19–32. [Google Scholar] [CrossRef]
- Nielsen, S.B.; Gallagher, K.; Leighton, C.; Balling, N.; Svenningsen, L.; Jacobsen, B.H.; Thomsen, E.; Nielsen, O.B.; Heilmann-Clausen, C.; Egholm, D.L.; et al. The evolution of western Scandinavian topography: A review of Neogene uplift versus the ICE (isostasy–climate–erosion) hypothesis. J. Geodyn. 2009, 47, 72–95. [Google Scholar] [CrossRef] [Green Version]
- Nielsen, S.B.; Clausen, O.R.; Jacobsen, B.H.; Thomsen, E.; Huuse, M.; Gallagher, K.; Balling, N.; Egholm, D. The ICE hypothesis stands: How the dogma of late Ceonozoic tectonic uplift can no longer be sustained in the light of data and physical laws. J. Geodyn. 2010, 50, 102–111. [Google Scholar] [CrossRef]
- Sclater, J.G.; Christie, P.A.F. Continental stretching: An explanation of the post-mid-cretaceous subsidence of the central North Sea basin. J. Geophys. Res. 1980, 85, 3711–3739. [Google Scholar] [CrossRef]
- Čermác, V.; Rybach, L. Thermal properties: Thermal conductivity and specific heat of minerals and rocks. In Landolt-Börnstein Zahlenwerte und Functionen aus Naturwissenschaften und Technik, Neue Serie, Physikalische Eigenschaften der Gesteine; Angeneister, G., Ed.; Springer: Berlin/Heidelberg, Germany; New York, NY, USA, 1982; pp. 305–343. [Google Scholar]
- Pollastro, R.M. Considerations and Applications of the Illite/Smectite Geothermometer in Hydrocarbon-Bearing Rocks of Miocene to Mississippian Age. Clays Clay Miner. 1993, 41, 119–133. [Google Scholar] [CrossRef]
- Gudmundsson, A. Rock Fractures in Geological Processes, 1st ed.; Cambridge University Press: Cambridge, UK, 2011. [Google Scholar]
- Bell, F.G. Engineering Properties of Soils and Rocks, 4th ed.; Blackwell: Oxford, UK, 2000. [Google Scholar]
- Farmer, I. Engineering Behaviour of Rocks, 2nd ed.; Chapman and Hall: London, UK, 1983. [Google Scholar]
- Paterson, M.S.; Wong, T.F. Experimental Rock Deformation: The Brittle Field, 2nd ed.; Springer: Berlin, Germany, 2005. [Google Scholar]
- Haimson, B.C.; Rummel, F. Hydrofracturing stress measurements in the Iceland research drilling project drill hole at Reydarfjördur, Iceland. J. Geophys. Res. 1982, 87, 6631–6649. [Google Scholar] [CrossRef]
- Schultz, R.A. Limits on strength and deformation properties of jointed basaltic rock masses. Rock Mech. Rock Eng. 1995, 28, 1–15. [Google Scholar] [CrossRef]
- Amadei, B.; Stephansson, O. Rock Stress and Its Measurement; Chapman and Hall: London, UK, 1997. [Google Scholar]
- Gudmundsson, A.; Brenner, S.L. How hydrofractures become arrested. Terra Nova 2001, 13, 456–462. [Google Scholar] [CrossRef]
- Gudmundsson, A.; Fjeldskaar, I.; Brenner, S.L. Propagation pathways and fluid transport of hydrofractures in jointed and layered rocks in geothermal fields. J. Volcanol. Geotherm. Res. 2002, 116, 257–278. [Google Scholar] [CrossRef] [Green Version]
- Fjeldskaar, W.; Prestholm, E.; Guargena, C.; Stephenson, M. Mineralogical and diagenetic control on the thermal conductivity of the sedimentary sequences in the Bjørnøya Basin, Barents Sea. In Basin Modelling: Advances and Applications, Special Publication; Doré, A.G., Ed.; NPF: Stavanger, Norway, 1993; Volume 3, pp. 445–453. [Google Scholar]
- Ireland, M.; Goulty, N.R.; Davies, R.J. Influence of pore water chemistry on silica diagenesis: Evidence from the interaction of diagenetic readtion zones with polygonal fault systems. J. Geol. Soc. 2010, 167, 273–279. [Google Scholar] [CrossRef]
- McKinley, J.M.; Worden, R.H.; Ruffell, A.H. Contact Diagenesis: The effect of an intrusion on reservoir quality in the Triassic Sherwood Sandstone group, Northern Ireland. J. Sediment. Res. 2001, 71, 484–495. [Google Scholar] [CrossRef]
- Bernet, M.; Gaupp, R. Diagenetic history of Triassic sandstone from the Beacon Supergroup in central Victoria Land, Antarctica. N. Z. J. Geol. Geophys. 2005, 48, 447–458. [Google Scholar] [CrossRef]
- Grove, C. Direct and Indirect Effects of Flood Basalt Volcanism on Reservoir Quality Sandstone. Ph.D. Thesis, Durham University, Durham and Stockton-on-Tees, UK, 2014. [Google Scholar]
- Nejbert, K.; Krajewski, K.P.; Dubinska, E.; Pécskay, Z. Dolerites of Svalbard, north-west Barents Sea Shelf: Age, tectonic setting and significance for geotectonic interpretation of the High-Arctic Large Igneous Province. Polar Res. 2011, 30, 7306. [Google Scholar] [CrossRef]
- Ehrenberg, S.N. Relationship between Diagenesis and Reservoir Quality in Sandstones of the Garn Formation, Haltenbanken, Mid-Norwegian Continental Shelf. AAPG Bull. 1990, 74, 1538–1558. [Google Scholar] [CrossRef]
- Bjørlykke, K.; Nedkvitne, T.; Ramm, M.; Saigal, G.C. Diagenetic processes in the Brent Group (Middle Jurassic) reservoirs of the North Sea: An overview. In Geology of the Brent Group; Special Publication; Morton, A.C., Haszeldine, R.S., Giles, M.R., Brown, S., Eds.; Geological Society: London, UK, 1992; Volume 61, pp. 263–287. [Google Scholar]
- Ehrenberg, S.N. Preservation of Anomalously High Porosity in Deeply Buried Sandstones by Grain-Coating Chlorite: Examples from the Norwegian Continental Shelf. AAPG Bull. 1993, 77, 1260–1286. [Google Scholar]
- Freiburg, J.T.; Ritzi, R.W.; Kehoe, K.S. Depositional and diagenetic controls on anomalously high porosity within a deeply buried CO2 storage reservoir—The Cambrian Mt. Simon Sandstone, Illinois Basin, USA. Int. J. Greenh. Gas Control 2016, 55, 42–54. [Google Scholar] [CrossRef] [Green Version]
- Lin, W.; Chen, L.; Lu, Y.; Hu, H.; Liu, L.; Liu, X.; Wei, W. Diagenesis and its impact on reservoir quality for the Chang 8 oil group tight sandstone of the Yanchang Formation (upper Triassic) in southwestern Ordos basin, China. J. Pet. Explor. Prod. Technol. 2017, 7, 947–959. [Google Scholar] [CrossRef] [Green Version]
- PetroWiki.org. Available online: https://petrowiki.org/Diatomite (accessed on 27 September 2019).
- Tsuji, T.; Masui, Y.; Yokoi, S. New hydrocarbon trap models for the diagenetic transformation of opal-CT to quartz in Neogene siliceaous rocks. AAPG Bull. 2011, 95, 449–477. [Google Scholar] [CrossRef]
- Davies, R.J.; Cartwright, J. A fossilized Opal A to Opal C/T transformation on the northeast Atlantic margin: Support for a significantly elevated Palaeogeothermal gradient during the Neogene? Basin Res. 2002, 14, 467–486. [Google Scholar] [CrossRef]
- Hall, P.L.; Astill, D.M.; McConnell, J.D.C. Thermodynamic and structural aspects of the dehydration of smectites in sedimentary rocks. Clay Miner. 1986, 21, 633–648. [Google Scholar] [CrossRef]
- Singer, A.; Müller, G. Diagenesis in argillaceous sediments. In Diagenesis in Sediments and Sedimentary Rocks; Larsen, G., Chilingar, G.V., Eds.; Elsevier: Amsterdam, The Netherlands, 1983. [Google Scholar]
- Essene, E.J.; Peacor, D.R. Clay mineral thermometry—A critical perspective. Clays Clay Miner. 1995, 43, 540–553. [Google Scholar] [CrossRef]
- Podladchikov, Y.Y.; Wickham, S.M. Crystallization of Hydrous Magmas: Calculation of Associated Thermal Effects, Volatile Fluxes, and Isotopic Alteration. J. Geol. 1994, 102, 25–45. [Google Scholar] [CrossRef]
- Iyer, K.; Rüpke, L.; Galerne, C.Y. Modeling fluid flow in sedimentary basins with sill intrusions: Implications for hydrothermal venting and climate change. Geochem. Geophys. Geosyst. 2013, 14, 5244–5262. [Google Scholar] [CrossRef] [Green Version]
- Iyer, K.; Schmid, D.W.; Planke, S.; Millett, J. Modelling hydrothermal venting in volcanic sedimentary basins: Impact on hydrocarbon maturation and paleoclimate. Earth Planet. Sci. Lett. 2017, 467, 30–42. [Google Scholar] [CrossRef] [Green Version]
- Wang, D.; Manga, M. Organic matter maturation in the contact aureole of an igneous sill as a tracer of hydrothermal convection. J. Geophys. Res. Solid Earth 2015, 120, 4102–4112. [Google Scholar] [CrossRef] [Green Version]
- Annen, C. Factors affecting the thickness of thermal aureoles. Front. Earth Sci. 2017, 5, 1–13. [Google Scholar] [CrossRef] [Green Version]
- Planke, S.; Rasmussen, T.; Rey, S.; Myklebust, R. Seismic characteristics and distribution of volcanic intrusions and hydrothermal vent complexes in the Vøring and Møre basins. In Petroleum Geology: North-West Europe and Global Perspectives, Proceedings of the 6th Petroleum Geology Conference; Dorè, A.G., Vining, B.A., Eds.; Geological Society: London, UK, 1 January 2005; pp. 833–844. [Google Scholar]
Figure 1.
Location of the studied profile (VB-2-87-B) in the Vøring Basin offshore mid Norway. Modified after Sydnes et al. [10].
Figure 1.
Location of the studied profile (VB-2-87-B) in the Vøring Basin offshore mid Norway. Modified after Sydnes et al. [10].

Figure 2.
Seismic section and the interpreted, depth converted section of VB-2-87-B in the Vøring Basin offshore mid-Norway. Interpretation is obtained from Blystad et al., [40].
Figure 2.
Seismic section and the interpreted, depth converted section of VB-2-87-B in the Vøring Basin offshore mid-Norway. Interpretation is obtained from Blystad et al., [40].

Figure 3.
Location of well 30/6-2 and 30/9-B-50H on the Oseberg fault block in the North Sea. The wells are located approximately 2 km apart. Modified from map on www.npd.no.
Figure 3.
Location of well 30/6-2 and 30/9-B-50H on the Oseberg fault block in the North Sea. The wells are located approximately 2 km apart. Modified from map on www.npd.no.

Figure 4.
The modeled porosity loss in well 30/6-2 in the North Sea. The result coincides well with observations by Roaldset and Wei [23] which shows the porosity loss starting approximately around 1740 m depth.
Figure 4.
The modeled porosity loss in well 30/6-2 in the North Sea. The result coincides well with observations by Roaldset and Wei [23] which shows the porosity loss starting approximately around 1740 m depth.

Figure 5.
Results for porosity loss due to quartz diagenesis for basin holding no sills (upper), 50 m thick sills (middle), and 100 m thick sills (lower).
Figure 5.
Results for porosity loss due to quartz diagenesis for basin holding no sills (upper), 50 m thick sills (middle), and 100 m thick sills (lower).

Figure 6.
The results for the opal A/CT transition zone when sills are disregarded (upper) and when they are included (lower). The transition zone is assumed to start where the porosity loss exceeds 20%.
Figure 6.
The results for the opal A/CT transition zone when sills are disregarded (upper) and when they are included (lower). The transition zone is assumed to start where the porosity loss exceeds 20%.

Figure 7.
Modeling results of smectite to illite diagnesis when sills are disregarded (left) and when they are included (right). The kinetic parameters of Roaldset et al. [95] and Hillier et al., [102] are used (cf. Table 1). The modeled isotherm of 80–90 °C is marked for scenario without sills (left). Lower left, pink, stippled lines indicate location of 10% and 15% porosity loss.

Figure 8.
Hydrocarbon maturation for the studied transect without (upper) and with (lower) sills. The onset of maturation of organic material and the onset of porosity loss due to transition of smectite to illite is almost concurrent (compare to Figure 7).
Figure 8.
Hydrocarbon maturation for the studied transect without (upper) and with (lower) sills. The onset of maturation of organic material and the onset of porosity loss due to transition of smectite to illite is almost concurrent (compare to Figure 7).

Figure 9.
Schematic overview of the synthetic models with an enlargement of the fault zone and definition of the units and Young’s modulus values used in the models. The X’s indicate the boundary fixated to avoid translation and rotation of the rock body during loading.
Figure 9.
Schematic overview of the synthetic models with an enlargement of the fault zone and definition of the units and Young’s modulus values used in the models. The X’s indicate the boundary fixated to avoid translation and rotation of the rock body during loading.

Figure 10.
Stress results for the synthetic case of a fault zone with arbitrary dimensions in a homogeneous basin. The tensile and shear stress developed in a homogeneous basin with one fault subject to horizontal compressive stress of 5 MPa (indicated by horizontal arrows). The host rock has a Young’s modulus value of 10 GPa, the damage zone is 1 GPa, and fault core 0.1 GPa.

Figure 11.
The resulting tensile and shear stresses of a fault with sill intruded through the fault zone with a surrounding area of diagenetic alteration when subject to horizontal compressive stress of 5 MPa (indicated by horizontal arrows). Dimensions are arbitrary in this synthetic model.
Figure 11.
The resulting tensile and shear stresses of a fault with sill intruded through the fault zone with a surrounding area of diagenetic alteration when subject to horizontal compressive stress of 5 MPa (indicated by horizontal arrows). Dimensions are arbitrary in this synthetic model.

Figure 12.
(a) Stress results for the Vøring profile when the sills are excluded, and diagenesis is disregarded. The results show the shear stresses due to 5 MPa compressive horizontal stress (indicated by horizontal arrows). The white box indicates the area enlarged in (b) and (c), the red box indicates the area enlarged in Figure 13 and Figure 14. (b) The same scenario as in (a) but with the tensile stresses due to compression. (c) The same scenario as in (a) and (b), but with tensile stresses due to 5 MPa extension (indicated by horizontal arrows).

Figure 13.
Stress results for the basin with 50 m thick sills subject to horizontal compressive stress of 5 MPa. The area and scale are shown by the red box in Figure 12. (a,b) The results for the basin when the sills and the transition zone of opal CT are accounted for. (c,d) The results when sills and quartz diagenesis are accounted for. White circles indicate areas where the sill does not penetrate the fault zone, however, parts of the fault zone have area altered by diagenesis.

Figure 14.
Stress results for the basin with 50 m thick sills subject to horizontal tensile stress of 5 MPa. The area and scale is shown by the red box in Figure 12. (a,b) Results for basin where sills and the transition zone of opal CT is accounted for. (c,d) Results for when sills and quartz diagenesis is accounted for. The white circle to the right indicates the area where the sill does not penetrate the fault zone, however, parts of the fault zone have area altered by diagenesis. This area concentrates stresses, and when high enough, may contribute to fault reactivation and fracture development. The sills are 50 m thick.


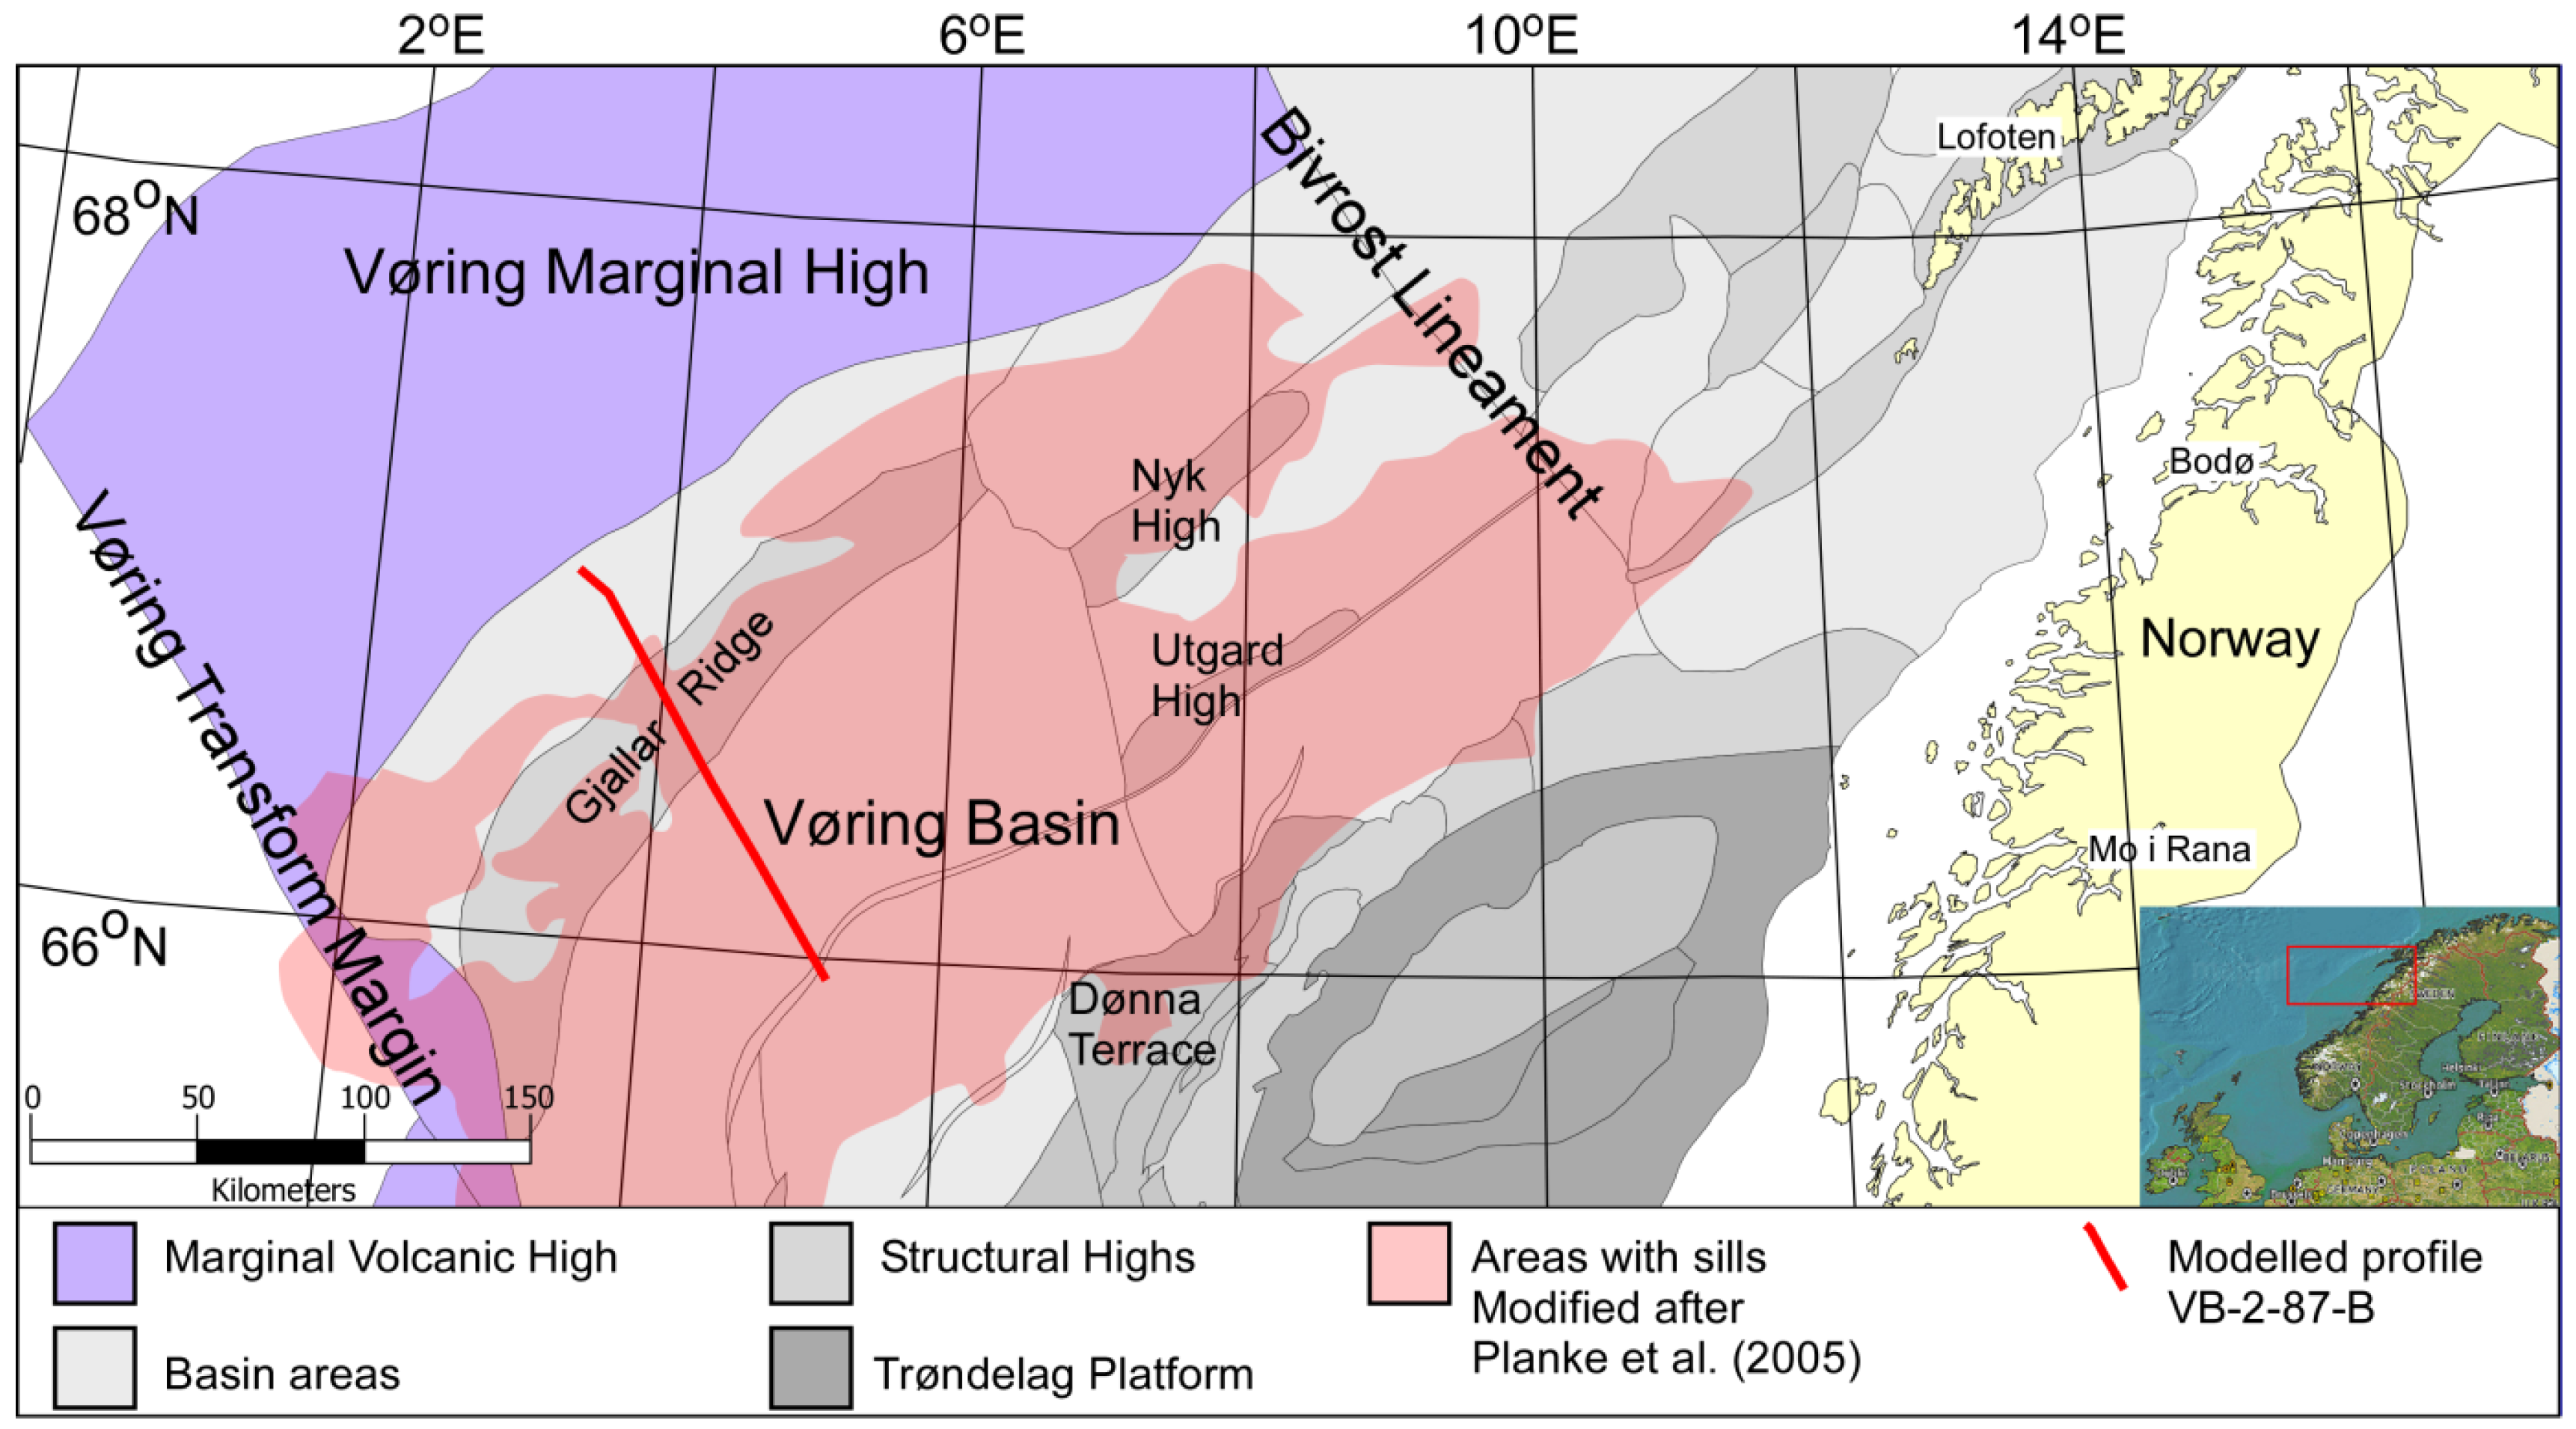
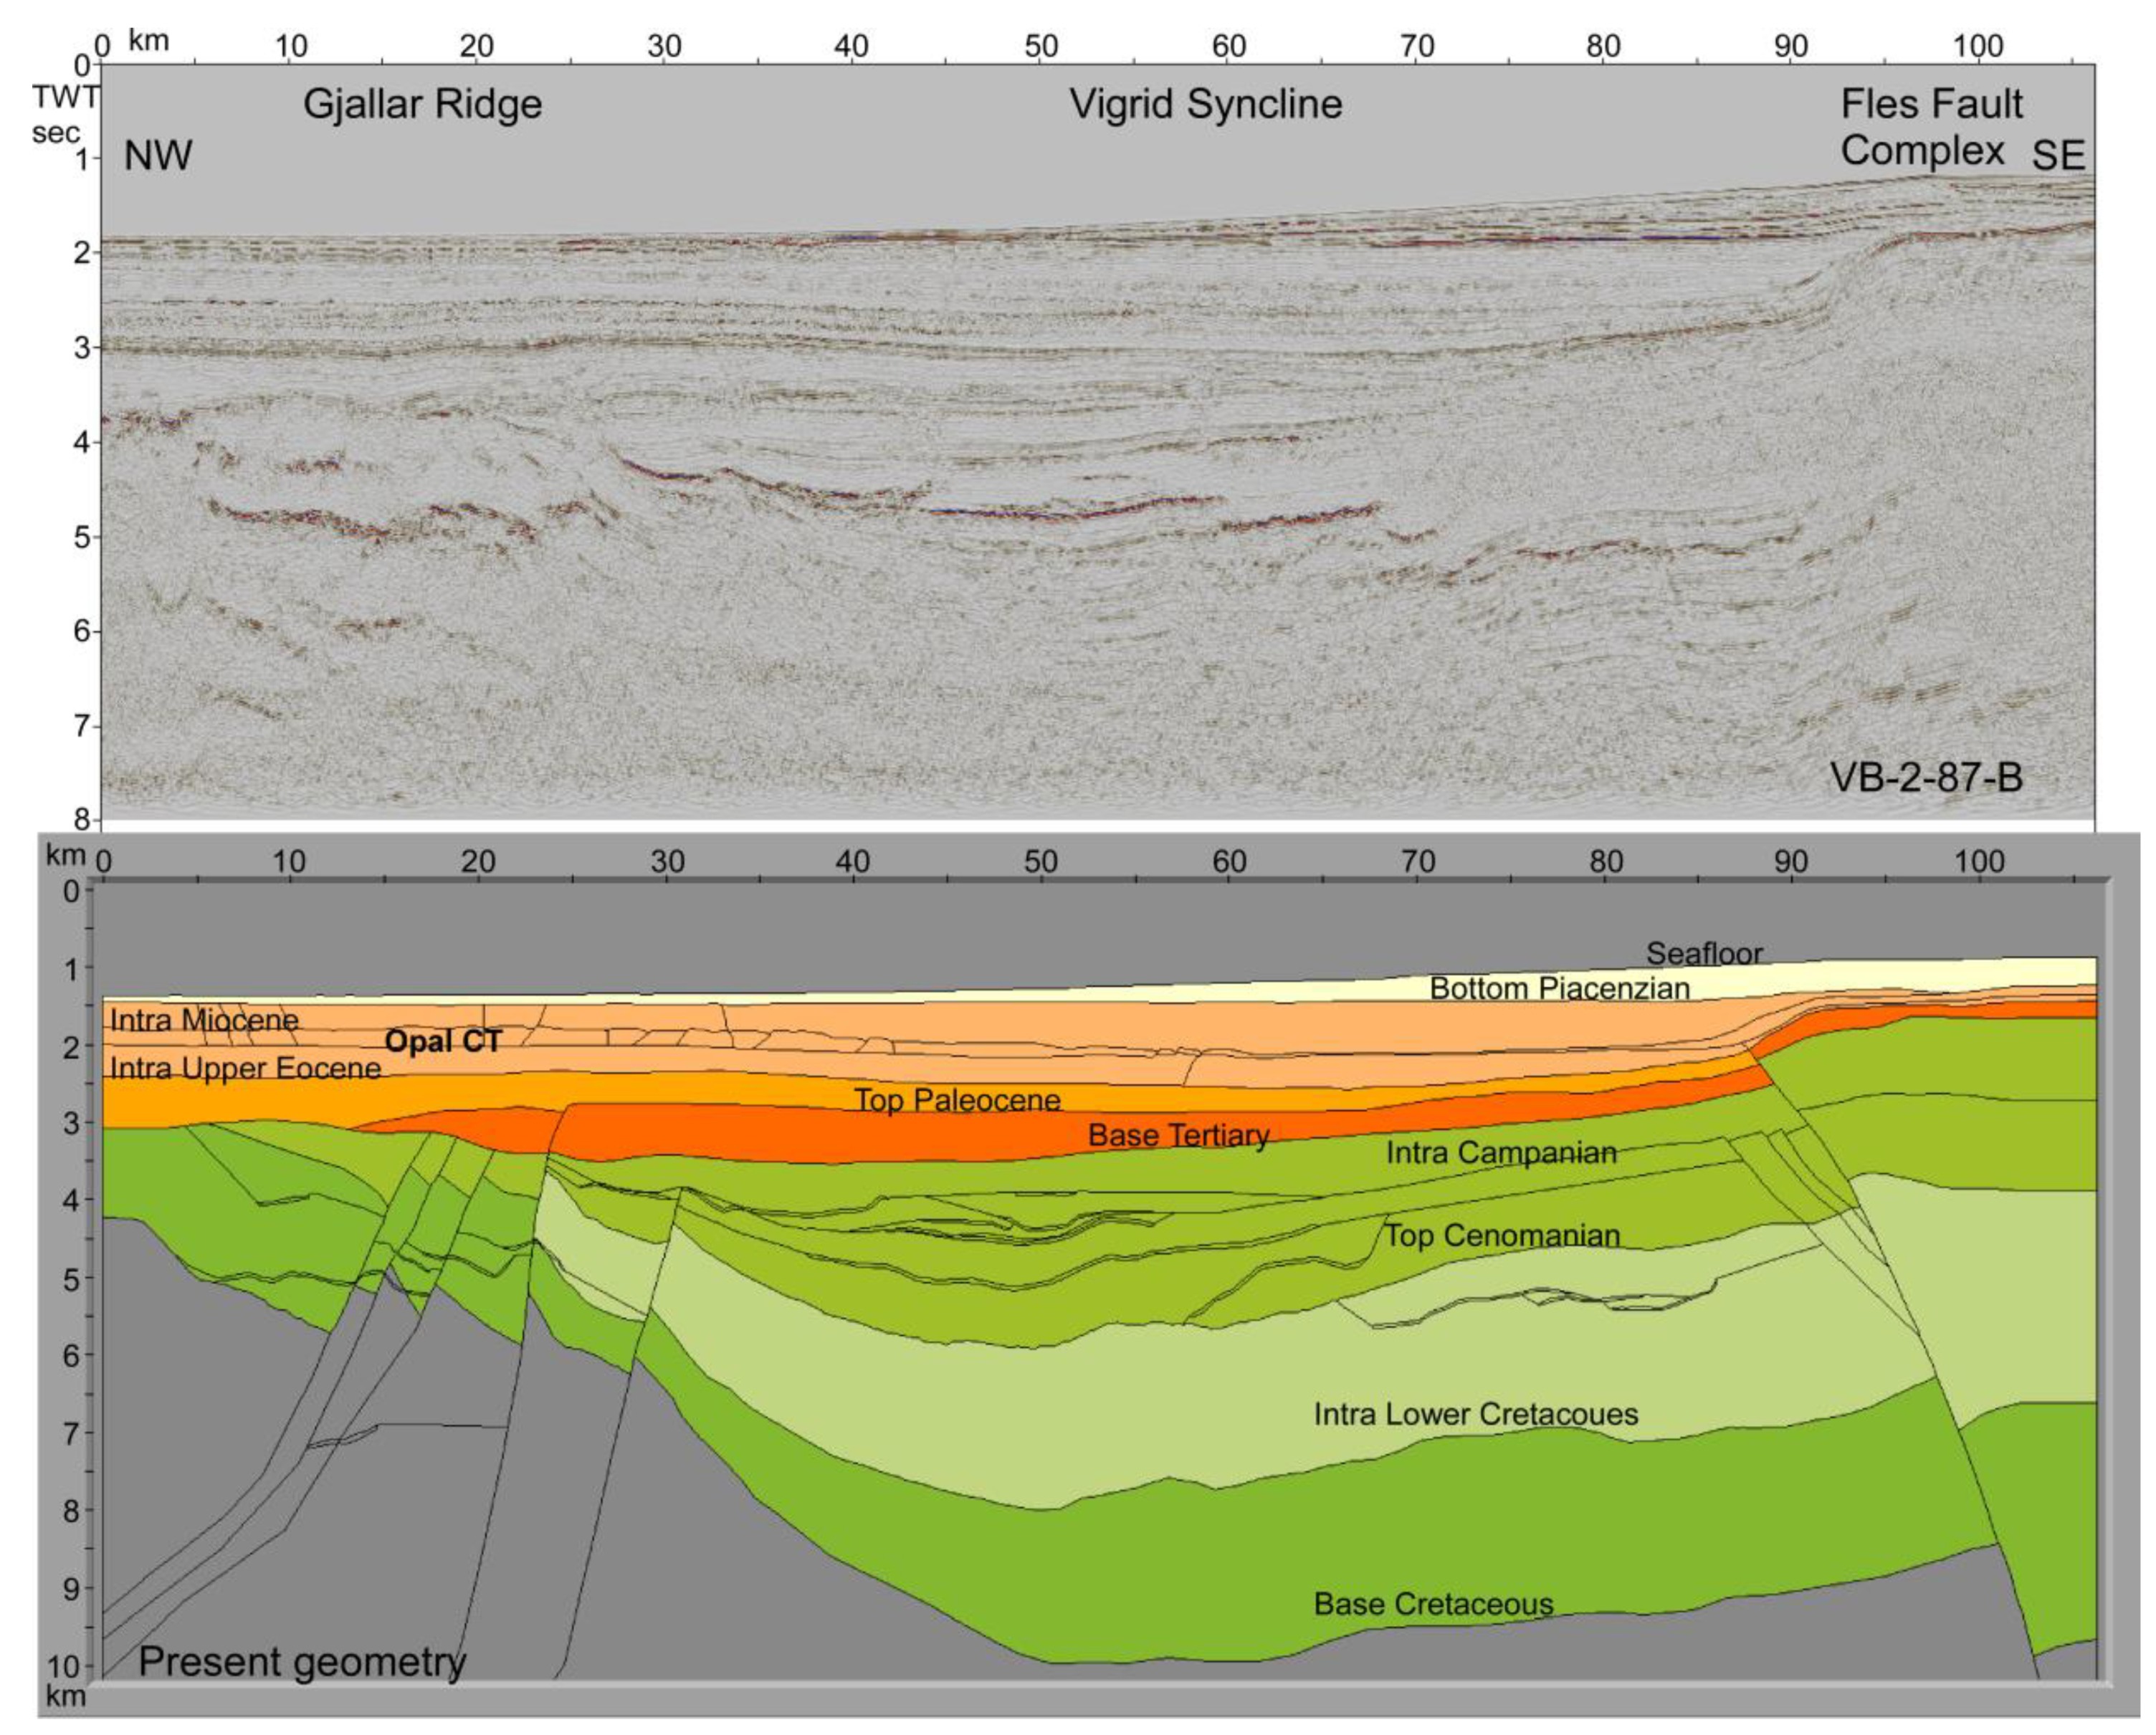
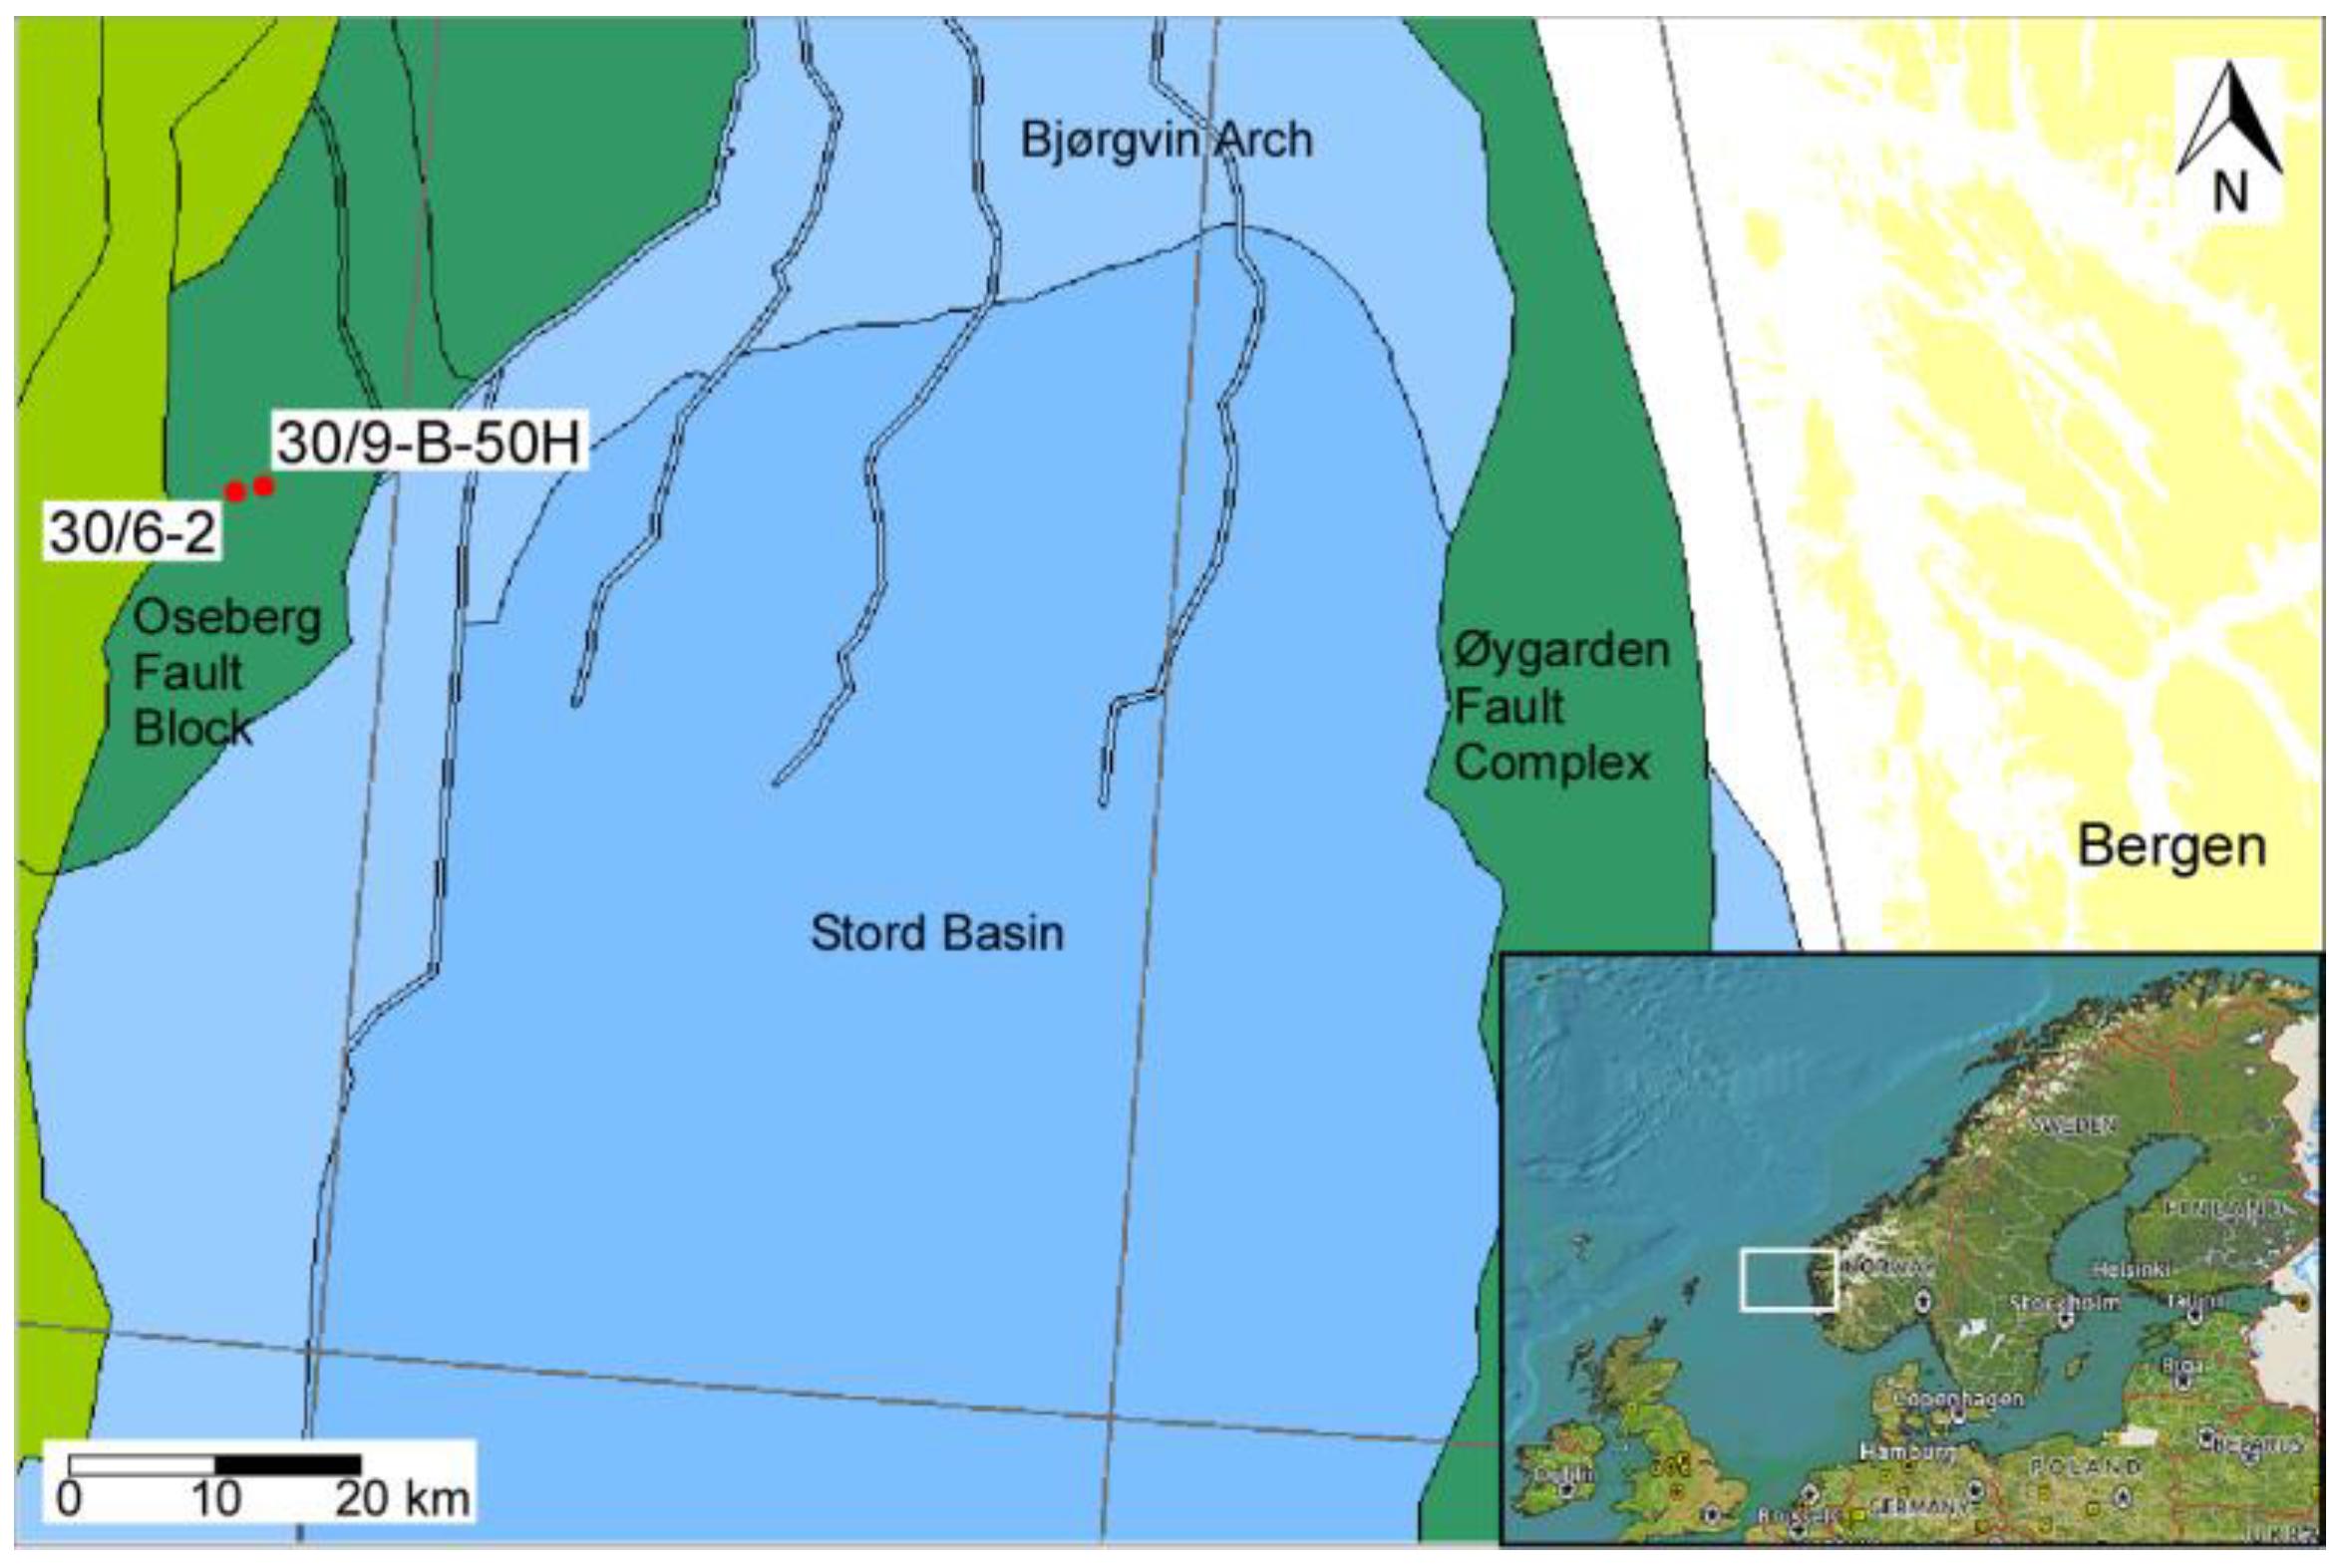
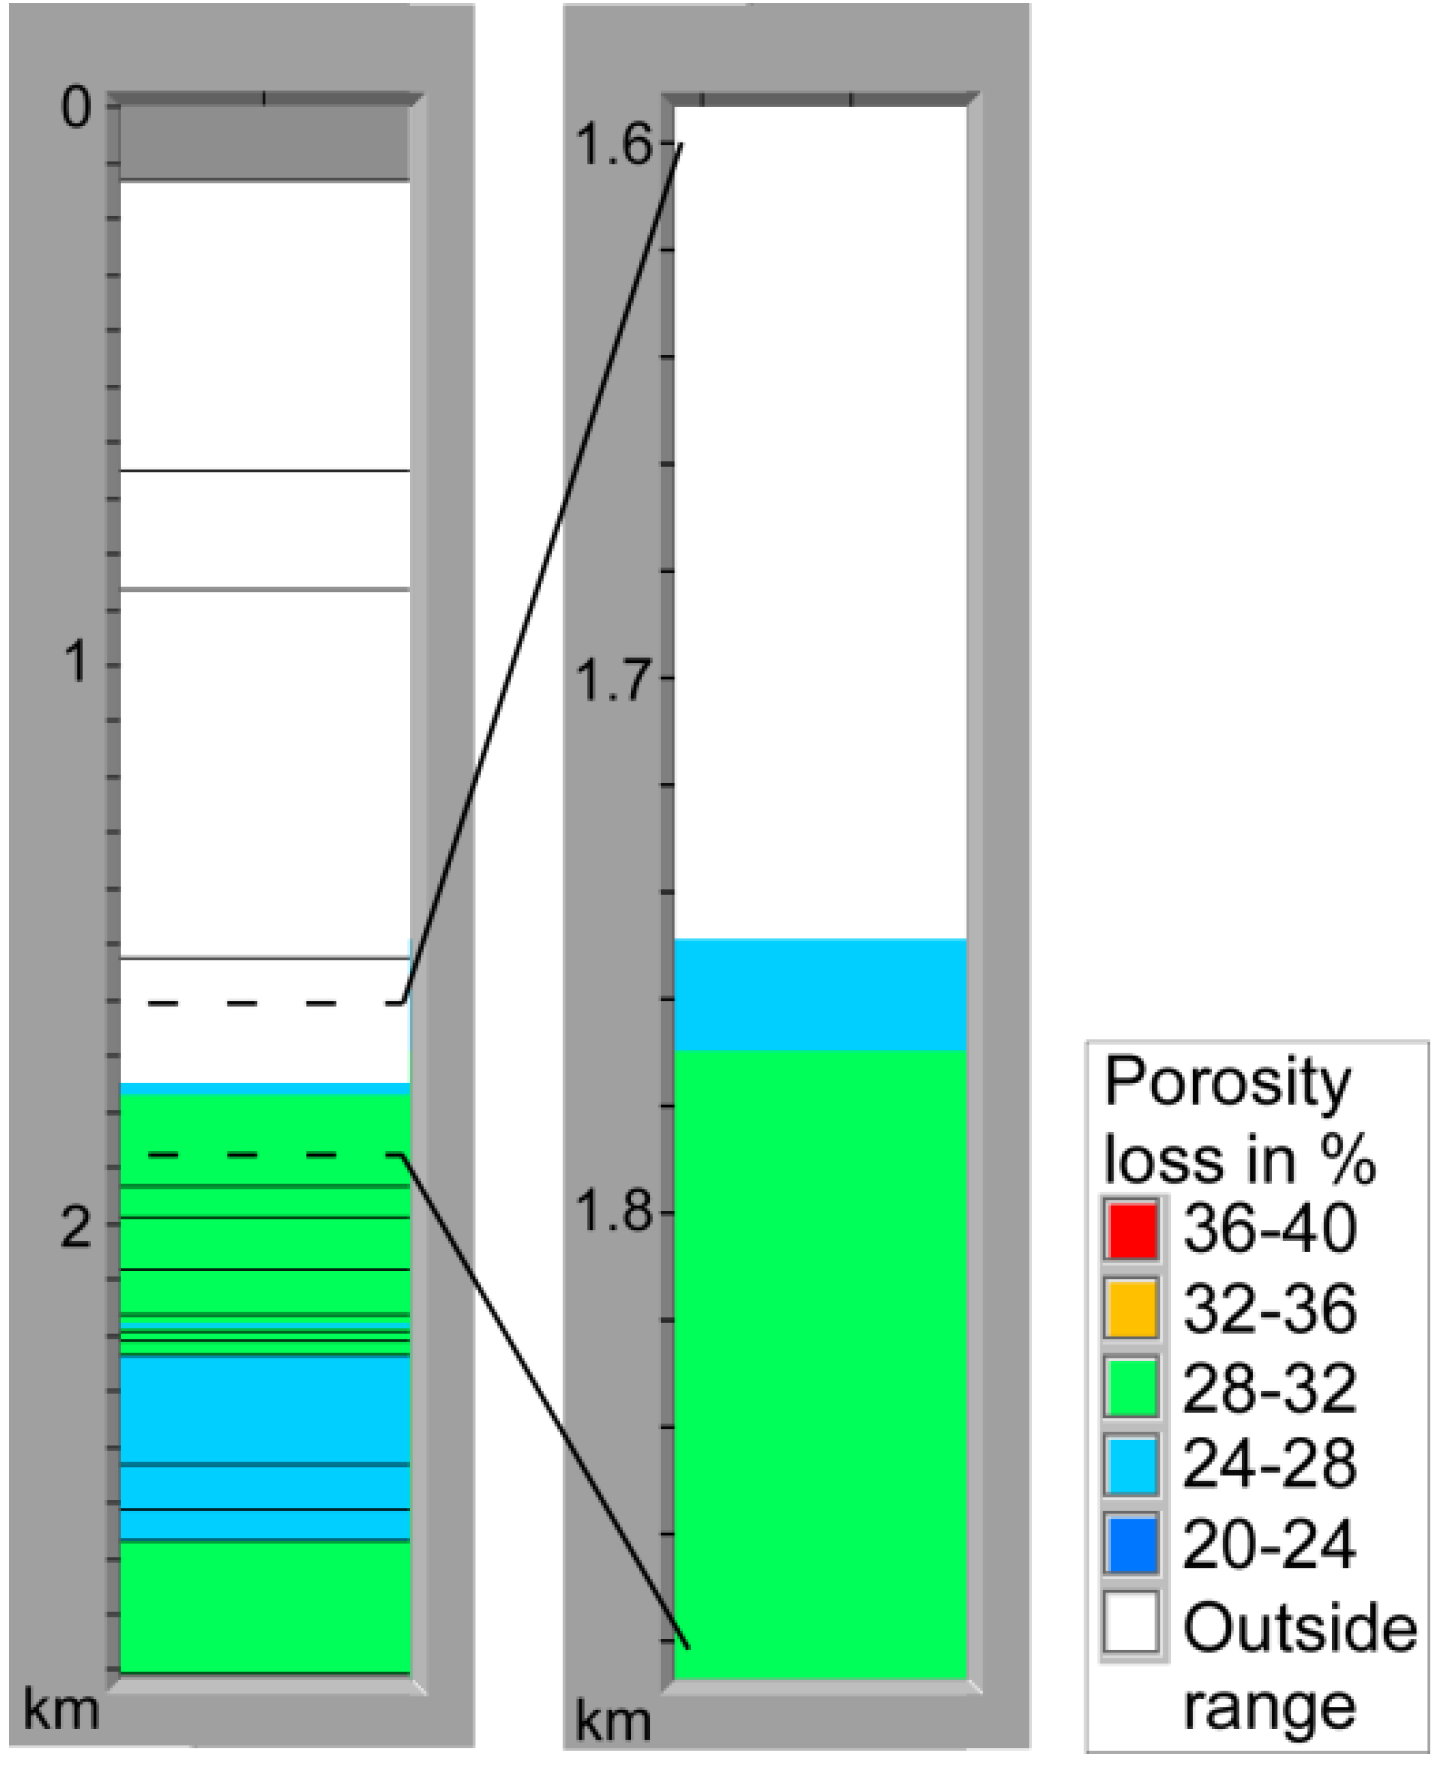
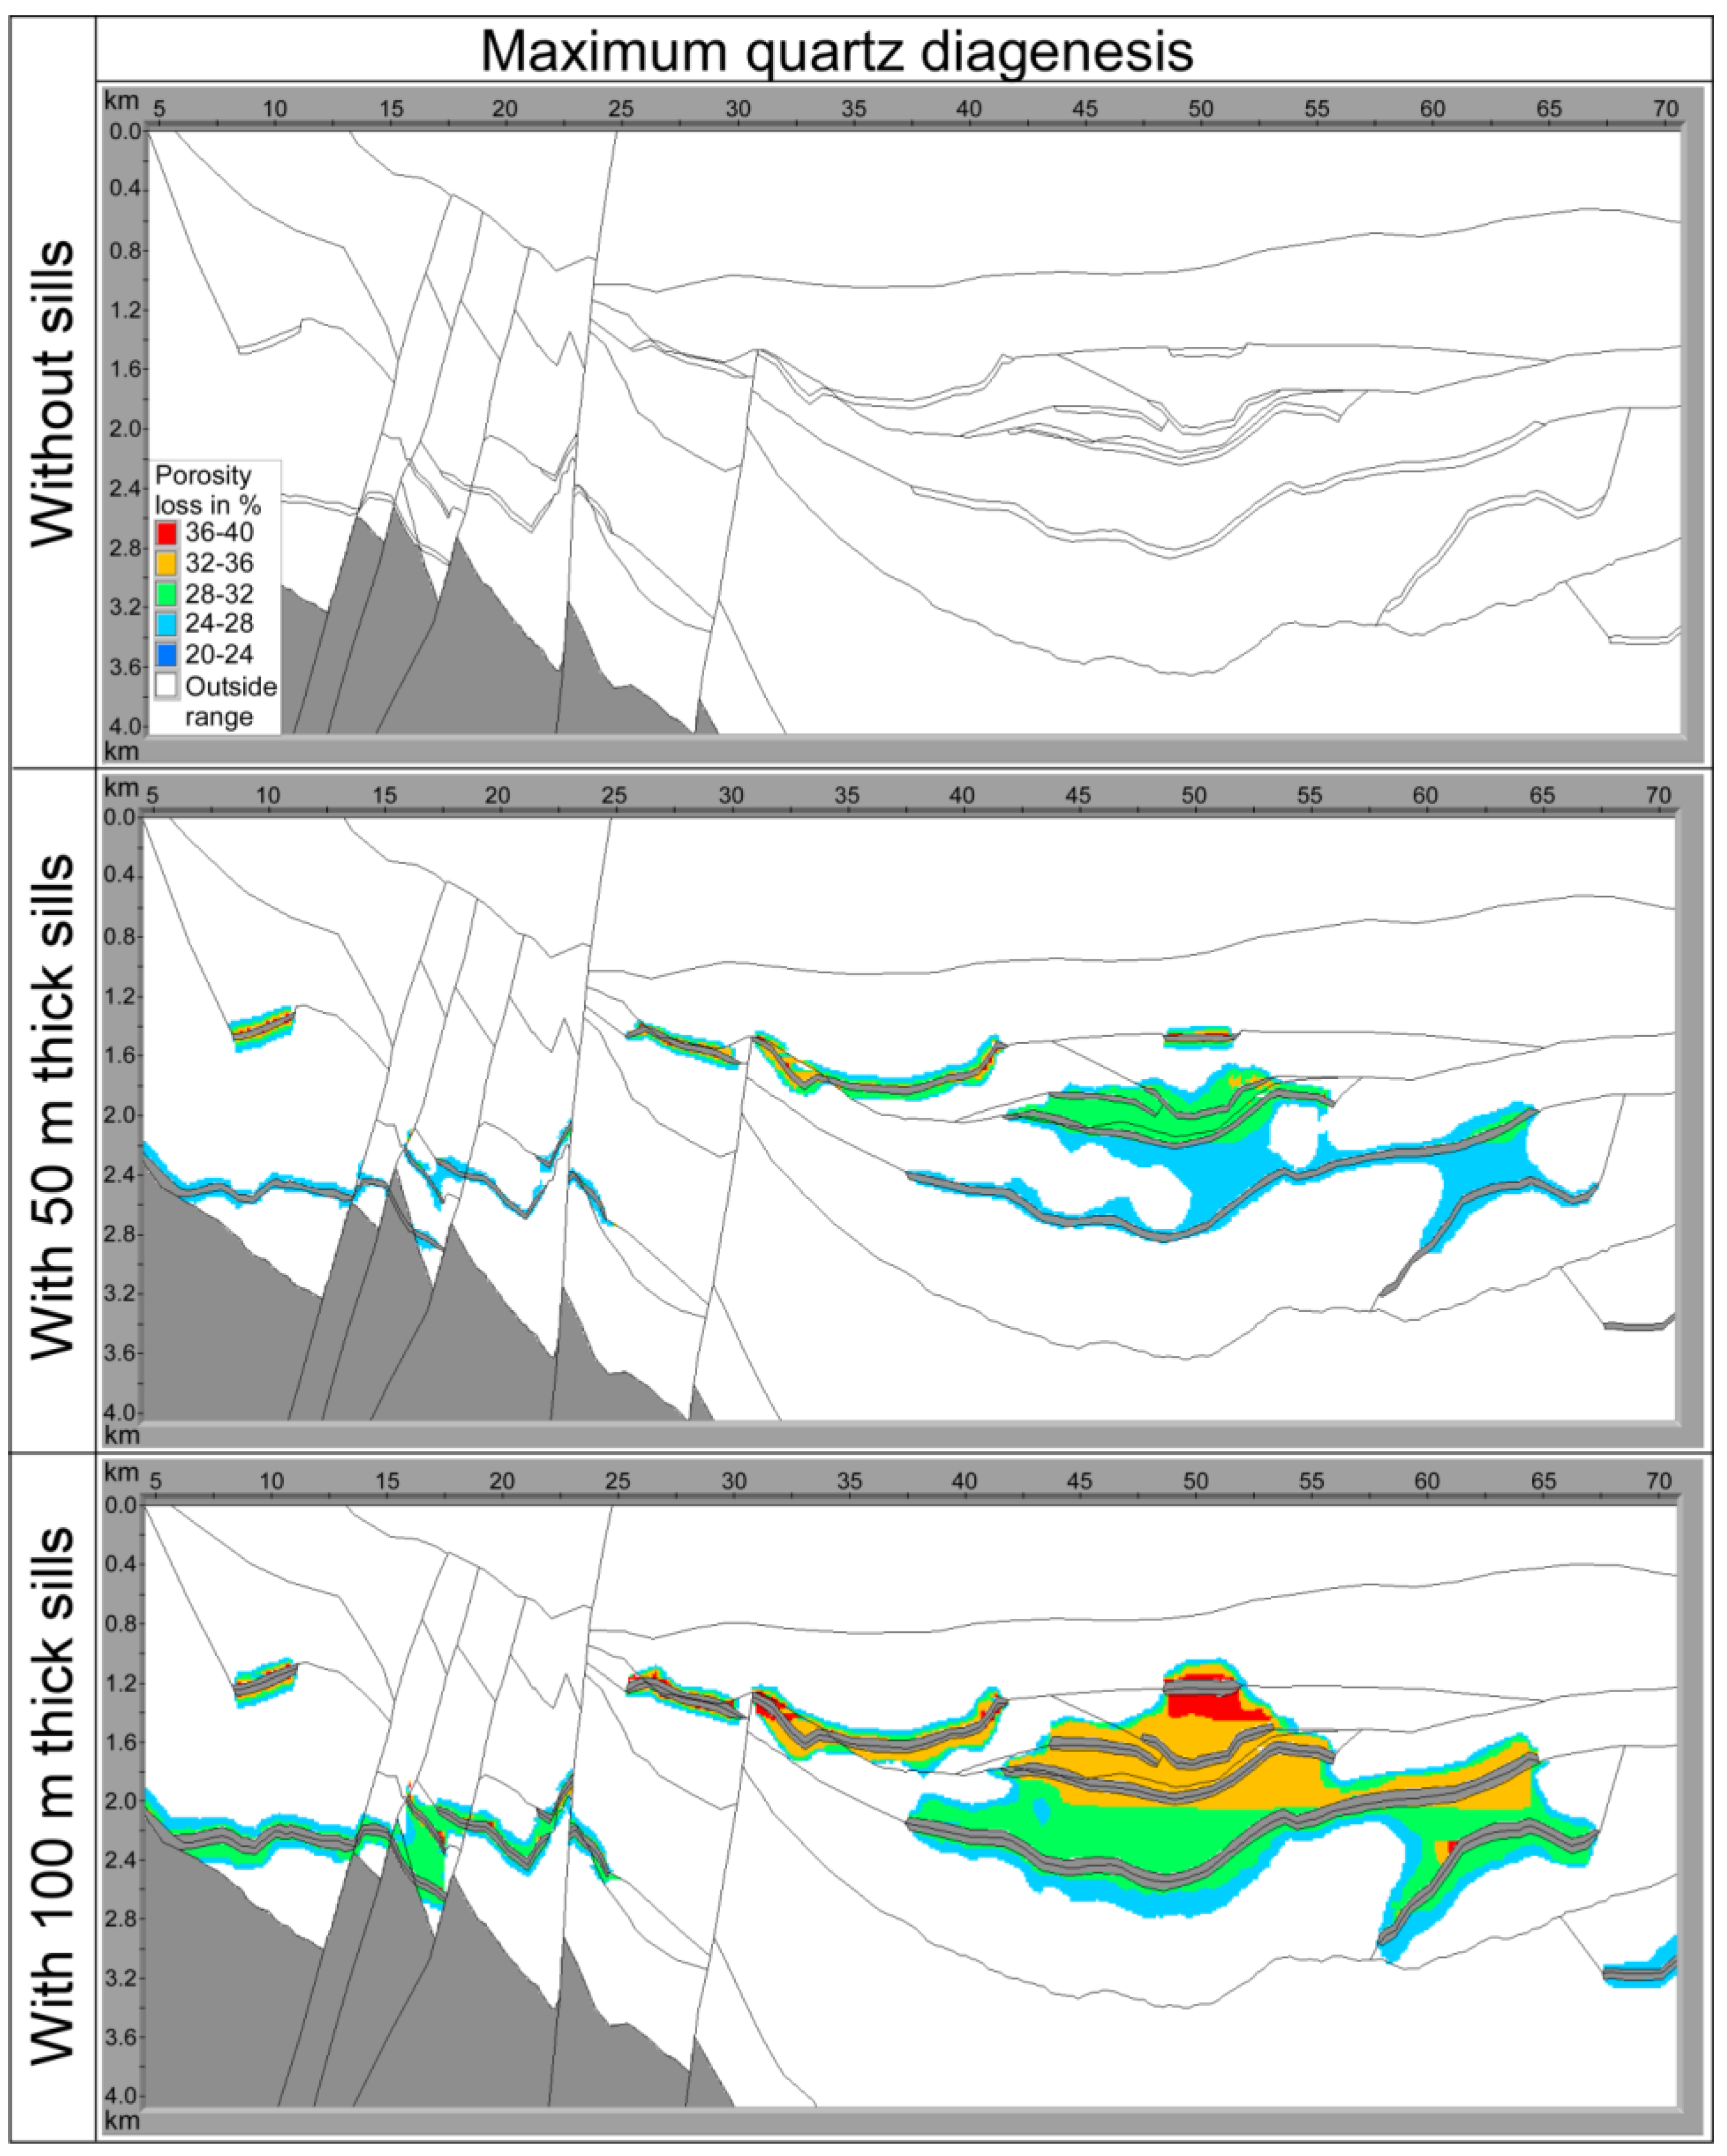
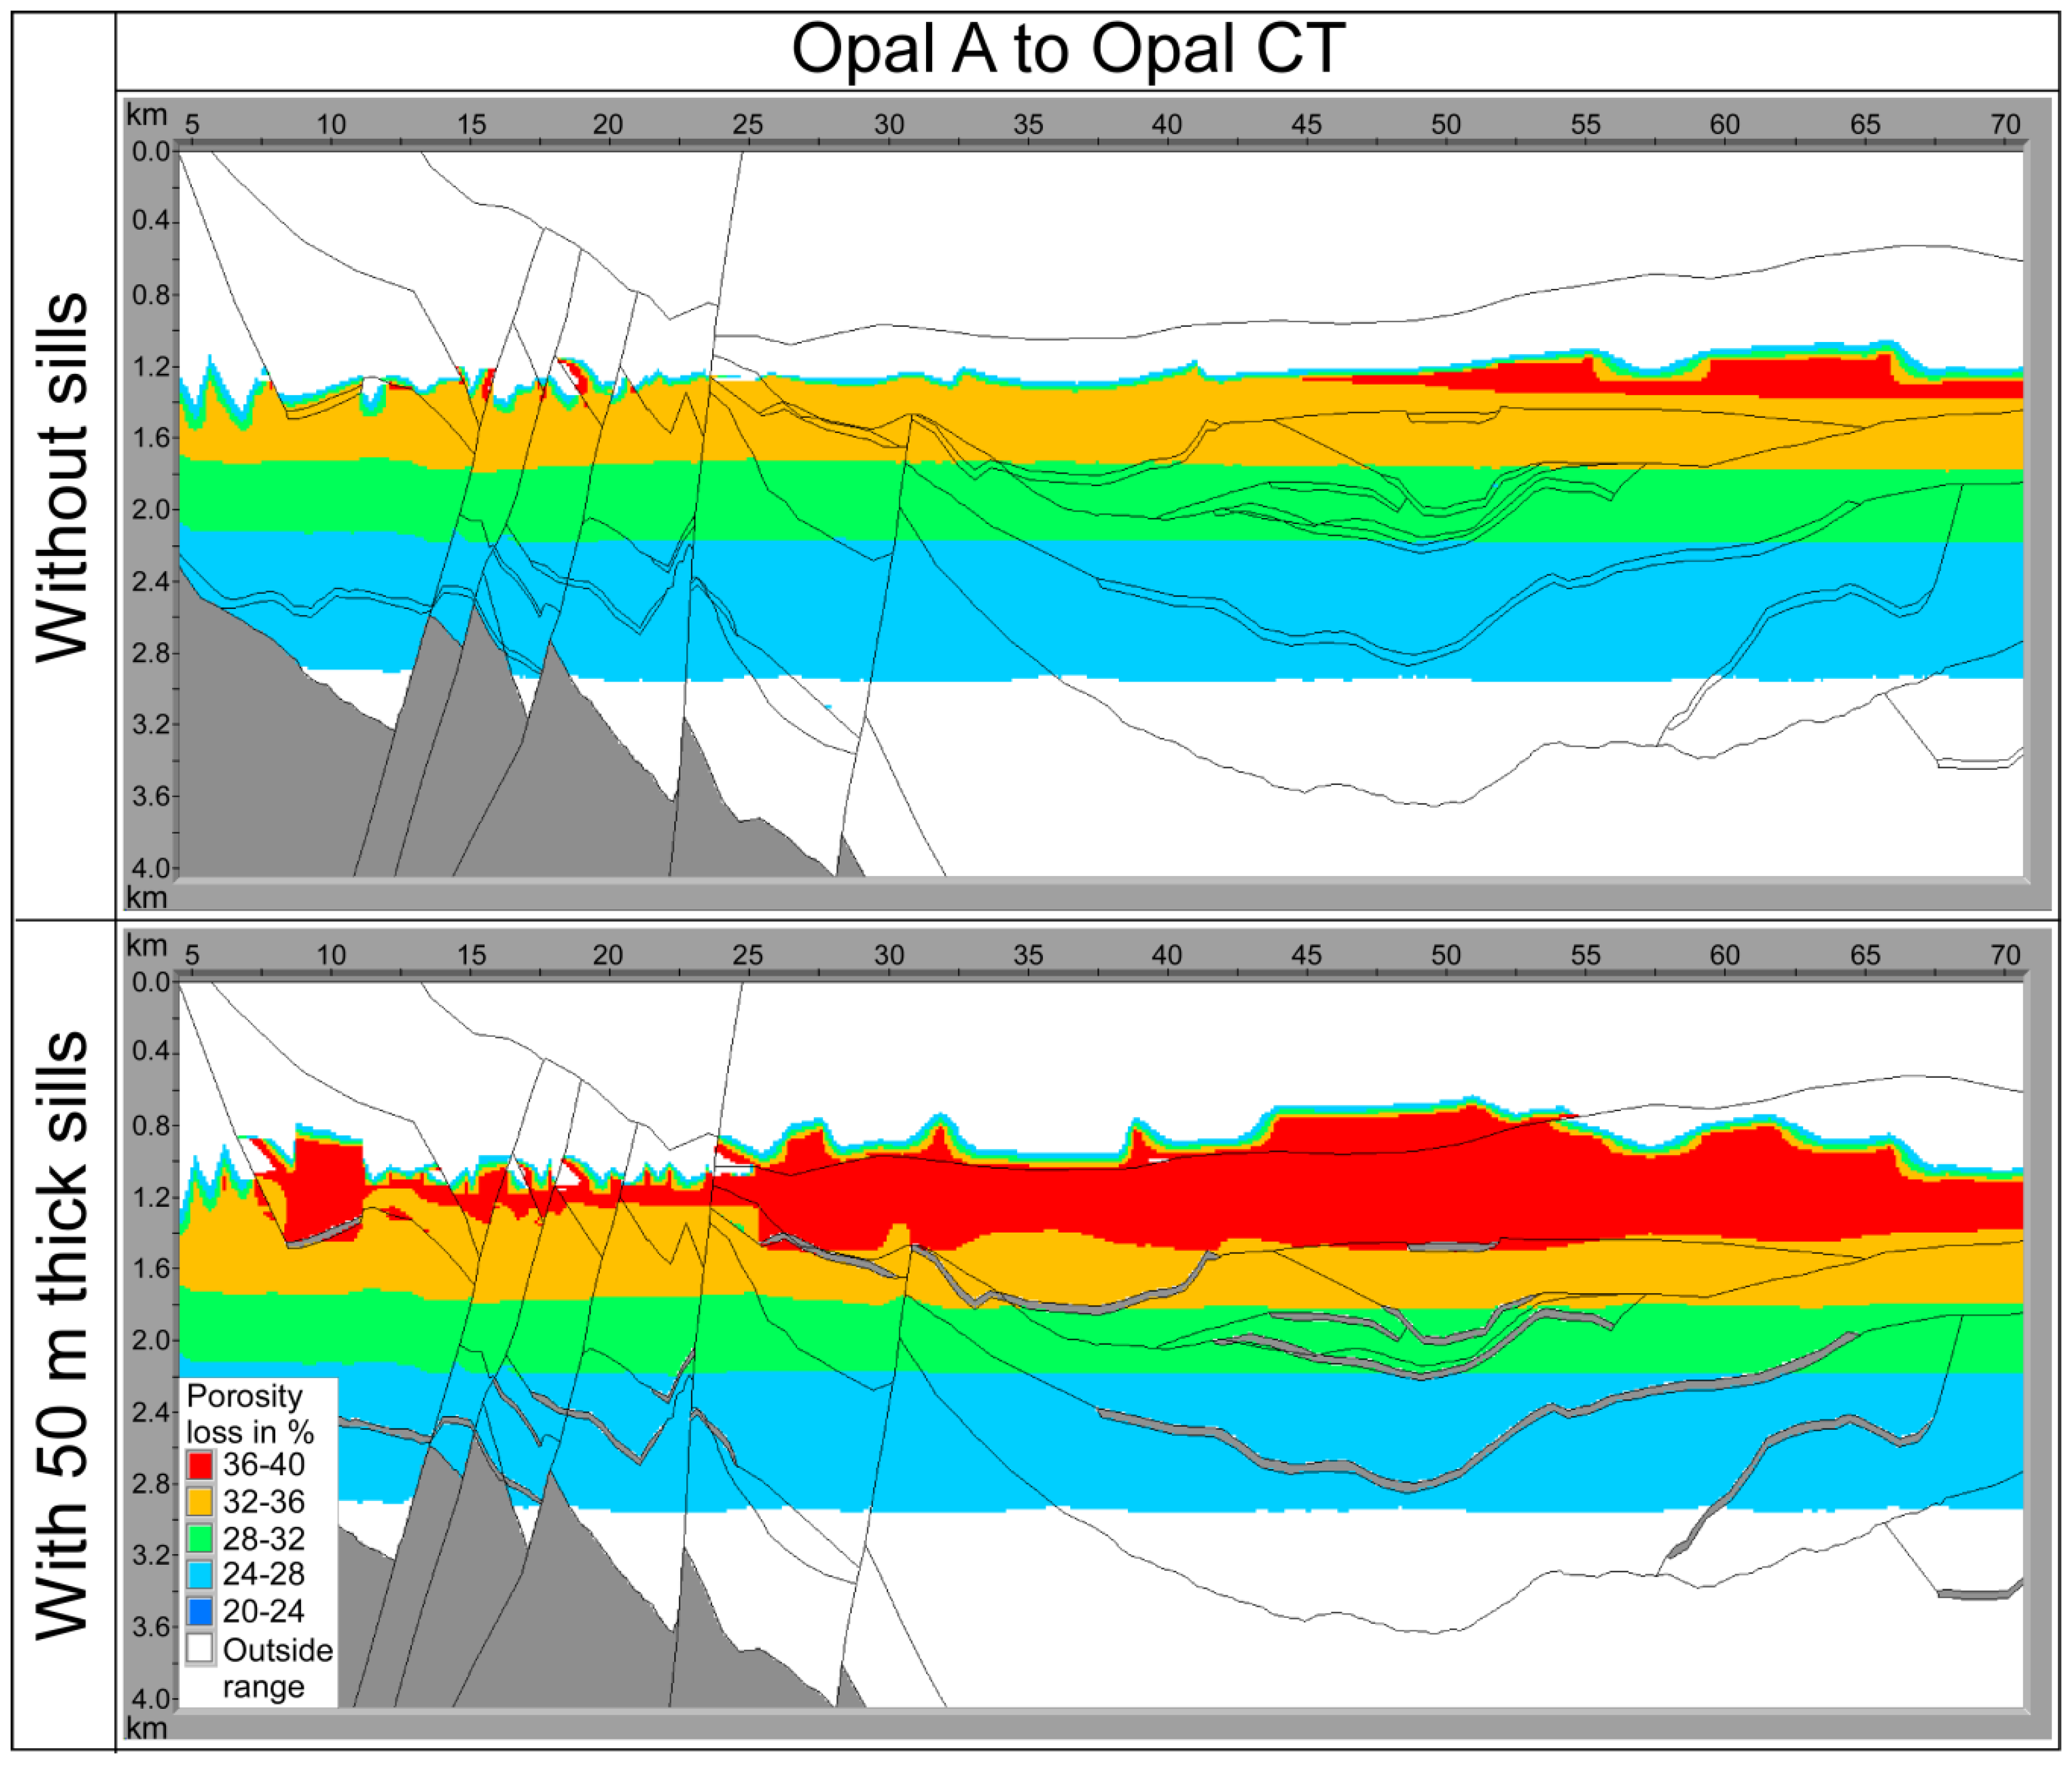
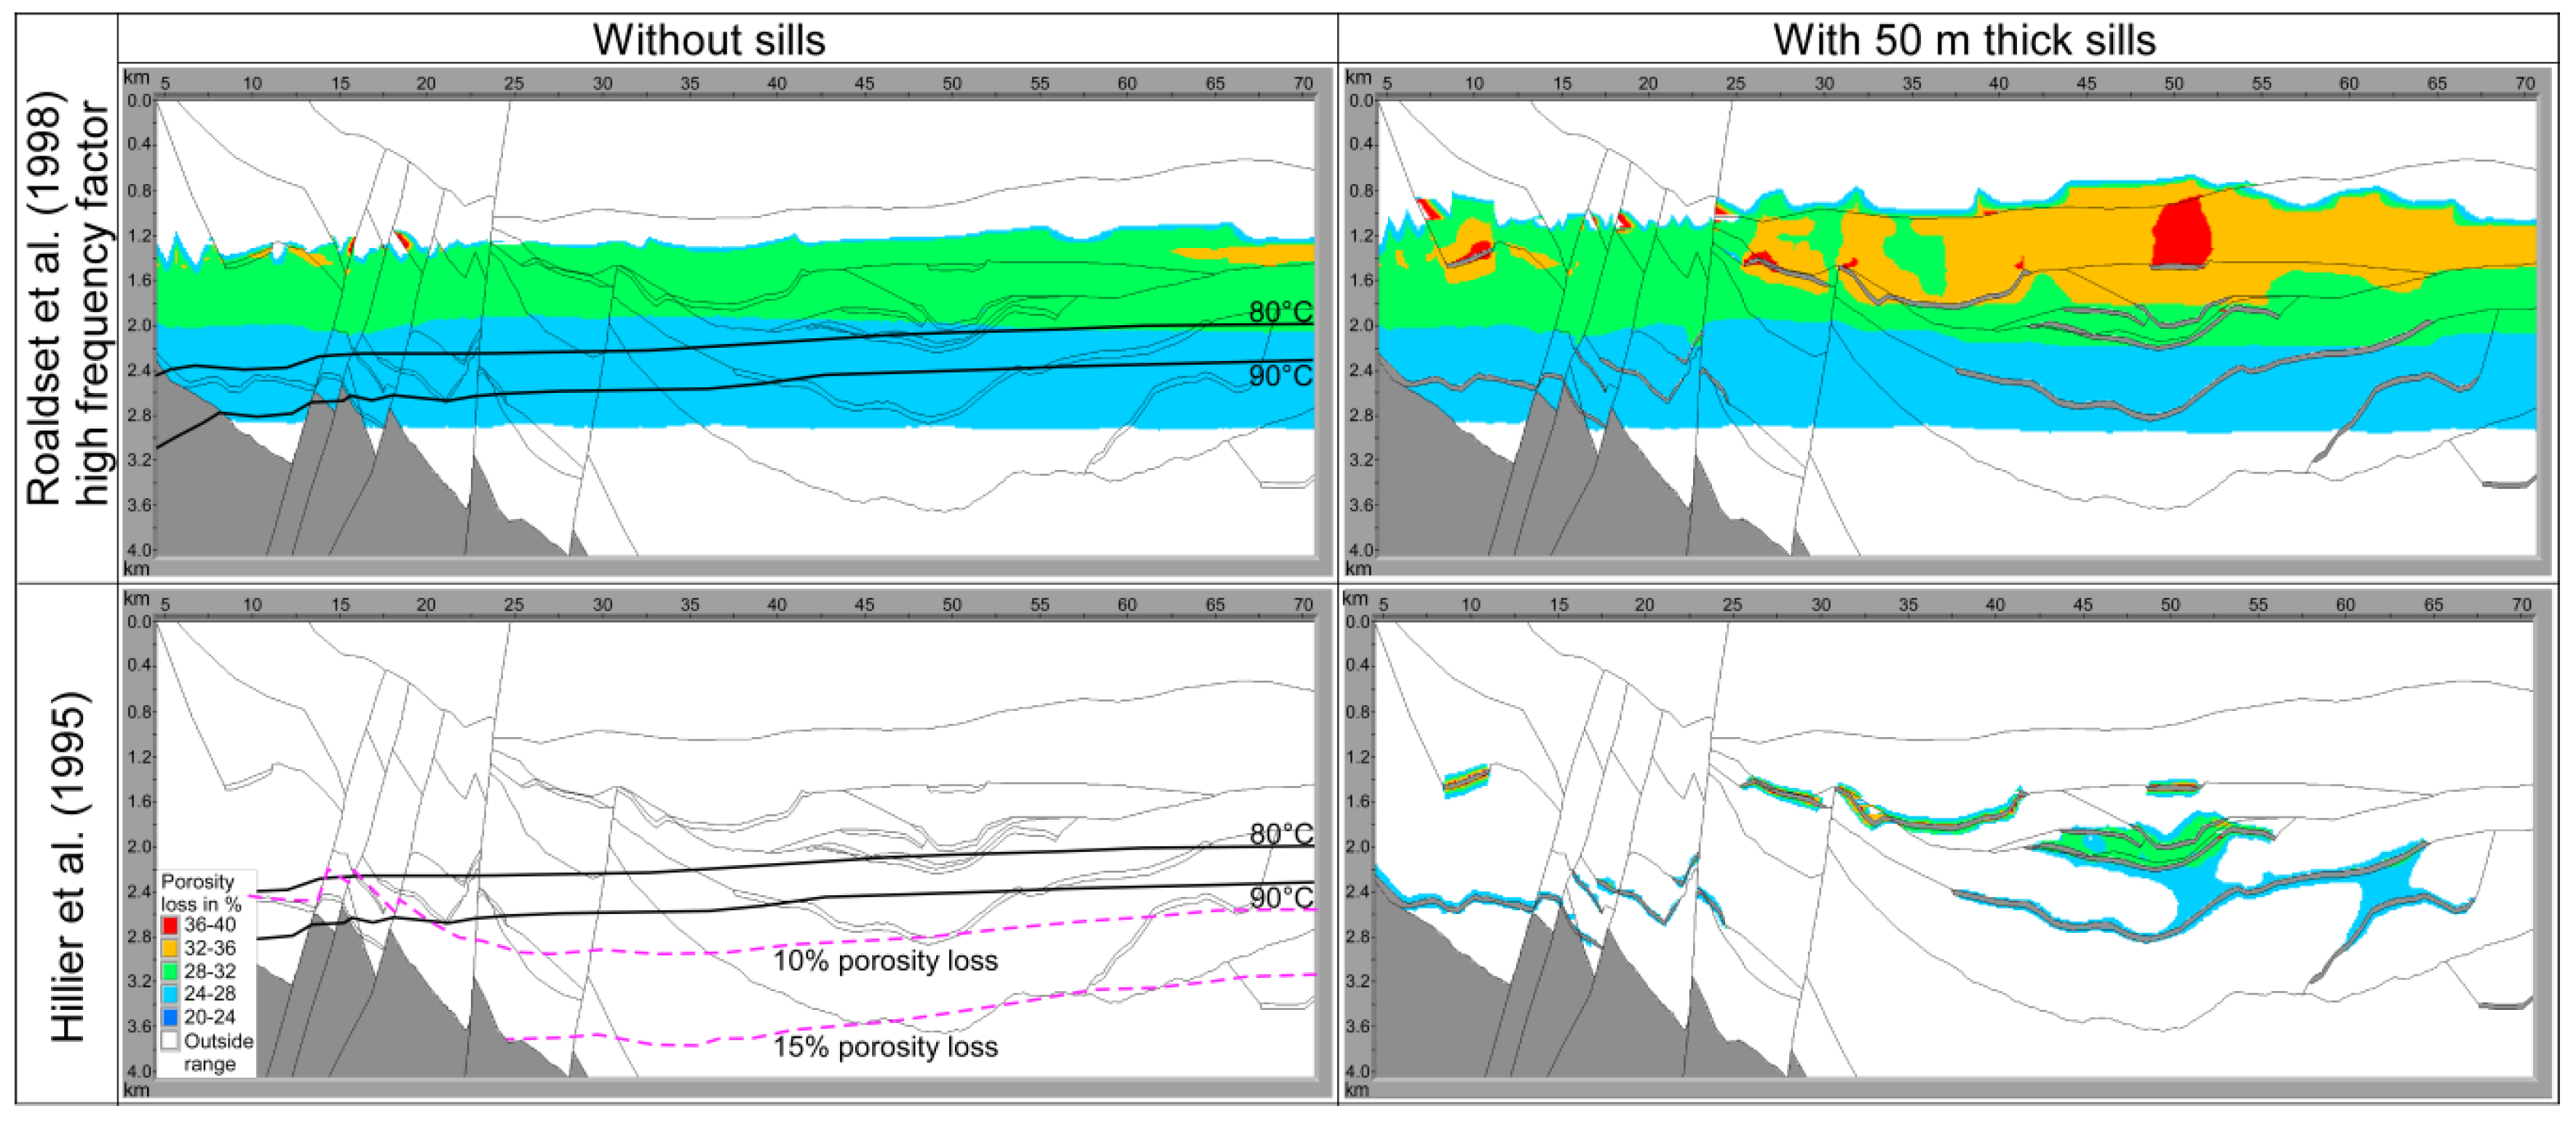
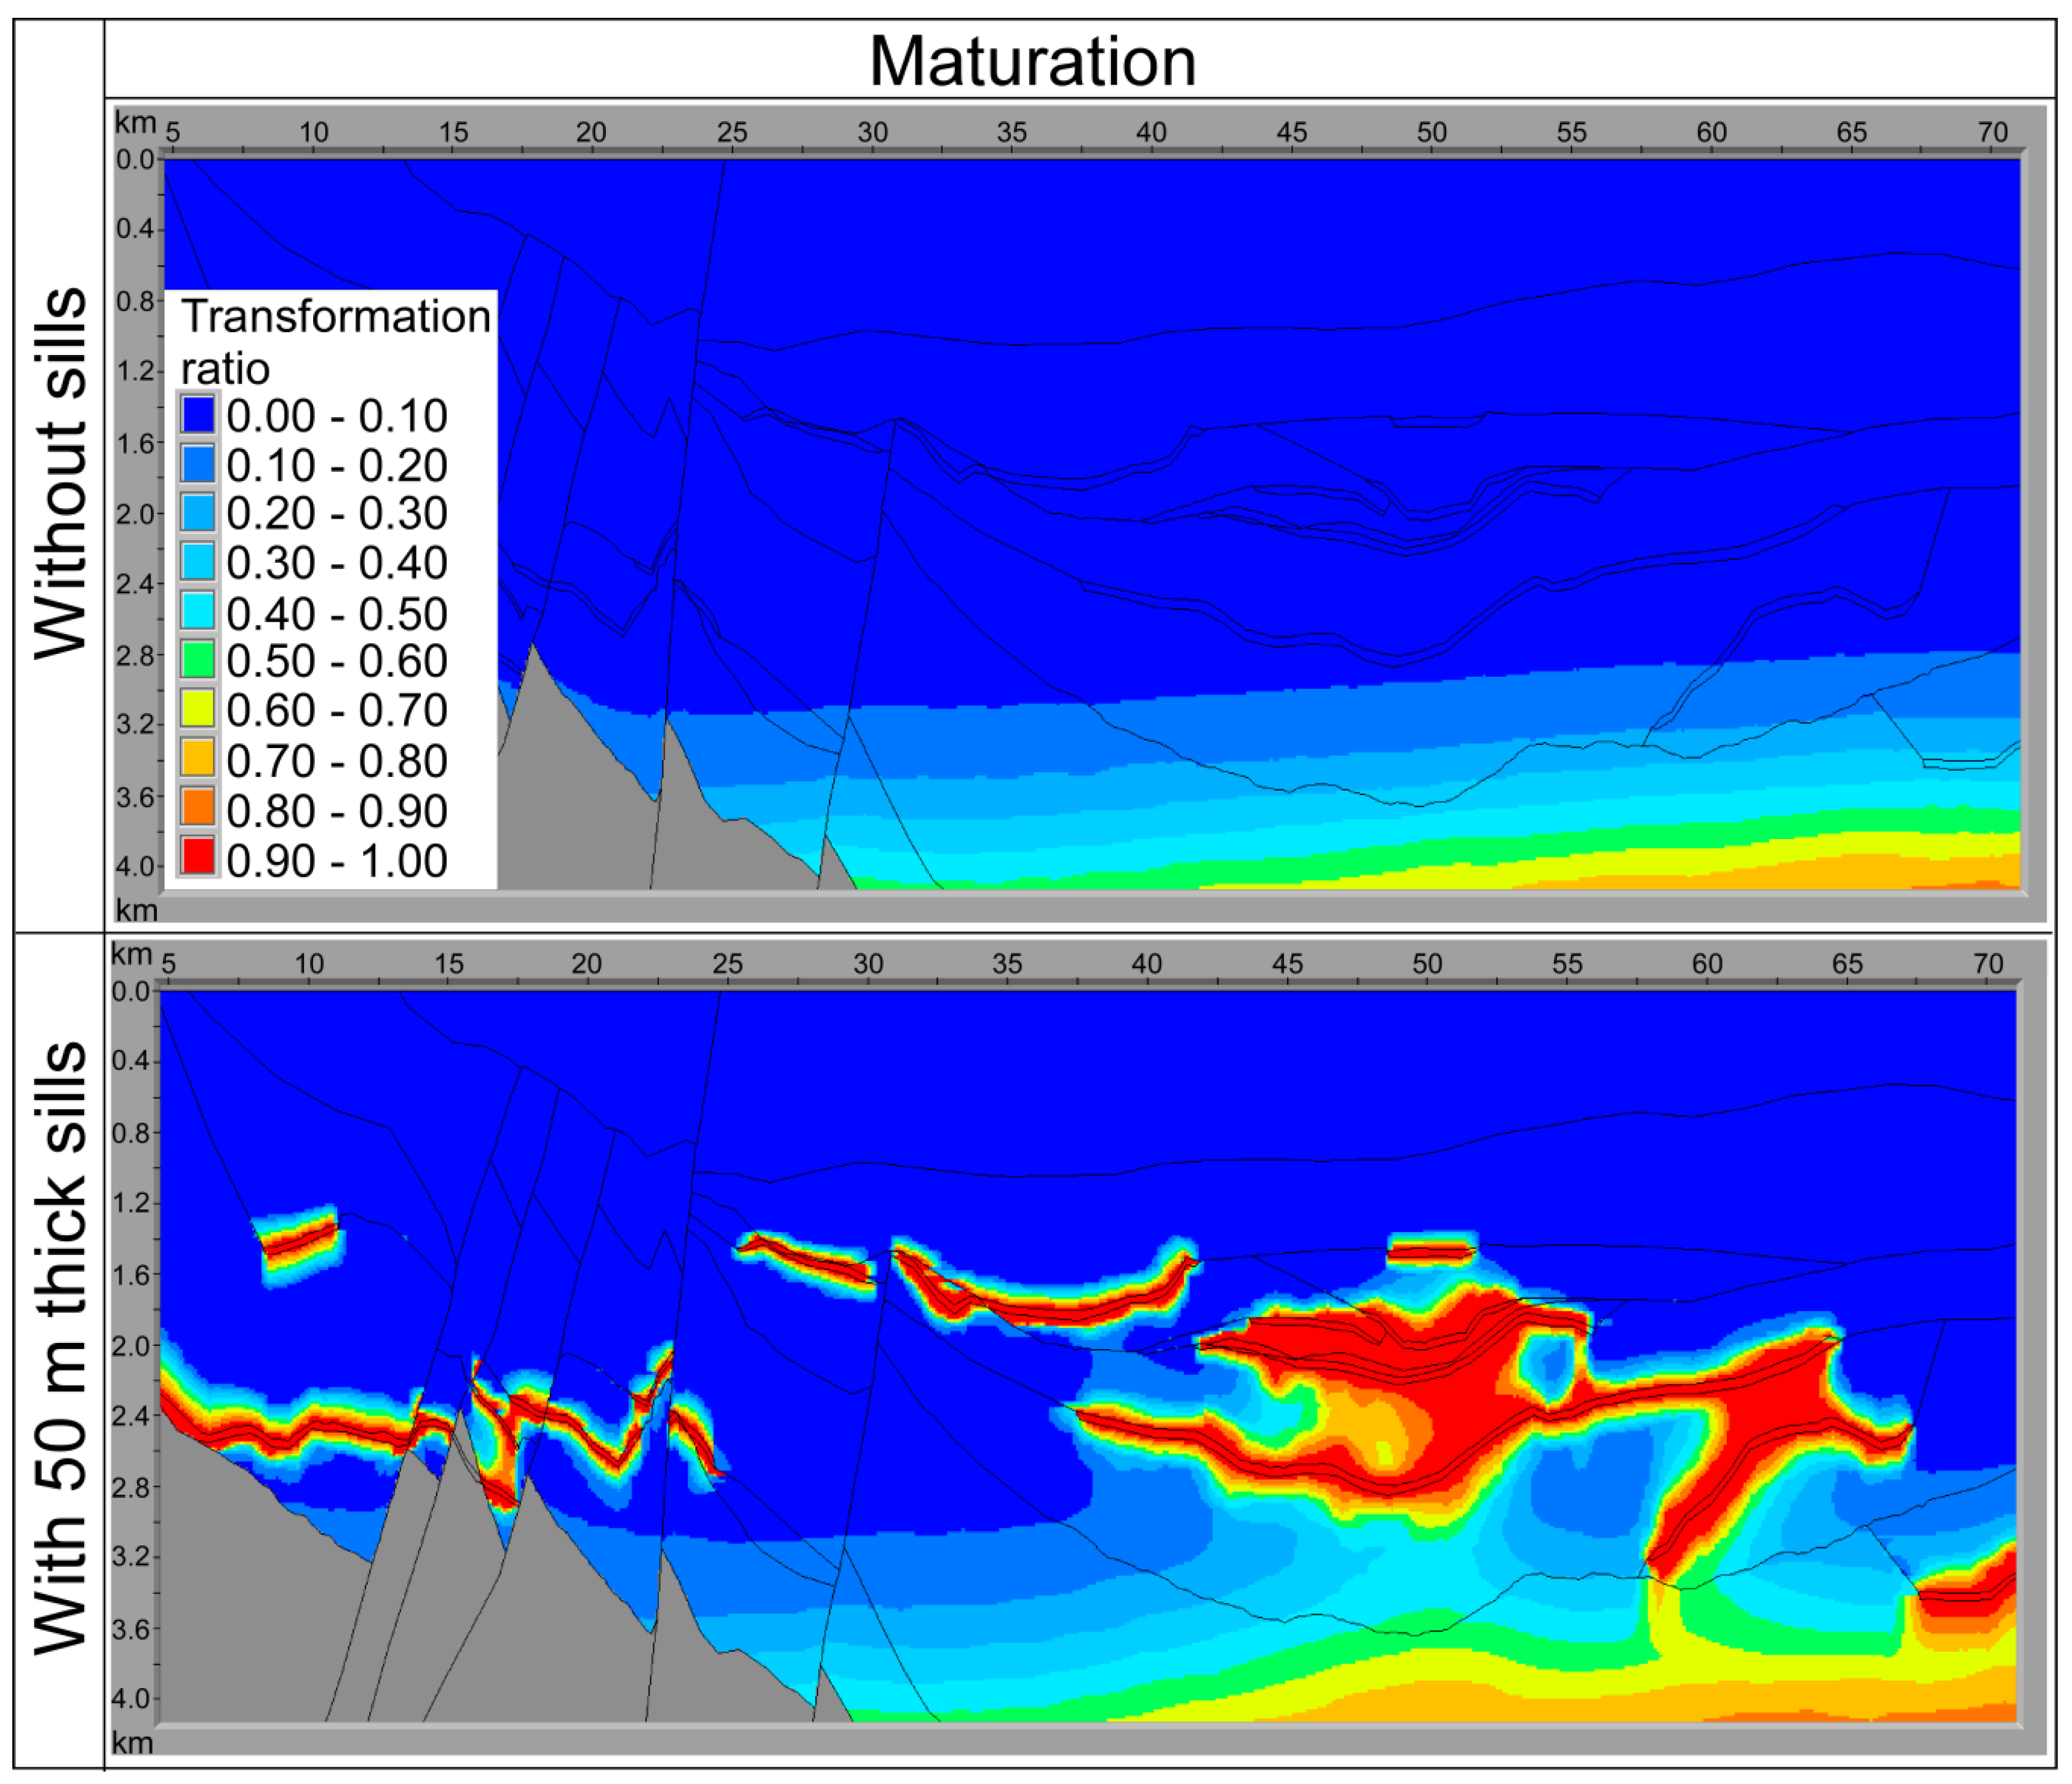
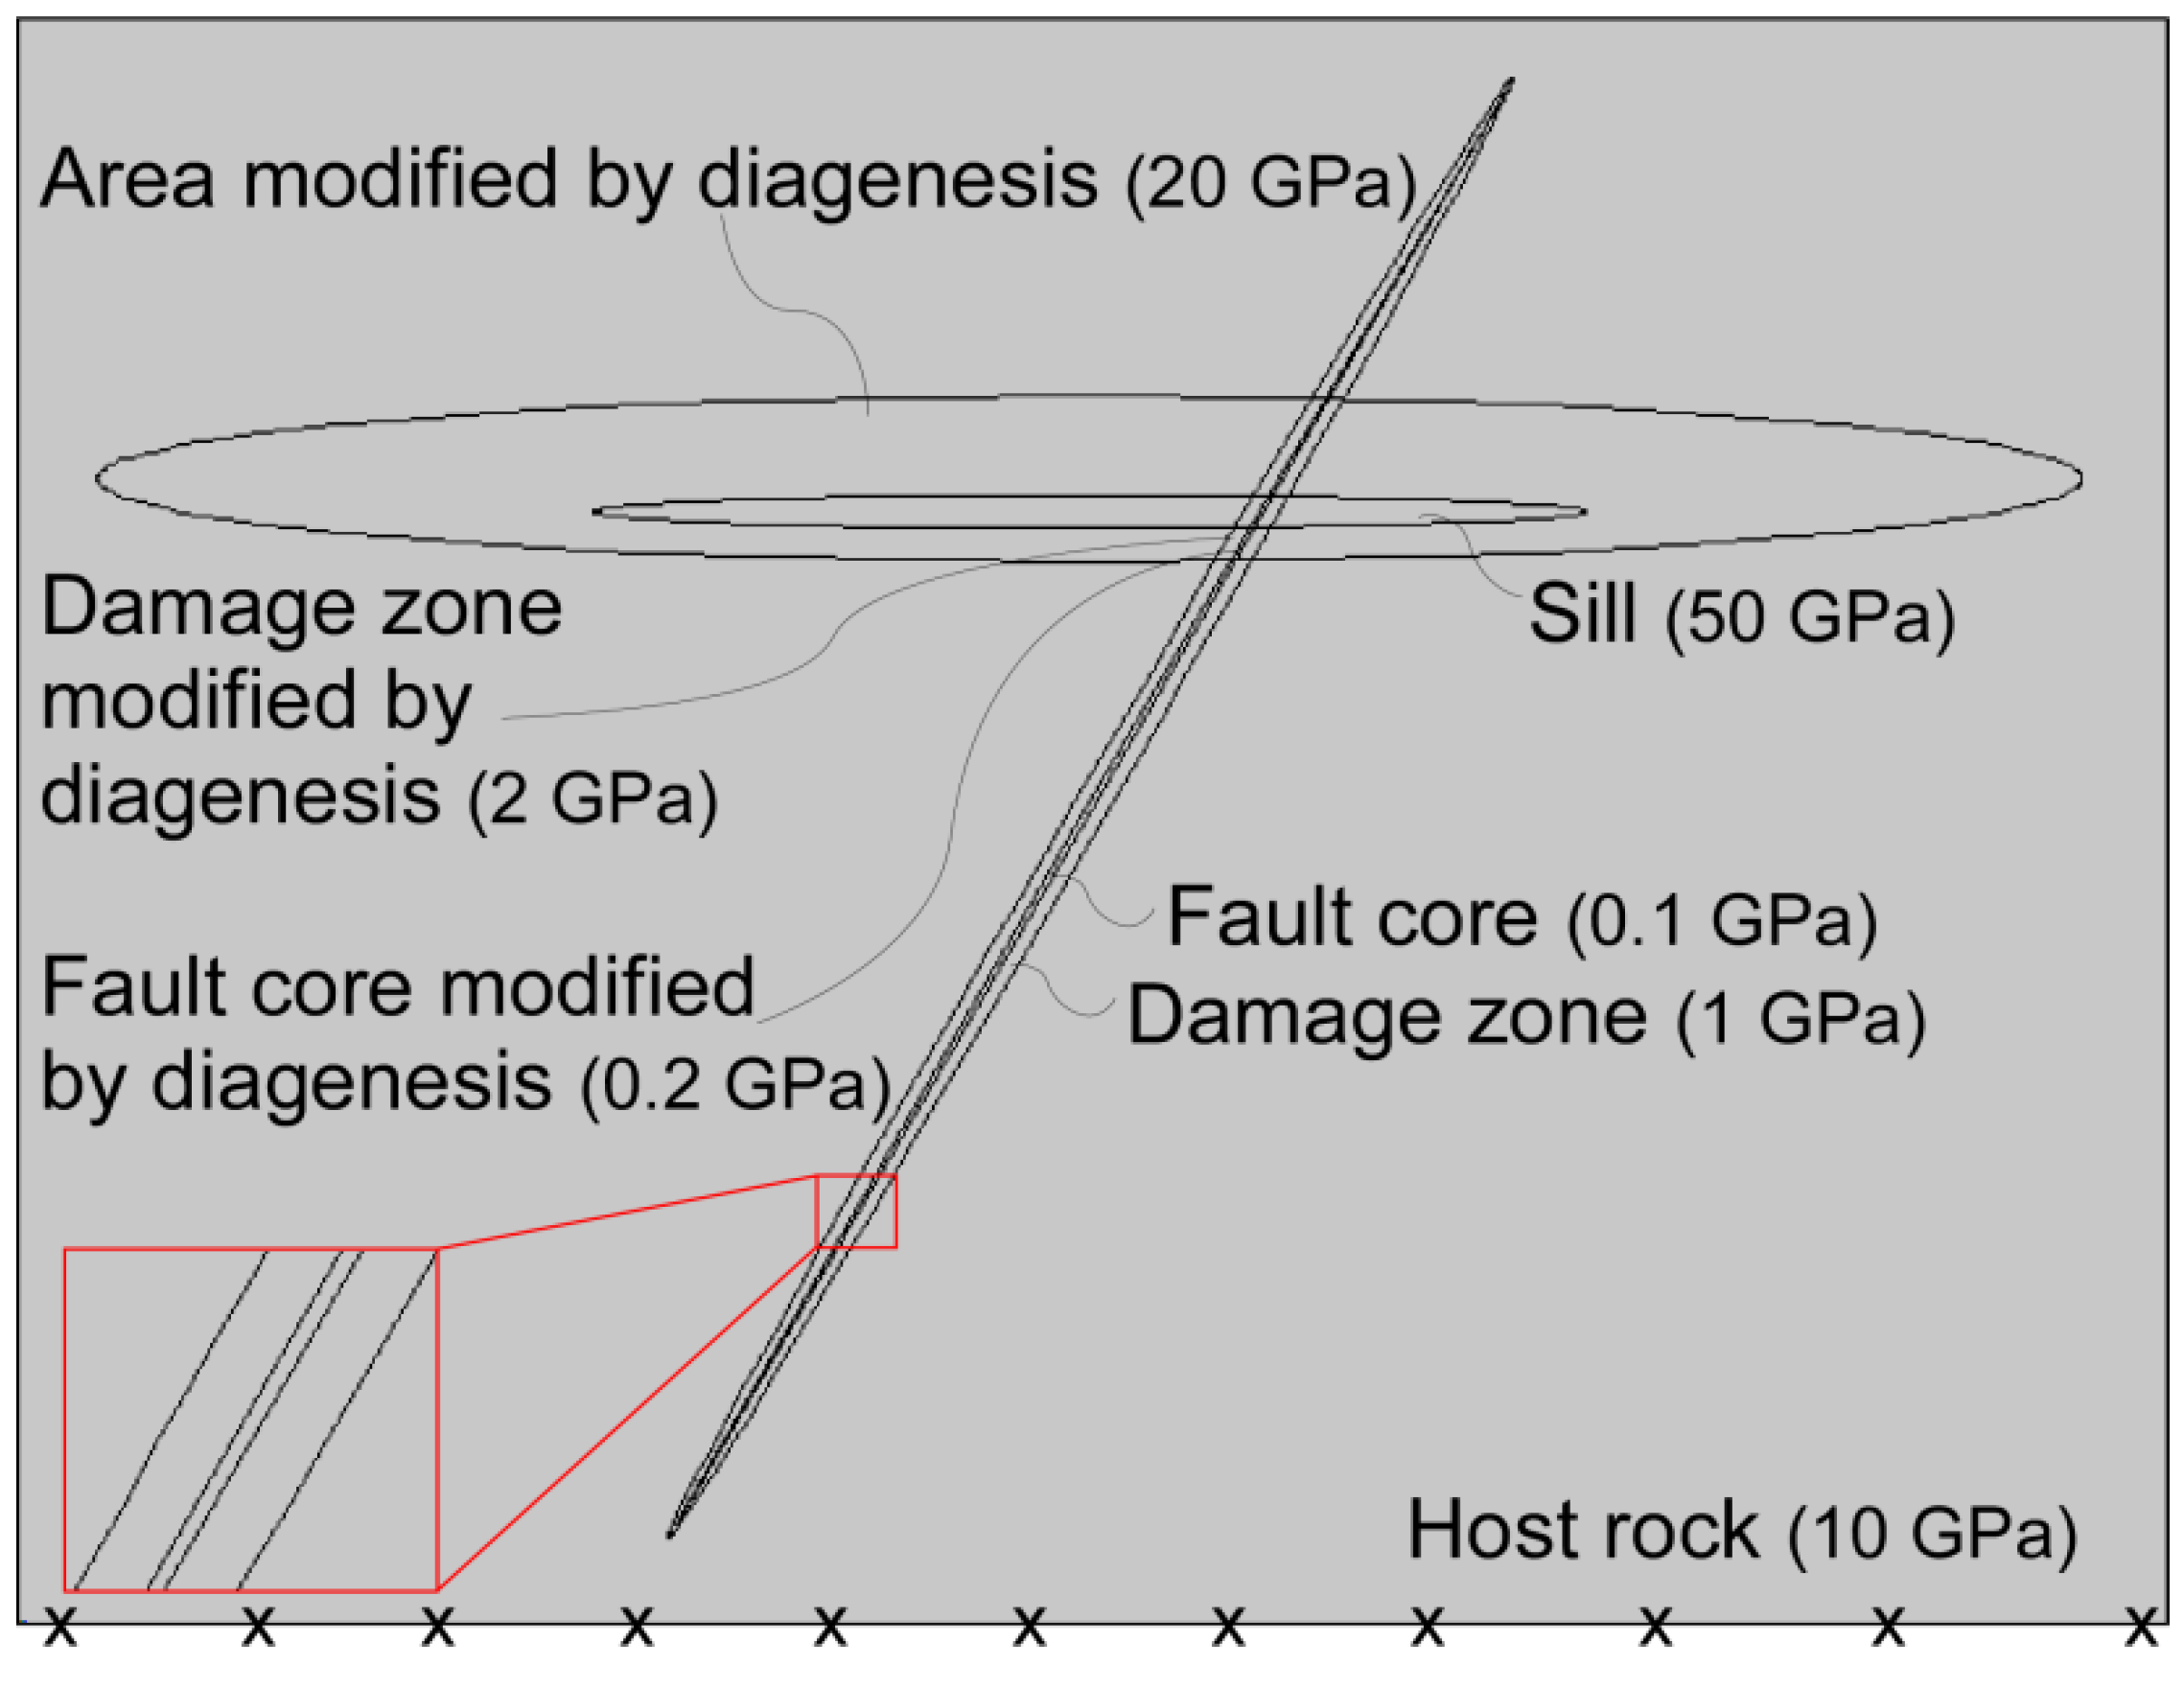
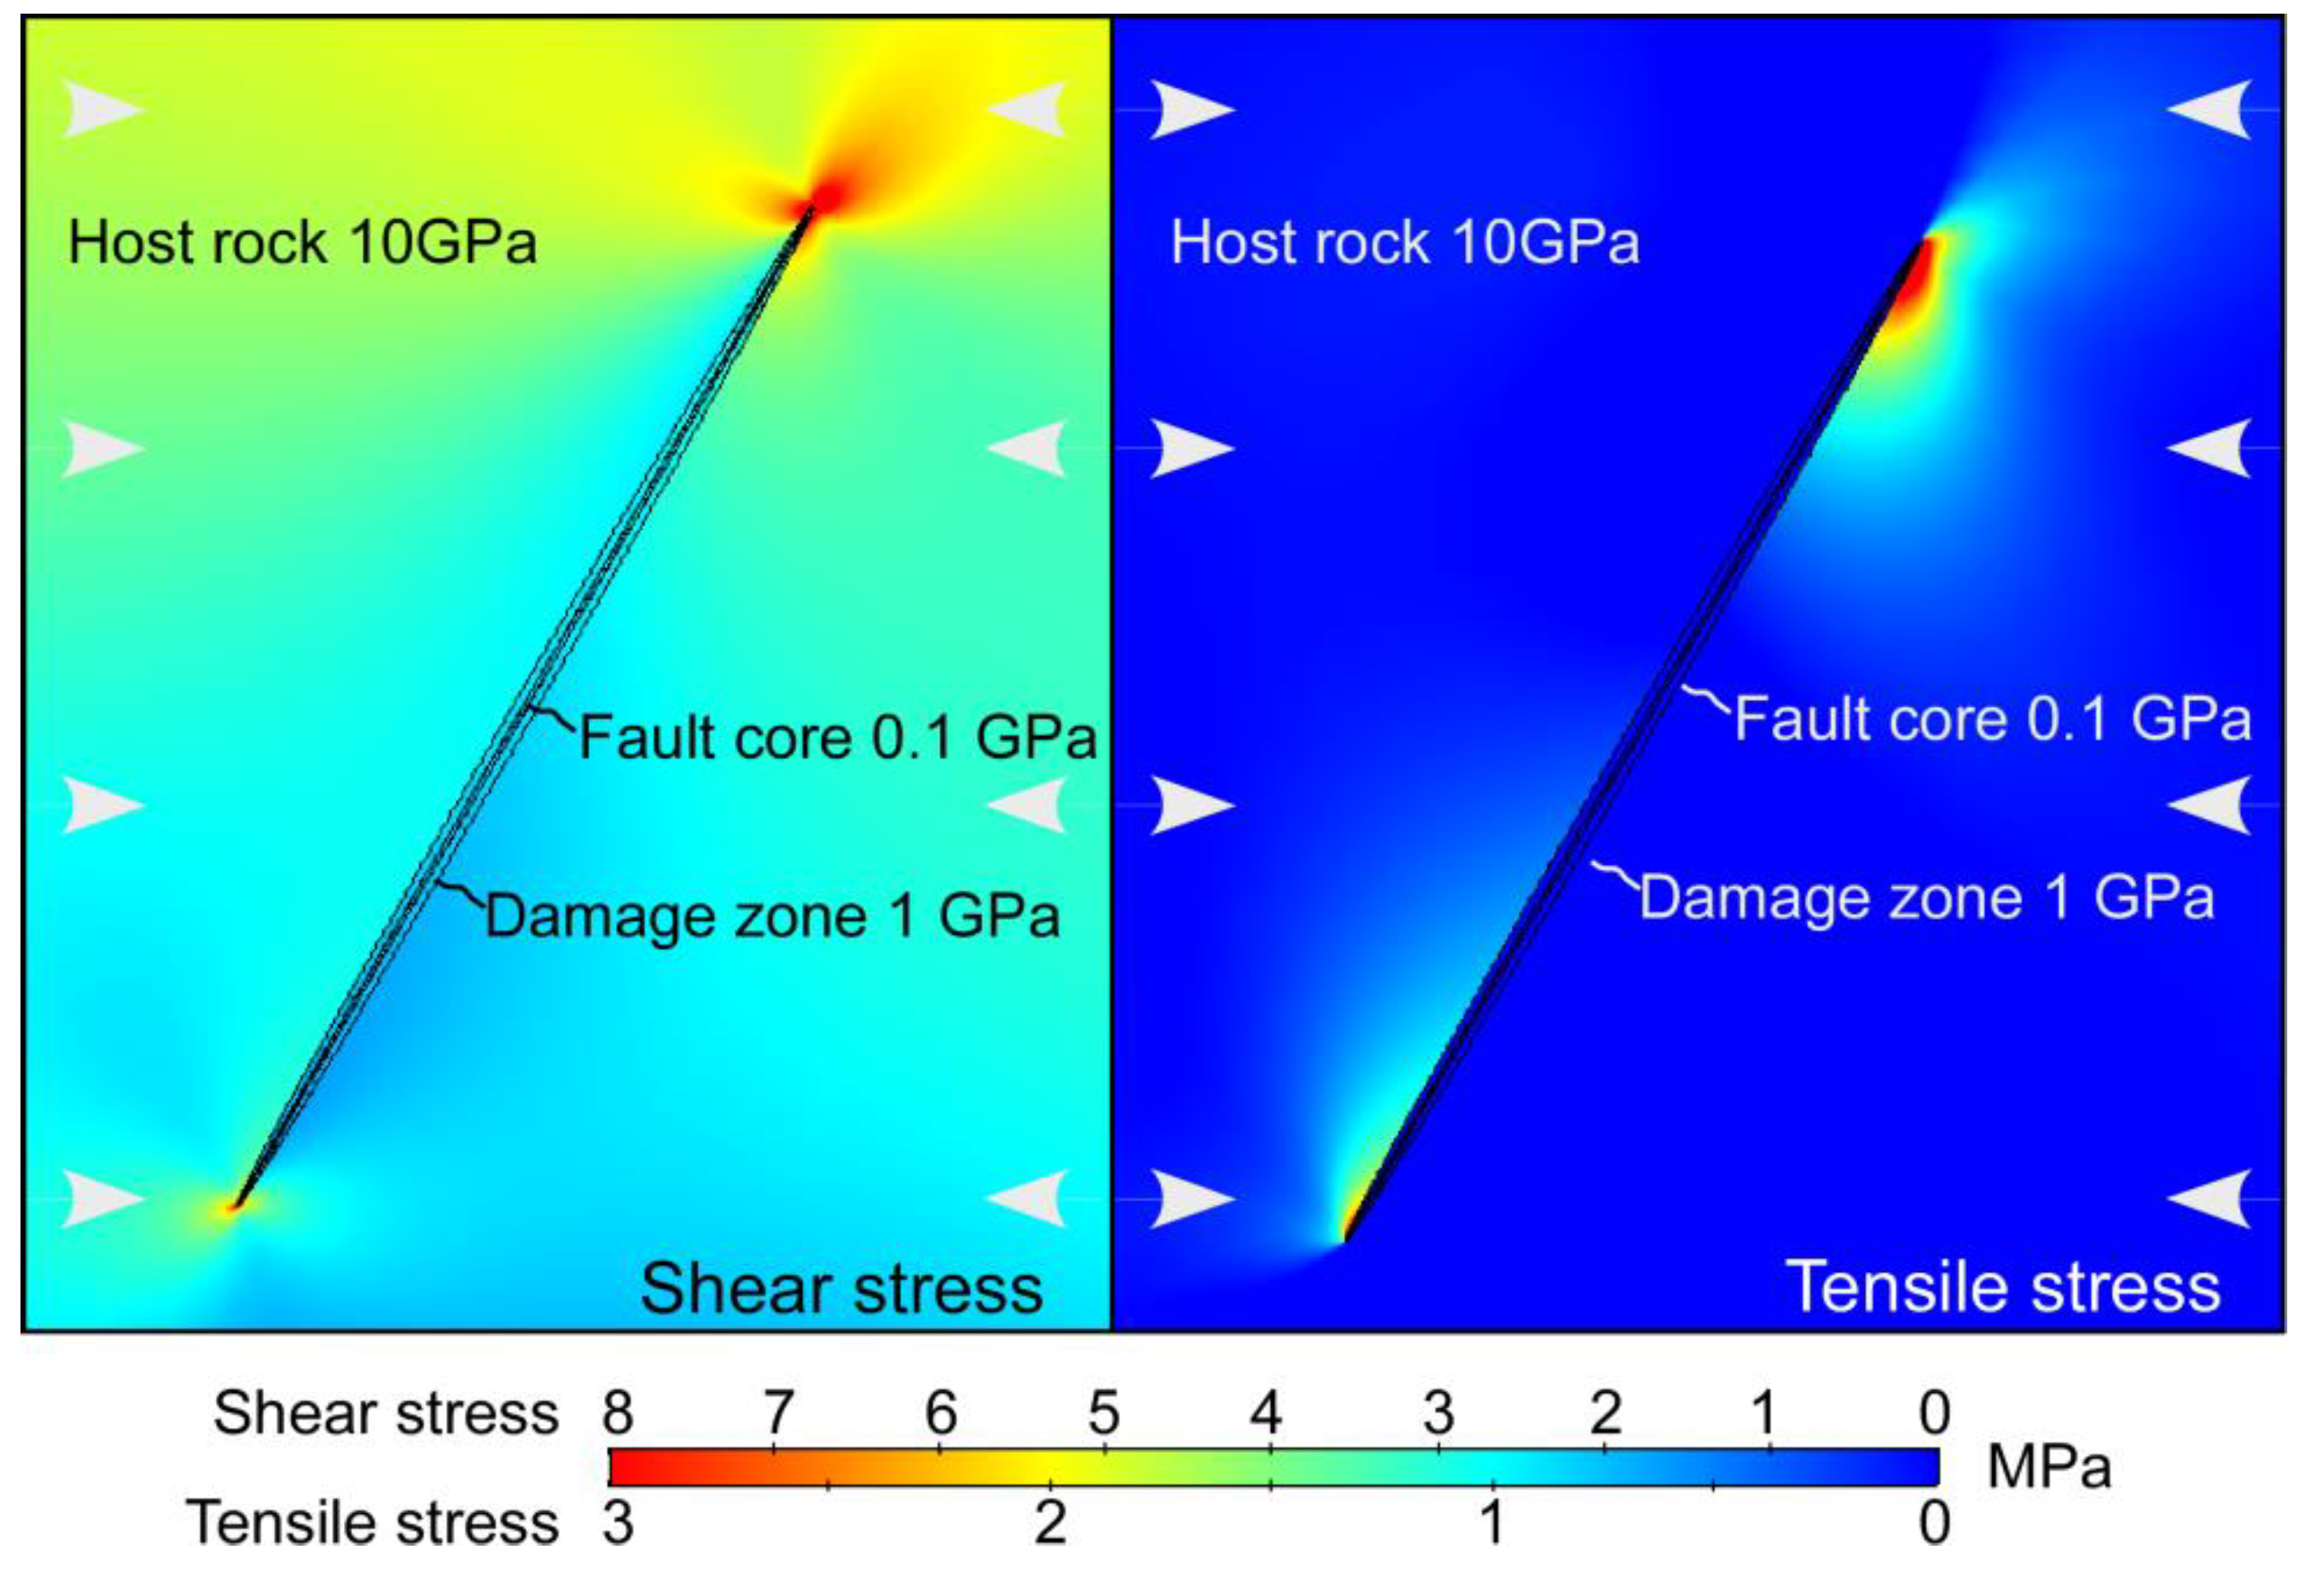
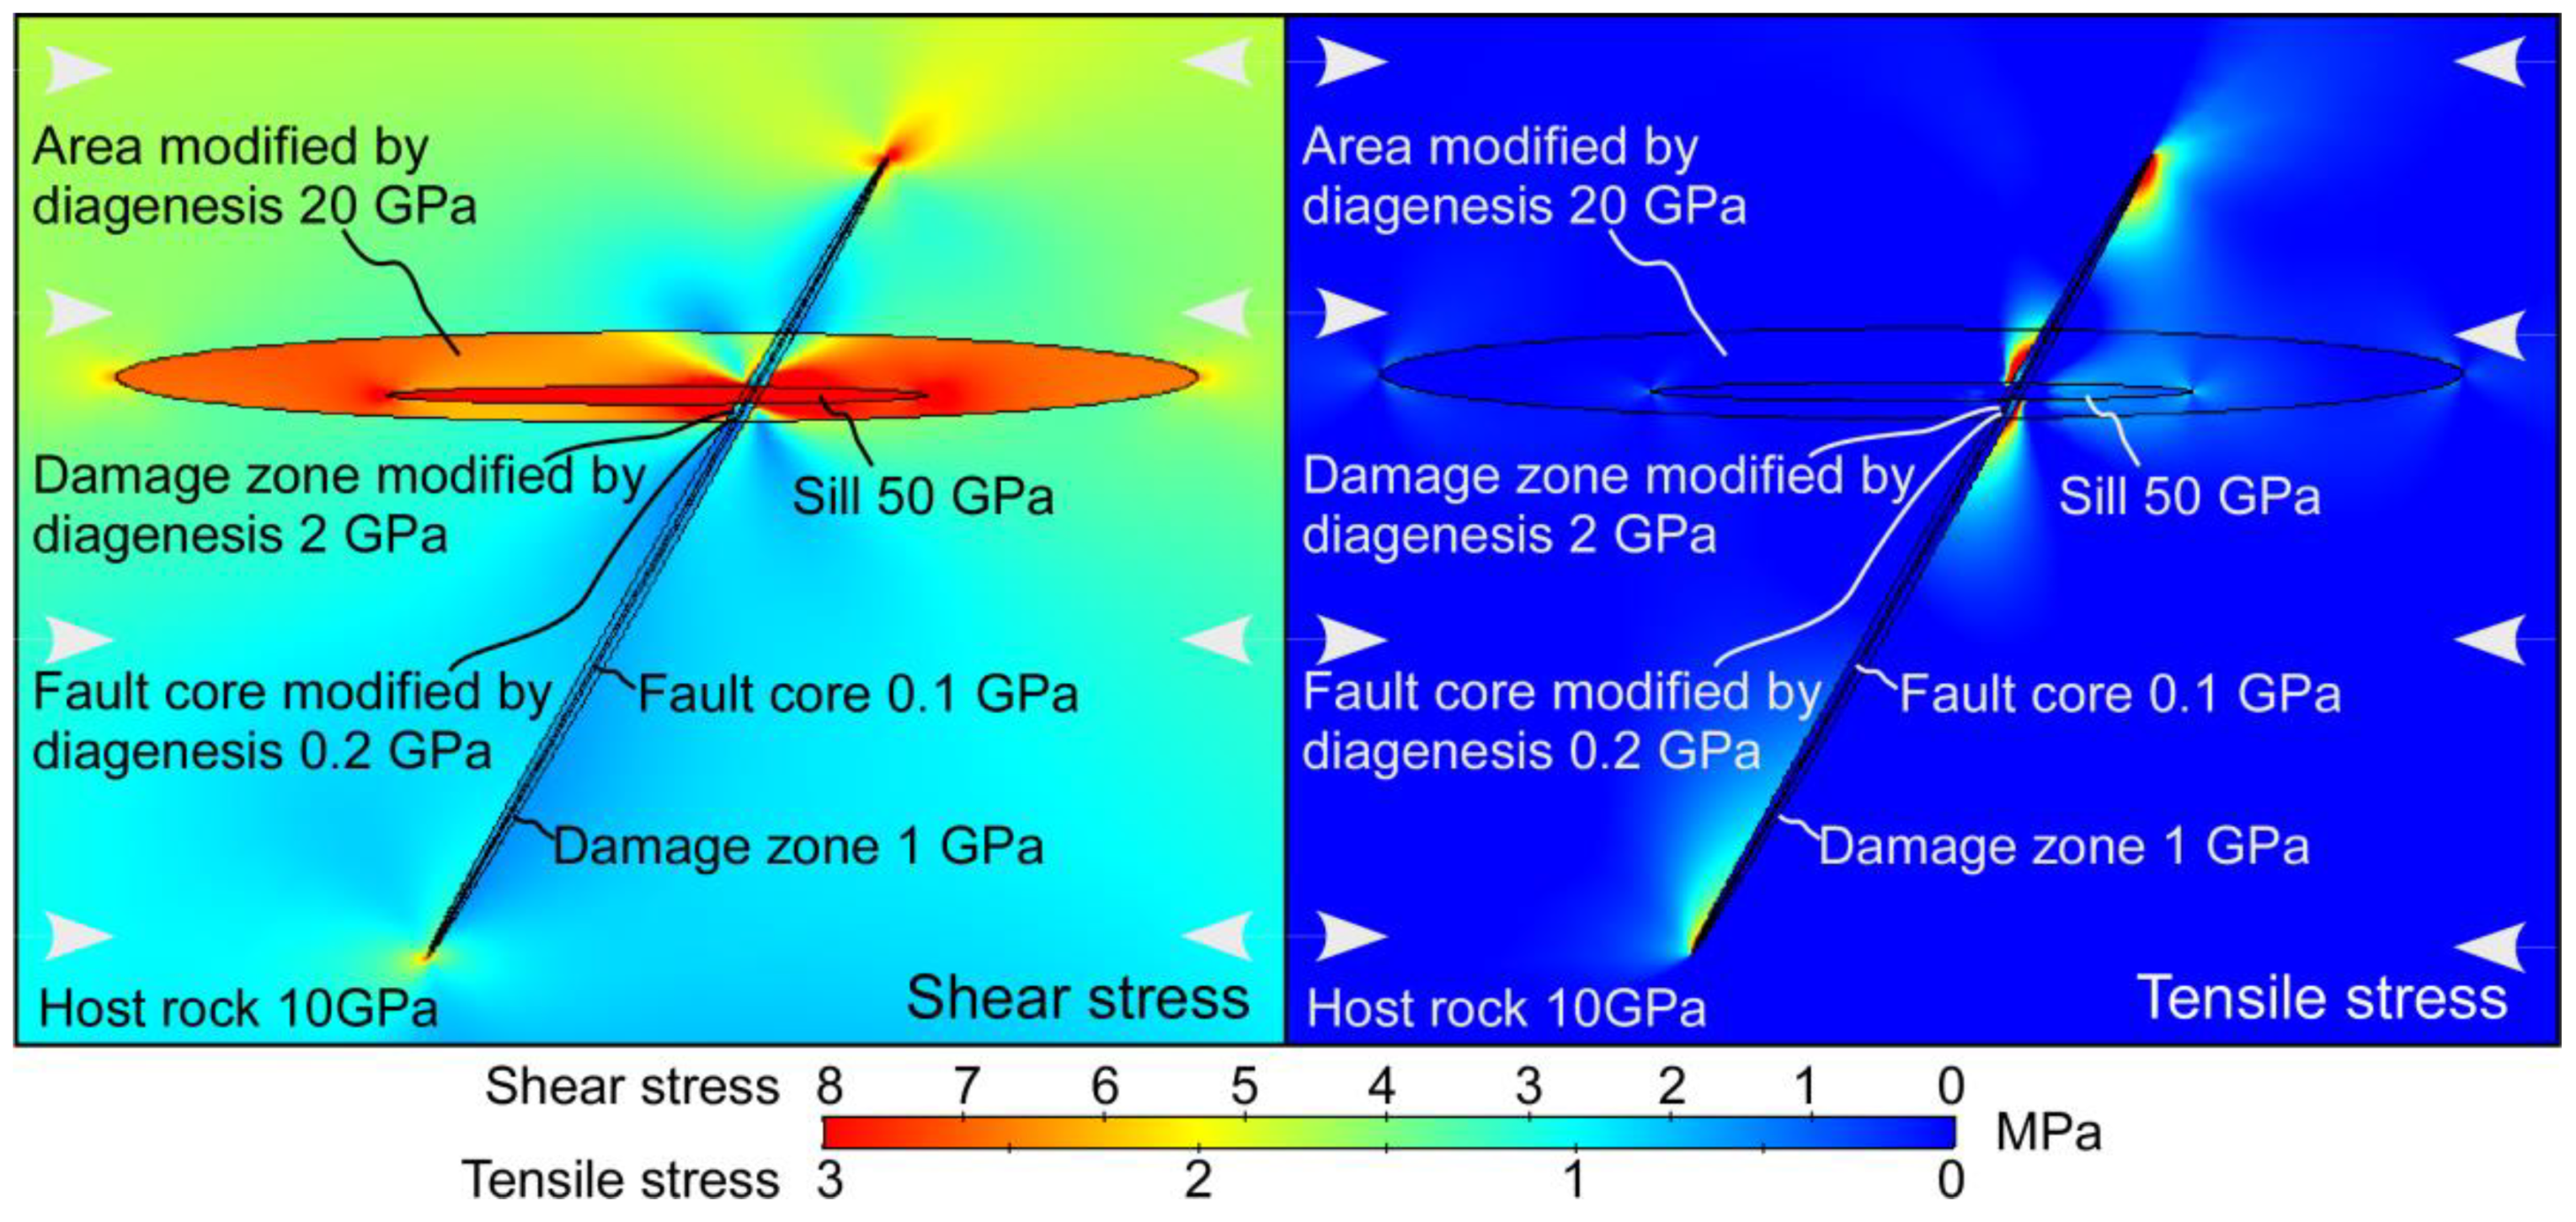
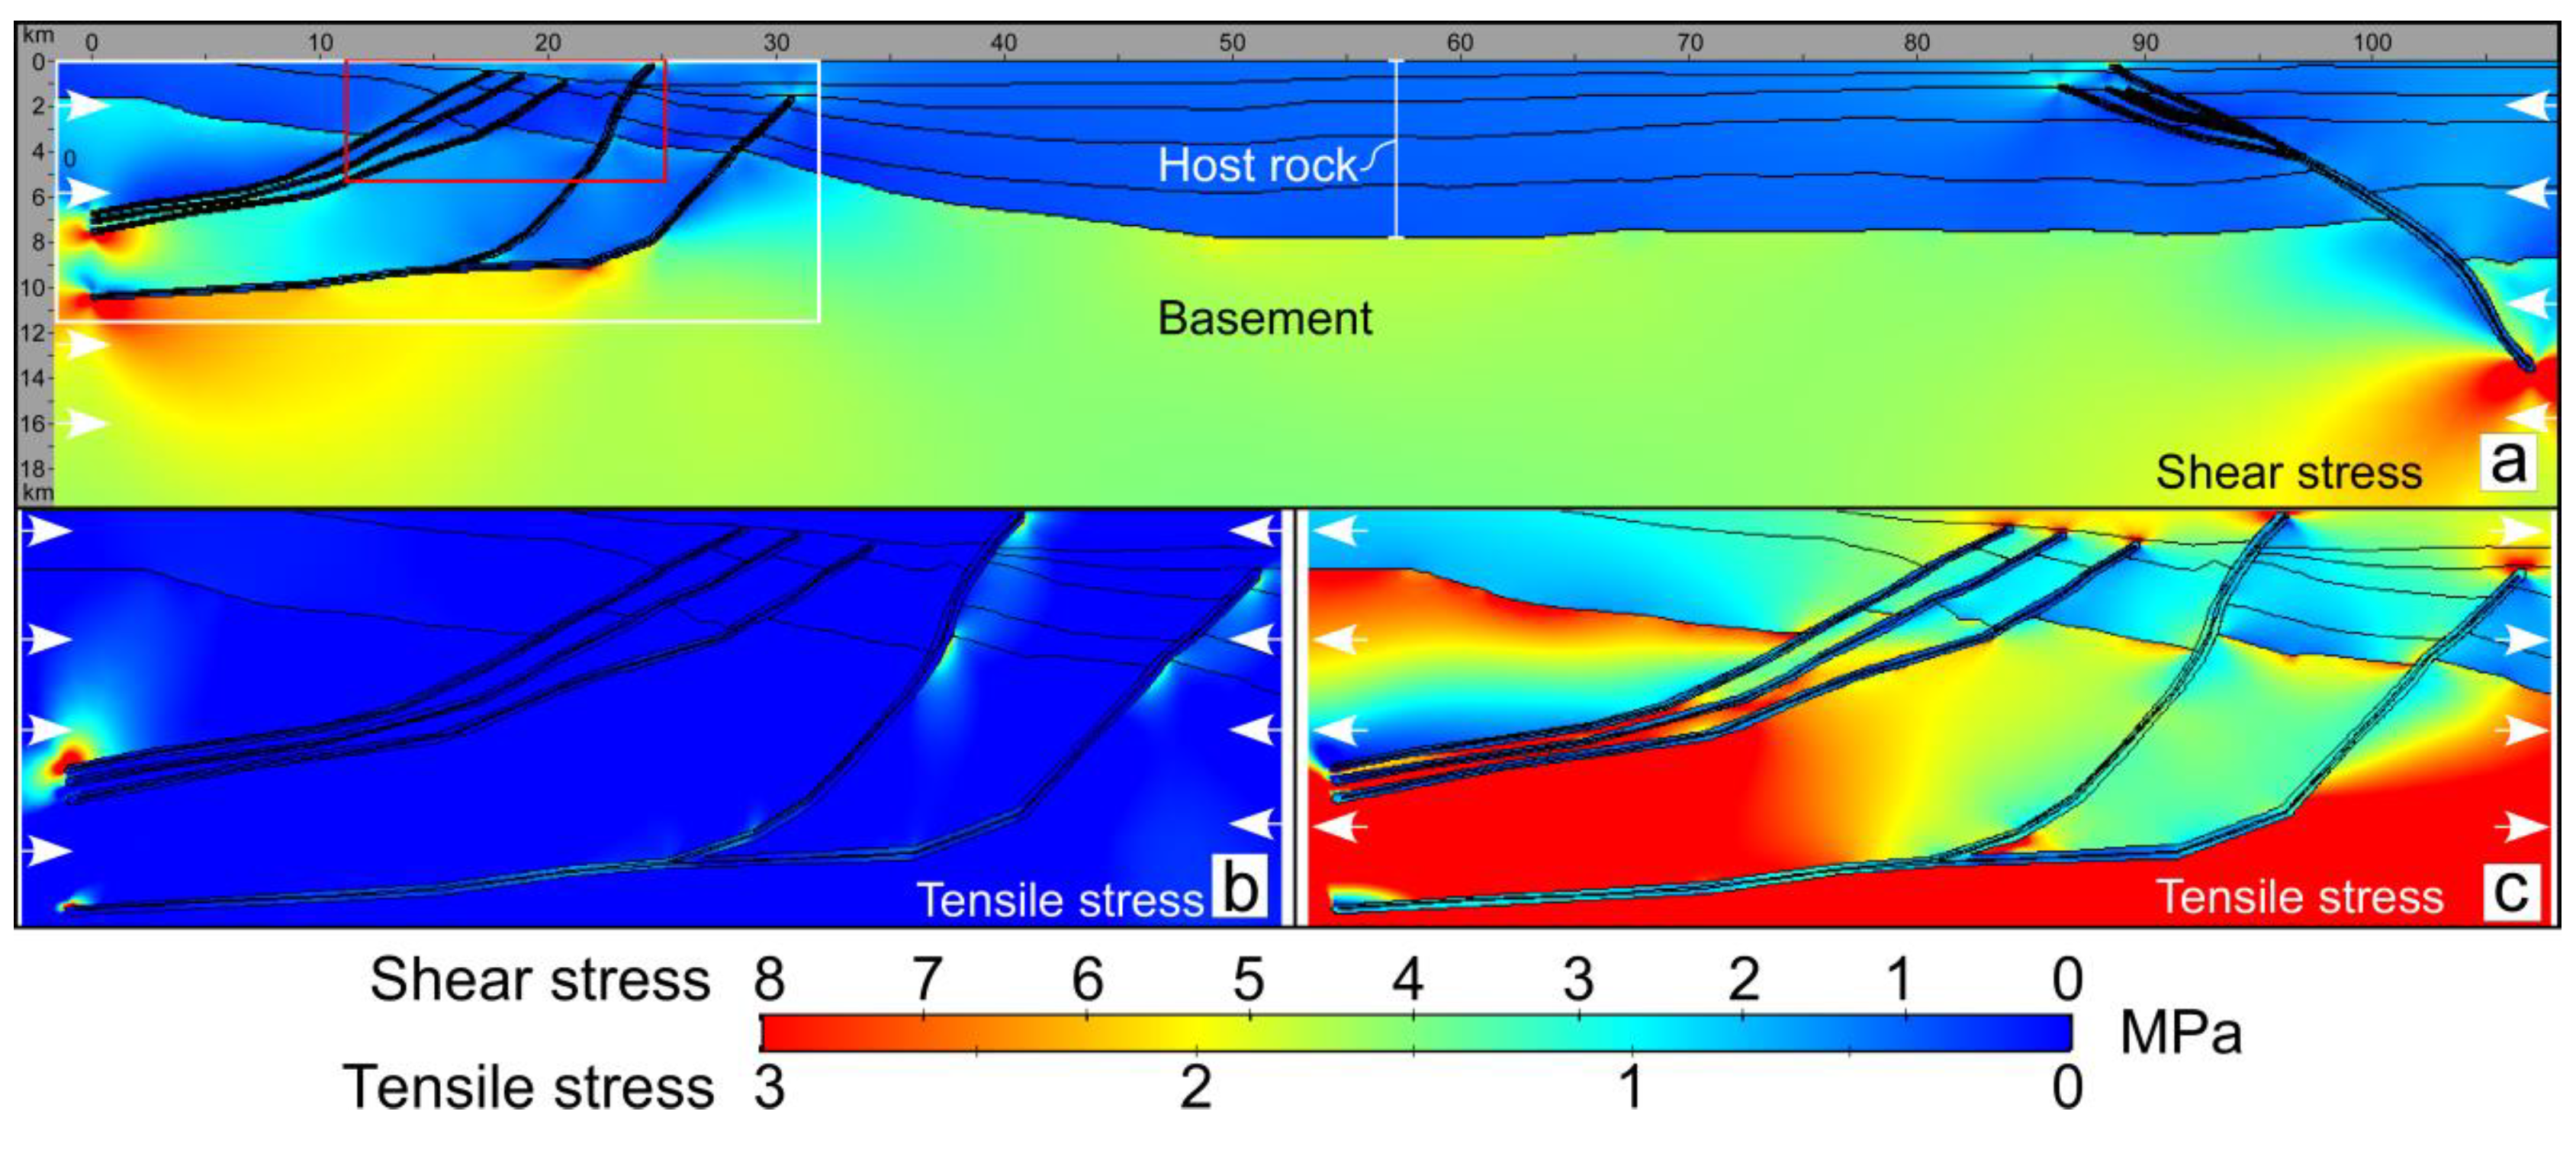
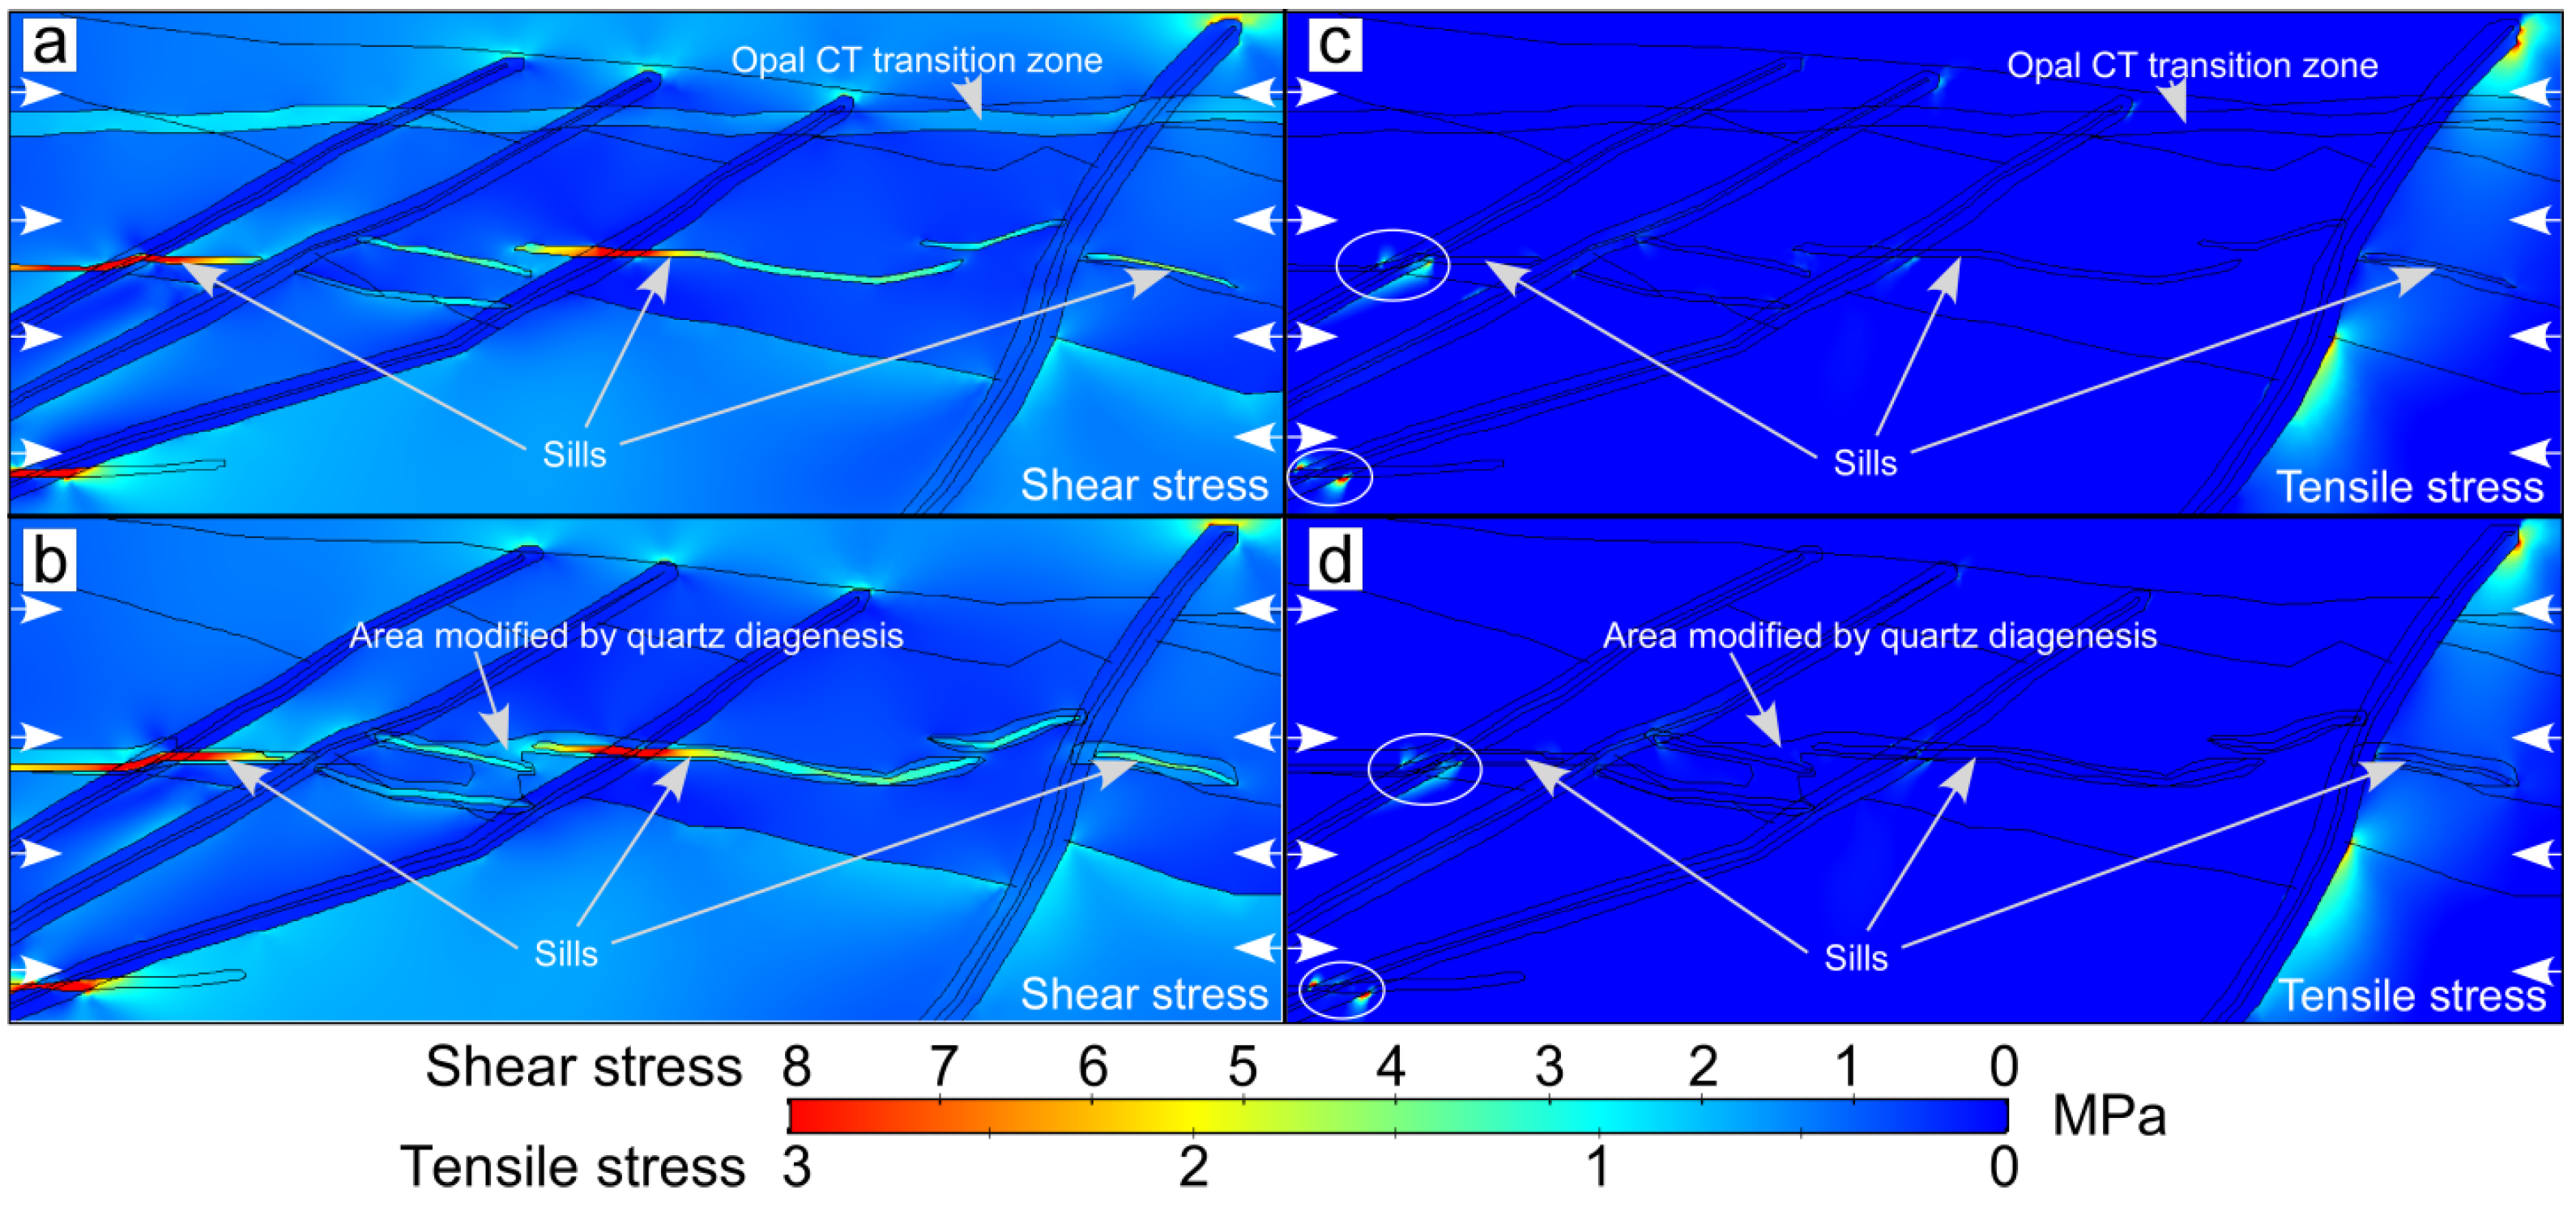
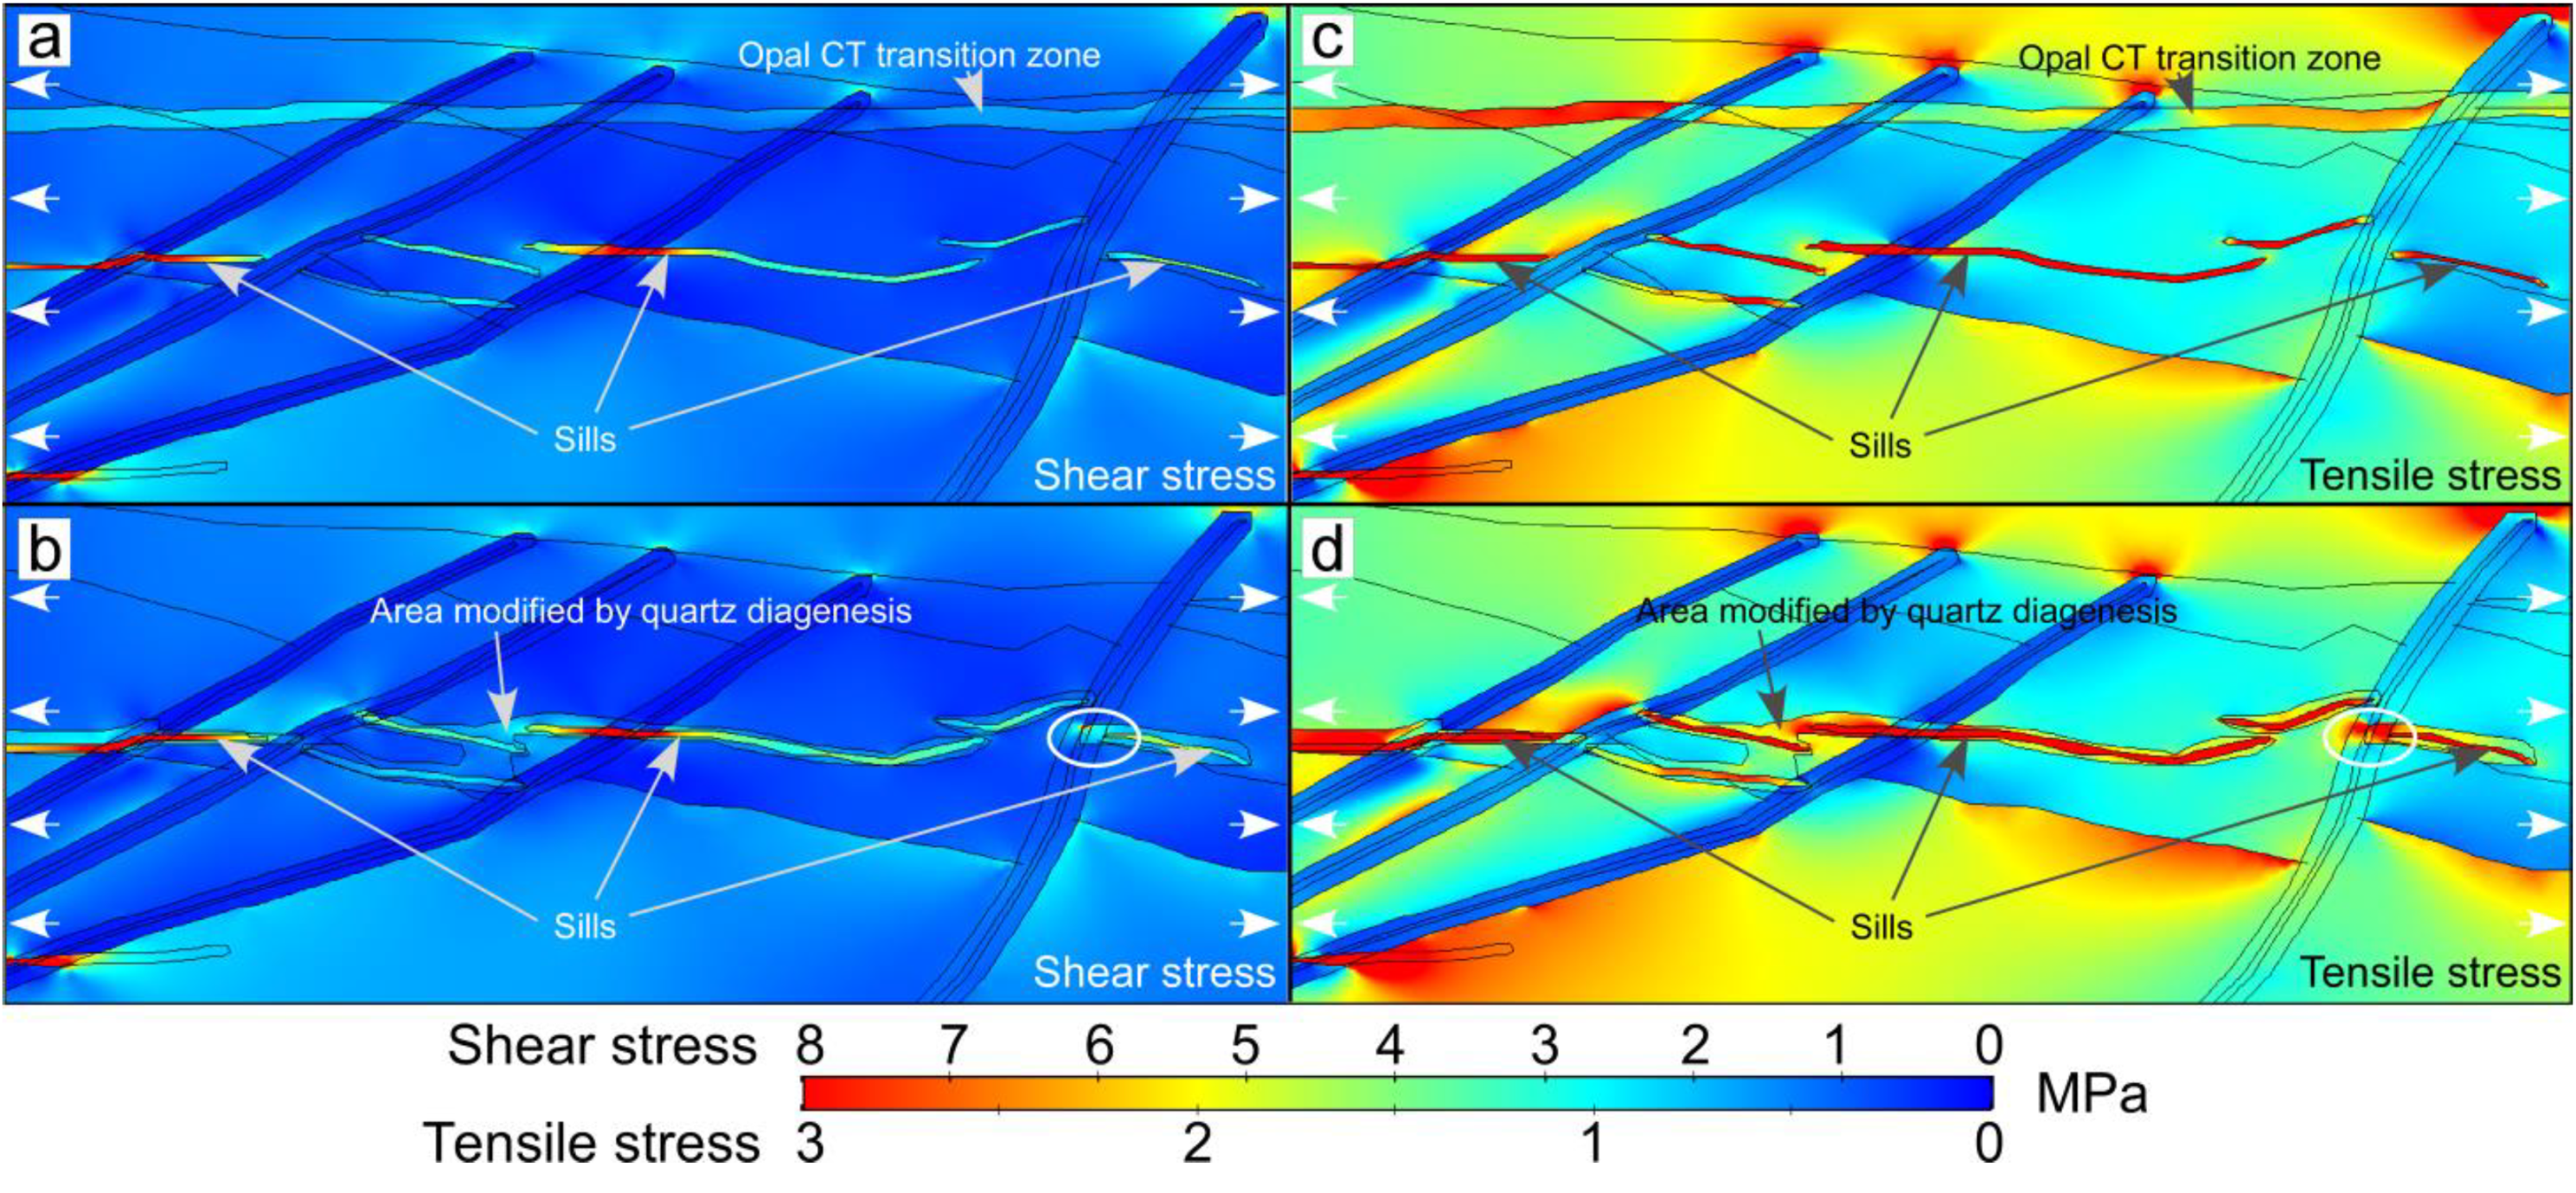
Table 1.
Kinetic data used for the opal A/CT/quartz diagenesis and smectite to illite modeling. *Values obtained from Sachsenhofer et al. [103].
Table 1.
Kinetic data used for the opal A/CT/quartz diagenesis and smectite to illite modeling. *Values obtained from Sachsenhofer et al. [103].
| Diagenetic Process | Ea (kJ mol−1) | A0 (mol/cm2s) | |
|---|---|---|---|
| Opal A—opal CT—quartz | Dralus et al. [39] | 36.99 (low TOC) | 1.04 × 10¹⁴ |
| 33.44 (high TOC) | 3.01 × 10¹⁰ | ||
| 32.52 (Quartz) | 1.96 × 10⁹ | ||
| Smectite to illite | Roaldset et al. [95] | 33 | 1.02 × 10⁸ |
| 2.72 × 10⁹ | |||
| Huang et al. [94] | 28 | 8.08 × 10⁴ | |
| Hillier et al. [102]* | 31 | 1.81 × 10³ |
Table 2.
Lithological parameters used in the modeling, based on standard values published in the literature (e.g., [108,109]).
| Lithology | Porosity—Depth Trend | Conductivity (kv) (Wm−1 K−1) | Heat Capacity | ||
|---|---|---|---|---|---|
| Surface Porosity | Exponential Constant (km−1) | Low Porosity | High Porosity | (Jkg−1K−1) | |
| Sandstone | 0.45 | 0.27 | 3.30 (6%) | 1.50 (45%) | 1080 |
| Claystone | 0.63 | 0.51 | 1.70 (6%) | 1.00 (60%) | 940 |
| Shale | 0.63 | 0.51 | 2.00 (6%) | 1.40 (60%) | 1190 |
| Basement, metamorphic | 3.10 | 3.10 | 1100 | ||
| Magmatic intrusions | 3.10 | 3.10 | 1100 | ||
| Asthenosphere | 3.50 | 3.50 | 1100 | ||
Table 3.
Physical properties used in the stress modeling, based on standard values for rock properties published in the literature (e.g., [111]).
Table 3.
Physical properties used in the stress modeling, based on standard values for rock properties published in the literature (e.g., [111]).
| Young’s Modules | |||||
|---|---|---|---|---|---|
| Host Rock | Area Modified by Diagenesis | Basement | Fault Core/Damage Zone | Fault Core/Damage Zone Modified by Diagenesis | Sills |
| 10 GPa | 20 GPa | 50 GPa | 0.1 GPa/1 GPa | 0.2 GPa/2 GPa | 50 GPa |
© 2019 by the authors. Licensee MDPI, Basel, Switzerland. This article is an open access article distributed under the terms and conditions of the Creative Commons Attribution (CC BY) license (http://creativecommons.org/licenses/by/4.0/).
Share and Cite
MDPI and ACS Style
Sydnes, M.; Fjeldskaar, W.; Grunnaleite, I.; Løtveit, I.F.; Mjelde, R. The Influence of Magmatic Intrusions on Diagenetic Processes and Stress Accumulation. Geosciences 2019, 9, 477. https://doi.org/10.3390/geosciences9110477
AMA Style
Sydnes M, Fjeldskaar W, Grunnaleite I, Løtveit IF, Mjelde R. The Influence of Magmatic Intrusions on Diagenetic Processes and Stress Accumulation. Geosciences. 2019; 9(11):477. https://doi.org/10.3390/geosciences9110477
Chicago/Turabian StyleSydnes, Magnhild, Willy Fjeldskaar, Ivar Grunnaleite, Ingrid Fjeldskaar Løtveit, and Rolf Mjelde. 2019. "The Influence of Magmatic Intrusions on Diagenetic Processes and Stress Accumulation" Geosciences 9, no. 11: 477. https://doi.org/10.3390/geosciences9110477
Note that from the first issue of 2016, this journal uses article numbers instead of page numbers. See further details here.