Characterizing Total Phosphorus in Current and Geologic Utah Lake Sediments: Implications for Water Quality Management Issues


Department of Civil and Environmental Engineering, Brigham Young University, Provo, UT 84602, USA
*
Author to whom correspondence should be addressed.
Hydrology 2018, 5(1), 8; https://doi.org/10.3390/hydrology5010008
Submission received: 20 December 2017
/
Revised: 11 January 2018
/
Accepted: 17 January 2018
/
Published: 19 January 2018
Abstract
:Utah Lake is highly eutrophic with large phosphorous inflows and a large internal phosphorous reservoir in the sediment. There are debates over whether this phosphorous is from geologic or more recent anthropologic sources. This study characterizes total phosphorous in geologic and current lake sediments to attempt to address that question. The average total phosphorous concentrations in the lake sediment were 666 ppm, with most samples in the 600 to 800 ppm range with a few larger values. Concentrations in historic geologic sediments were not statistically different from lake sediments. A spatial analysis showed that phosphorous distributions appeared continuous from the lake to the shore and that high and low values could be attributed to areas of seeps and springs (low) or feed lots and waste water discharge (high). These results indicate that geologic sediments without anthropogenic impacts are not statistically different than current lake sediments. The high values indicate that internal natural phosphorous loadings could be significant and the impaired state may be relatively insensitive to external anthropogenic loadings. If this is the case, then mitigation efforts to address anthropogenic sources may have minimal impacts. This case study presents an impaired water body where non-anthropogenic nutrient sources are significant and shows that reservoir management decisions should consider these non-anthropogenic phosphorous sources relative to anthropogenic sources. This study can serve as a template for evaluating the importance of geologic phosphorous sources for management decisions.

1. Introduction
1.1. Study Goals and Importance
Utah Lake has extensive algal blooms, is highly productive, highly eutrophic, and nutrient rich [1,2]. The Utah Division of Water Quality has determined that phosphorous inflows, in the form of phosphate, significantly contributes to the impairment of Utah Lake [1,2] and are considering a number of mitigation efforts, all of which carry significant costs in both monetary and resource terms. These mitigation efforts assume that external phosphorus loading, mainly from anthropogenic sources, significantly contribute to Utah Lake’s impaired state. We present evidence that internal natural phosphorous loadings could be a significant factor, and that the impaired state of the lake may be relatively insensitive to external anthropogenic loadings.
Utah Lake has high phosphorous inflow loadings, on the order of 300 tons/year, with an estimated 80% of this total, 188.8 tons/year, from wastewater treatment plants (WWTP). Two WWTPs, Provo City and Orem City, are estimated to contribute 71.6 and 79.3 tons/year, respectively, or approximately 50% of the total annual phosphorous load. The estimated Utah Lake outfalls of phosphorous are on the order of only 85 tons/year [1,2] indicating the lake acts as a phosphorous sink. Our research shows that total phosphorous in the lake sediment is very high, but most importantly, phosphorous concentrations in geologic lake sediments, deposited prior to human impacts, are not statistically different than current lake sediments; they have similar levels. This indicates that the anthropogenic loading is not significantly affecting phosphorous levels in lake sediments. It is likely that these high sediment phosphorous levels directly contribute to phosphorous levels in the water column. We infer from these data, and some simple lab experiments, that water column phosphorous levels are likely moderated by phosphorous in the sediment, not by inflows. If this is the case, then costly mitigation efforts at wastewater treatment plants will have a minimal impact on Utah Lake water quality. Our results indicate that phosphorous levels in the sediment are from geologic origins. The Utah Lake watersheds include the Park City formation, which is an upper Carboniferous formation of phosphate-bearing shales about 100 feet thick (30 m) [3]. It is rich in phosphates and includes deposits of economic phosphorite ores mined in the Utah Lake watershed [4]. The Park City formation is part of a region called the western phosphate field that includes the Phosphoria, Park City, and Embar formations [5,6,7].
This study is important to reservoir and lake management as it provides a case study of an impaired water body where non-anthropogenic nutrient sources are significant and should be considered when evaluating mitigation efforts. There are other studies in this area such as [8], which evaluates non-anthropogenic and anthropogenic nitrogen sources for water quality impacts. Reservoir management decisions to address water quality issues made without considering these non-anthropogenic phosphorous sources may not be optimal and may be ineffective. This study does not attempt to estimate phosphorous loading to Utah Lake from the sediments, as that would require significant field and laboratory work to characterize phosphorous release and transport processes within the sediments and from the sediment to the water column. It presents total phosphorous amounts in the lake and geologic lake sediments, discusses the observed spatial distributions, and presents results from some preliminary laboratory studies that indicate the relative magnitude of sediments as phosphorous sources.
1.2. Phosphorous
Phosphorous is a primary limiting nutrient of phytoplankton growth in many streams, lakes, and reservoirs including Utah Lake [9]. Phosphorous can come from both anthropogenic sources such as sewage, WWTP discharge, industrial discharges, and fertilizers and natural sources such as precipitation or geologic materials [9].
This study presents the results of a field sampling campaign to characterize the amount of phosphorous present in both current and geologic Utah Lake sediments. Samples were taken from current lake sediments and from geologic (older than 10,000 years) sediments on the lake shore and analyzed for total phosphorous content. The results were evaluated to determine if the differences among the different measurements were statistically significant. These results can then be used to infer if the high phosphorous levels in the lake sediments are from anthropogenic activities or geologic in origin. While this study is unique to Utah Lake, many other impaired lakes and reservoirs exist in regions that have high geologic phosphorous content. This study can serve as a template for evaluating the importance of geologic sources for management decisions.
The Vollenweider model [10] is widely used to evaluate reservoir health. It estimates reservoir phosphorous concentrations using a mass balance approach that includes phosphorous inflow relating in-lake phosphorus (Plake) inlet concentrations (Pin) and hydraulic residence time (tw):
This model assumes reservoir phosphorous levels are only due to phosphorous inflows and the amount of time required to flush the impoundment. However, this model is not applicable for water bodies that have significant internal phosphorous sources such as Utah Lake [11]. In these reservoirs, in-lake water column phosphorous levels may be independent of inflow concentrations and moderated by interactions with the sediments. Søndergaard et al. [12] describe a mass balance on phosphorous in the sediment and state that when phosphorous flux from the sediment to the lake exceeds phosphorus inflows, and then reduction in lake inflows may have little to no effect on water quality conditions [12]. That is, phosphorous levels in the water column may be controlled by sediment interactions rather than external sources. Lake sediments can act as either a source or a sink for phosphorous in the water column depending on the amount of dissolved oxygen, water column phosphorus concentrations, and sediment phosphorous concentrations [13].
1.3. Phosphorus Release from Sediments
Phosphorous sediment-water interaction is a complicated and governed by different processes depending on lake and chemical compositions [12]. Parameters that affect phosphorous partitioning between the water column and the sediment include sediment dry weight, organic content, and iron (Fe) content along with the concentration of other elements with the capacity to bind and release phosphorus. Water parameters include pH, reduction potential (pE), total dissolved solids, and others. Release mechanisms are governed by parameters such as: Fe:P ratio, reduction–oxidization (Redox) conditions, resuspension, turbidity, biological activity, microbial processes, temperature, and pH [12].
Phosphorus in sediments can be in several fractions including water-soluble, salt-extractable (sorbed), iron-bound, organic, and pH-sensitive (generally inorganic or mineral) [14,15,16]. Phosphorous in the water-soluble fraction is generally in equilibrium with sediment pore water and diffuses easily into the water column. Salt-extractable phosphorous is typically sorbed onto the sediment and can be released by ion exchange mechanisms (salt). Iron-bound phosphorous is bound to iron minerals in the sediments, typically iron-hydroxides which are significantly more soluble under reducing conditions. Organic phosphorous is typically found in detritus from living organism, while the mineral fraction is typically mineral phosphorous that is not bio-available or easily dissolved. The first two fractions, water-soluble and salt-extractable tend towards equilibrium in a shallow, well mixed lake with sediment resuspension, like Utah Lake [14,16].
Iron reduction and associated phosphorous release are governed by aeration levels, with anaerobic or anoxic conditions creating conditions that contribute to the release of phosphorous [17]. This is often catalyzed by anaerobic microbial processes. Redox conditions regulate phosphorus release into pore water for the fraction of phosphorous bond to the iron minerals. When Fe(III) is reduced into Fe(II), the iron mineral solubility is significantly higher, up to two orders of magnitude, resulting in iron dissolution. As the iron dissolves, phosphorus bound to the iron minerals is released into water [18,19]. In 1936 and 1947, Einsele [20] and Mortimer [19], respectively, showed that under oxygenated conditions sediments retain phosphorus by fixation to Fe(III), whereas, under anaerobic or reduced conditions, phosphorus is released when the iron is reduced to a more soluble form, Fe(II). Ruban and Demare [21] concluded that phosphorus release was avoided as long as dissolved oxygen concentration stayed above 0.5 mg/L. Recently, Petticrew and Arocena [22] showed that phosphorus release rates under reducing conditions are strongly correlated to iron bound phosphorus [12], and Jensen et al. [23] concluded that retention capacity is proportional to the Fe:P ratio if the ratio exceeds 15 by weight while Caraco et al. [24] stated that the ratio can be less than 10. Jensen, Kristensen, Jeppesen and Skytthe [23] analyzed sediment from 12 different lakes and found that for aerobic sediments the phosphate concentration is related to the Fe:P ratio and total iron controls the maximum adsorption capacity [25]. Phosphorous releases are also affected by calcium concentrations with release rates more affected by pH than redox conditions [26].
1.4. Biological Activity
Many of the chemical processes that affect phosphorous equilibrium and release rates from sediments are relatively slow, but can be catalyzed by biological activity, which significantly increases the rate at which these processes occur. For example, iron reduction or oxidation can be relatively slow, on the order of months to years or longer; biological processes can significantly increase this rate to time scales on the order of hours to days [27]. Biological activity also can create more reducing conditions through decomposition of organic matter using existing oxygen.
Biological processes can make phosphorous from the organic fraction available to the water column as microbial processes consume oxygen and release phosphorous from the decomposition of organic materials [17]. This means that biological processes can release phosphorous under both oxidizing (organic fraction) and reducing conditions (iron-bound fraction) depending on conditions. If sufficient material (food) is available, aerobic processes continue until oxygen and nitrate are exhausted as electron acceptors, then iron or sulfates are used, resulting in reducing conditions, causing iron dissolution and release of iron-bound phosphorous as discussed. During calm, warm summer periods, especially when large amounts of biomass are decomposing, biological activity is increased, releasing phosphorous from organic materials and potentially causing anoxic events to occur releasing iron-bound phosphorous in the sediments [12,17]. Temperature also affects phosphorus release from sediments, as higher temperatures can increase microbial activity creating anoxic or anaerobic conditions and catalyzing mineral dissolution [19,28,29,30].
1.5. Resuspension
In shallow lakes, such as Utah Lake, physical processes, such as boating, wave action, and carp feeding, regularly disturb the sediment, mixing phosphorous-rich sediments with the water column. Resuspension is a mechanical process that permits settled sediments to be redistributed in the water column and enhances phosphorus exchange between the suspended material and the water column [31]. A number of factors cause resuspension including waves [32], wind [33,34], ice cover, turbidity [35], and climate change [36]. Carp and other benthivorous fish have a large impact on sediment resuspension and nutrient concentrations in the water column. Their rooting activities cause sediment resuspension as they search for food and digestive activities release phosphorus into the water. Utah Lake has a significant carp population that are bottom feeders and create significant sediment disturbance, which can lead to higher phosphorous content in the water column and algal growth in lakes [2].
Experiments have shown that internal reservoir phosphorus loading encouraged by resuspension to be 8 to 10 times greater [37] and 20 to 30 times greater [34] than that from undistributed sediments. During resuspension, the majority of the released phosphorous is not from the iron-bound fraction because reservoir water is aerobic, but more often from the water-soluble and salt-extractable fractions and is not dependent on the aerobic state of the water. If reservoir water is anaerobic or anoxic, then iron-bound phosphorous can also be released to the water column.
2. Utah Lake
2.1. Background Information
Utah Lake (Figure 1 and Figure 2) is considered the third largest freshwater lake, by the surface area, west of the Mississippi with a surface area of about 150 square miles (384.5 km2). Volume is about 870,000 acre-feet (1100 million cubic meters). It is a shallow lake with an average depth of 9 ft. (2.74 m) and a maximum depth of about 12 feet (3.6 m) in non-drought years. During drought years, the average depth is shallower. The lake lies in Utah valley surrounded by the major cities of Provo, Orem, and Saratoga Springs.
Utah Lake is a popular recreation area because of its proximity to the metropolitan areas of Provo and Orem. Approximately 150,000–200,000 people visit Utah Lake each year for its shoreline recreation, fishing, and water activities. It also supports agriculture uses as it is used to irrigate about 50,000 acres (202.3 km2) yearly.
Utah Lake has fifteen key tributaries with the majority of inflows from the Provo and Spanish Fork Rivers, which together account for approximately 60% of the inflow. Other inflows are from springs, groundwater, overland flow, and precipitation. The Jordan River is the only surface outlet and is located on the north end of the Lake [38]. Utah Lake is a semi-terminal lake with the outfall only about half the inflow, even though there is a significant groundwater contribution to the lake. Evaporation plays a large role in the hydrology of Utah Lake, as almost 41% of its water is lost due to evaporation each year. The lake has high sedimentation rates, with an estimated 60% to 80% of the sediment being calcite mainly coming from mineral precipitation from the water column [39,40]. This high evaporation rate coupled with the very shallow nature of Utah Lake causes the high dissolved solids in the lake water, essentially maintaining dissolved solids at the saturation level for calcite. Average annual precipitation in the area is about 19.8 in. (50.3 cm). Table 1 provides an overview of the hydrology of Utah Lake.
Utah Valley is a sediment-filled basin that contained the historic Lake Bonneville, which occupied the basin between about 25,000 and 10,000 years ago. This historic lake filled Utah valley with lake sediments that created a nearly flat lake bottom and relatively flat shoreline [38]. The greatest lake level elevation, of 5090 feet (1550 m), was achieved about 16,000 years ago (the Bonneville level). Then, about 13,000 to 14,000 years ago, the level dropped to about 4740 feet (1440 m) (the Provo level). After the ice age, lake levels declined to about 4250 feet (1295 m) (the Gilbert level) about 10,000 years ago [38]. Sediments from the Gilbert level are the geologic sediments sampled in this study. The current lake level is about 4490 feet (1370 m) above sea level, higher than the Gilbert level because of sediment rebound.
2.2. Sediment
As noted, Utah Lake is shallow with an average depth of 9.2 feet (3 m). In drought years, this can be significantly less. In Utah Lake wind action, recreation, and carp resuspend sediments in the water column, potentially releasing phosphorous [42]. These processes resuspend the sediments sufficiently to create a lake bottom composed of soft ooze rather than more compacted sediments [40]. According to Horns [38], there generally is no distinct boundary between water and sediment at the bottom of Utah Lake with wave action mixing sediment up to a foot deep (0.3 m). This creates conditions where phosphorous stored in the sediment significantly contributes to phosphorous in the water column. Utah Lake sediment is high in organic content and is generally anaerobic.
Based on seismic profiling, the average sedimentation rate over the last 10,000 years was between 0.8 mm/year and 1.5 mm/year [38,40]. Studies involving dandelion pollen, a species introduced in 1849, estimate sedimentation rates of about 1.38 cm per year over the last 150 years [37]. Recent studies estimate the long-term sedimentation rate to be about 1 mm/year, with a possible increase over the past 150 years to about 2 mm/year [37,39]. The sediments below Utah Lake extend to a depth as great as 10,000 feet (3000 m) [38] with deep sediments and shore sediments (over 100 feet (30 m) above current lake levels) from historic Lake Bonneville. These sediments present a large potential reservoir of geologic phosphorous.
2.3. Utah Lake External Phosphorous Loading
Different studies have estimated external phosphorous loading into Utah Lake and have identified loadings provided from streams, springs, drains, wastewater plants, and other sources. The State of Utah Department of Environmental Quality (DEQ) Division of Water Quality conducted a study to calculate total phosphorus loads for each inflow to the lake [1]. Evaporation and precipitation were ignored in these calculations assuming that they have negligible phosphorus amounts.
Figure 3 presents a summary the DEQ study estimating the total phosphorous loading for Utah Lake [1]. The total phosphorous inflow is from both natural and anthropogenic sources. The DEQ estimates that anthropogenic sources, mostly WWTPs, provide about 77% of the total phosphorous intake. They estimate the total phosphorous intake is approximately 297.6 tons/year while the only phosphorous outflow is the Jordan River with a total phosphorus outflow of approximately 83.5 tons/year. These estimates show that Utah Lake is a phosphorous sink. Even with Utah Lake acting as a large phosphorous since, we later show that total phosphorus levels in current lake sediments are not statistically different than levels of geologic lake sediments.
3. Methods
3.1. Sampling Methods and Locations
We considered many factors during the design and implementation of the sampling process. We wanted to representatively sample the lake with enough data to infer the spatial distributions and patterns, and also characterize regions of the lake we expected to have high phosphorous amounts because of inflows. Because of the size of Utah Lake, access was also a consideration. Sampling occurred during two separate summer field campaigns, June through August, in 2015 and 2016. We took 36 samples in 2015 and 49 samples in 2015. Samples from 2015 were reported in [43].
We sampled semi-random locations in the body of the lake, and more or less equally spaced locations around the lake perimeter (Figure 4). We sampled with higher density near inlets or points where overland flow was likely. This included additional points to represent the locations of the inflows from WWTP locations and the outlet. We took ten samples of geologic sediments. Five of these were on the northwest side of the lake in areas that exhibited very little anthropogenic impact—that is, there did not appear to be any indication of agriculture use, construction, or animal containment (e.g., corrals for fenced areas). The two samples on the west side of the lake were in areas, which had no visible indications of recent impacts, but it was more difficult to determine because of land cover. These geologic sediment samples are from lake deposits about 10,000 years ago.
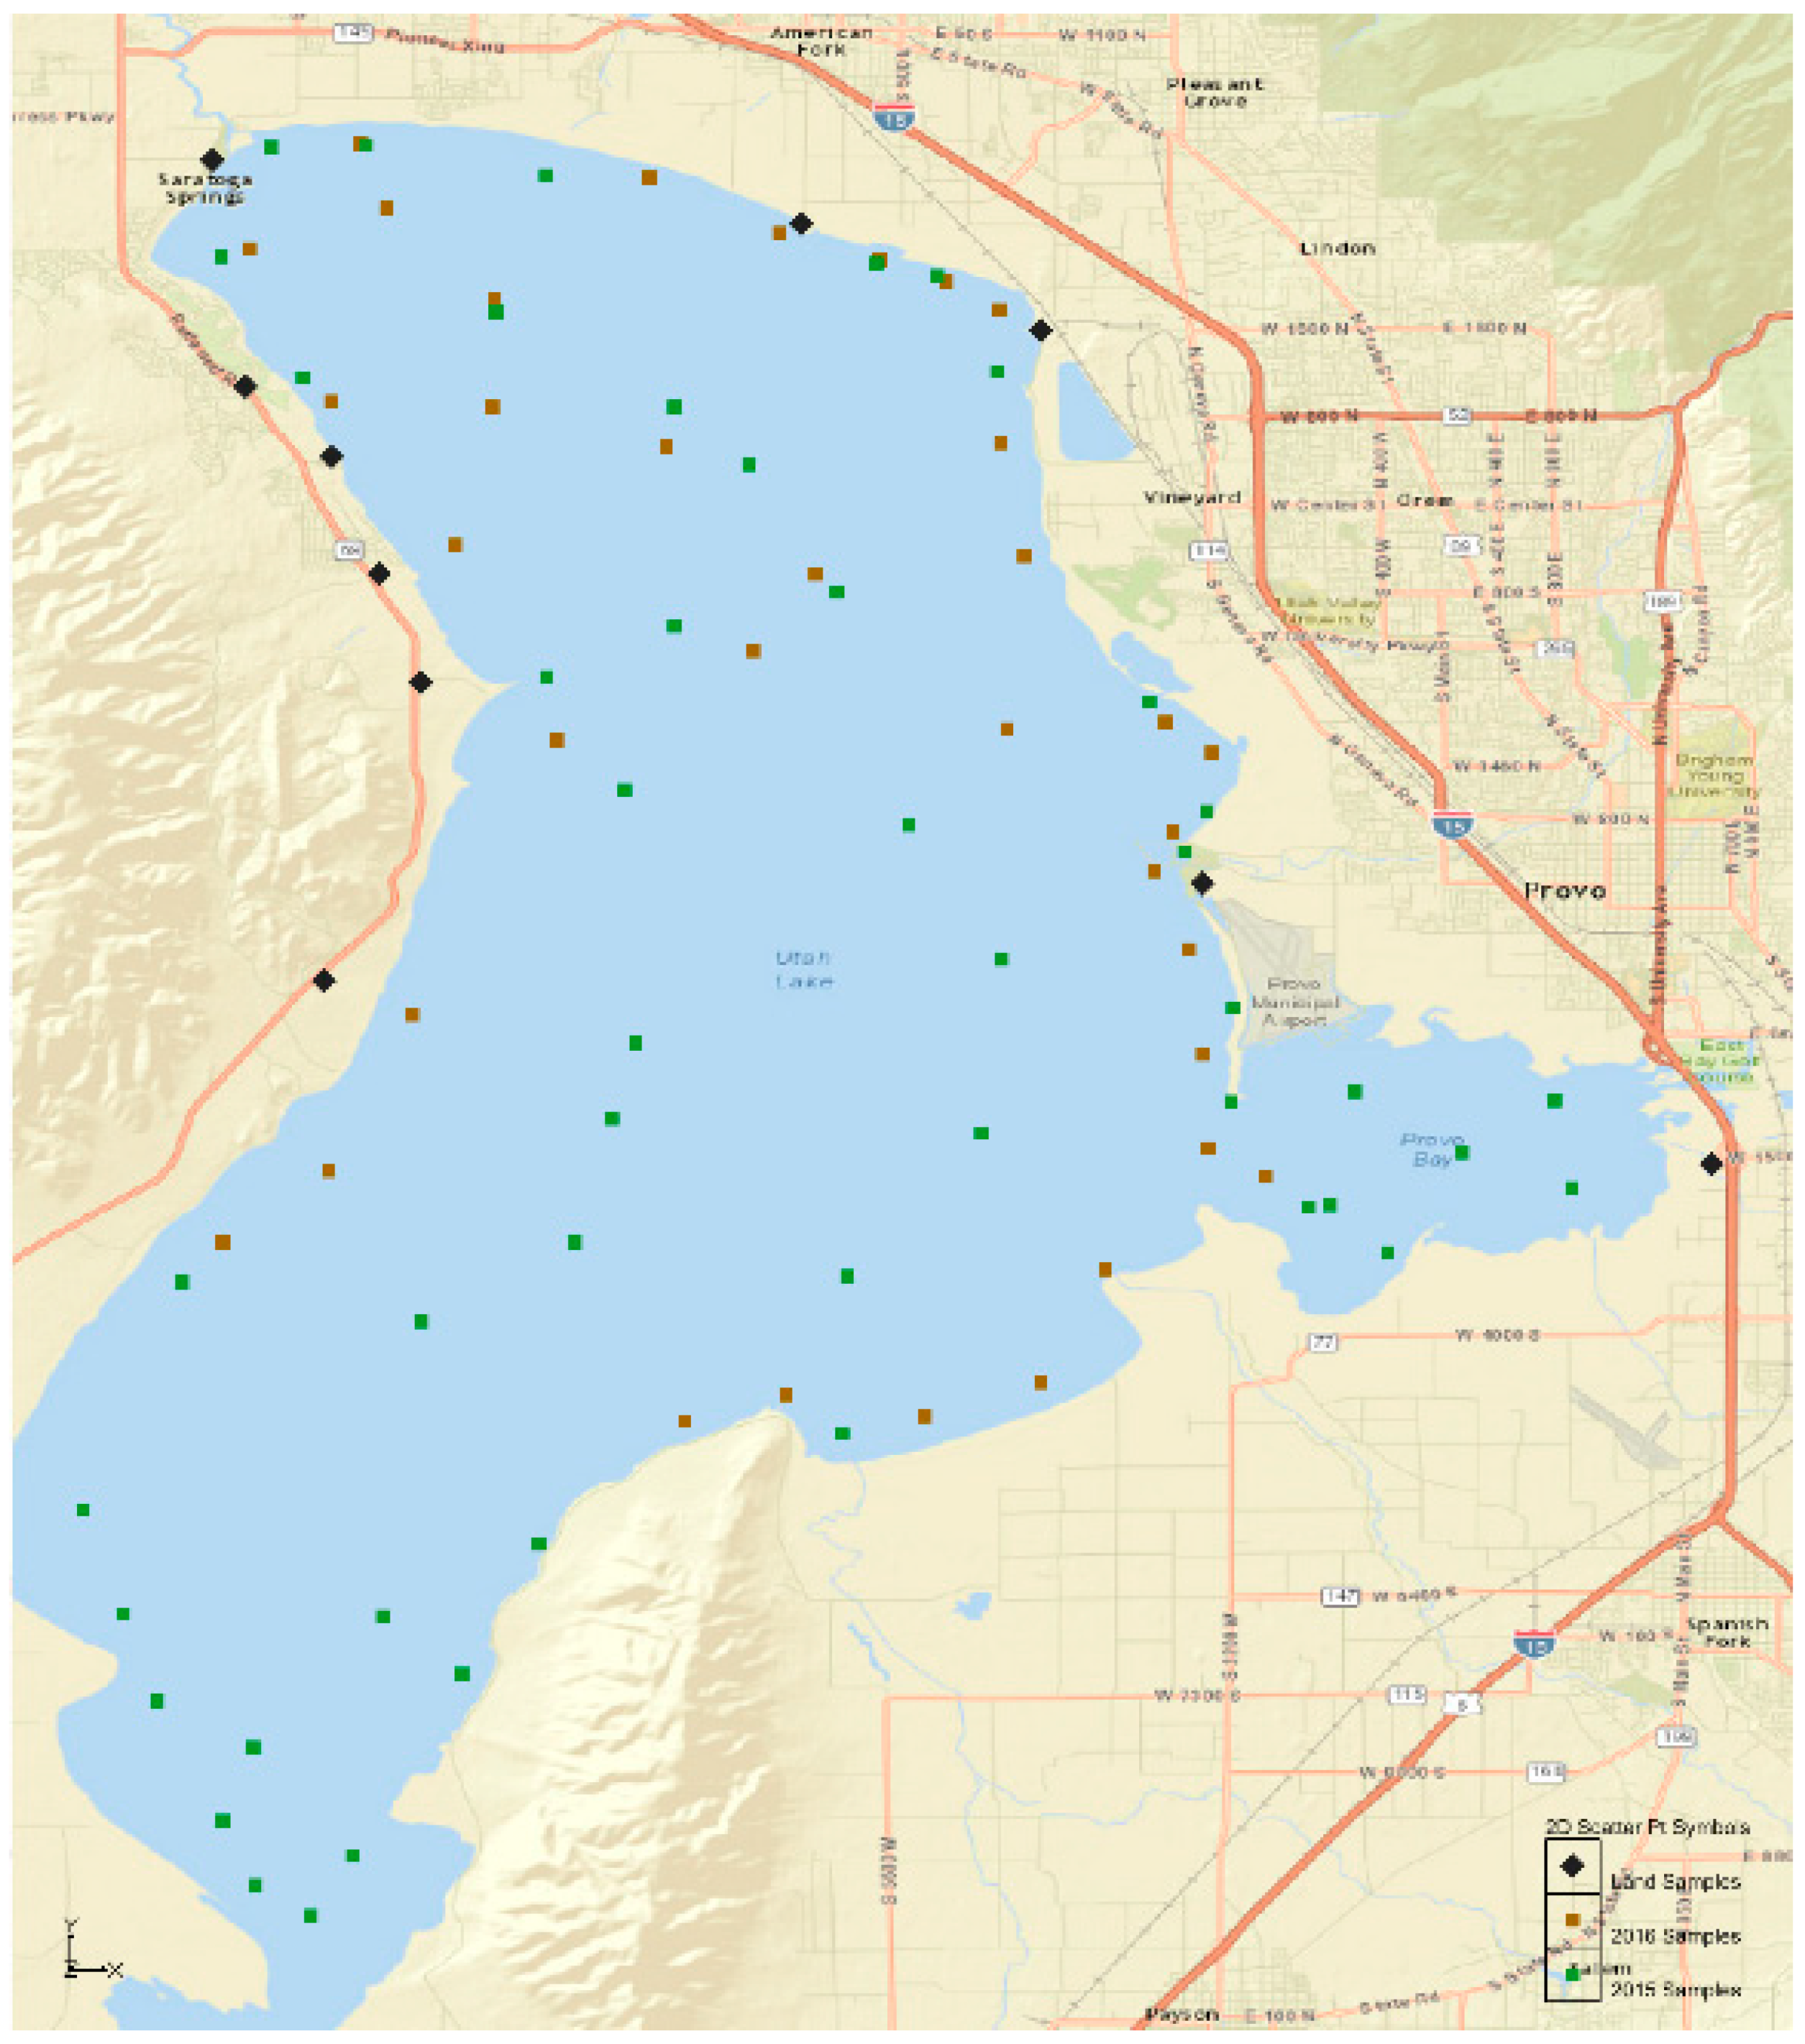
Figure 4 shows the distribution and location of these sample points. The figure indicates the lake sediment points sampled in 2015 as blue squares, the lake sediment points sampled in 2016 as red circles, and land samples as black triangles that represent geologic lake sediments.
Samples were collected near the top of the sediment layer from 0 to 4 inches in depth. As noted, the top foot or so of the Utah lake sediments are continuously re-worked, resulting in a layer of sediments that are well mixed and in good contact with the water column. This near-surface sediment region does not exhibit significant layering. Based on field observations, we saw little vertical variation in the first foot or so of the sediment.
Once collected, we stored samples in Ziploc bags, labeled with number, location, and date, and kept in a cooler. We transported samples to the Brigham Young University (BYU) Civil Engineering Environmental Laboratory and stored the samples in a refrigerated room until analysis.
3.2. Chemical Analysis Methods
The analysis for total phosphorous was done by the BYU Environmental Analytics Laboratory (Provo, UT, USA). Samples were digested with an Ethos OZ Microwave digestion system (Milestone, Fatebenefratelli 1/5, 24010, Sorisole (BG), Italy) to dissolve the sediment and release phosphorous. The results were filtered using a 0.45 μm filter and analyzed using a Thermo Scientific iCAP™ 7400 ICP-OES Analyzer (ThermoFisher, Boston, MA, USA) with a phosphorus detection limit of 1.55 μg/L. The dry-weight total phosphorous was then calculated and reported as mg/kg (mg of phosphorous per kg of sediment), which is parts-per-million in mass units (ppm).
The Environmental Analytics Laboratory also analyzed the 36 samples taken in 2016 to determine how the phosphorous was distributed in five different pools or fractions. These fractions were water soluble, salt extractable, iron-bound, mineral, and organic. The first three pools represent phosphorous that can be released by sediment resuspension and anaerobic conditions. Unfortunately, these samples were allowed to dry and an incorrect laboratory method was used so we could not use the results, and they are not presented.
3.3. Statistical Analysis Methods
We divided the lake into regions, based on spatial areas (described below) and used two different statistical tests to determine if the samples in these regions came from a single population or if there were differences in the populations.
We used common statistical and spatial analysis tests [44,45,46,47,48,49]. We performed a chi-square test to determine the likelihood that data in the different lake sections came from difference populations. Specifically, we tested the null hypothesis that all sections have the same average level of phosphorus [43]. We performed a stochastic pairwise nonparametric Tukey analysis [50,51], which compared pairs of samples from all the sets to determine if they differed from each other. Sample pairs were randomly picked. To develop spatial maps of phosphorous extent, we used the Shepard’s interpolation method implemented in the Groundwater Modeling System (GMS) version 10.2 software package (Aquaveo, Provo, UT, USA) [52]. Shepard’s method is an inverse distance weighting approach that includes permeable and absolute barriers [53].
4. Results
4.1. Sampling Results
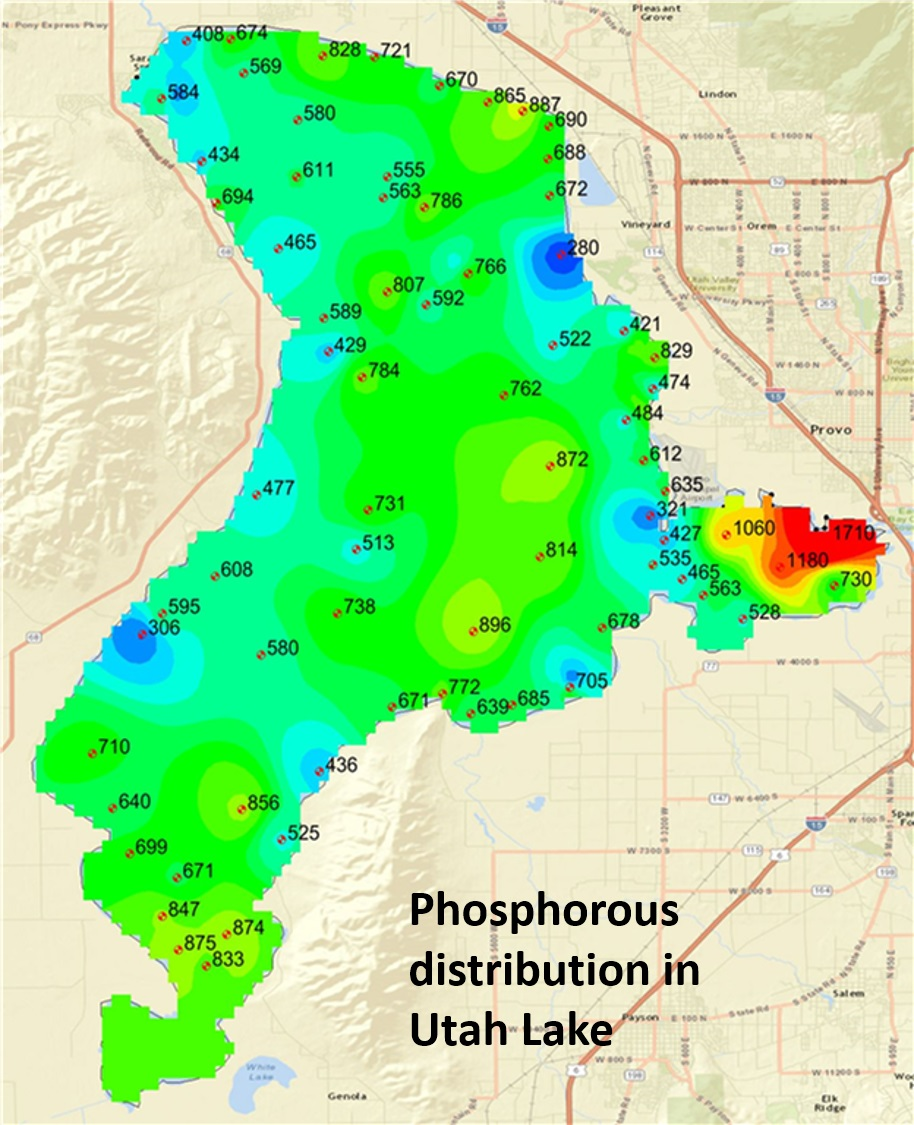
Total phosphorus concentration varied throughout the lake, ranging from 280 to 1710 ppm, with an average value of 666 ppm. Figure 5 shows the results and sampling points. The average total phosphorous was 719 ppm, 604 ppm and 786 ppm for sediments sampled in 2015, 2016, and land samples, respectively. Statistical analysis (below) showed that these values are not significantly different. In addition to population statistics (discussed below), there are some differences that can be explained by physical processes. The samples with significantly low values were all taken in areas of groundwater or spring discharge to Utah Lake. We attribute these significantly lower phosphorous levels to leaching or flushing of phosphorous from the sediment by the groundwater. Groundwater is anoxic and can remove phosphorous in the first three fractions, water-soluble, salt-extractable, and iron-sorbed. The three highest samples were taken from sediments near a corral/feedlot complex with significant animal waste.
4.2. Data Analysis
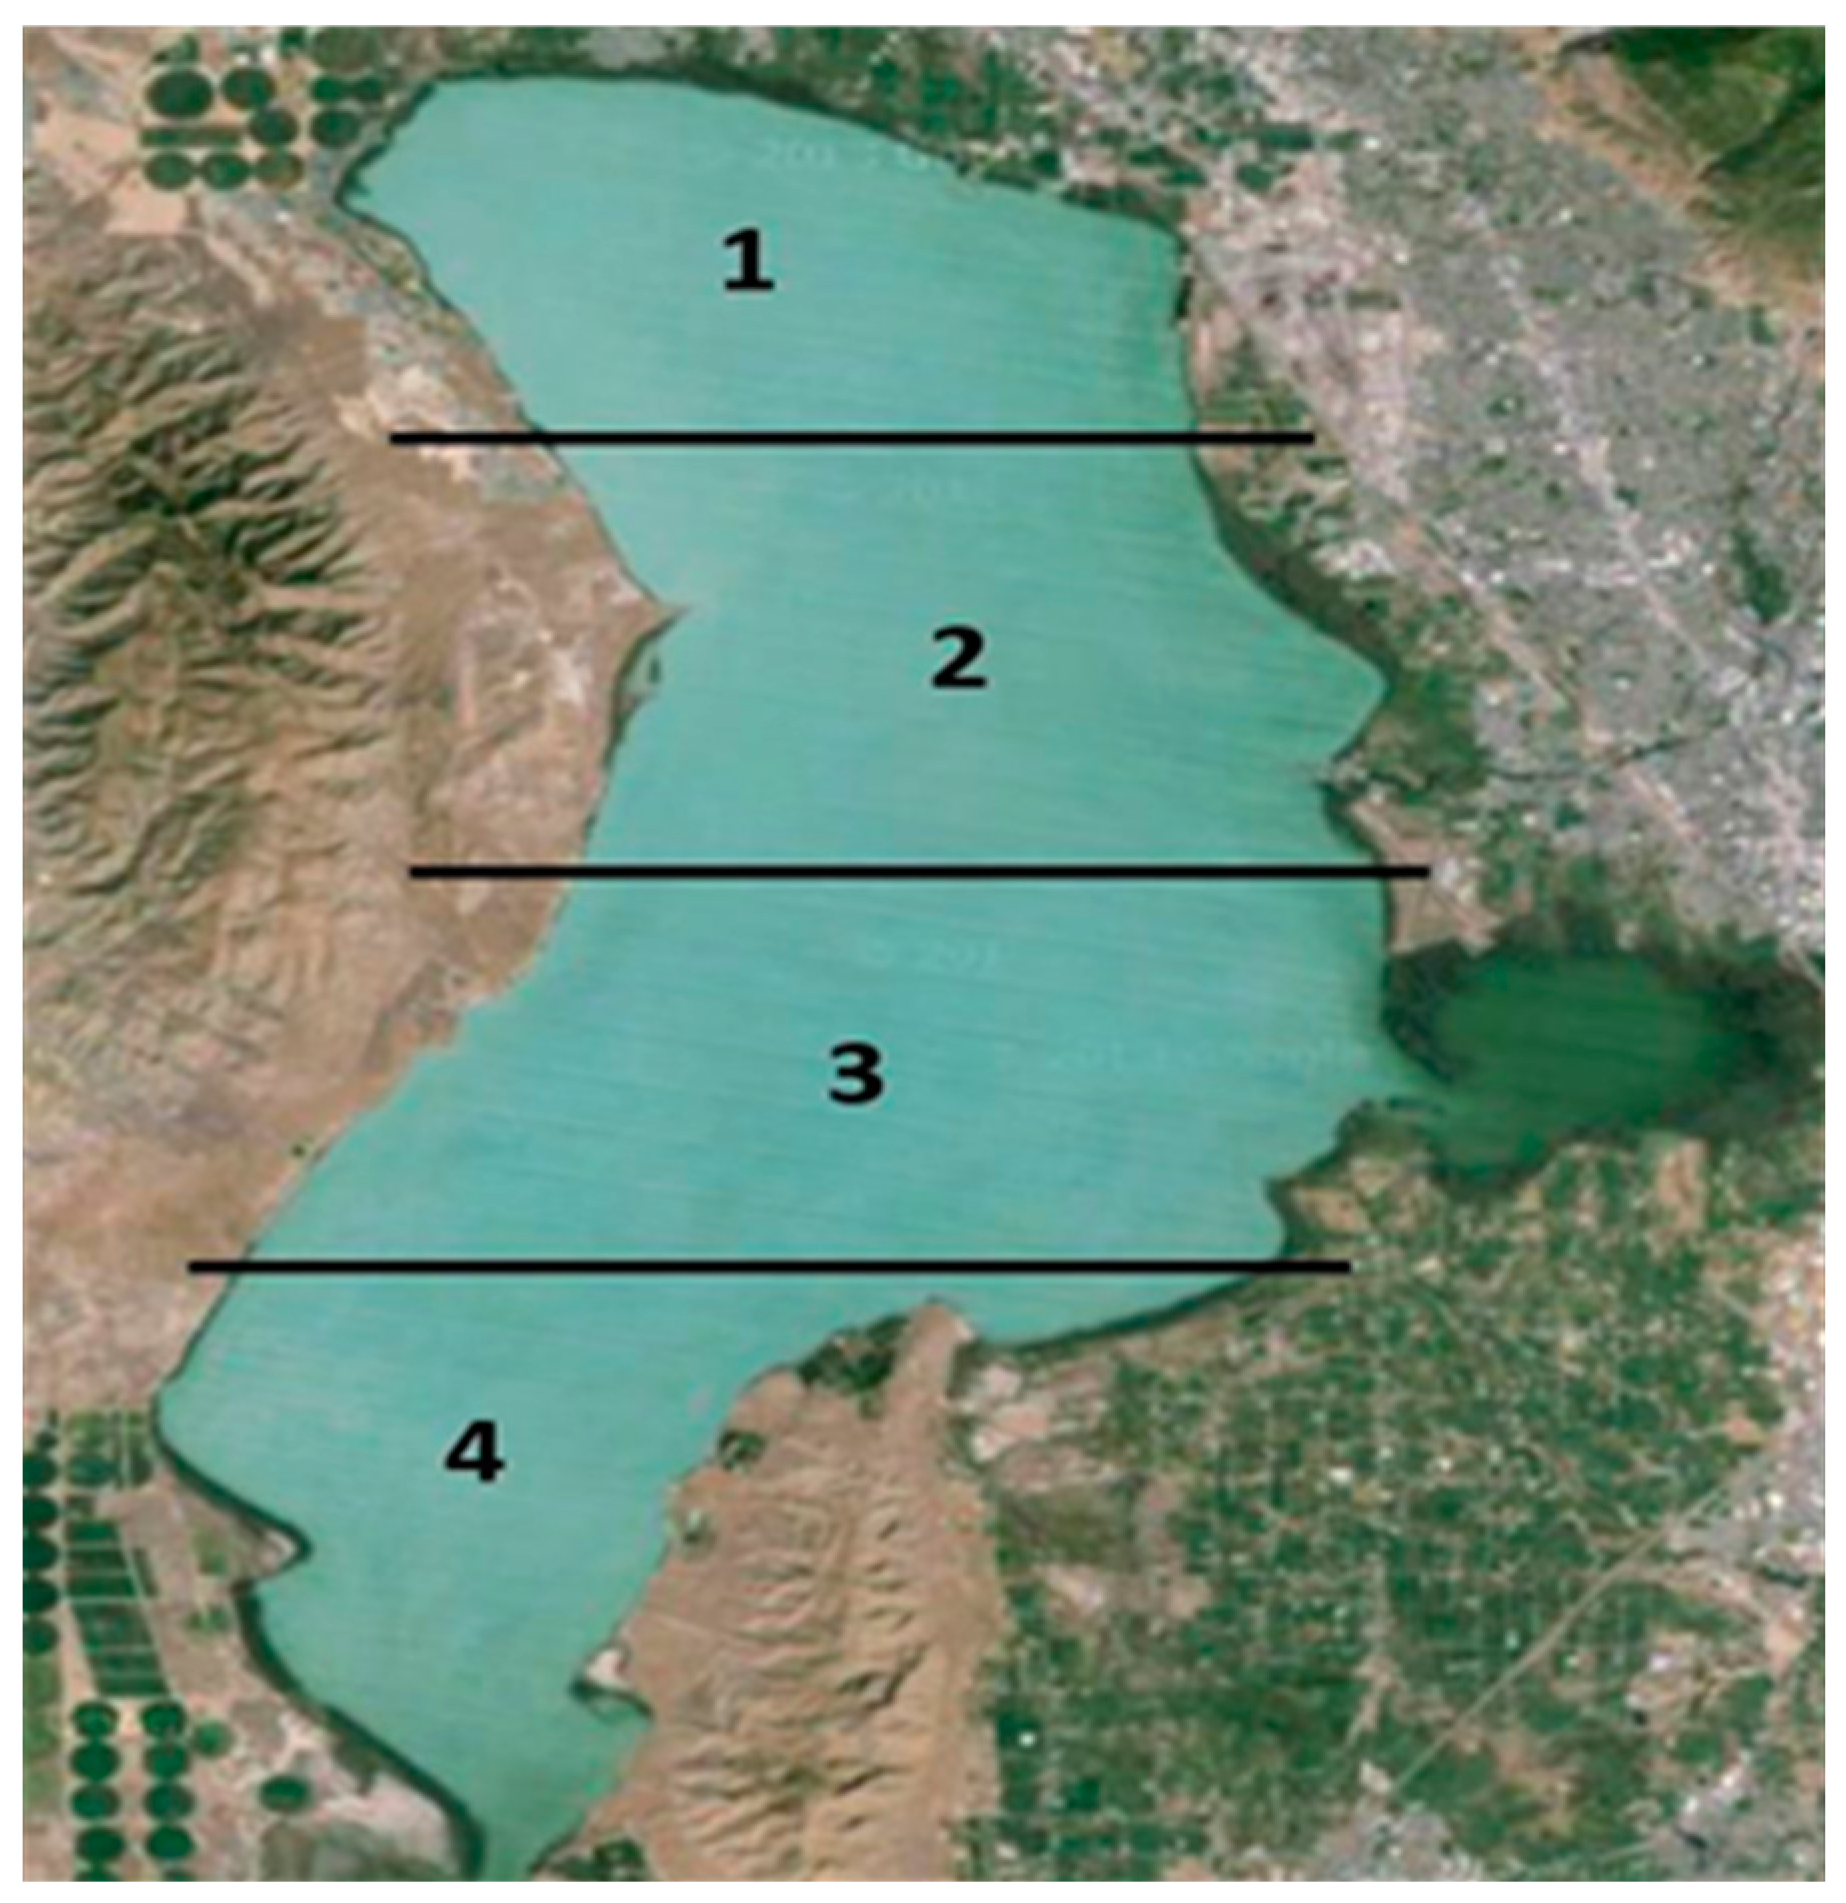
For analysis purposes, we divided the lake horizontally into four sections as shown in Figure 6. These sections each have different dominant factors that could result in differences in phosphorous content. The lower area, labeled 4 in Figure 6, consists of the shallow southern portion and does not contain any significant inflows, there are springs along the eastern shore of this section. Section 3 (Figure 6) includes Hobble Creek large inflow to the lake. The eastern shore, just above the bay, includes areas of seeps and springs. The large bay on the east side of this section is shallow and includes agriculture and feedlots on the lake shore. Section 2 (Figure 6) includes the Provo River, the main inflow to the lake, and contains the outfalls for the Provo and Orem wastewater treatment plants, the largest phosphorous contributors to the reservoir. The eastern shore of this area includes seeps and springs. Section 1 (Figure 6) contains the Jordan River outfall, the only exit point for Utah Lake. This section also has seeps and springs on the northwest shoreline.
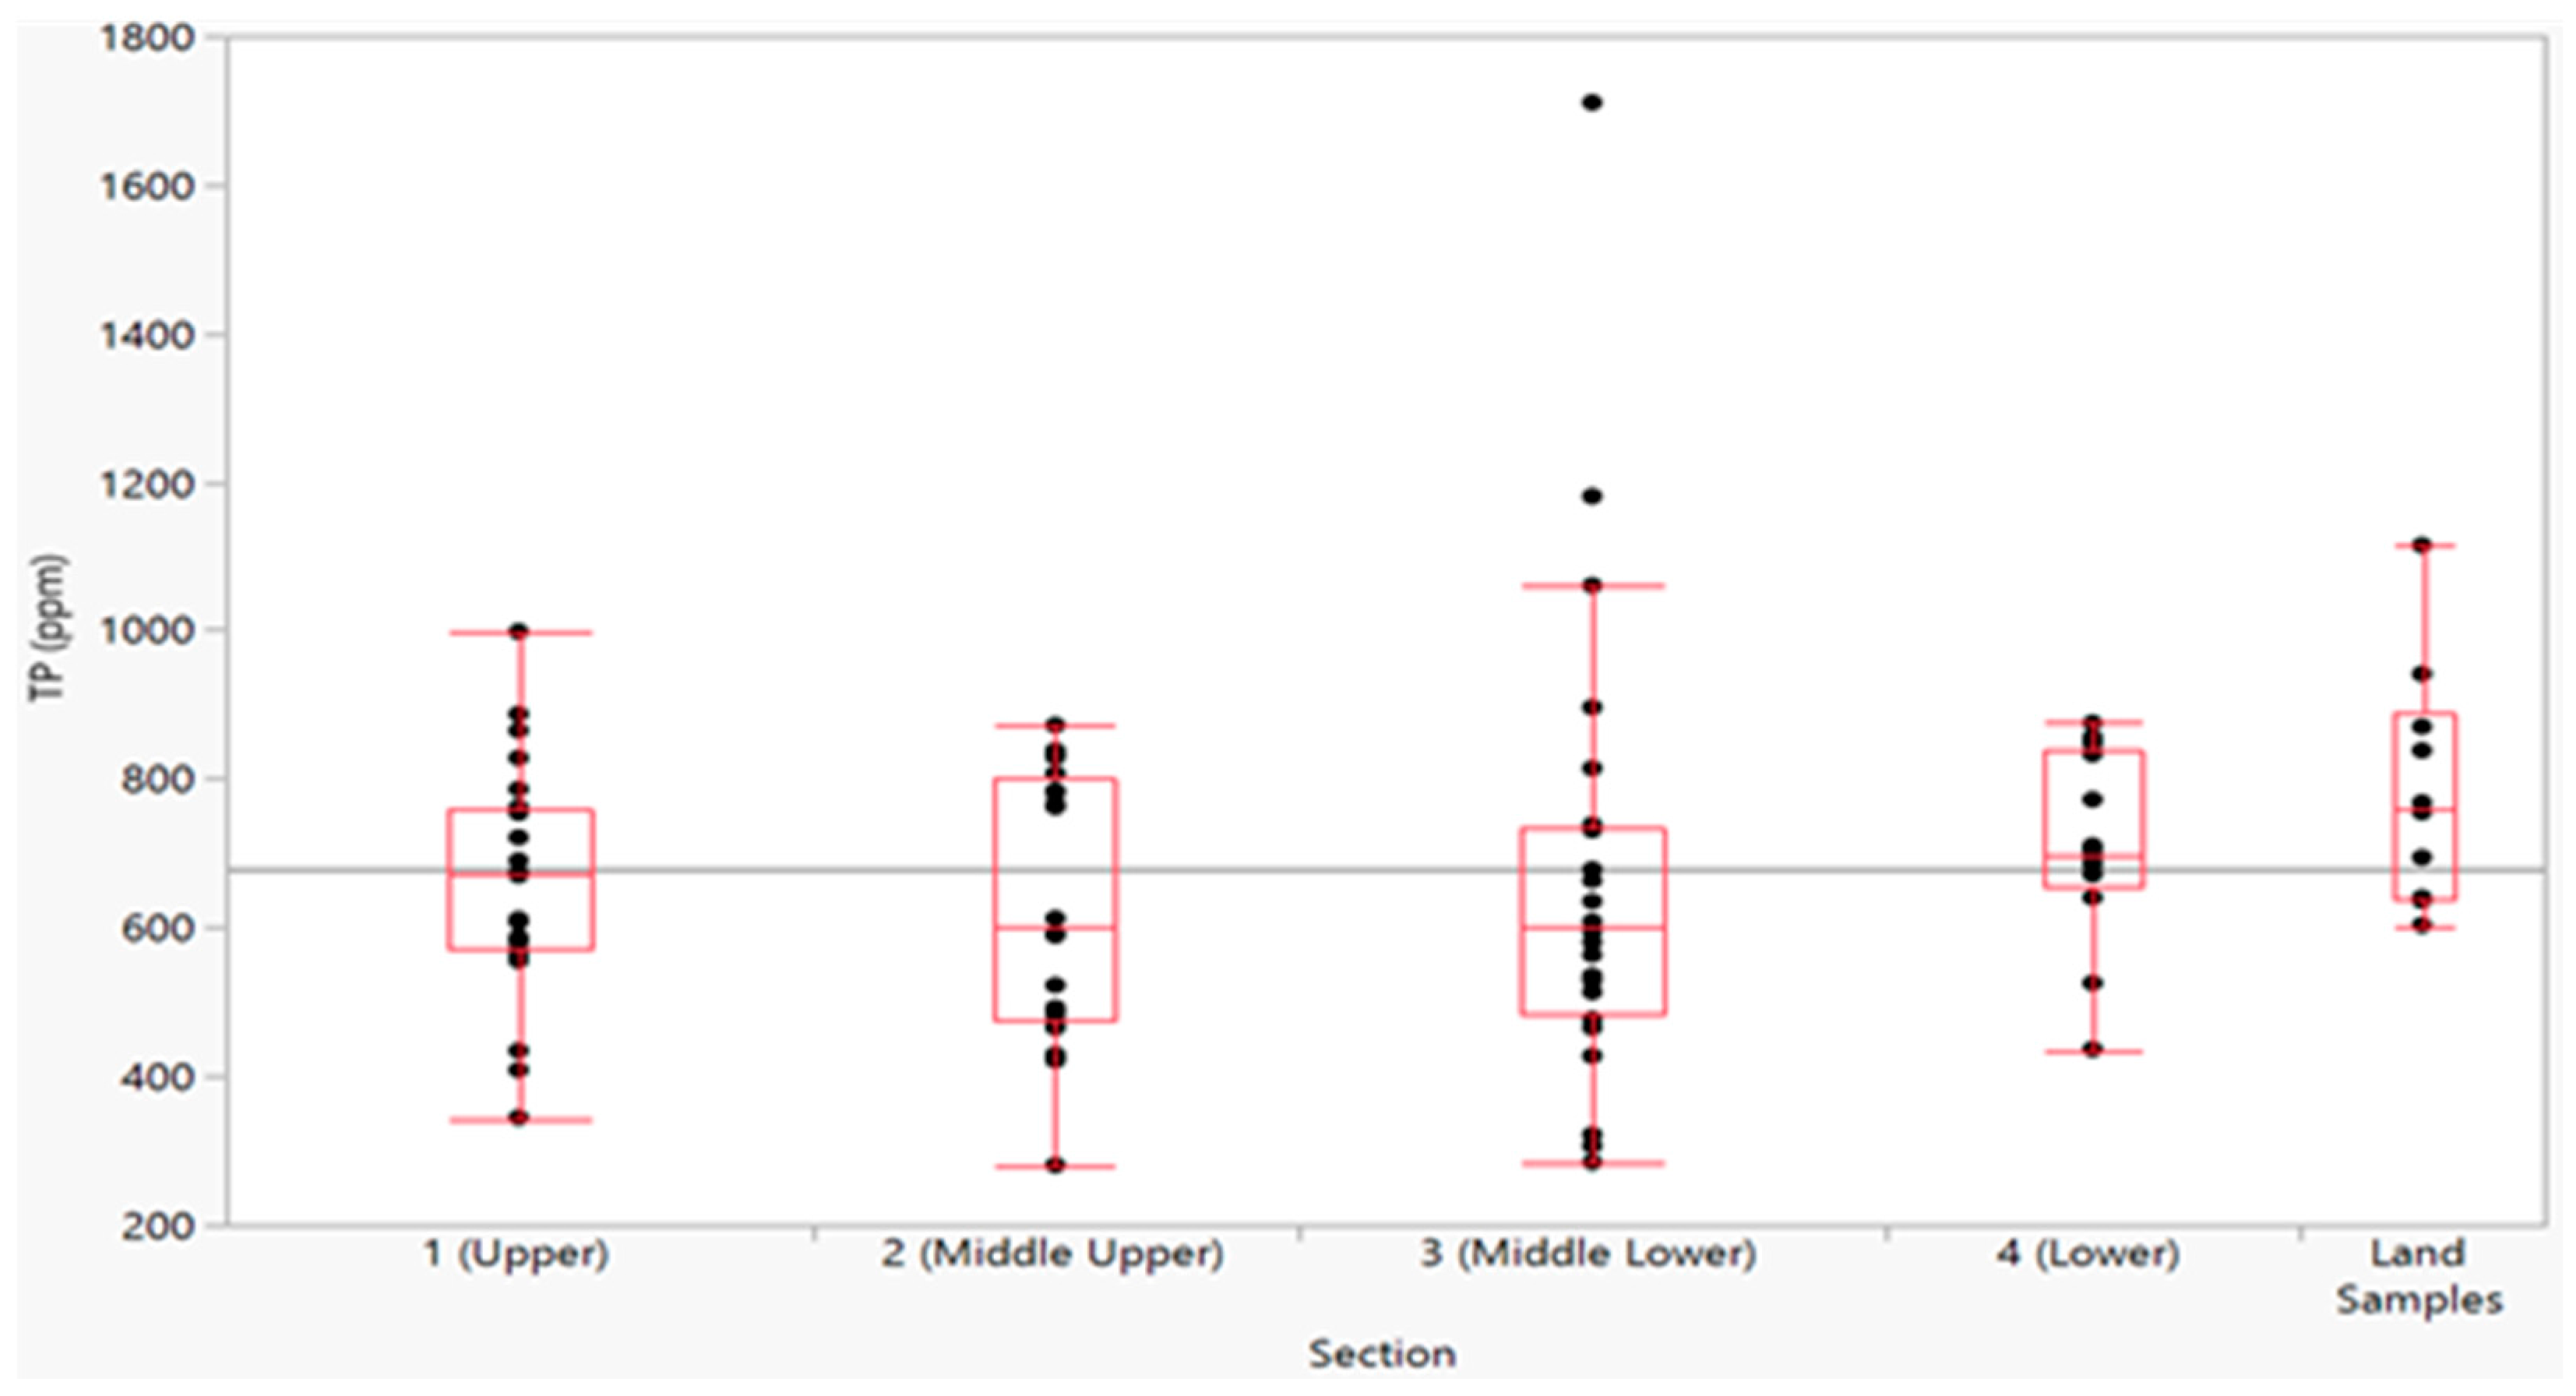
Table 2 presents the descriptive statistics calculated for the samples taken in each section, while Figure 7 presents the data as box plots. The grey line in Figure 7 is the average for the entire data set, and the red line in each box is the average for that section. The red boxes indicate the interquartile range (IQR) and contain half the data. The size of this box is a relative measure of the statistical dispersion in the dataset. The whiskers show data within 1.5 IQR from lower and upper center quartile ranges. Figure 7 shows the data are well grouped, with each section having one to three low values except for the land samples, which do not have low values. With the exception of Section 3, all the data fall within 1.5 IQR of the lower or upper quartiles, indicating low dispersion in the data. Section 3 has high outliers, which we attribute to feedlot runoff (discussed below). We attribute the low values in each section to samples taken in areas of seeps and springs (discussed below). The land section does not contain low values as no samples were taken in seeps or springs or high values as no samples were taken near feedlots or animal yards. Section 4 has the highest average phosphorous concentration along with the highest values for the 1st and 3rd quartiles of all the lake samples, but exhibits the lowest dispersion. This section of the lake is shallow, with little inflow and Figure 7 visually shows that these data closely match the land samples.
We used a chi-square test to determine the likelihood that the data in different sections come from difference populations—that is, if they are different. We constructed the different lake sections and land section, based on some general differences in physical properties, if these different physical properties affect the total phosphorous levels. Then, the chi-squared test should indicate the values are different from each other at some statistically significant level. This allowed us to statistically determine if the sections, including the geologic sediments on the ancient shore, are different from each other.
We tested the null hypothesis that all sections have the same average level of phosphorus. We obtained a p-value of 0.1210, and this is well above the standard confidence level of 0.05 (95%). With a p-value this large, we fail to reject the null hypothesis and cannot state that there are any differences between the different sections. There are no statistically significant differences among the five groups.
The chi-square analysis is a global test, looking at each section compared to the entire data set. Figure 7 seems to show some difference between the various sections. To explore this hypothesis, we performed a pairwise nonparametric Tukey analysis to compare each set of pairs to determine if they differed from each other.
Table 3 presents the Tukey results ordered from least likely to reject the null hypothesis to most likely to reject the null hypothesis—in other words, from least likely to be the same to most likely to be the same. The results show that the differences between the groups are not statistically significant. The sections most likely to be different are the land and Group 2 samples. The p-value for a comparison of these two sections is 0.29, significantly larger than the standard confidence level of 95% (p-value of 0.05). With a p-value of 0.29, we can state that the differences between these two sections, and any of the other pairs, are not statistically significant. We do note that there were only 10 land samples. This small number of samples is most likely the cause of the smaller p-values for the differences of the land samples with the other groups. However, even these smaller values are significantly larger than the p-value for a standard confidence level of 95%. We cannot reject the statement that the groups are the same, and the differences are not statistically different. The small number of samples does increase the uncertainty some. While it would have been beneficial to have more land samples, the focus of the sampling program was on lake sediments. Additional land samples could be addressed in the future but is not as important as evaluating sediment–water flux rates and phosphorous loads from sediment–water interactions, erosion from surface runoff, and short-range dust transport.
4.3. Geostatistical Analysis
We noted spatial patterns in the data. While statistical analysis showed no difference among the four lake sections and the land, there are areas of the lake that present different spatial distributions. For example, all the high values in Section 3 are spatially correlated and located in Provo Bay. To analyze the spatial distribution patterns and attempt to assign these differences to various physical processes, we used geostatistical models to create phosphorous distribution maps.
We created these maps using all the total phosphorus data using the Shepard’s interpolation method implemented in the GMS version 10.2 software package [52]. These spatial maps show phosphorus distribution patterns in and around the lake. We created two maps:
These maps show the distribution of phosphorous in Utah Lake sediments and how that distribution relates to distributions in the shore sediments.
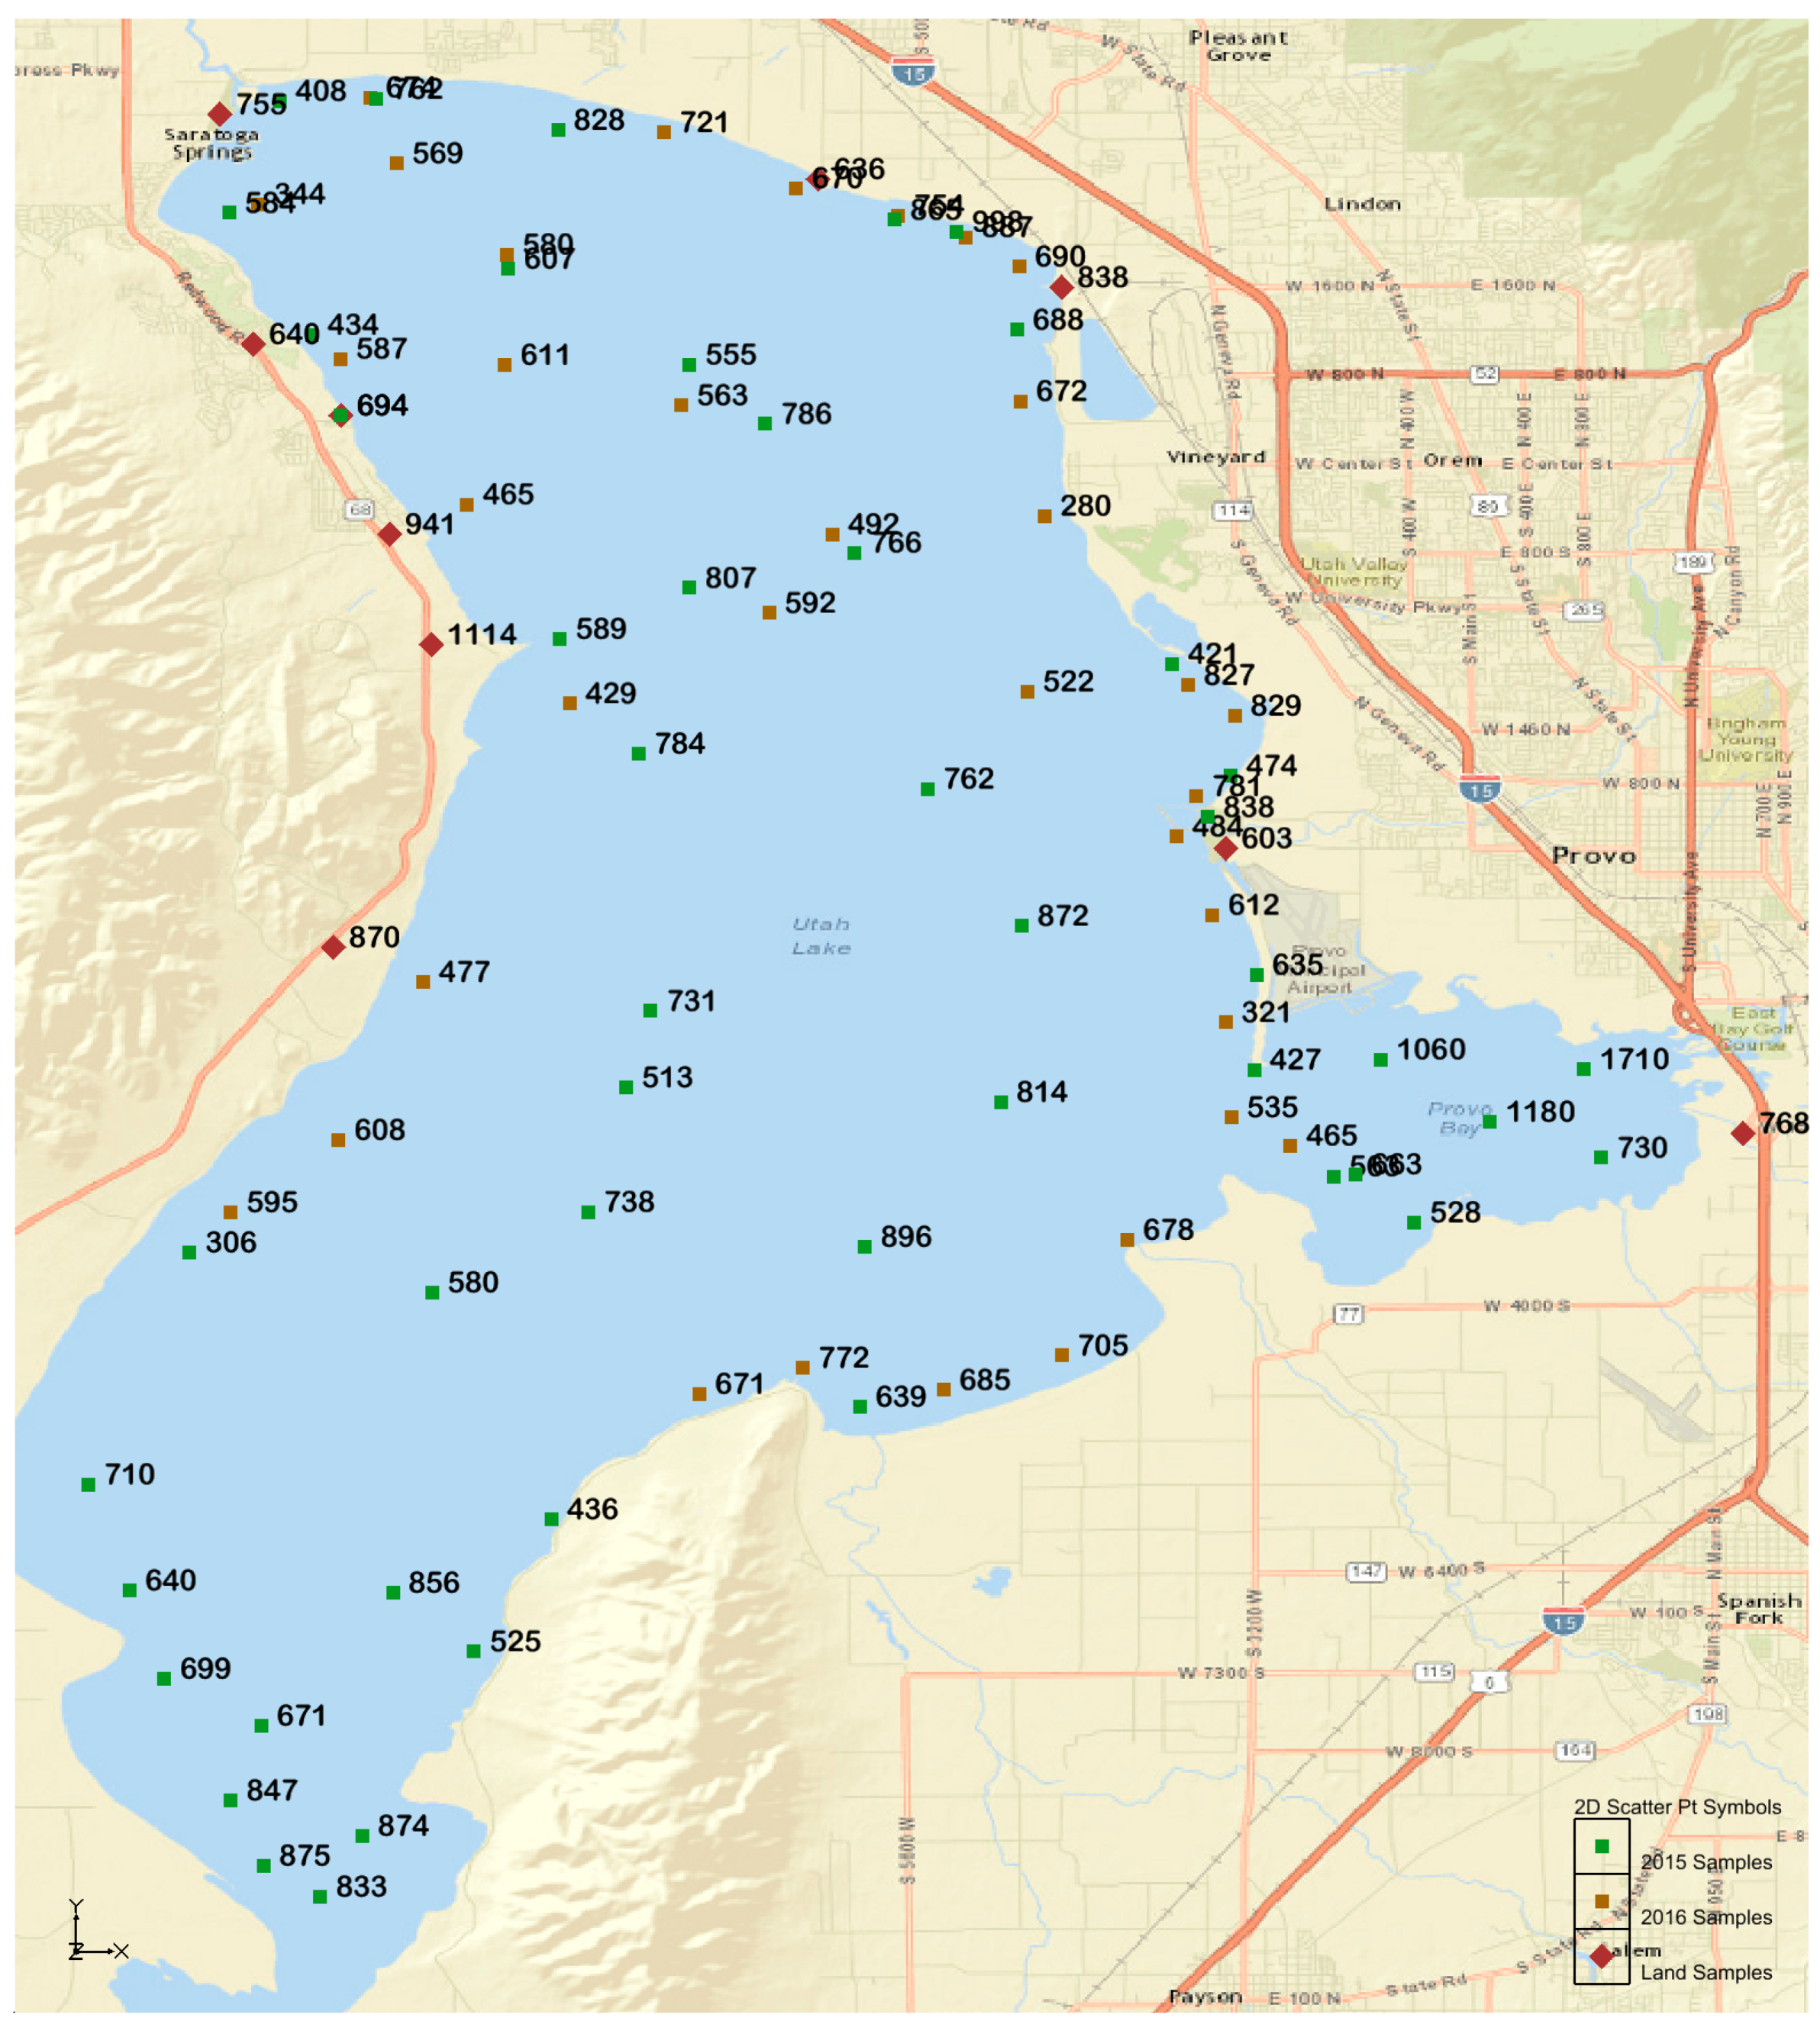
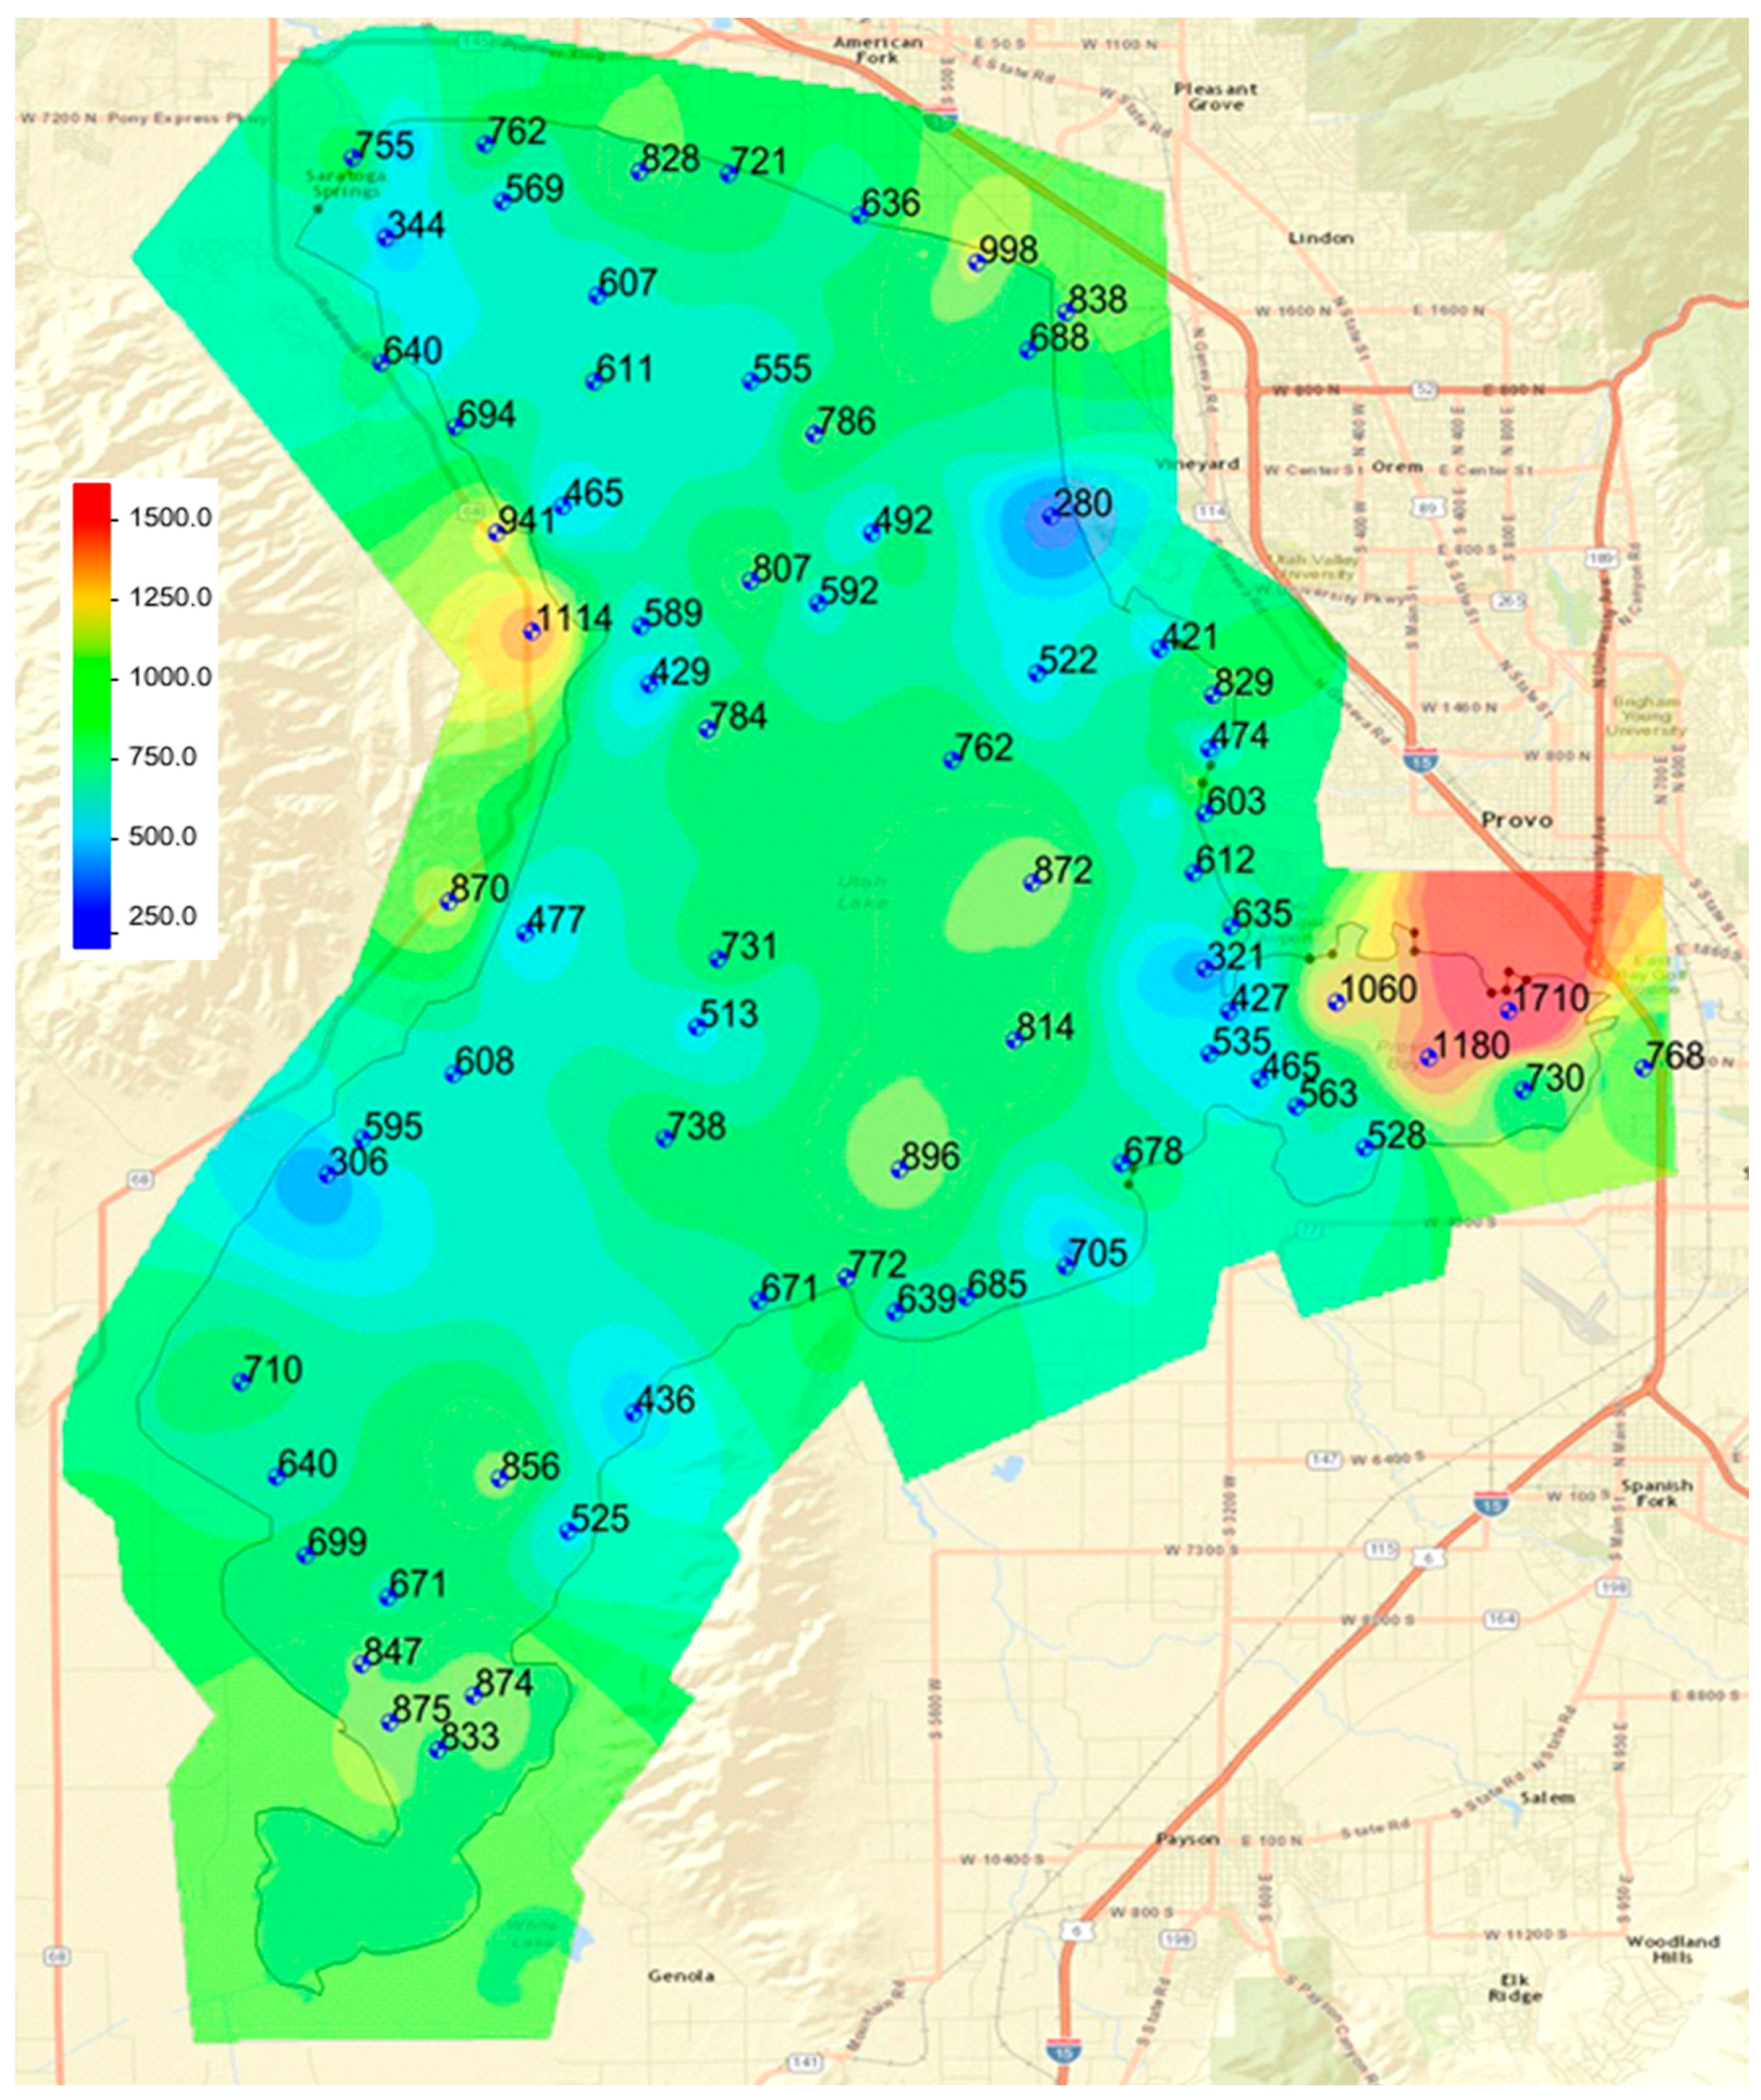
We visually evaluated the two maps to determine if it appeared that the spatial phosphorous distribution inside the lake was visually different from the distribution on the shore—that is, did the distribution appear to be continuous or did there appear to be some form of discontinuity between the lake distribution and the shore samples? Figure 9, which is based on both in-lake and on-shore samples, shows that there are no discontinuities at the shore line. In fact, the phosphorous distribution seems to naturally extend from the lake to the geologic sediments on-shore with no visible anomalies. This provides additional evidence to support the hypothesis that recent processes have had a minimal impact on the spatial distribution of phosphorous in current or geologic lake sediment phosphorous levels.
Figure 8 and Figure 9 do present some interesting spatial patterns. First, note the location of the samples representing the low values in the lake. One sample with a value of 280 ppm, located on the eastern shore in Section 2 (middle north), was taken because this is the approximate location of the inflow from the Orem Wastewater treatment plant, and we expected this area to have elevated phosphorous levels. As noted above, the locations of all the low-level phosphorous samples occur in areas of Utah Lake known to have seeps and springs. By observation, we found the physical properties of these samples were also different. Most lake sediment samples felt like clay and were smooth and sticky. The samples with low phosphorous levels were more granular and had a sandy feel. During sampling in 2015, these sample locations were in Utah Lake; however, in 2016, Utah Lake was at historic low levels and some of these sample locations were exposed. We visited the sample location near the outfall of the Orem Treatment plant, and found that seeps and springs were extensive in this area. We attribute low phosphorous levels in these samples to ground water removing the water-soluble, salt-extractable, and iron-sorbed phosphorous fractions.
Figure 7 and Figure 8 also show areas with higher than normal phosphorous concentrations, the main one being Provo Bay on the southeastern portion of the lake. Both maps show sediments with very high phosphorous concentrations on the north shore of Provo Bay. This bay is a shallow wetland and contains a feedlot on the east side of the bay on the banks of Hobble Creek and receives the influent from the Provo City WWTP in the northeast corner. These locations are very near where the highest samples are located. This feedlot or corral has existed for at least 40 years and probably dates to early settlement in the area, which is the late 1800s. The State of Utah calculated phosphorous loads from the Provo and Orem city WWTPs as 71.6 and 79.3 tons/year, respectively. These are the two largest phosphorous sources for the lake.
We attribute the high phosphorous levels in this area to runoff from this cattle operation. Input from the Provo City WWTP most likely also impacts these sediment levels, but we do not see similar high values near the discharge of the Orem City WWTP, which releases a similar phosphorous load. There is one land sample that has a high phosphorous concentration located on the western shore of the lake. It is likely that this sample was also impacted by livestock operations, though we do not have evidence to that effect. While we have no direct evidence, there are some faint indications of historic corrals and fences in the area.
The spatial distribution of phosphorous concentrations indicates that patterns extend from the current in-lake sediments to the historic lakebed geologic sediments. This implies that the current lake processes are having a minimal impact on phosphorous contents. The distributions indicate spatial correlation among the samples with high phosphorous content. We attribute these high values to livestock operations. This is based on significant evidence in Provo Bay and general inference for the sample on the eastern shore.
5. Phosphorous Release Experiment
5.1. Lab Experiments of Phosphorus Release
To examine the potential for sediment phosphorous contributions to the water column, we conducted two lab experiments. We designed these experiments to provide indications of potential phosphorus contributions and do not present these experiments as good models for actual lake processes. However, they do indicate that lake sediments could be a significant source of phosphorous to the water column.
For these experiments, we used a shore sediment sample and a lake sediment sample. Both samples were stored in Ziploc® bags in a refrigerator for about a week prior to the experiment. The samples were divided into four lake samples and four shore samples, and placed into eight beakers. We covered the samples with two inches of water, four samples with distilled water containing salt (two sediment and two shore samples) and four samples with Provo River water (two sediment and two shore samples). At this point, there were four bottles for each sediment type, two with distilled-salt water and two with Provo River water. After adding the water, we manually mixed one of each combination once every three days. The distilled salt water experiment continued for a period of one month, while the Provo River water experiment extended for two weeks. The other beakers were not disturbed during these periods. At the end of the experiments, we took water samples, filtered them through a 0.45 micron filter, and measured phosphorous levels using an ICP (Thermo Scientific iCAP™ 7400 ICP-OES Analyzer) at the BYU Environmental Lab. The lake water was meant to be an analog for the water column in Utah Lake. The salt water was to determine if salt-extractable phosphorous was available. We did not try to replicate reducing conditions. Shaking the bottles was an analog for sediment resuspension. Again, we were not trying to model actual lake conditions, only determine if these release mechanisms were feasible and determine approximate magnitudes.
5.2. Lab Experiments Results
Table 4 shows the results of the experiments. All results are in mg/L. Water samples were taken after the suspended sediment was allowed to settle for one to two days, then filtered on a 0.45 μm filter. This was done so we only measured the dissolved phosphorous content, not phosphorous sorbed on suspended solids. The initial concentration of phosphorus in Provo River water was 0.05 mg/L before being added to the beakers.
Several trends are apparent from these results, more phosphorous is released with salt water than with Provo River water, and more phosphorous is released from the land samples than from the lake sediment samples. In addition, as expected, resuspended (shaken) sediments released more phosphorous. The salt water releases significantly more phosphorous from the sediment than the Provo river water. For the on-shore sediments, the salt water extracts about three times as much phosphorous as the Provo River water. For the lake sediments, this ranges from 10 times for the non-disturbed samples to 100 times for the shaken samples.
Significantly more research is required to determine the actual mechanisms responsible for these differences; however, we can hypothesize as to the processes that could cause these results. Salt water could extract both the phosphorous in the interstitial water and the ion-sorbed phosphorous, while the Provo River water probably does not extract much of the ion-sorbed material. Shaking the beakers simulates mechanical resuspension of the sediments. Without resuspension, even if phosphorus is released into the pore water of the sample, it must diffuse through the sediment to the sediment surface in the beaker to be released. Shaking eliminates the need for the diffusion.
For the lake sediments with Provo River water, there was essentially no difference between the shaken and non-disturbed samples. While the water concentration is lower, it is still about five times that of the river water alone. We hypothesize that the interstitial water in the lake sediments quickly comes to equilibrium with the Provo River water. This could indicate that the water-soluble fraction is smaller in the current lake sediments. Even though one beaker was not shaken, the sediments were mixed with the water when the beaker was initially filled. The beakers were not air tight, and there was significant head space in the beakers. We do not think the water was ever anaerobic, meaning that even if the sediments became anaerobic, the phosphorous would have precipitated with the iron when it came into contact with the oxidizing conditions in the water above the sediments.
The land samples with Provo River water had significantly higher phosphorous concentrations than the lake sediments. We attribute this to significantly higher concentrations of water-dissolvable phosphorous in this soil. The agitated land sample had about twice the concentration of the non-shaken sample. We think this may be due to diffusion in the non-shaken sample.
The salt water samples showed significantly higher phosphorous levels. The values for the shaken land and sediment samples were similar, 14 and 19 ppm, respectfully. The non-shaken land and sediment samples were 7.7 and 3.0 ppm, respectfully. This implies that there is a significant ion-bound (or sorbed) fraction of phosphorous available in both the land and lake samples and that the amounts are similar. Again, we attribute the smaller concentrations in the non-shaken samples to diffusion, which limits the release.
6. Discussion
The sampling results show that Utah Lake sediments have large concentrations of total phosphorus with an average total phosphorous concentration of 666 ppm. The concentrations in historic geologic sediments are similar, but higher, with an average total phosphorous concentration of 786 ppm. Simple laboratory experiments implied significant amounts of this phosphorous exists in water soluble or salt-extractable (sorbed) fractions that are easily released to the water column.
Phosphorous balance results show that Utah Lake acts as a phosphorous sink, and significantly more phosphorous enters the lake than leaves. However, statistical analysis shows that phosphorous content in different areas of the lake are not significantly different from each other. More importantly, phosphorous levels in current lake sediments are not statistically different than total phosphorous levels for geologic sediments (land samples). This implies that phosphorous inflows to Utah Lake, though large, may not be significant compared to existing phosphorous levels. Additional studies would be required to determine how inflows affect water column phosphorous levels and fluxes from sediments. The northeast portion of Provo Bay is the location of the three highest samples. They have total phosphorous content of 1060, 1180, and 1710 ppm, with the highest value near the inlets of Mill Race Creek, which receives water from the Provo WWTP and Hobble Creek, which has a small feedlot near the shore of the bay. Samples near the outfall of the Orem City WWTP did not have similar high values. The sample nearest the Orem City plant outfall (shown on upper east shore of Utah Lake in Figure 8 and Figure 9) had one of the lower values of total phosphorous at 280 ppm. However, we attribute this low value to an area of groundwater seeps and springs into the lake.
We showed, using statistical analysis and spatial maps, that geologic sediments and current sediments have total phosphorus levels that are not statistically different from each other. Thus, the current phosphorous load coming into the lake does not seem to significantly impact sediment phosphorus levels and may not have large impacts on phosphorous concentrations in the water column. As noted, this may not be the case in the northeast corner of Provo Bay where it appears that anthropogenic sources have had impacts on sediment phosphorous concentrations.
The water bottle experiments were not quantitative in regards to how reservoir and land sediments affect water column phosphorous levels, but they do show that lake sediments are potential phosphorous reservoirs for the water column. These experiments imply that the concentration of phosphorous in Utah Lake waters could potentially be partially governed by water–sediment interactions, rather than tributary inflows. The bottle tests of the historic sediments indicate that overland flow and the associated erosion and short-distance dust transport could be a significant contributor to phosphorous inflows. Interestingly, the amounts of phosphorous in the sediments from erosion are similar to existing lake sediments but seem to have more phosphorous in the fractions that are easier water extractable. We did not run an anaerobic experiment to evaluate the iron-sorbed fraction, but we expect another large reservoir of phosphorous in this fraction.
This research documents the large phosphorous reservoirs in both current and historic lake sediments and highlights the need to determine actual phosphorous loadings to Utah Lake from these sources. This work demonstrates the need for additional research to understand and quantify the processes and rates of phosphorous flows into and out of the sediments, and quantify loads from surface runoff and associated erosion and atmospheric loadings.
7. Conclusions
This report characterizes phosphorous levels in current and geologic Utah Lake sediments. Statistically, the geologic lake shore sediments are not different from current lake sediments. This implies that, while Utah Lake accepts a significant phosphorous inflow and acts as a phosphorous sink, this probably does not significantly affect sediment phosphorous levels and that these sediments could have significant impact on water column phosphorous concentrations.
Simple bottle tests showed that the phosphorous in the sediments could easily be released to the water column. These facts, combined with Utah Lake physical properties (shallow, carp content, thick sediments, and wind) that cause significant sediment resuspension, increase the probability that the phosphorus in the sediment significantly impacts lake water quality.
Phosphorus release from sediment occurs under very complicated processes under many different conditions. Thus, more knowledge is needed to develop a conclusion for the phosphorus release mechanism in Utah Lake and the relative impacts of historic high phosphorus levels in Lake Sediments versus the current high inflow loadings.
Future work should better quantify sediment release rates, provide a better understanding of how the phosphorous is stored in the sediments, and improve geochemical models for how phosphorous moves between sediments and the water column. It should evaluate loads from overland flow and associated erosion and from short-distance dust transport. This work is needed, as historic lake sediments on the shoreline have high phosphorous concentrations, which are based on our simple bottle experiments, may be easily transferred to the water column.
The main management issue to determine how these large phosphorus concentrations in lake and historic sediments affect phosphorous concentrations in the water column and the relationship with external loads. Research needs to evaluate if this a buffered system, in regards to phosphorous, where changing external loads have little impact on the lake phosphorous levels. Research needs to quantify the potential and actual total phosphorous flux from the sediments to the water column and what factors influence those flux rates. Example research topics include quantifying fluxes from sediment resuspension due to wind, boat, and carp actions along with quantifying potential releases from anaerobic conditions. These fluxes need to be estimated and compared to known loadings for the lake. Current estimates show that Utah Lake is a sink for phosphorous, with over 60% of the estimated load remaining in the lake. This implies that phosphorous geochemistry of the sediment–water system needs to be better understood. Research questions such as “are the sediments and water column in near equilibrium conditions” need to be answered. This is important because if this system is in a near equilibrium state, the phosphorous reservoir in the sediment is very large and external loadings may have little impact on water phosphorous concentrations in the lake. Research is required to determine if phosphorous concentrations in the water column are relatively stable and buffered by the sediment phosphorous reservoir or closely tied to phosphorous inflows.
Acknowledgments
This study was funded by internal BYU research funds.
Author Contributions
Gustavious P. Williams and A. Woodruff Miller conceived and designed the field collection; Hani Yousef Abu-Hmeidan performed the collections; Gustavious P. Williams and Hani Yousef Abu-Hmeidan analyzed the data; Gustavious P. Williams and Hani Yousef Abu-Hmeidan wrote the paper with input and reviews by A. Woodruff Miller.
Conflicts of Interest
The authors declare no conflict of interest.
References
- PSOMAS; SWCA. Utah Lake TMDL: Pollutant Loading Assessment & Designated Beneficial Use Impairment Assessment—Final Draft; State of Utah Division of Water Quality: Salt Lake City, UT, USA, 2007; p. 88.
- Utah Divison of Water Quality. Utah Lake Water Quality Work Plan 2015–2019; Utah Division of Water Quality: Salt Lake City, UT, USA, 2016; p. 88.
- Girty, G.H. The Fauna of the Phosphate Beds of the Park City Formation in Idaho, Wyoming, and Utah; US Government Printing Office: Washington, DC, USA, 1910.
- Maughan, E.K. Phosphoria Formation (Permian) and Its Resource Significance in the Western Interior, USA; Pangea: Global Environments and Resources—Memoir 17; American Institute of Petroleum Geologists: Tulsa, OK, USA, 1994. [Google Scholar]
- McKelvey, V.; Williams, J.S.; Sheldon, R.; Cressman, E.; Cheney, T.; Swanson, R. Summary description of Phosphoria, Park city, and Shedhorn formations in western phosphate field. AAPG Bull. 1956, 40, 2826–2863. [Google Scholar]
- Wardlaw, B.R.; Collinson, J.W. Paleontology and deposition of the Phosphoria Formation. Rocky Mt. Geol. 1986, 24, 107–142. [Google Scholar]
- Knudsen, A.C.; Gunter, M.E. Sedimentary phosphorites—An example: Phosphoria Formation, Southeastern Idaho, USA. Rev. Miner. Geochem. 2002, 48, 363–389. [Google Scholar] [CrossRef]
- Shinozuka, K.i.; Chiwa, M.; Tayasu, I.; Yoshimizu, C.; Otsuki, K.; Kume, A. Differences in stream water nitrate concentrations between a nitrogen-saturated upland forest and a downstream mixed land use river basin. Hydrology 2017, 4, 43. [Google Scholar] [CrossRef]
- Carpenter, S.R. Eutrophication of aquatic ecosystems: Bistability and soil phosphorus. Proc. Natl. Acad. Sci. USA 2005, 102, 10002–10005. [Google Scholar] [CrossRef] [PubMed]
- Vollenweider, R. Möglichkeiten und grenzen elementarer modelle der stoffbilanz von seen. Arch. Hydrobiol. 1969, 66, 1–36. [Google Scholar]
- Boström, B.; Andersen, J.M.; Fleischer, S.; Jansson, M. Exchange of phosphorus across the sediment–water interface. Hydrobiologia 1988, 170, 229–244. [Google Scholar] [CrossRef]
- Søndergaard, M.; Jensen, J.P.; Jeppesen, E. Role of sediment and internal loading of phosphorus in shallow lakes. Hydrobiologia 2003, 506, 135–145. [Google Scholar] [CrossRef]
- Mayer, L.M.; Gloss, S.P. Buffering of silica and phosphate in a turbid river. Limnol. Oceanogr. 1980, 25, 12–22. [Google Scholar] [CrossRef]
- Jin, X.; Wang, S.; Pang, Y.; Wu, F.C. Phosphorus fractions and the effect of pH on the phosphorus release of the sediments from different trophic areas in Taihu Lake, China. Environ. Pollut. 2006, 139, 288–295. [Google Scholar] [CrossRef] [PubMed]
- Andersen, J.M. Nitrogen and phosphorus budgets and the role of sediments in six shallow Danish Lakes. Arch. Hydrobiol. 1974, 74, 259–277. [Google Scholar]
- Kim, L.-H.; Choi, E.; Stenstrom, M.K. Sediment characteristics, phosphorus types and phosphorus release rates between river and lake sediments. Chemosphere 2003, 50, 53–61. [Google Scholar] [CrossRef]
- Hupfer, M.; Lewandowski, J. Oxygen controls the phosphorus release from lake sediments–A long-lasting paradigm in limnology. Int. Rev. Hydrobiol. 2008, 93, 415–432. [Google Scholar] [CrossRef]
- Lijklema, L. Role of iron in the exchange of phosphate between water and sediments. In Interactions between Sediments and Fresh Water, Proceedings of the International Symposium, Amsterdam, The Netherlands, 6–10 September 1976; Springer: Dordrecht, The Netherlands, 1977. [Google Scholar]
- Mortimer, C.H. The exchange of dissolved substances between mud and water in lakes. J. Ecol. 1941, 29, 280–329. [Google Scholar] [CrossRef]
- Einsele, W. Uber chemische und kolloidchemische vorgange in eisen phosphat-systemen unter limnochemischen und limnogeologischen gesichtspunkten. Arch. Hydrolbiol. 1936, 33, 361–387. [Google Scholar]
- Ruban, V.; Demare, D. Sediment phosphorus and internal phosphate flux in the hydroelectric reservoir of Bort-Les-Orgues, France. In Oceans, Rivers and Lakes: Energy and Substance Transfers at Interfaces; Springer: Dordrecht, The Netherlands, 1998; pp. 349–359. [Google Scholar]
- Petticrew, E.L.; Arocena, J.M. Evaluation of iron-phosphate as a source of internal lake phosphorus loadings. Sci. Total Environ. 2001, 266, 87–93. [Google Scholar] [CrossRef]
- Jensen, H.S.; Kristensen, P.; Jeppesen, E.; Skytthe, A. Iron: Phosphorus ratio in surface sediment as an indicator of phosphate release from aerobic sediments in shallow lakes. Hydrobiologia 1992, 235, 731–743. [Google Scholar] [CrossRef]
- Caraco, N.; Cole, J.; Likens, G. Sulfate control of phosphorus availability in lakes. In Proceedings of the Third International Workshop on Phosphorus in Sediments; Springer: Dordrecht, The Netherlands, 1993; pp. 275–280. [Google Scholar]
- Gunnars, A.; Blomqvist, S.; Johansson, P.; Andersson, C. Formation of Fe (III) oxyhydroxide colloids in freshwater and brackish seawater, with incorporation of phosphate and calcium. Geochim. Cosmochim. Acta 2002, 66, 745–758. [Google Scholar] [CrossRef]
- Huang, Q.; Wang, Z.; Wang, C.; Wang, S.; Jin, X. Phosphorus release in response to pH variation in the lake sedimentswith different ratios of iron-bound P to calcium-bound P. Chem. Speciat. Bioavailab. 2005, 17, 55–61. [Google Scholar] [CrossRef]
- Grantham, M.C.; Dove, P.M.; Dichristina, T.J. Microbially catalyzed dissolution of iron and aluminum oxyhydroxide mineral surface coatings. Geochim. Cosmochim. Acta 1997, 61, 4467–4477. [Google Scholar] [CrossRef]
- Gächter, R.; Meyer, J.S. The role of microorganisms in mobilization and fixation of phosphorus in sediments. In Proceedings of the Third International Workshop on Phosphorus in Sediments; Springer: Dordrecht, The Netherlands, 1993; pp. 103–121. [Google Scholar]
- Holdren, G.C.; Armstrong, D.E. Factors affecting phosphorus release from intact lake sediment cores. Environ. Sci. Technol. 1980, 14, 79–87. [Google Scholar] [CrossRef]
- Jensen, H.S.; Andersen, F.O. Importance of temperature, nitrate, and pH for phosphate release from aerobic sediments of four shallow, eutrophic lakes. Limnol. Oceanogr. 1992, 37, 577–589. [Google Scholar] [CrossRef]
- Koski-Vähälä, J.; Hartikainen, H. Assessment of the risk of phosphorus loading due to resuspended sediment. J. Environ. Qual. 2001, 30, 960–966. [Google Scholar] [CrossRef] [PubMed]
- Lijklema, L.; Aalderink, R.; Blom, G.; Van Duin, E. Sediment Transport in Shallow Lakes, Two Case Studies Related to Eutrophication; Food and Agriculture Organization of the United Nations: New York, NY, USA, 1994. [Google Scholar]
- Kristensen, P.; Søndergaard, M.; Jeppesen, E. Resuspension in a shallow eutrophic lake. Hydrobiologia 1992, 228, 101–109. [Google Scholar] [CrossRef]
- Sondergaard, M.; Kristensen, P.; Jeppesen, E. Phosphorus release from resuspended sediment in the shallow and wind-exposed lake Arreso, Denmark. Hydrobiologia 1992, 228, 91–99. [Google Scholar] [CrossRef]
- Jeppesen, E.; Jensen, J.P.; Søndergaard, M.; Lauridsen, T. Trophic dynamics in turbid and clearwater lakes with special emphasis on the role of zooplankton for water clarity. In Shallow Lakes’ 98; Walz, N., Nixdorf, B., Eds.; Springer: Dordrecht, The Netherlands, 1999; Volume 143, pp. 217–231. [Google Scholar]
- Niemistö, J.P.; Horppila, J. The contribution of ice cover to sediment resuspension in a shallow temperate lake: Possible effects of climate change on internal nutrient loading. J. Environ. Qual. 2007, 36, 1318–1323. [Google Scholar] [CrossRef] [PubMed]
- Fan, C.-X.; Zhang, L.; Qu, W.-C. Lake sediment resuspension and caused phosphate release-a simulation study. J. Environ. Sci. 2001, 13, 406–410. [Google Scholar]
- Horns, D. Utah Lake Comprehensive Management Plan Resource Document; Department of Earth Science, Utah Valley State College: Orem, UT, USA, 2005. [Google Scholar]
- Cameron, F.K. The water of Utah Lake. J. Am. Chem. Soc. 1905, 27, 113–116. [Google Scholar] [CrossRef]
- Brimhall, W.H.; Merritt, L.B. Geology of Utah Lake: Implications for resource management. Gt. Basin Nat. Mem. 1981, 5, 24–42. [Google Scholar]
- Utah Agriculture Automated Geographic Reference Center. Available online: https://gis.utah.gov/data/ (accessed on 10 July 2017).
- Penn, M.R.; Auer, M.T.; Doerr, S.M.; Driscoll, C.T.; Brooks, C.M.; Effler, S.W. Seasonality in phosphorus release rates from the sediments of a hypereutrophic lake under a matrix of pH and redox conditions. Can. J. Fish. Aquat. Sci. 2000, 57, 1033–1041. [Google Scholar] [CrossRef]
- Merrell, P.D. Utah Lake Sediment Phosphorus Analysis; Brigham Young University: Provo, UT, USA, 2015. [Google Scholar]
- Daniel, S.; Gabiri, G.; Kirimi, F.; Glasner, B.; Näschen, K.; Leemhuis, C.; Steinbach, S.; Mtei, K. Spatial distribution of soil hydrological properties in the kilombero floodplain, Tanzania. Hydrology 2017, 4, 57. [Google Scholar] [CrossRef]
- Hember, R.; Coops, N.; Spittlehouse, D. Spatial and temporal variability of potential evaporation across north american forests. Hydrology 2017, 4, 5. [Google Scholar] [CrossRef]
- Givati, A.; Gochis, D.; Rummler, T.; Kunstmann, H. Comparing one-way and two-way coupled hydrometeorological forecasting systems for flood forecasting in the mediterranean region. Hydrology 2016, 3, 19. [Google Scholar] [CrossRef]
- Thakur, J. Optimizing groundwater monitoring networks using integrated statistical and geostatistical approaches. Hydrology 2015, 2, 148–175. [Google Scholar] [CrossRef]
- Viossanges, M.; Pavelic, P.; Rebelo, L.-M.; Lacombe, G.; Sotoukee, T. Regional mapping of groundwater resources in data-scarce regions: The case of laos. Hydrology 2018, 5, 2. [Google Scholar] [CrossRef]
- Dixon, W.J.; Massey Frank, J. Introduction to Statistical Analysis; McGraw-Hill Book Company, Inc.: New York, NY, USA, 1950. [Google Scholar]
- Carmer, S.G.; Swanson, M.R. An evaluation of ten pairwise multiple comparison procedures by Monte Carlo methods. J. Am. Stat. Assoc. 1973, 68, 66–74. [Google Scholar] [CrossRef]
- Jaccard, J.; Becker, M.A.; Wood, G. Pairwise multiple comparison procedures: A review. Psychol. Bull. 1984, 96, 589. [Google Scholar] [CrossRef]
- Owen, S.J.; Jones, N.L.; Holland, J.P. A comprehensive modeling environment for the simulation of groundwater flow and transport. Eng. Comput. 1996, 12, 235–242. [Google Scholar] [CrossRef]
- Shepard, D. A two-dimensional interpolation function for irregularly-spaced data. In Proceedings of the 1968 23rd ACM National Conference, New York, NY, USA, 27–29 August 1968; pp. 517–524. [Google Scholar]
Figure 1.
Utah Lake located in northern Utah and is a large, freshwater lake with a surface area of about 150 square miles.
Figure 1.
Utah Lake located in northern Utah and is a large, freshwater lake with a surface area of about 150 square miles.

Figure 2.
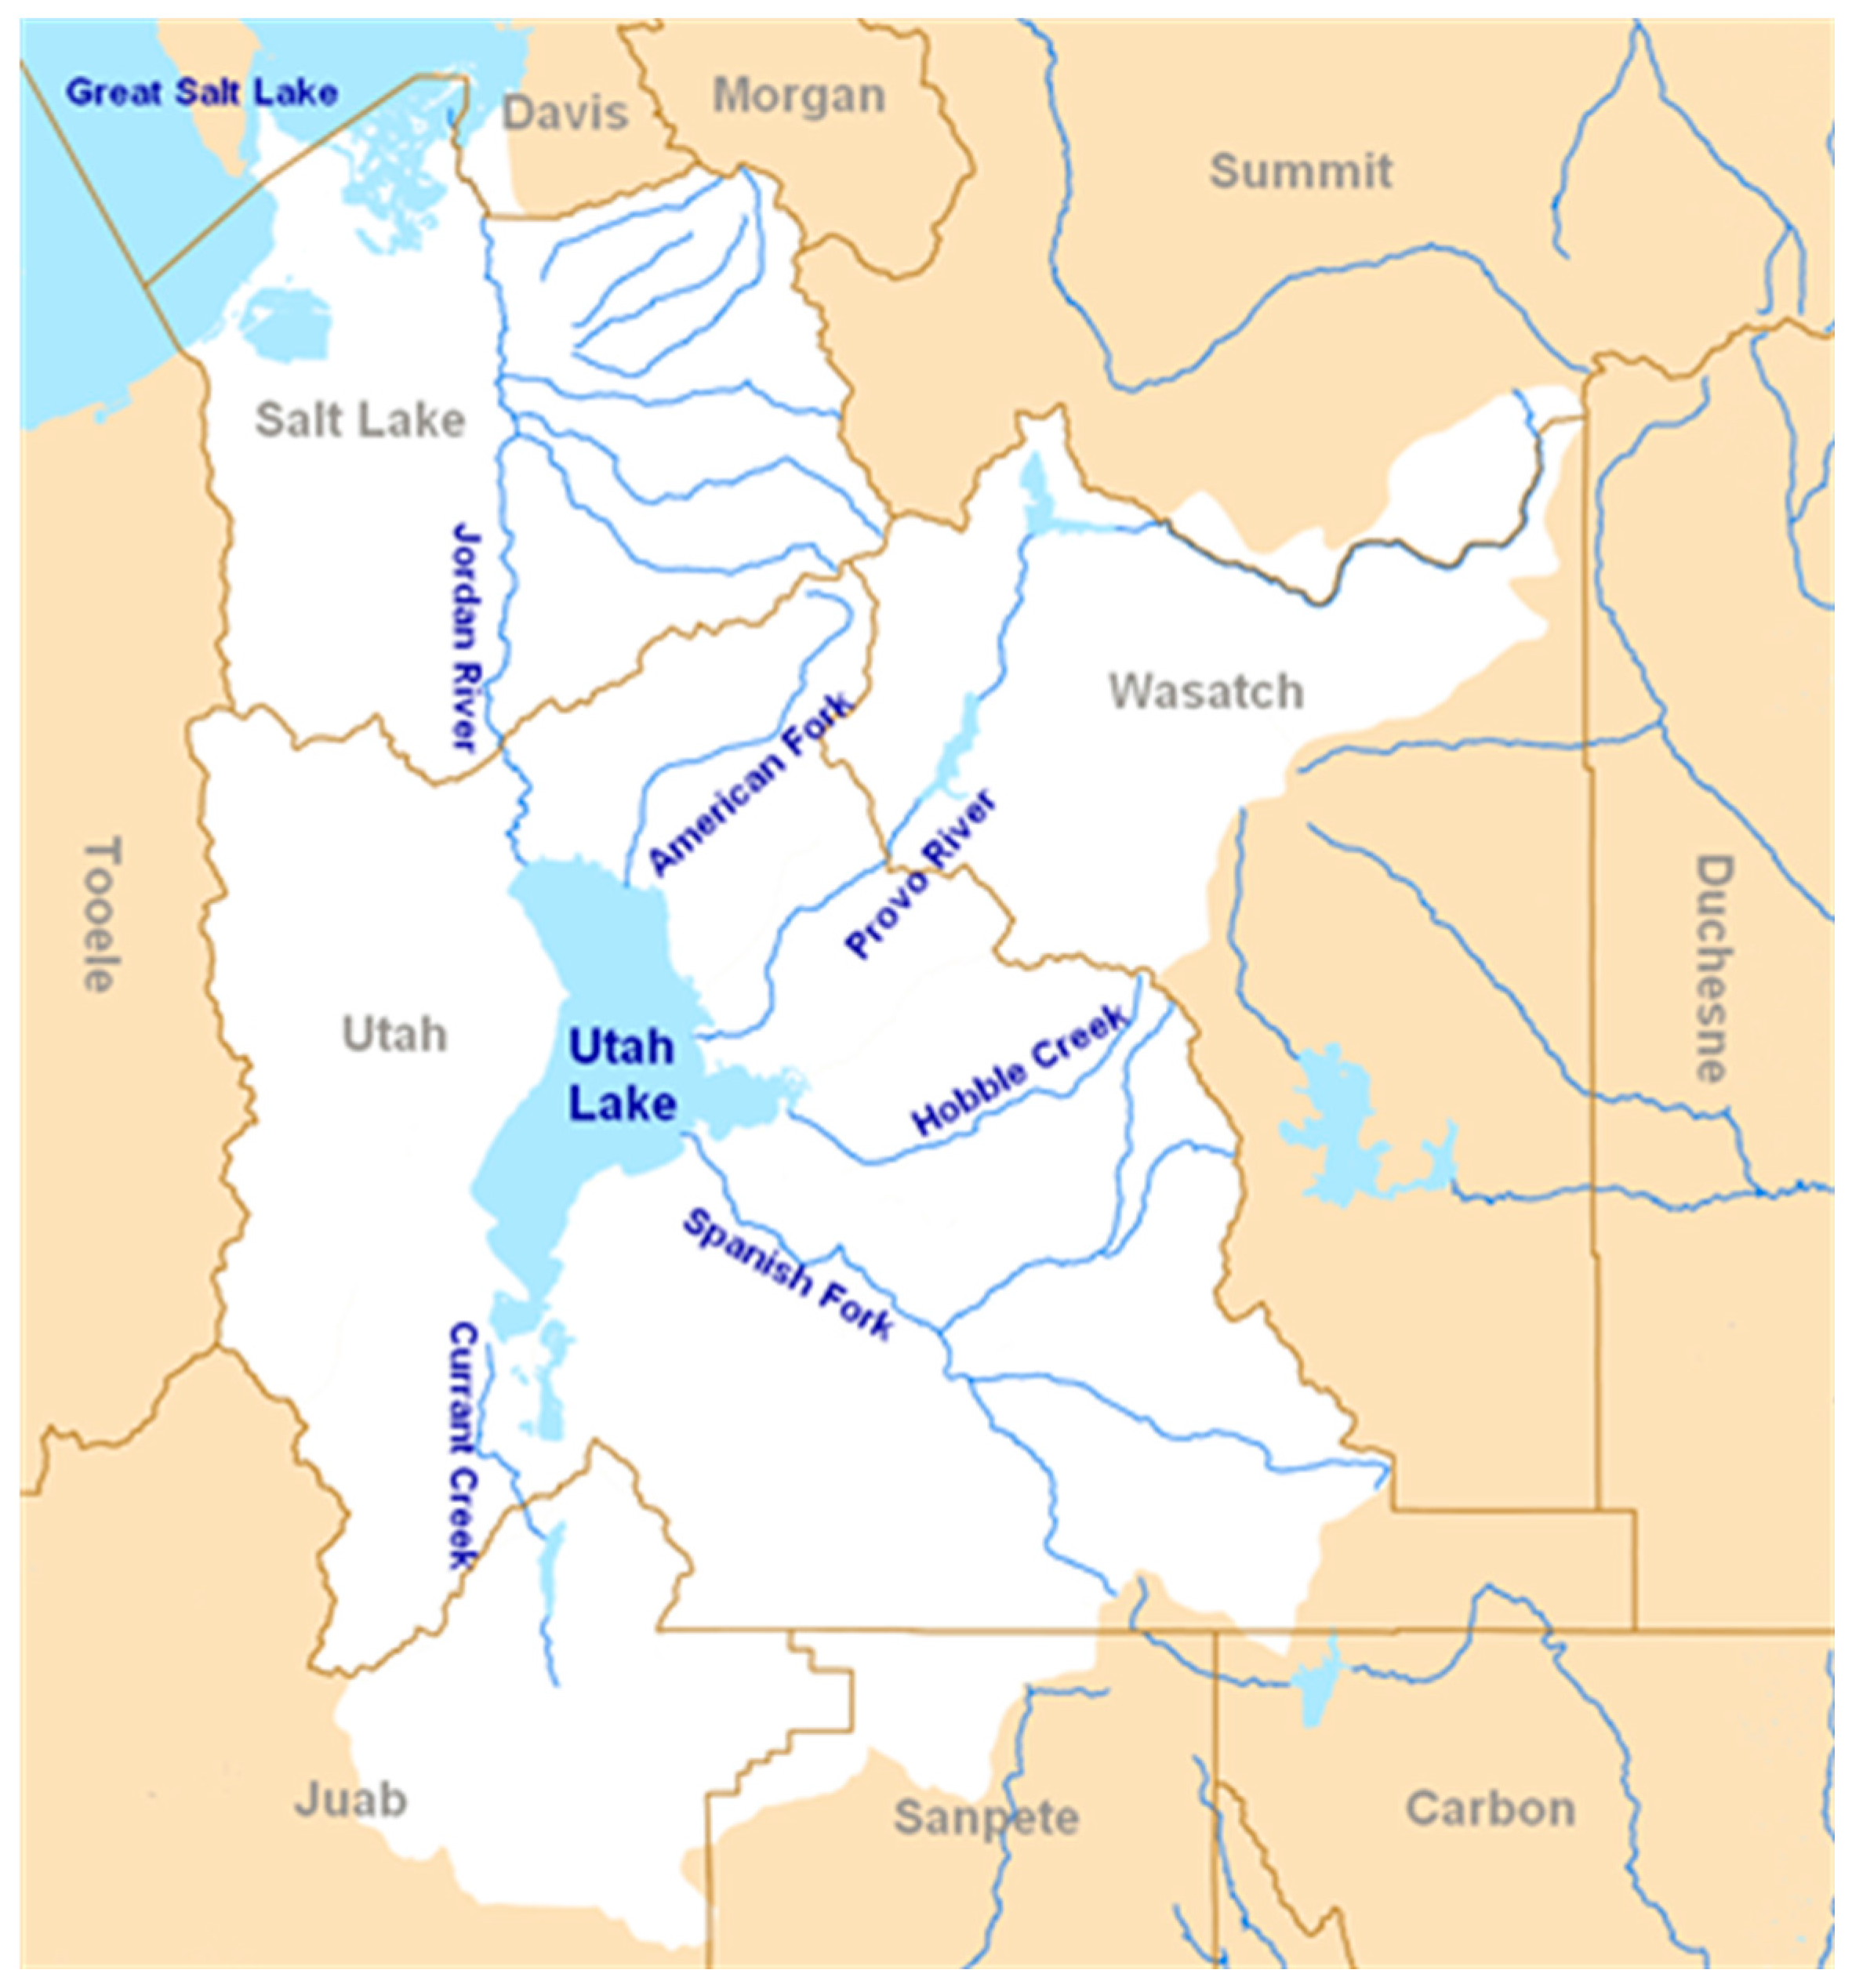
The Jordan River basin that contains both the inflows and outflows for Utah Lake (figure created and data from [41]).
Figure 2.
The Jordan River basin that contains both the inflows and outflows for Utah Lake (figure created and data from [41]).

Figure 3.
Summary of the total phosphorus load and exports from Utah Lake [1].
Figure 3.
Summary of the total phosphorus load and exports from Utah Lake [1].

Figure 4.
A map showing the location of the sediment and soil sample points, the figure indicates sediment points sampled in 2015 as blue squares, sediment points sampled in 2016 as red circles, and samples taken on the shore as black triangles, which represent geologic lake sediments.
Figure 4.
A map showing the location of the sediment and soil sample points, the figure indicates sediment points sampled in 2015 as blue squares, sediment points sampled in 2016 as red circles, and samples taken on the shore as black triangles, which represent geologic lake sediments.

Figure 5.
Total phosphorus in ppm at each sample point. Some points between 2015 and 2016 are close and labels overlap. The map is not to scale.
Figure 5.
Total phosphorus in ppm at each sample point. Some points between 2015 and 2016 are close and labels overlap. The map is not to scale.

Figure 6.
The four sections used for analysis of the Utah Lake sediment data.

Figure 7.
Box plots of total phosphorus measurements for each of the sections shown in Figure 6 and land samples.
Figure 7.
Box plots of total phosphorus measurements for each of the sections shown in Figure 6 and land samples.

Figure 8.
A geostatistical Model showing total phosphorous distribution in Utah Lake developed by interpolating among the sediment sample points inside the Lake. The colors represent the interpolated values, the numbers indicate total phosphorous concentrations at the sample points. Both the colors in the legend and the numerical values represent total phosphorous amounts in ppm, and the map is not to scale.

Figure 9.
A geostatistical Model showing total phosphorous distribution in Utah Lake developed by interpolating among the sediment sample points inside the Lake as well as samples taken on the shore presenting historic lake sediments before any anthropogenic phosphorous sources. The colors represent the interpolated values, the numbers indicate total phosphorous concentrations at the sample points. Both the colors in the legend and the numerical values represent total phosphorous amounts in ppm, and the map is not to scale. This map shows that the total phosphorous distribution appears to be continuous from the current lake sediments to the historic sediments. This indicates that total phosphorous levels historically are similar to current values.


Table 1.
Hydrologic summary of Utah Lake.
| Tributary | Avg. Flow (Acre-Feet/Year) | Outfall | Avg. Flow (Acre-Feet/Year) |
|---|---|---|---|
| Provo River | +151,000 | Evaporation | −349,800 |
| Spanish Fork River | +99,700 | Jordan River | −428,200 |
| Benjamin Slough | +36,700 | ||
| Other Inflows | +134,200 | ||
| Total Inflow | +829,300 | Total Outflow | −778,000 |
Table 2.
Statistical summary for samples from each of the four lake sections and from the land area.
Table 2.
Statistical summary for samples from each of the four lake sections and from the land area.
| Section | # of Samples | Avg. (ppm) | Standard Deviation (Std) |
|---|---|---|---|
| 1 (Upper) | 24 | 660 | 150 |
| 2 (Middle Upper) | 20 | 631 | 174 |
| 3 (Middle Lower) | 24 | 668 | 304 |
| 4 (Lower) | 17 | 714 | 118 |
| Land Samples | 10 | 786 | 151 |
Table 3.
Statistical summary of difference tests among the areas.
| Area | Area | Difference | Std Err of Diff. | p-Value |
|---|---|---|---|---|
| Land | 2 (Mid Upper) | 154.6 | 78.7 | 0.29 |
| Land | 1 (Upper) | 126.0 | 76.5 | 0.47 |
| Land | 3 (Mid Lower) | 101.0 | 77.0 | 0.68 |
| 4 (Lower) | 2 (Mid Upper) | 82.3 | 67.0 | 0.73 |
| Land | 4 (Lower) | 72.3 | 81.0 | 0.90 |
| 4 (Lower) | 1 (Upper) | 73.8 | 64.4 | 0.92 |
| 3 (Mid Lower) | 2 (Mid Upper) | 53.6 | 62.1 | 0.91 |
| 4 (Lower) | 3 (Mid Lower) | 28.7 | 65.0 | 0.99 |
| 1 (Upper) | 2 (Mid Upper) | 28.6 | 61.5 | 0.99 |
| 3 (Mid Lower) | 1 (Upper) | 25.0 | 59.3 | 0.99 |
Table 4.
Laboratory experimental results.
| Solution Type | Total Phosphorous (mg/L) | |||
|---|---|---|---|---|
| Land Soil Not Shaken | Land Soil Shaken | Lake Sediment Not Shaken | Lake Sediment Shaken | |
| Provo River Water | 2.60 | 5.10 | 0.24 | 0.24 |
| Distilled Water and Salt | 7.70 | 14.0 | 3.00 | 19.0 |
© 2018 by the authors. Licensee MDPI, Basel, Switzerland. This article is an open access article distributed under the terms and conditions of the Creative Commons Attribution (CC BY) license (http://creativecommons.org/licenses/by/4.0/).
Share and Cite
MDPI and ACS Style
Abu-Hmeidan, H.Y.; Williams, G.P.; Miller, A.W. Characterizing Total Phosphorus in Current and Geologic Utah Lake Sediments: Implications for Water Quality Management Issues. Hydrology 2018, 5, 8. https://doi.org/10.3390/hydrology5010008
AMA Style
Abu-Hmeidan HY, Williams GP, Miller AW. Characterizing Total Phosphorus in Current and Geologic Utah Lake Sediments: Implications for Water Quality Management Issues. Hydrology. 2018; 5(1):8. https://doi.org/10.3390/hydrology5010008
Chicago/Turabian StyleAbu-Hmeidan, Hani Yousef, Gustavious P. Williams, and A. Woodruff Miller. 2018. "Characterizing Total Phosphorus in Current and Geologic Utah Lake Sediments: Implications for Water Quality Management Issues" Hydrology 5, no. 1: 8. https://doi.org/10.3390/hydrology5010008
Note that from the first issue of 2016, this journal uses article numbers instead of page numbers. See further details here.