Article

Assessment and Spatial Planning for Peatland Conservation and Restoration: Europe’s Trans-Border Neman River Basin as a Case Study

1
Institute of Forest Biology and Silviculture, Faculty of Forest Science and Ecology, Vytautas Magnus University, Studentu 13, LT-53362 Akademija, 44248 Kaunas, Lithuania
2
Faculty of Civil Engineering and Environmental Sciences, Bialystok University of Technology, Wiejska 45 E, 15-351 Bialystok, Poland
3
Institute of Environmental Engineering, Warsaw University of Life Sciences-SGGW, Nowoursynowska 166, 02-999 Warsaw, Poland
4
Foundation for Peatlands Restoration and Conservation, Zirmunu 58-59, LT-09100 Vilnius, Lithuania
5
Lithuanian Fund for Nature, Algirdo 22-3, LT-03218 Vilnius, Lithuania
6
Institute of Botany, Nature Research Centre, Žaliųjų Ežerų 49, LT-12200 Vilnius, Lithuania
7
Michael Succow Foundation, Partner in the Greifswald Mire Centre, Ellernholzstrasse 1/3, 17489 Greifswald, Germany
8
Shirshov Institute of Oceanology, Russian Academy of Sciences, 36, Nahimovskiy Prospekt, 117997 Moscow, Russia
9
Experimental Plant Ecology, Partner in the Greifswald Mire Centre, Institute for Botany and Landscape Ecology, Greifswald University, 17489 Greifswald, Germany
10
School for Forest Management, Faculty of Forest Sciences, Swedish University of Agricultural Sciences, SE-739 21 Skinnskatteberg, Sweden
11
Department of Forestry and Wildlife Management, Faculty of Applied Ecology, Agricultural Sciences and Biotechnology, Inland Norway University of Applied Sciences, Campus Evenstad, N-2480 Koppang, Norway
*
Author to whom correspondence should be addressed.
Land 2021, 10(2), 174; https://doi.org/10.3390/land10020174
Submission received: 7 December 2020 / Revised: 1 February 2021 / Accepted: 3 February 2021 / Published: 8 February 2021
(This article belongs to the Special Issue Peatland Ecosystem)

Abstract

:
Peatlands are the “kidneys” of river basins. However, intensification of agriculture and forestry in Europe has resulted in the degradation of peatlands and their biodiversity (i.e., species, habitats and processes in ecosystems), thus impairing water retention, nutrient filtration, and carbon capture. Restoration of peatlands requires assessment of patterns and processes, and spatial planning. To support strategic planning of protection, management, and restoration of peatlands, we assessed the conservation status of three peatland types within the trans-border Neman River basin. First, we compiled a spatial peatland database for the two EU and two non-EU countries involved. Second, we performed quantitative and qualitative gap analyses of fens, transitional mires, and raised bogs at national and sub-basin levels. Third, we identified priority areas for local peatland restoration using a local hotspot analysis. Nationally, the gap analysis showed that the protection of peatlands meets the Convention of Biological Diversity’s quantitative target of 17%. However, qualitative targets like representation and peatland qualities were not met in some regional sub-basins. This stresses that restoration of peatlands, especially fens, is required. This study provides an assessment methodology to support sub-basin-level spatial conservation planning that considers both quantitative and qualitative peatland properties. Finally, we highlight the need for developing and validating evidence-based performance targets for peatland patterns and processes and call for peatland restoration guided by social-ecological research and inter-sectoral collaborative governance.

1. Introduction

Mires are formed in the process of anoxic decomposition of accumulated organic material in saturated conditions, commonly termed peatlands. Over thousands of years, hunter-gatherers and traditional farmers have utilized peatlands to support their livelihoods [1,2]. More recently, the ecosystem services approach has stressed that peatlands not only provide an important range of goods, but also deliver other important benefits, including ecosystem regulation, storage of fresh water, carbon, and nutrients, as well as biodiversity conservation and aesthetic values [3]. Peatlands cover only ca. 3% of the global land area [4] but sequester and store more carbon than any other type of terrestrial ecosystem, including the global above-ground carbon stock of forest ecosystems [3,5]. Thus, peatlands provide highly valued natural resources and services [6,7], and are known as the kidneys of the landscape [8].
However, it has been estimated that globally, 10–20% of peatlands have been degraded [9,10]. This has reduced their ability to provide crucial ecosystem services, including water retention, nutrient filtration, carbon capture, and to support biodiversity conservation [11,12]. This transformation of peatlands is responsible for 5% of the global anthropogenic carbon dioxide (CO2) emissions [13]. Declines in both peatland quantity and quality have led to major environmental issues [12] and have negative social impacts [14].
Globally, the European continent has suffered the greatest losses of peatlands, both in absolute and relative terms [12,15,16]. Since the beginning of the 18th century, many European peatlands have been drained for intensive agriculture and forestry [17], as well as for peat extraction [3]. As a result, many EU countries have nearly depleted their peat resources, and now import peat from Eastern Europe [18]. This situation can be improved by both stopping further drainage of peatlands, and by implementing peatland restoration and re-wetting. The degradation of peatland ecosystems requires that both ecological processes and patterns [19] are dealt with.
Stressing this, current policies and goals for peatland management aim towards conservation of those that remain in favourable condition, and restoration of degraded sites. Regarding processes, this is expected to reduce global greenhouse gas emissions, increase peatland’s capacity to store carbon and capture nutrients, improve water quality and reduce eutrophication of rivers and water bodies, and boost human resilience and prevent the emergence and spread of future diseases [20]. For many years, international conventions, such as the International Union for Conservation of Nature (IUCN) and the Ramsar Convention on Wetlands, have provided key frameworks for the conservation of ecological patterns and processes, and the wise use of wetlands and their resources. In 2008, the Convention on Biological Diversity [21] provided an overarching framework for biodiversity conservation by defining 20 Aichi Biodiversity Targets. The European Green Deal strategy [22] put forward by the European Commission aims towards the EU becoming climate-neutral through making the EU’s economy sustainable by boosting the efficient use of resources and moving to a clean and circular economy, restoring biodiversity, and stopping pollution by 2050. This vison includes reducing the net greenhouse gas emissions to zero by 2050 [23]. These policies are of special relevance for sustainable use, conservation, and restoration of peatlands for climate change mitigation [22] as well as biodiversity conservation [20].
Specifically focusing on ecological patterns, the establishment of functional ecological networks includes the conservation and restoration of habitat patches [24] of the focal ecosystem with sufficient quality, size, and spatial configurations to support and maintain ecological processes as well as local populations of focal species [25,26]. The EU’s Green Infrastructure policy [27] places emphasis on the conservation, management, and restoration towards strategically planned networks of representative land cover patches, which are designed to conserve biodiversity, and to deliver a wide range of ecosystem services.
Securing ecological processes and patterns requires that evidence-based performance targets should be met. There are limitations on how much degradation habitats can suffer before the viability of species populations or the functions of ecosystems are impaired. To support conservation planning, the question “How much is enough?” has fascinated and frustrated conservationists, scientists, and policymakers [28,29]. Similar questions for the planning of peatland conservation resolve around the critical load concept, which tackles the question of how much deposition of nutrients can ecosystems tolerate [30], how much water does a peatland need to be resilient [31], or how much habitat fragmentation and loss can a species take [32,33]. Evidence suggests that 30–40% protection is recommended to conserve various ecological patterns and processes as a performance target [28,29,31]. However, negotiated policy targets are commonly lower [28].
In a comprehensive review of peatlands in Central and Eastern Europe, Minayeva and Sirin [34] listed a number of strategic priorities and required actions aimed at implementing national and international policies towards peatland conservation. These cover the entire policy cycle and include agenda setting and implementation tools as well as governance, planning and management, and subsequent monitoring and evaluation [35]. This stresses the need for applying multi-level spatial planning that covers initial strategic, and subsequent tactical to operational steps [36]. The strategic starting point involves assessment of the opportunity to maintain representative land cover types or ecosystems as functional networks [37,38,39]. This requires coordinated actions among actors and stakeholders representing different sectors and levels of governance [40]. Westbrook and Noble [41] called for strategic planning to assess and manage the impacts on wetlands by adopting an approach that integrates science and land use planning to provide clear directions for implementing policy and land use plans on-the-ground. A foundation of conservation planning is integrated assessment, and communication about the states and trends of different dimensions of peatlands [42,43].
The aim of this study is to assess the regional distribution and conservation status of three peatland types in the trans-border Neman River basin involving two EU and two non-EU countries in Central and Eastern Europe. Supporting strategic assessment and planning of peatland processes and patterns, we (1) created a spatial peatland database. This was used to (2) assess regional gaps of peatland types and conservation status, and (3) to identify priority areas for peatland conservation, management, and restoration. We discuss the need for evidence-based performance targets, social-ecological research, as well as barriers and bridges for trans-border governance involving inter-sectoral co-operation and public involvement towards maintaining functional peatland ecosystems.

2. Materials and Methods
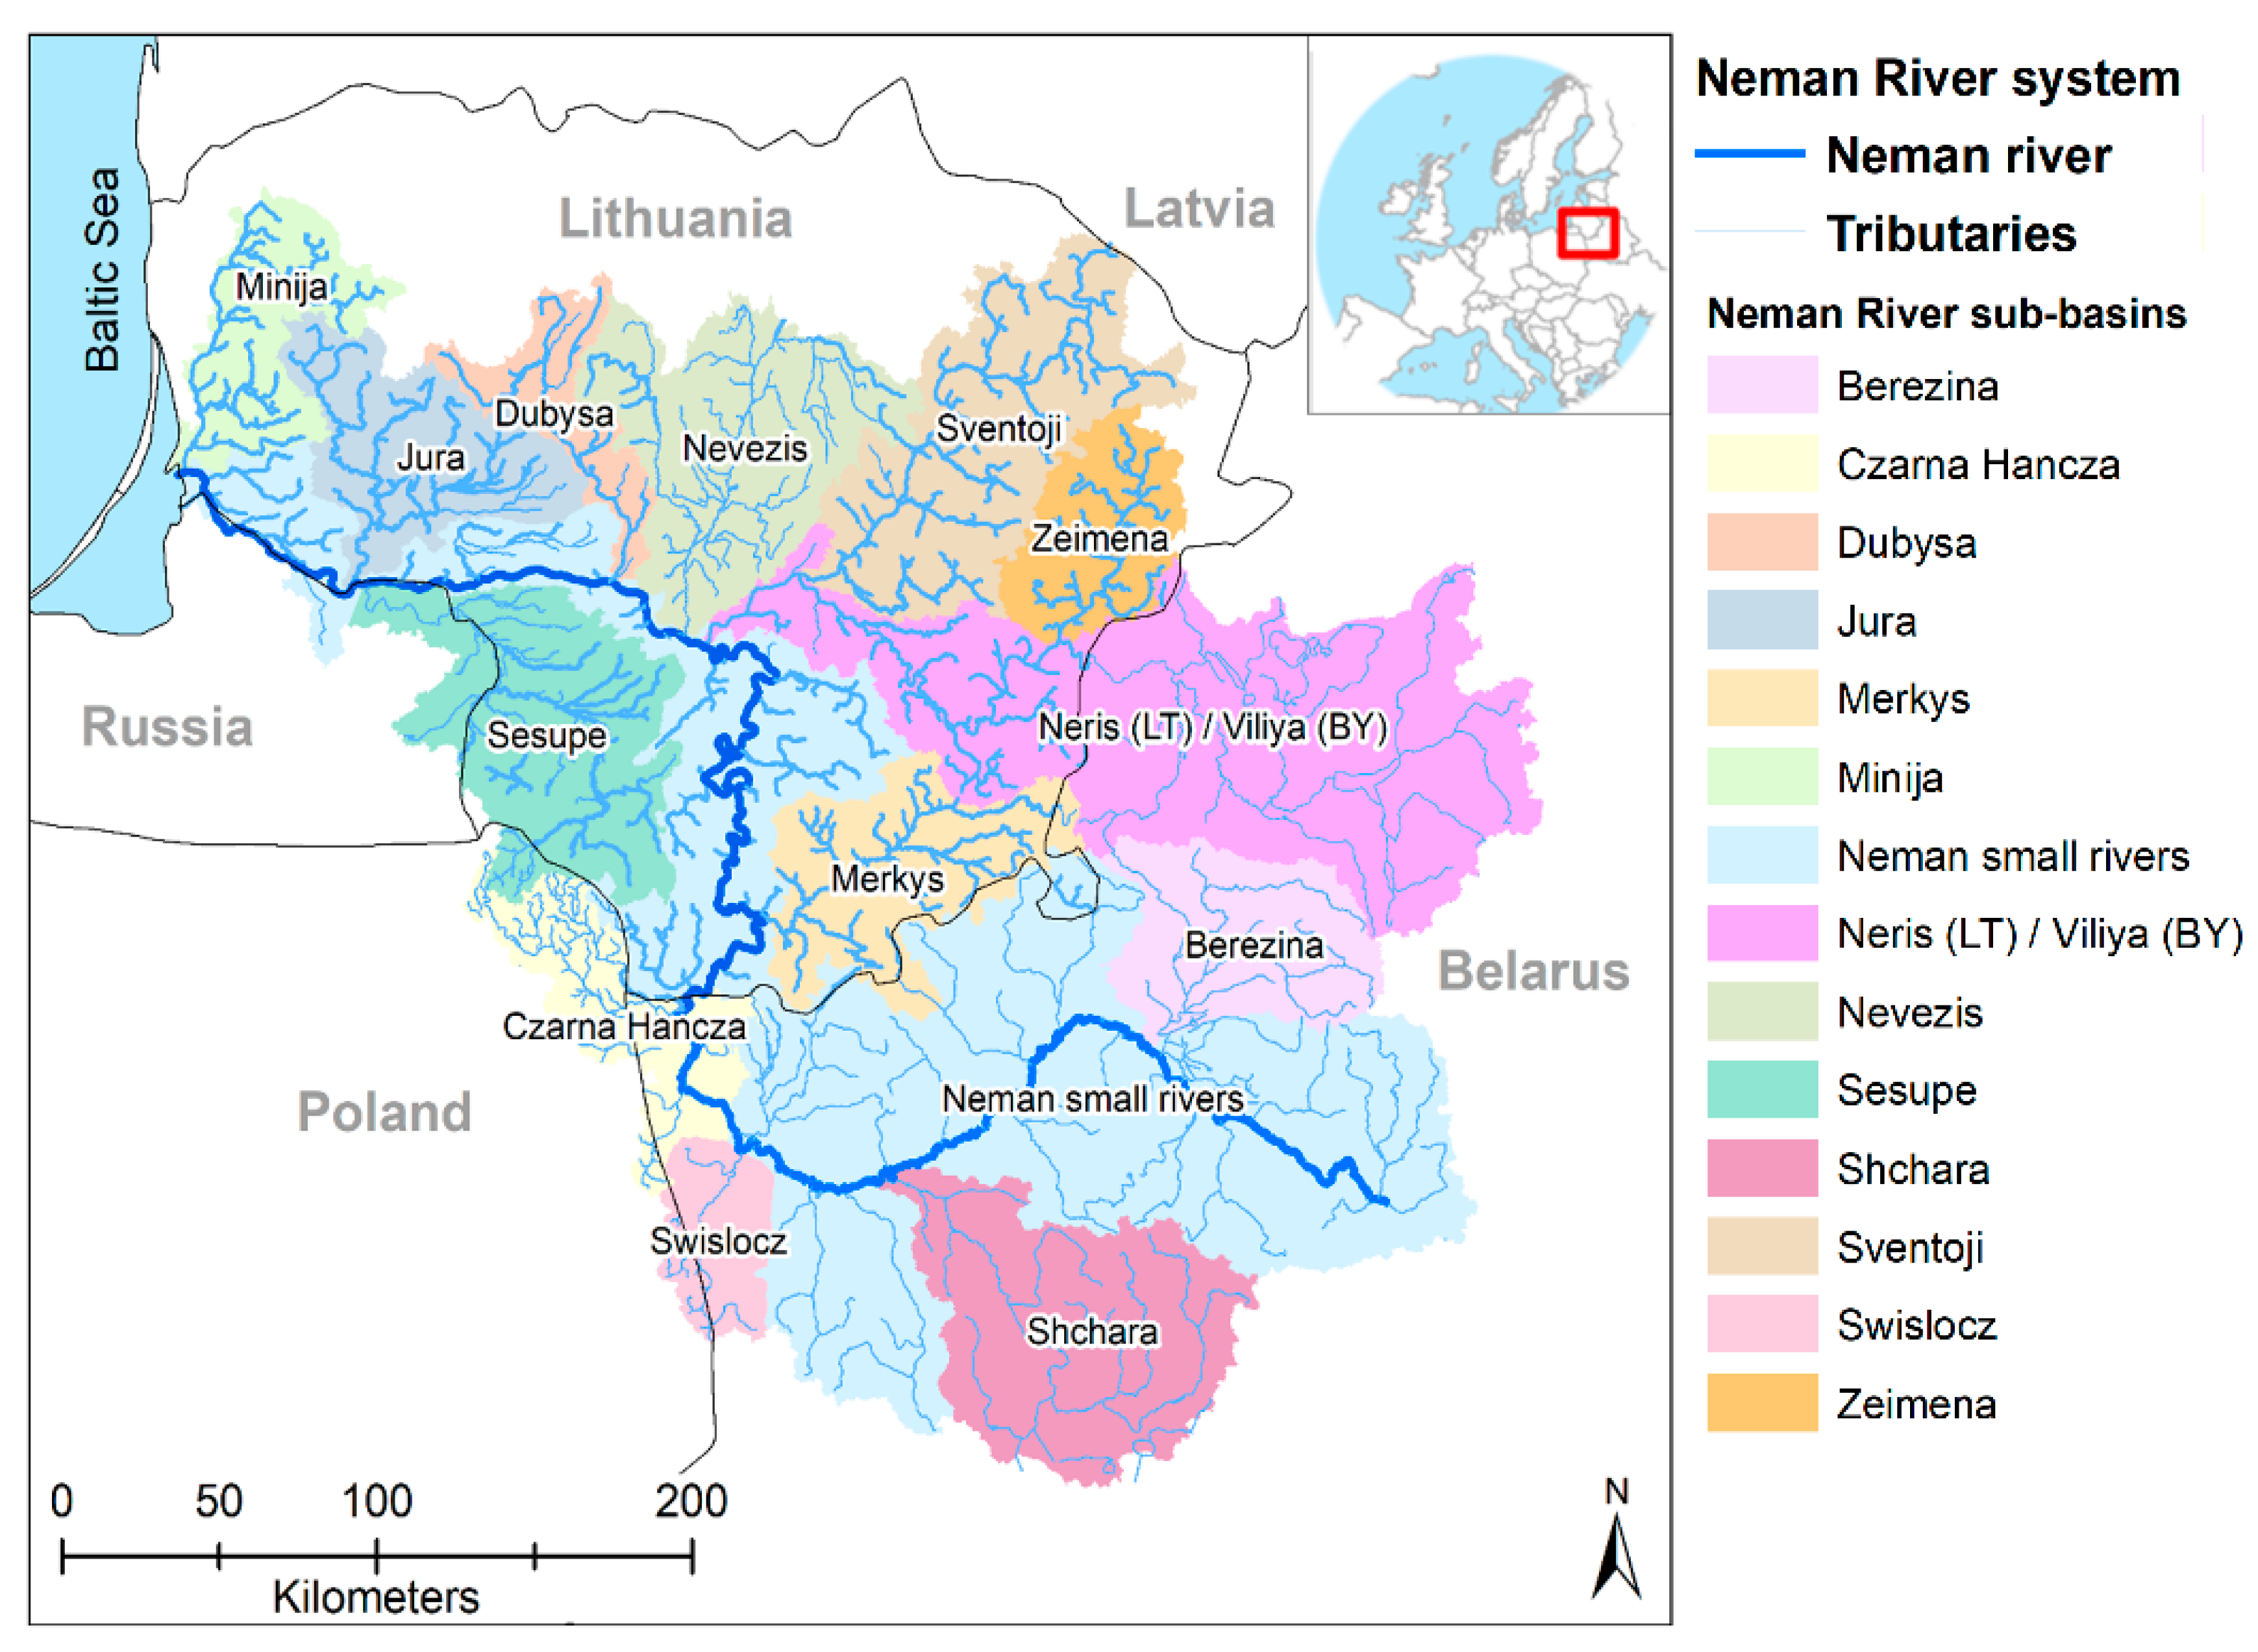
2.1. Study Area

Our case study area is the trans-border Neman River basin (97,928 km2), which is the 14th largest river basin in Europe and the fourth largest in the Baltic Sea basin. It is located across the EU eastern border (56°15′–52°45′ N and 22°40′–28°10′ E), and is divided between 4 countries: the two EU members Lithuania and Poland, and the two non-EU countries Belarus and Russia (the Kaliningrad region) (Figure 1). The total length of the river is 937 km. Spring accounts for the highest seasonal river runoff (38%) and is followed by winter (26%), autumn (20%), and summer (16%) [44]. The mean slope of the riverbed varies from 0.16 m per km in the head waters to 0.23 m per km in the middle reaches, and 0.10 m per km in the downstream reaches (below the Neman-Neris River junction) [45]. The average water discharge of the river at Smalininkai is recorded at 535 m3/s [46]. The dominant land cover of the Neman River basin is agricultural land (57%) followed by forest (39%). The natural landscape development of the Neman River basin took place during two periods of the Pleistocene. The vast majority of Lithuania’s territory was shaped during the last deglaciation of the Vistulian (Late Nemunas) ice sheet [47], resulting in numerous scattered depressions that have formed many small-sized peatlands. However, most of the peatlands of the Neman River basin in Belarus are of the Saalian age, with a monotonous morainic landscape. The dominant landforms are bottom moraines, fluvioglacial plains, and lowlands [48], which favours the formation of more extensive wetlands. The Lithuanian Neman River delta is home to the Aukštumala raised bog, the study area of the first comprehensive scientific study on the vegetation and development of raised bogs in the world and has thus made a unique contribution to mire science, including protection and restoration [49].

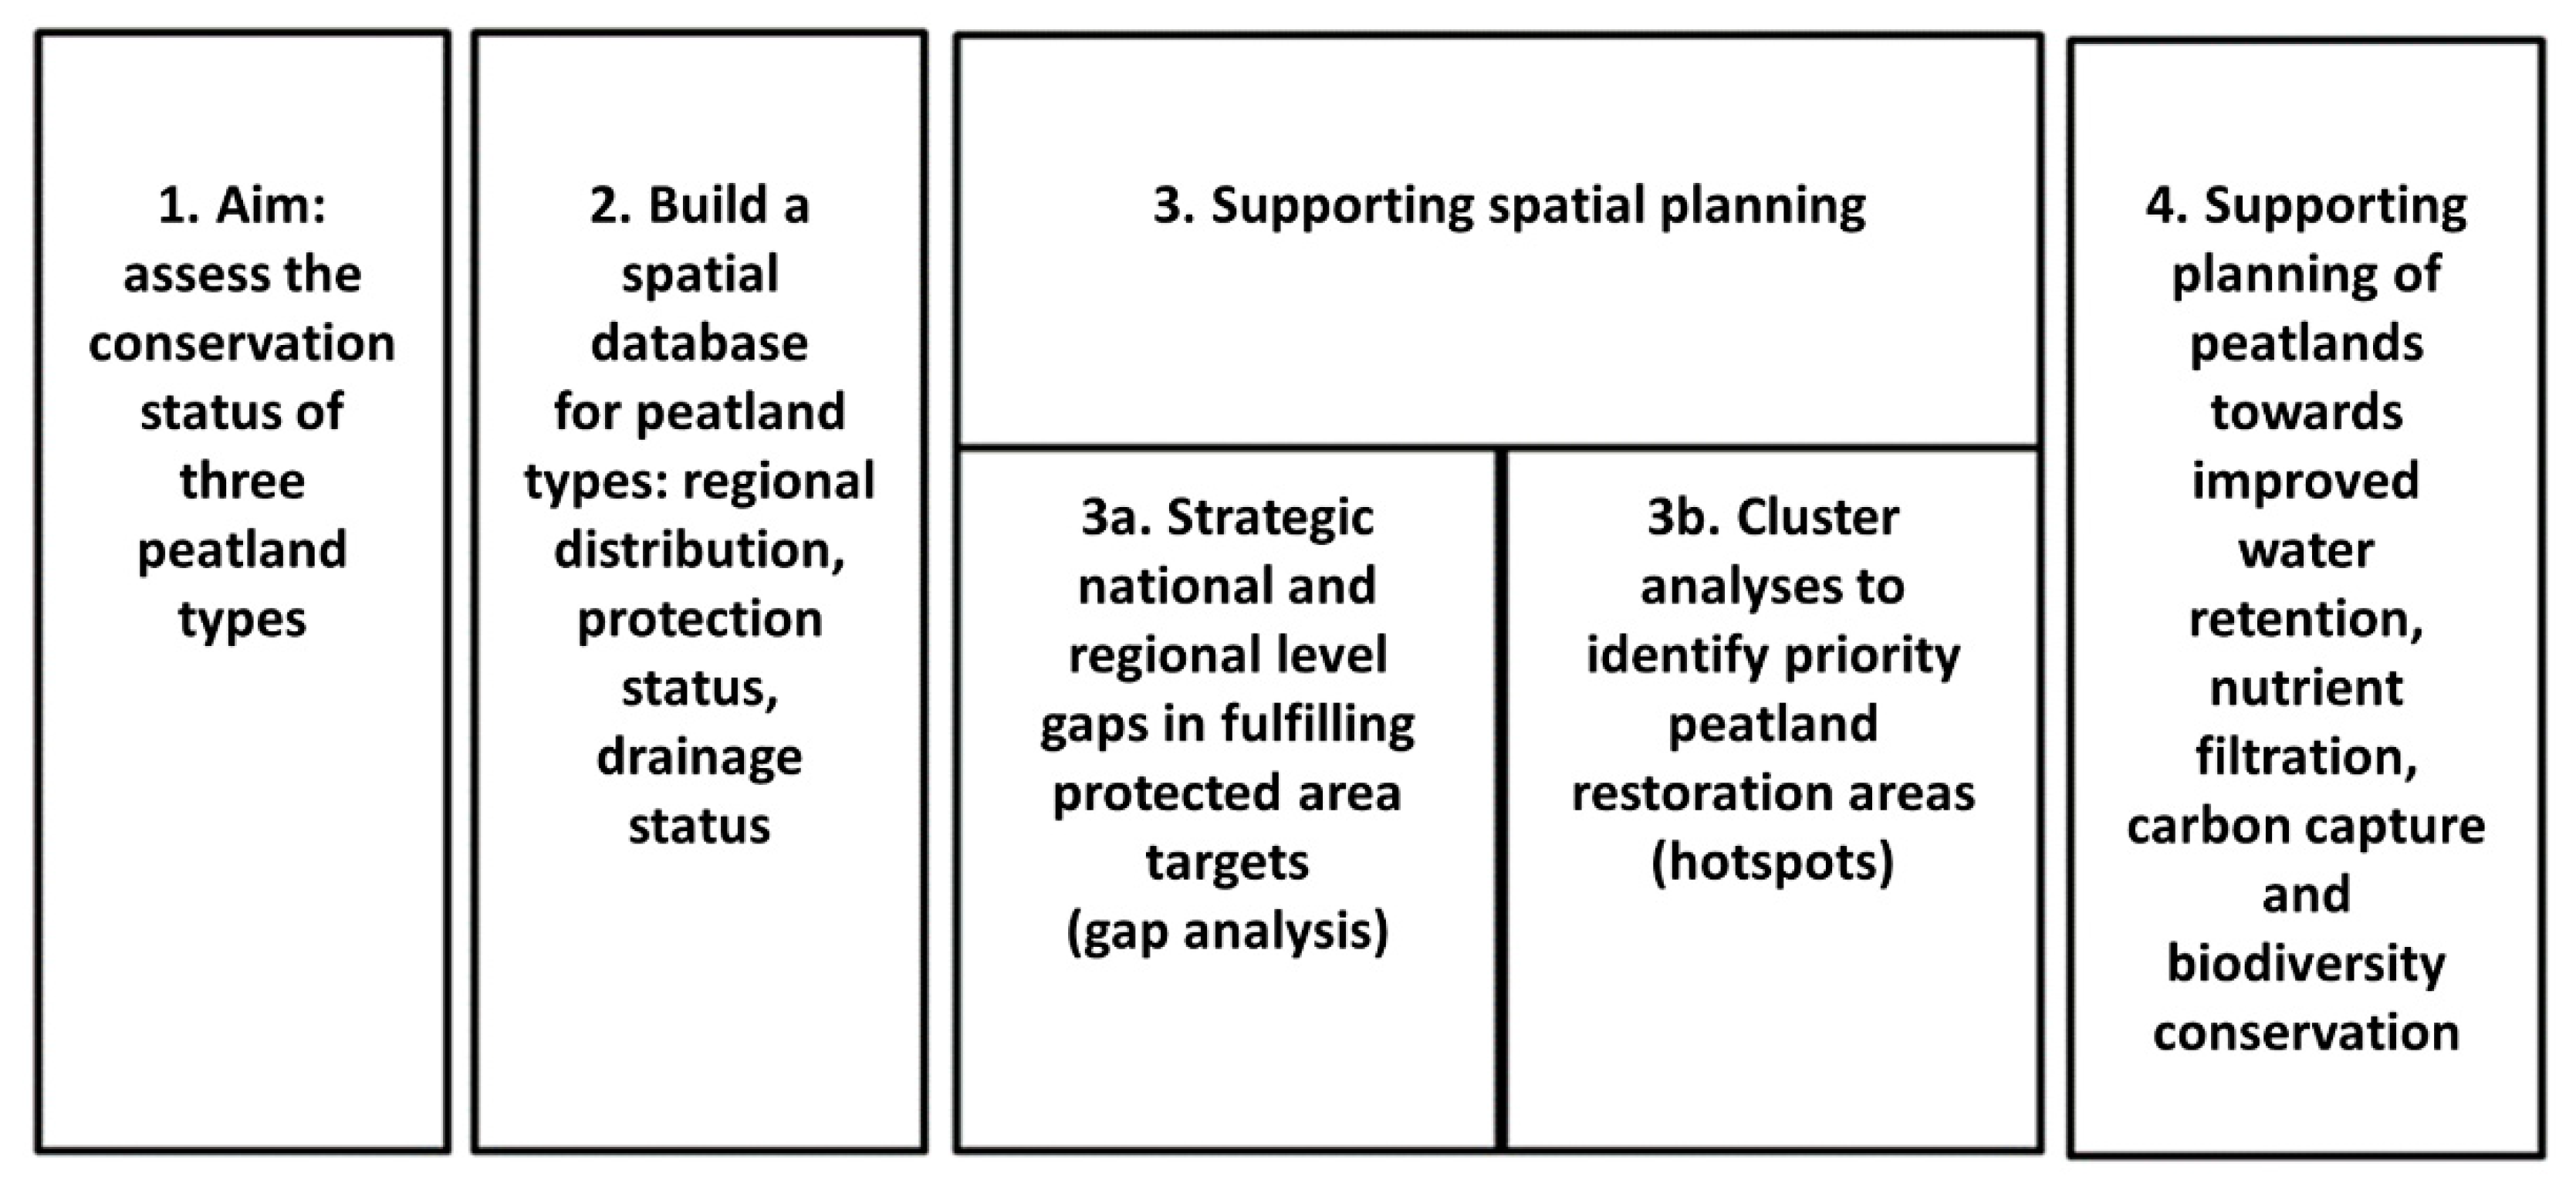
2.2. Analytic Approach

An overview of the components of this study is presented in Figure 2. First, we compiled a spatial database of peatlands covering the Neman River basin in two EU (Lithuania and Poland) and two non-EU countries (Belarus and Russia) (Figure 2, step 2). Second, to support strategic conservation planning, we made gap analyses to assess peatland quantity and quality relevant for (i) the highest levels of policy and governance (e.g., International/EU reporting of the national level situation), and (ii) regional sub-basins (Figure 2, step 3a). Third, to support tactical planning for peatland restoration, we identified and quantified priority areas (Figure 2, step 3b).

2.3. Spatial Data

2.3.1. Database Creation

Peatland areas are not always homogenous and can contain a large number of types [39,51,52]. We focus on three peatland types, viz. (1) fens, i.e., minerotrophic peatlands, fed by mineral-rich groundwater or run-off water and atmospheric precipitation; (2) raised bogs, i.e., oligotrophic peatlands where the centre is higher than the edge, fed only by atmospheric precipitation and wind (aerosols), and are poor in minerals and nutrients; and (3) transitional mires, i.e., peatlands with features typical of both raised bogs and fens (as defined by Mitsch and Gosselink [53]). The detailed identification of peatland sub-types was not possible due to the diversity of methodological approaches used to acquire the peatland data in the different countries.
We created a spatial database of current peatlands for the Neman River basin (Figure 2, step 2). This was created by compiling existing peatland data from Belarus (http://peatlands.by) and Lithuania [54]. However, as the Neman River basin peatland data for Poland was outdated, and not available for the Russian part of the case study area, we mapped their peatlands by combining remote sensing and field verification. Data compilation for peatland polygons included the three peatland types, area, protection status, drainage impact, and landcover (see www.neman-peatlands.eu). As the Russian and Belarussian data did not contain information on protection status and land cover types, we used supplementary data from protectedplanet.net and Broxton et al. [55]. The drainage status of peatlands was included within the Belarusian and Lithuanian peatland data, but for both Poland and Russia, they were captured using remote sensing and field verification. The data was compiled, harmonised, and analysed using GIS software. In addition, we corrected all topology errors. The minimum mapping unit of each peatland was 1 ha.

2.3.2. Amounts, Regional Distribution, and Characteristics of Peatland Types

To understand the spatial distribution of peatlands, we analysed their patch size distribution using the peatland database that we created. Consistent with percolation theory [56], the fragmentation and reduced size of peatland patches can have negative effects on water retention, nutrient filtration, carbon capture, and biodiversity. Peatland patch properties and species are closely linked. Using the umbrella species approach, namely that the presence of certain species can indicate that habitat patterns are satisfied for other less demanding species [57,58], the patch size requirements of wetland birds can be used to assess if benchmark conditions for habitat area and proportions in the local landscape of the catchment are satisfied or not. The black-tailed godwit (Limosa limosa), curlew (Numenius arquata), aquatic warbler (Acrocephalus paludicola), and black grouse (Tetrao tetrix), once common in peatlands of the Neman River basin, are relevant examples.
The approximate minimum area requirements to support local occurrence of these focal species ranges from 50–100 ha [37,59]. This patch size is consistent with the observation that peatland patches of >100 ha also support other species that require peatlands. To assess how the total area of peatland is distributed among different patch size intervals, we applied a geometric patch distribution of 0–50, 50–100, 100–200, 200–400, 400–800, 800–1600, and >1600 ha.

2.4. National and Regional Gap Analyses

2.4.1. Procedure

Gap analysis [60] is a tool used to provide policy-makers with an assessment of the occurrence of potential gaps in the amount of different representative vegetation types for the maintenance of biodiversity and ecosystem services [61,62]. It can provide a quick summary at the policy level and for planners about the conservation status of different habitat types and ecosystems in terms of their extent, distribution, and representativeness. Using evidence-based conservation targets as a norm, gaps in terms of habitat types that are not sufficiently represented in the protected area networks can be identified. This forms the base for planning and actions to establish new conservation areas, changes in land management practices, and restoration of peatlands [60]. A gap analysis is an exercise based on a spatial comparison of a particular landcover (such as peatlands in this case) with existing protected areas that require detailed multiple data gathering, mapping, and analyses [63]. The gap analyses we applied to assess peatland protection included the following components:
  • A = The area of peatlands.
  • B1 = Current area of peatlands under protection (quantitative criterion).
  • B2 = Current area of peatlands under protection not impacted by drainage (quantitative and qualitative criteria).
  • C = Evidence-based or negotiated performance target.
  • D = A × C—Long-term protection target.
  • E = B1−(A × C)—Gap or surplus in protection.
  • F = B2−(A × C)—Gap or surplus in protection not impacted by drainage.
Using this basic procedure, we performed multi-level quantitative and qualitative gap analyses that increased in complexity to assess the current protection status at different spatial scales. We thus focused on (i) the overall protection of peatlands within the Neman River basin at the national level (only quantitative), and (ii) regional level by peatland type and sub-basins (quantitative), and (iii) regional level by peatland type, and sub-basins excluding protected peatlands that are impacted by drainage (i.e., both quantitative and qualitative) (see Figure 2, step 3a).

2.4.2. Tipping Points for Patterns and Processes in Ecosystems

Performance targets for biodiversity conservation regarding the amount of land covers representing different ecosystems (i.e., “C” in the previous section) provide a good starting point to assess the status of current protected area networks able to sustain peatlands. As a negotiated performance target value reflecting evidence-based knowledge [28,29], as a proxy, we used the internationally agreed and ratified Convention on Biological Diversity’s [21] Aichi Biodiversity Target #11, which states “By 2020, at least 17% of terrestrial and inland water, and 10% of coastal and marine areas, especially areas of particular importance for biodiversity and ecosystem services, are conserved through… protected areas and other effective area-based conservation measures.
This Aichi target considers both pattern and process, and addresses both quantitative and qualitative criteria. Thus, we included the additional criteria of drained versus undrained peatlands. The logic for the analyses of peatland quality was determined by the fact that drainage affects the functionality of peatlands in terms of providing ecosystem services [64]. Thus, peatlands with drainage do not fulfil the requirements of CBD’s Target 14 [21]: “By 2020, ecosystems that provide essential services, including services related to water, and contributed to health, livelihoods and well-being, are restored and safeguarded” and Target 15: “By 2020, ecosystem resilience and the contribution of biodiversity to carbon stocks have been enhanced, through conservation and restoration, including restoration of at least 15 percent of degraded ecosystems, thereby contributing to climate change mitigation and adaptation and to combating desertification”. In addition, the Sustainable Development Goal 15 of the 2030 Agenda for Sustainable Development reiterates the importance of implementing the Strategic Plan for Biodiversity 2011–2020 and achieving the Aichi Biodiversity Targets. Moreover, the EU biodiversity strategy 2030 aims towards reducing the losses of nutrients from fertilisers by at least 50% [20]. Thus, the condition of peatland quality is even more important.

2.5. Priority Areas for Peatland Restoration

2.5.1. Cluster Analysis to Identify Peatland Hotspots and Coldspots

Although a gap analysis provides quantitative and qualitative results on the area amount required to satisfy a particular performance target, it does not provide precise spatial information on where priority areas for restoration are located (see Figure 2, step 3b). Therefore, strategic spatial planning of peatland protection, management, and restoration to identify peatland hotspots and coldspots is required [3,39]. Given that combined patches of different peatland types (e.g., fen, raised bog and transitional mire complexes) can be considered as a functional landscape element [32], we identified key peatland complexes by applying a 1 km2 hexagon fishnet covering the entire Neman River basin. For each hexagon, we calculated the total peatland area proportions using ArcGIS. The rationale for selecting 1 km2 hexagon units is that this is the approximate minimum home range area required to support local occurrence of wetland focal bird species that can indicate ecosystem health [37,59,65]. Indeed, the use of birds as a focal species has been shown to be a good indicator of wetland ecosystem health and functionality [66,67]. The aquatic warbler is a good example of a focal species that is dependent on fen management and restoration [40,68] with dominant open sedge fens or wet meadow habitats that are rich in invertebrates.
Subsequently, we used the Getis-Ord Gi * statistic cluster analysis tool [69] in ArcGIS to identify key peatland complexes. The cluster analysis evaluates the peatland area proportions for each hexagon and its neighbours. We applied a neighbourhood distance of 5 km to represent a local peatland landscape with a sufficient proportion of sufficiently large peatland patches [70]. The statistical variable Gi* is assigned to each of the hexagons and forms the z-score. For example, a high statistically significant positive z-score indicates more intense clustering of high-value peatlands and is thus a hotspot, whereas the opposite is a coldspot. Based on the cluster analysis outputs of the z-score, p-value, and reliability level (Gi_Bin), we created a hotspot map to identify key peatland complexes in the study area. The Gi_Bin field was defined at the statistical significance of hot spots ±2 bins, which represents a confidence level of 95%.

2.5.2. Priority Areas for Conservation and Restoration

Based on the results of the cluster analysis as well as the constraints of the available attributed data (e.g., protection status and drainage status), we prioritized the conservation and restoration potential of the peatland area within the Neman River basin for the identified hotspots (Table 1). We classified restoration as the re-wetting of drained peatlands through activities to remove and/or block the current drainage systems. We understand this is only a tactical step of the restoration process and that further operational restoration actions are required to be developed and formulated within ongoing management plans for peatlands [40,71], but this is beyond the scope of this paper.

3. Results

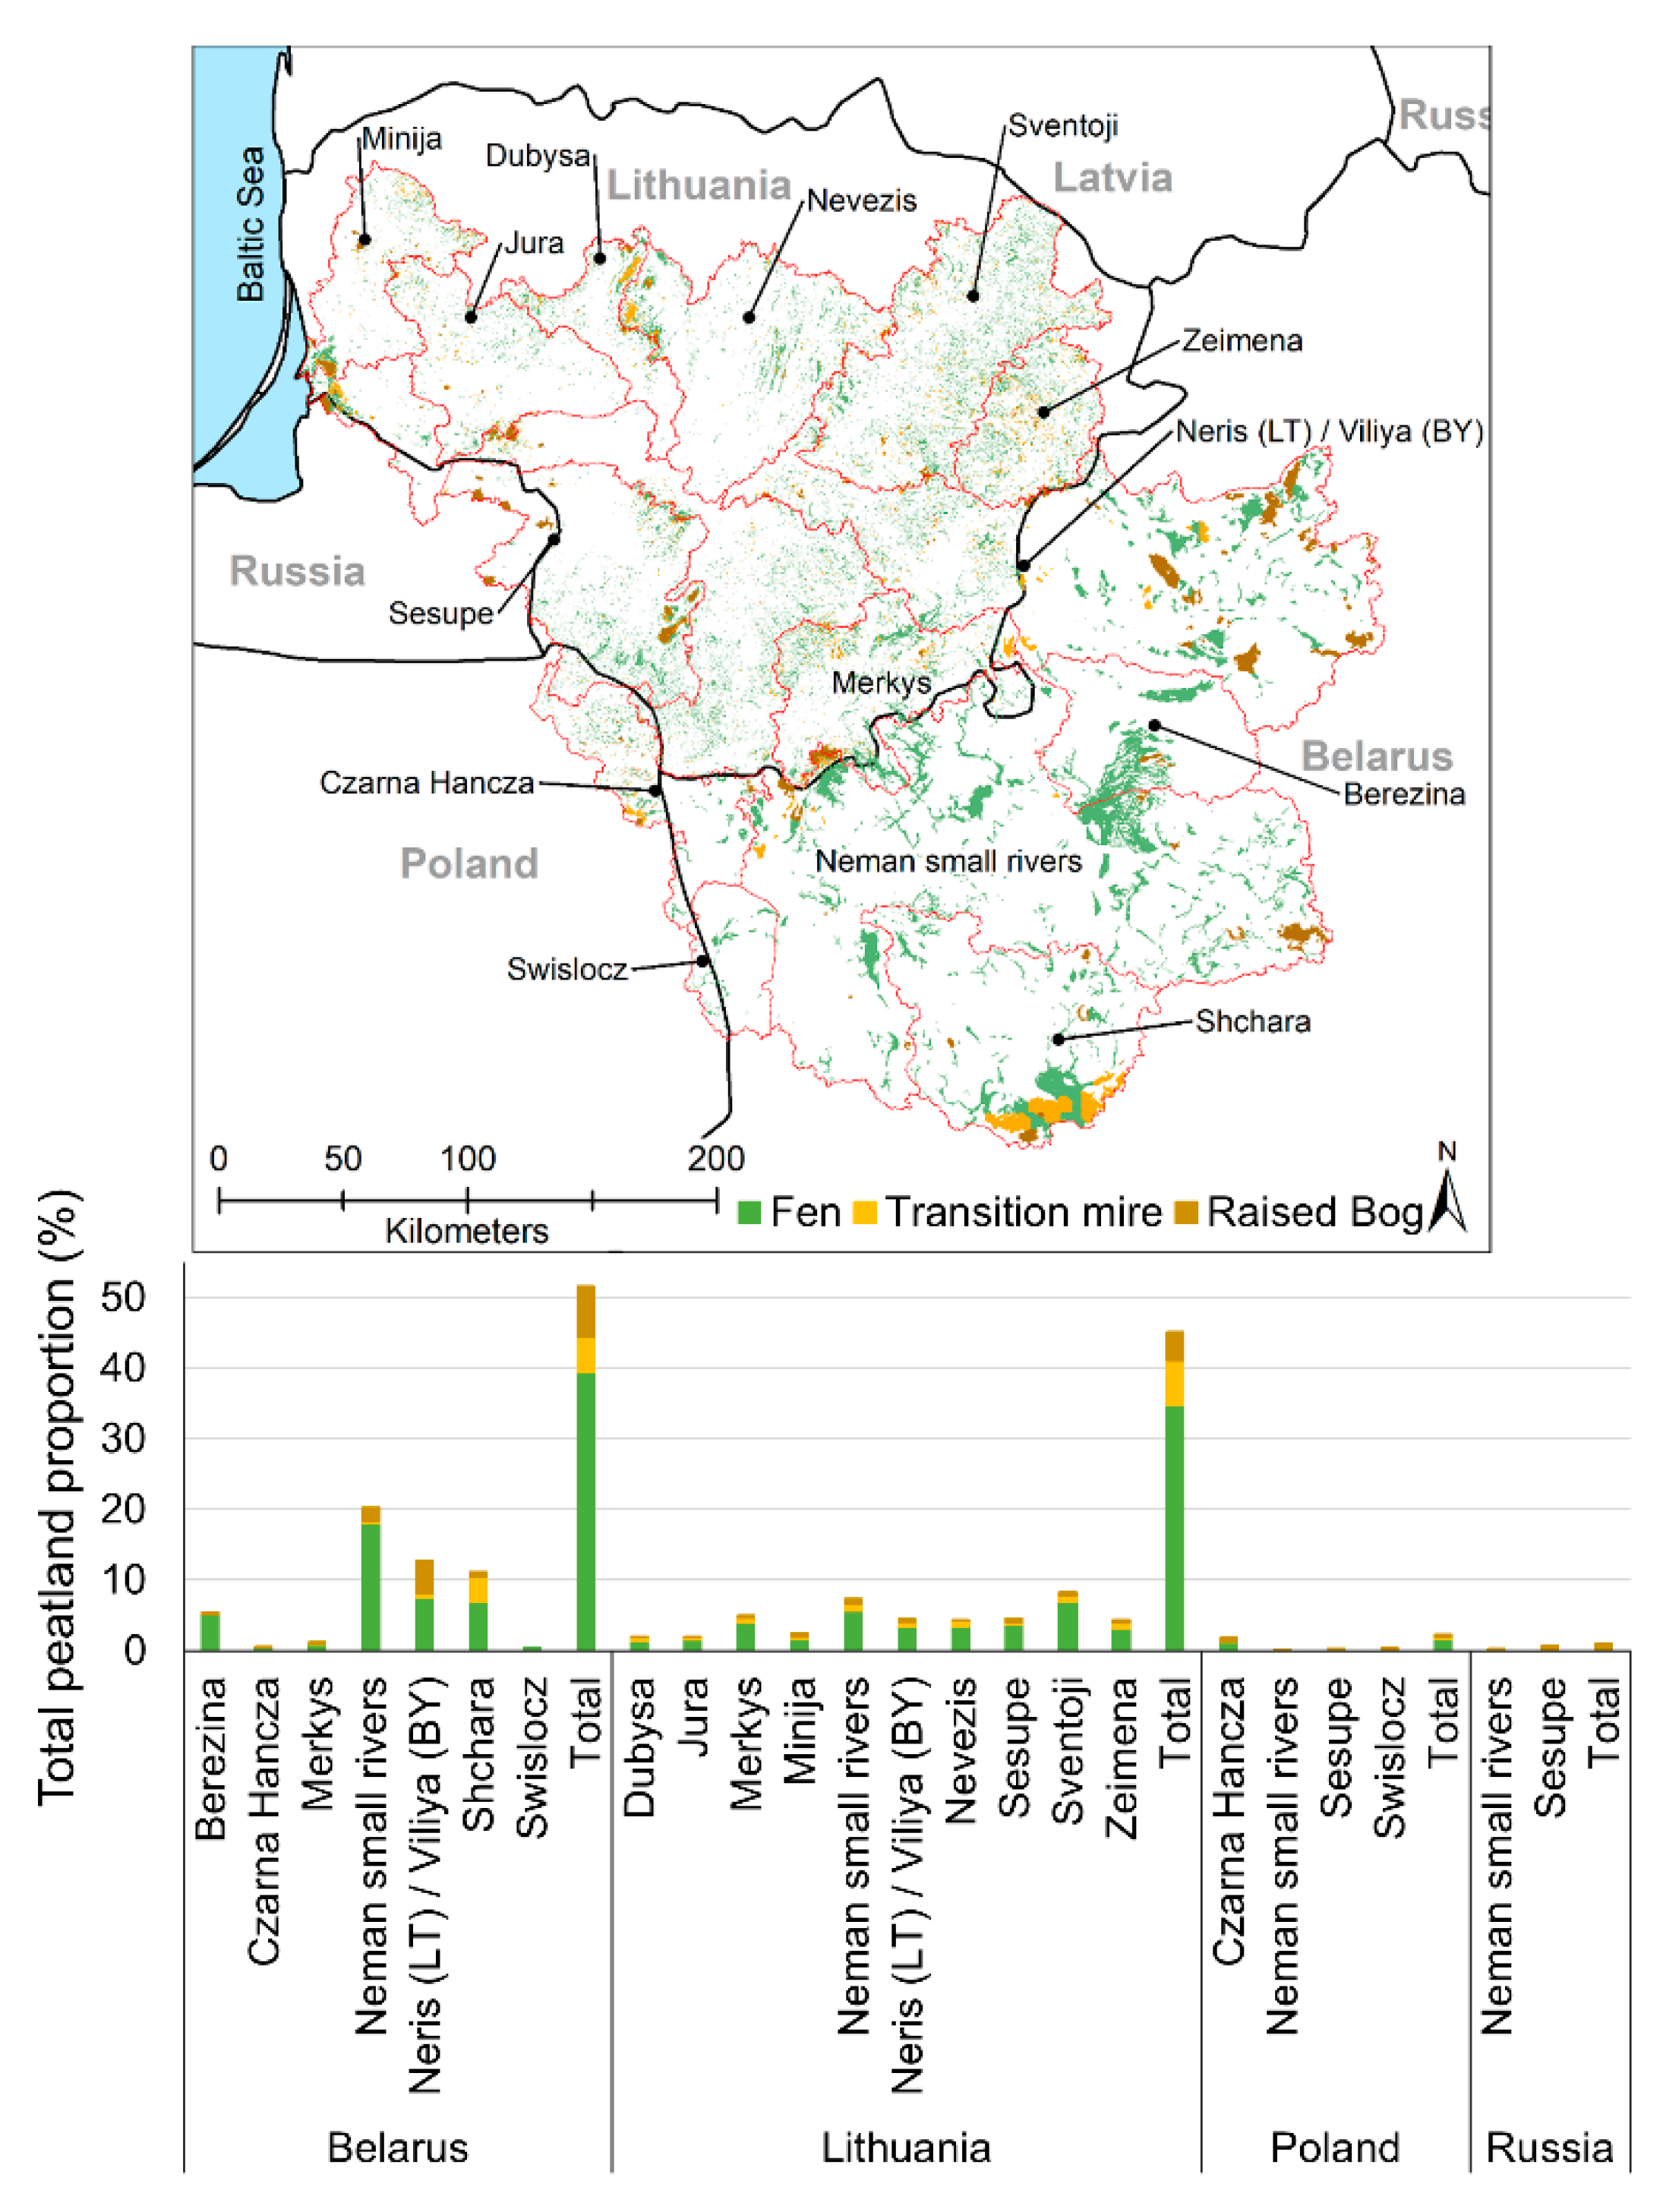
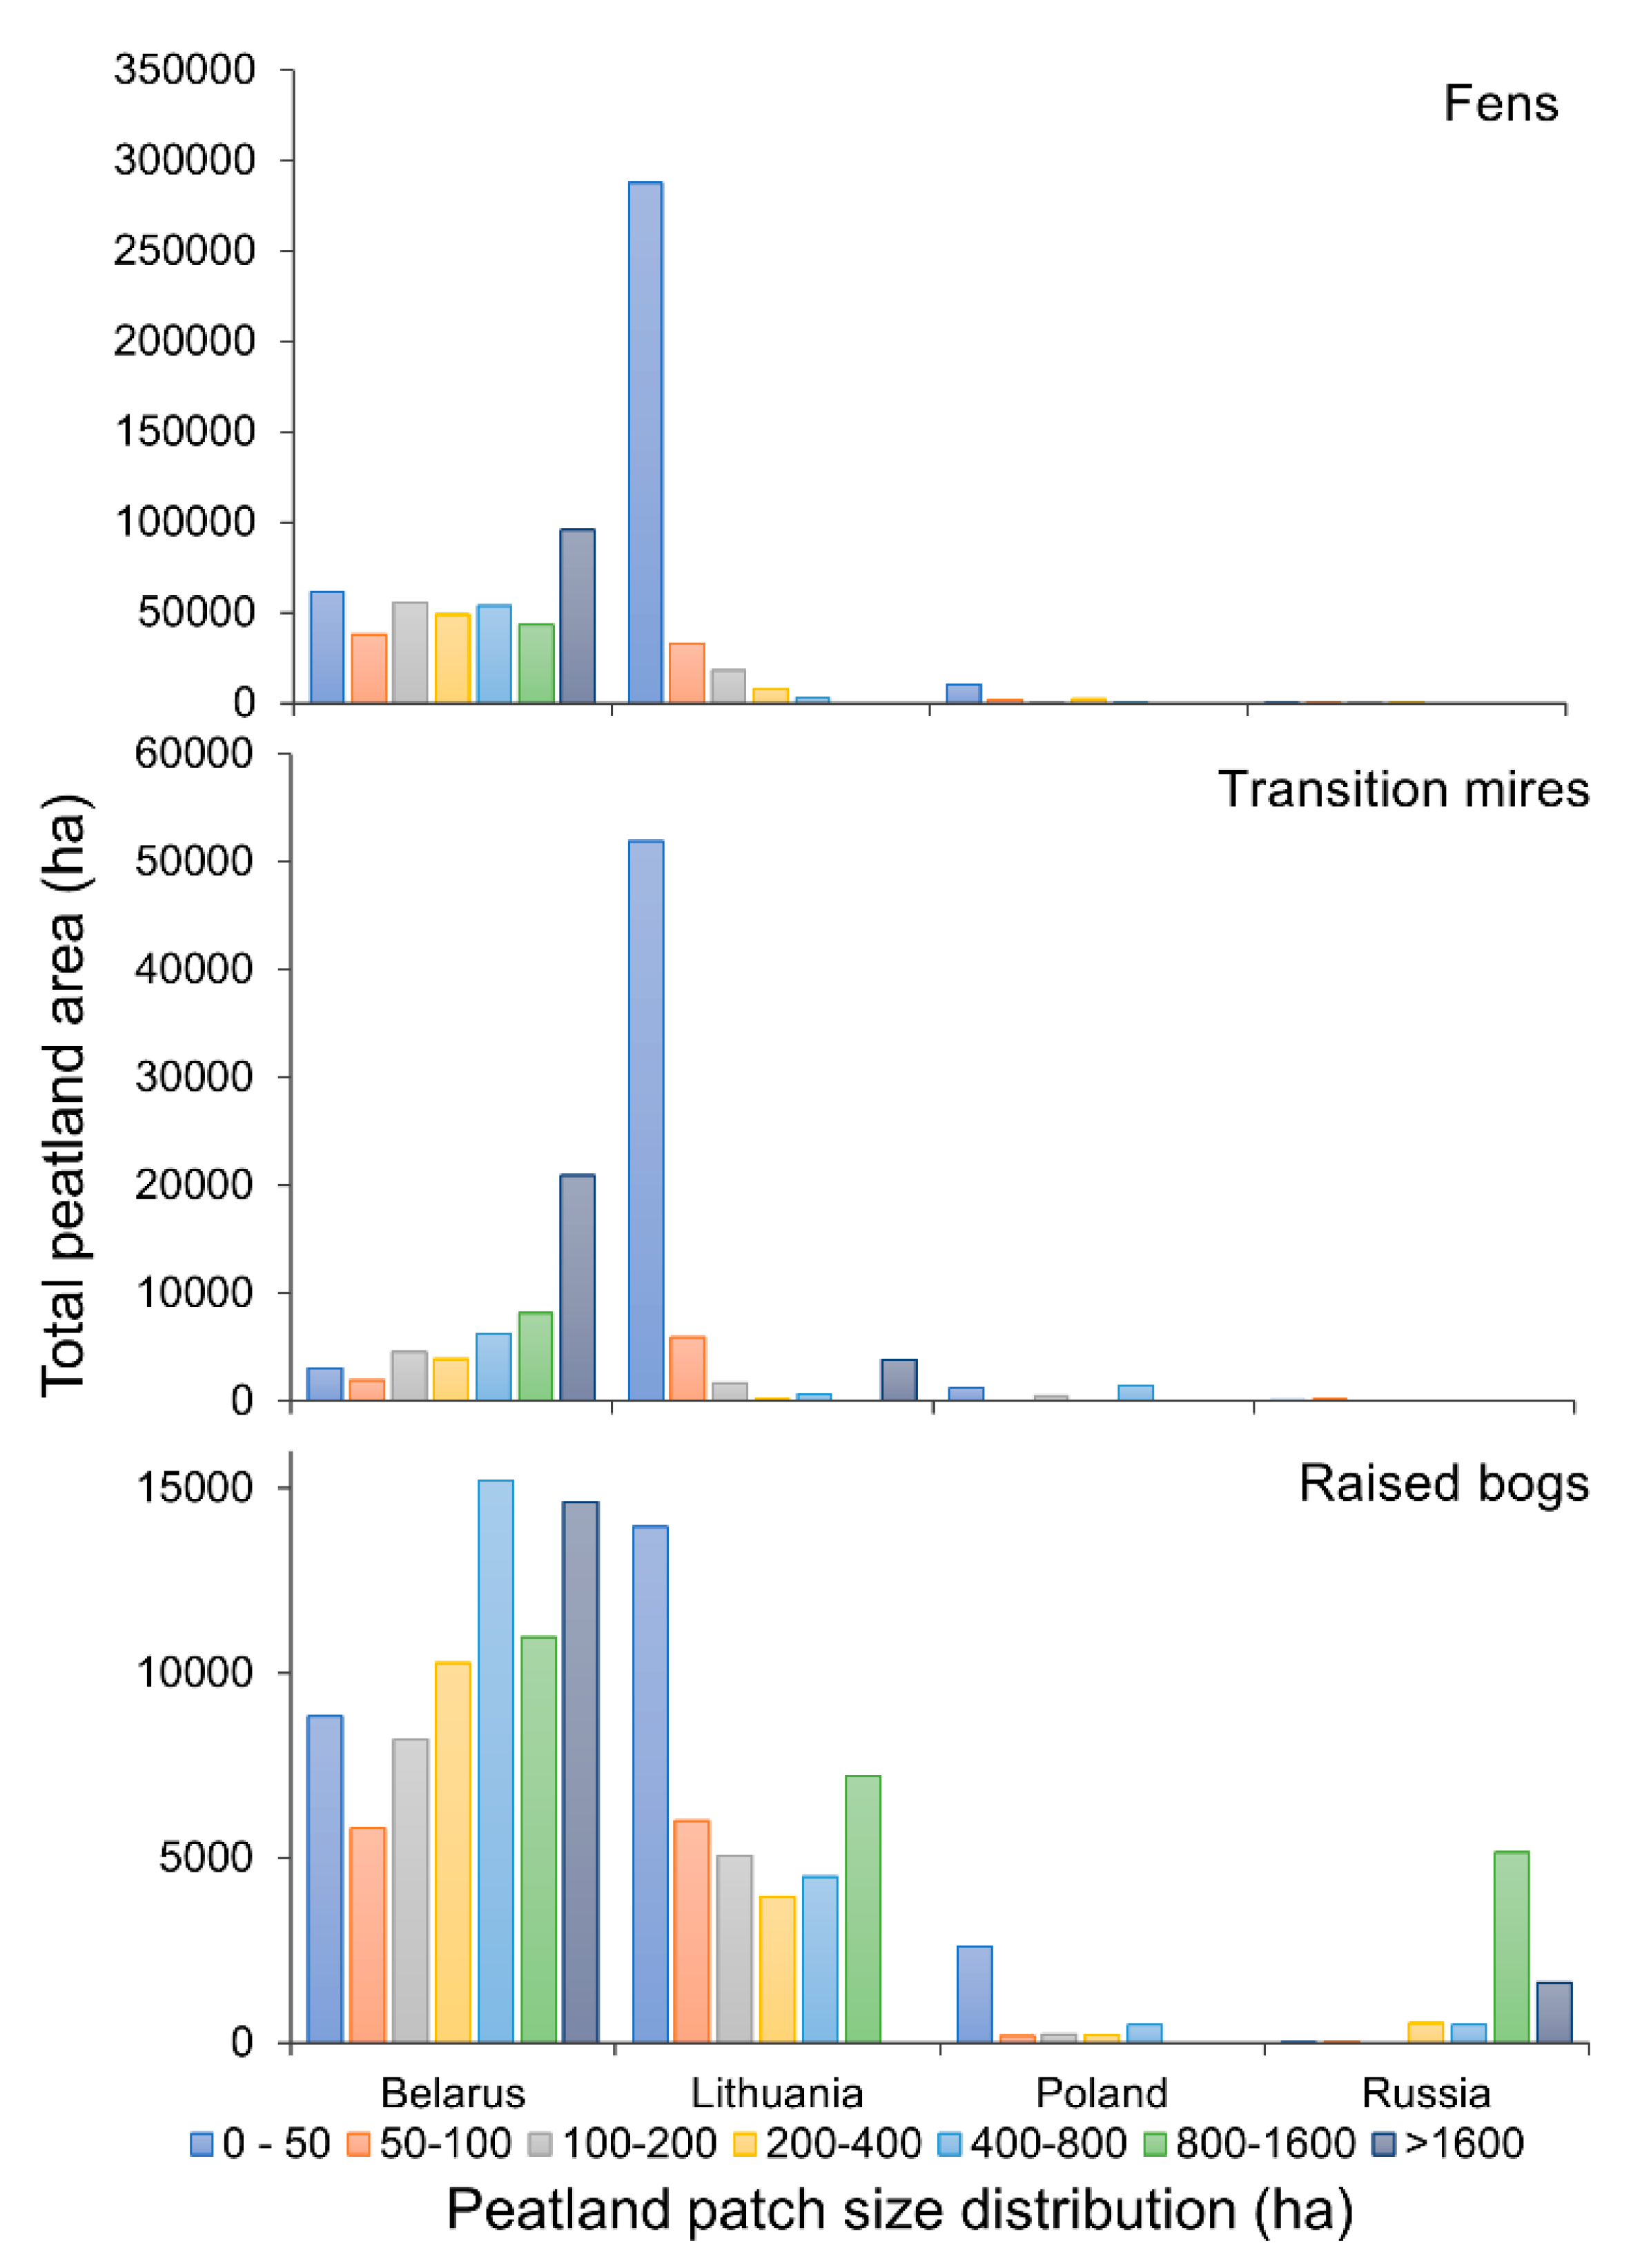
3.1. Distribution of Peatlands among Peatland Types and Sub-Basins

The Neman River basin peatland database consists of 1,006,802 ha of peatlands, with Belarus having the largest share (52%), followed closely by Lithuania (45%), while both the Polish and Russian parts of the Neman River basin contain only relatively small proportions of peatlands 2% and <1%, respectively (Figure 3). Dividing the peatlands by type showed that fens made up 76%, transitional mire accounted for 12%, and raised bogs accounted for 12%. Overall, 44% of the Neman River basin’s peatlands have been drained, with Poland recording the highest proportion of drainage 69% followed by Lithuania 66%, Russia 50%, and Belarus with only 23%, respectively. The allocation of peatlands by country and sub-river basin showed large variations in both Belarus and Lithuania. Given the small area sizes of the Polish and Russian parts of the Neman River basin, the sub-basins only contributed a small area amount.
Spatial analyses of the Neman River basin showed the mean peatland patch size distribution varied by country and peatland type, with Belarus having the largest mean patches size for both fens (62 ha) and transitional mires (153 ha), and Russia for raised bogs (657 ha). The smallest peatland patch size for fens and transitional mires was recorded by Lithuania with 5 and 7 ha, respectively. Poland recorded the smallest mean raised bog patch size with 9 ha (Table 2, Figure 4).

3.2. Gap Analyses

3.2.1. Overall Protection of Peatlands within the Neman River Basin at the National Level

In total, 26% of the Neman River basin’s peatlands are protected, with Poland having protected 90% of its peatlands. In Belarus, Lithuania, and Russia, the total area proportion of protected peatlands was much lower at 22%, 28%, and 26%, respectively. Thus, all four countries meet the CBD’s Aichi Biodiversity Target No 11 of 17% in terms of overall area (quantity) protection of peatlands within the Neman River basin.

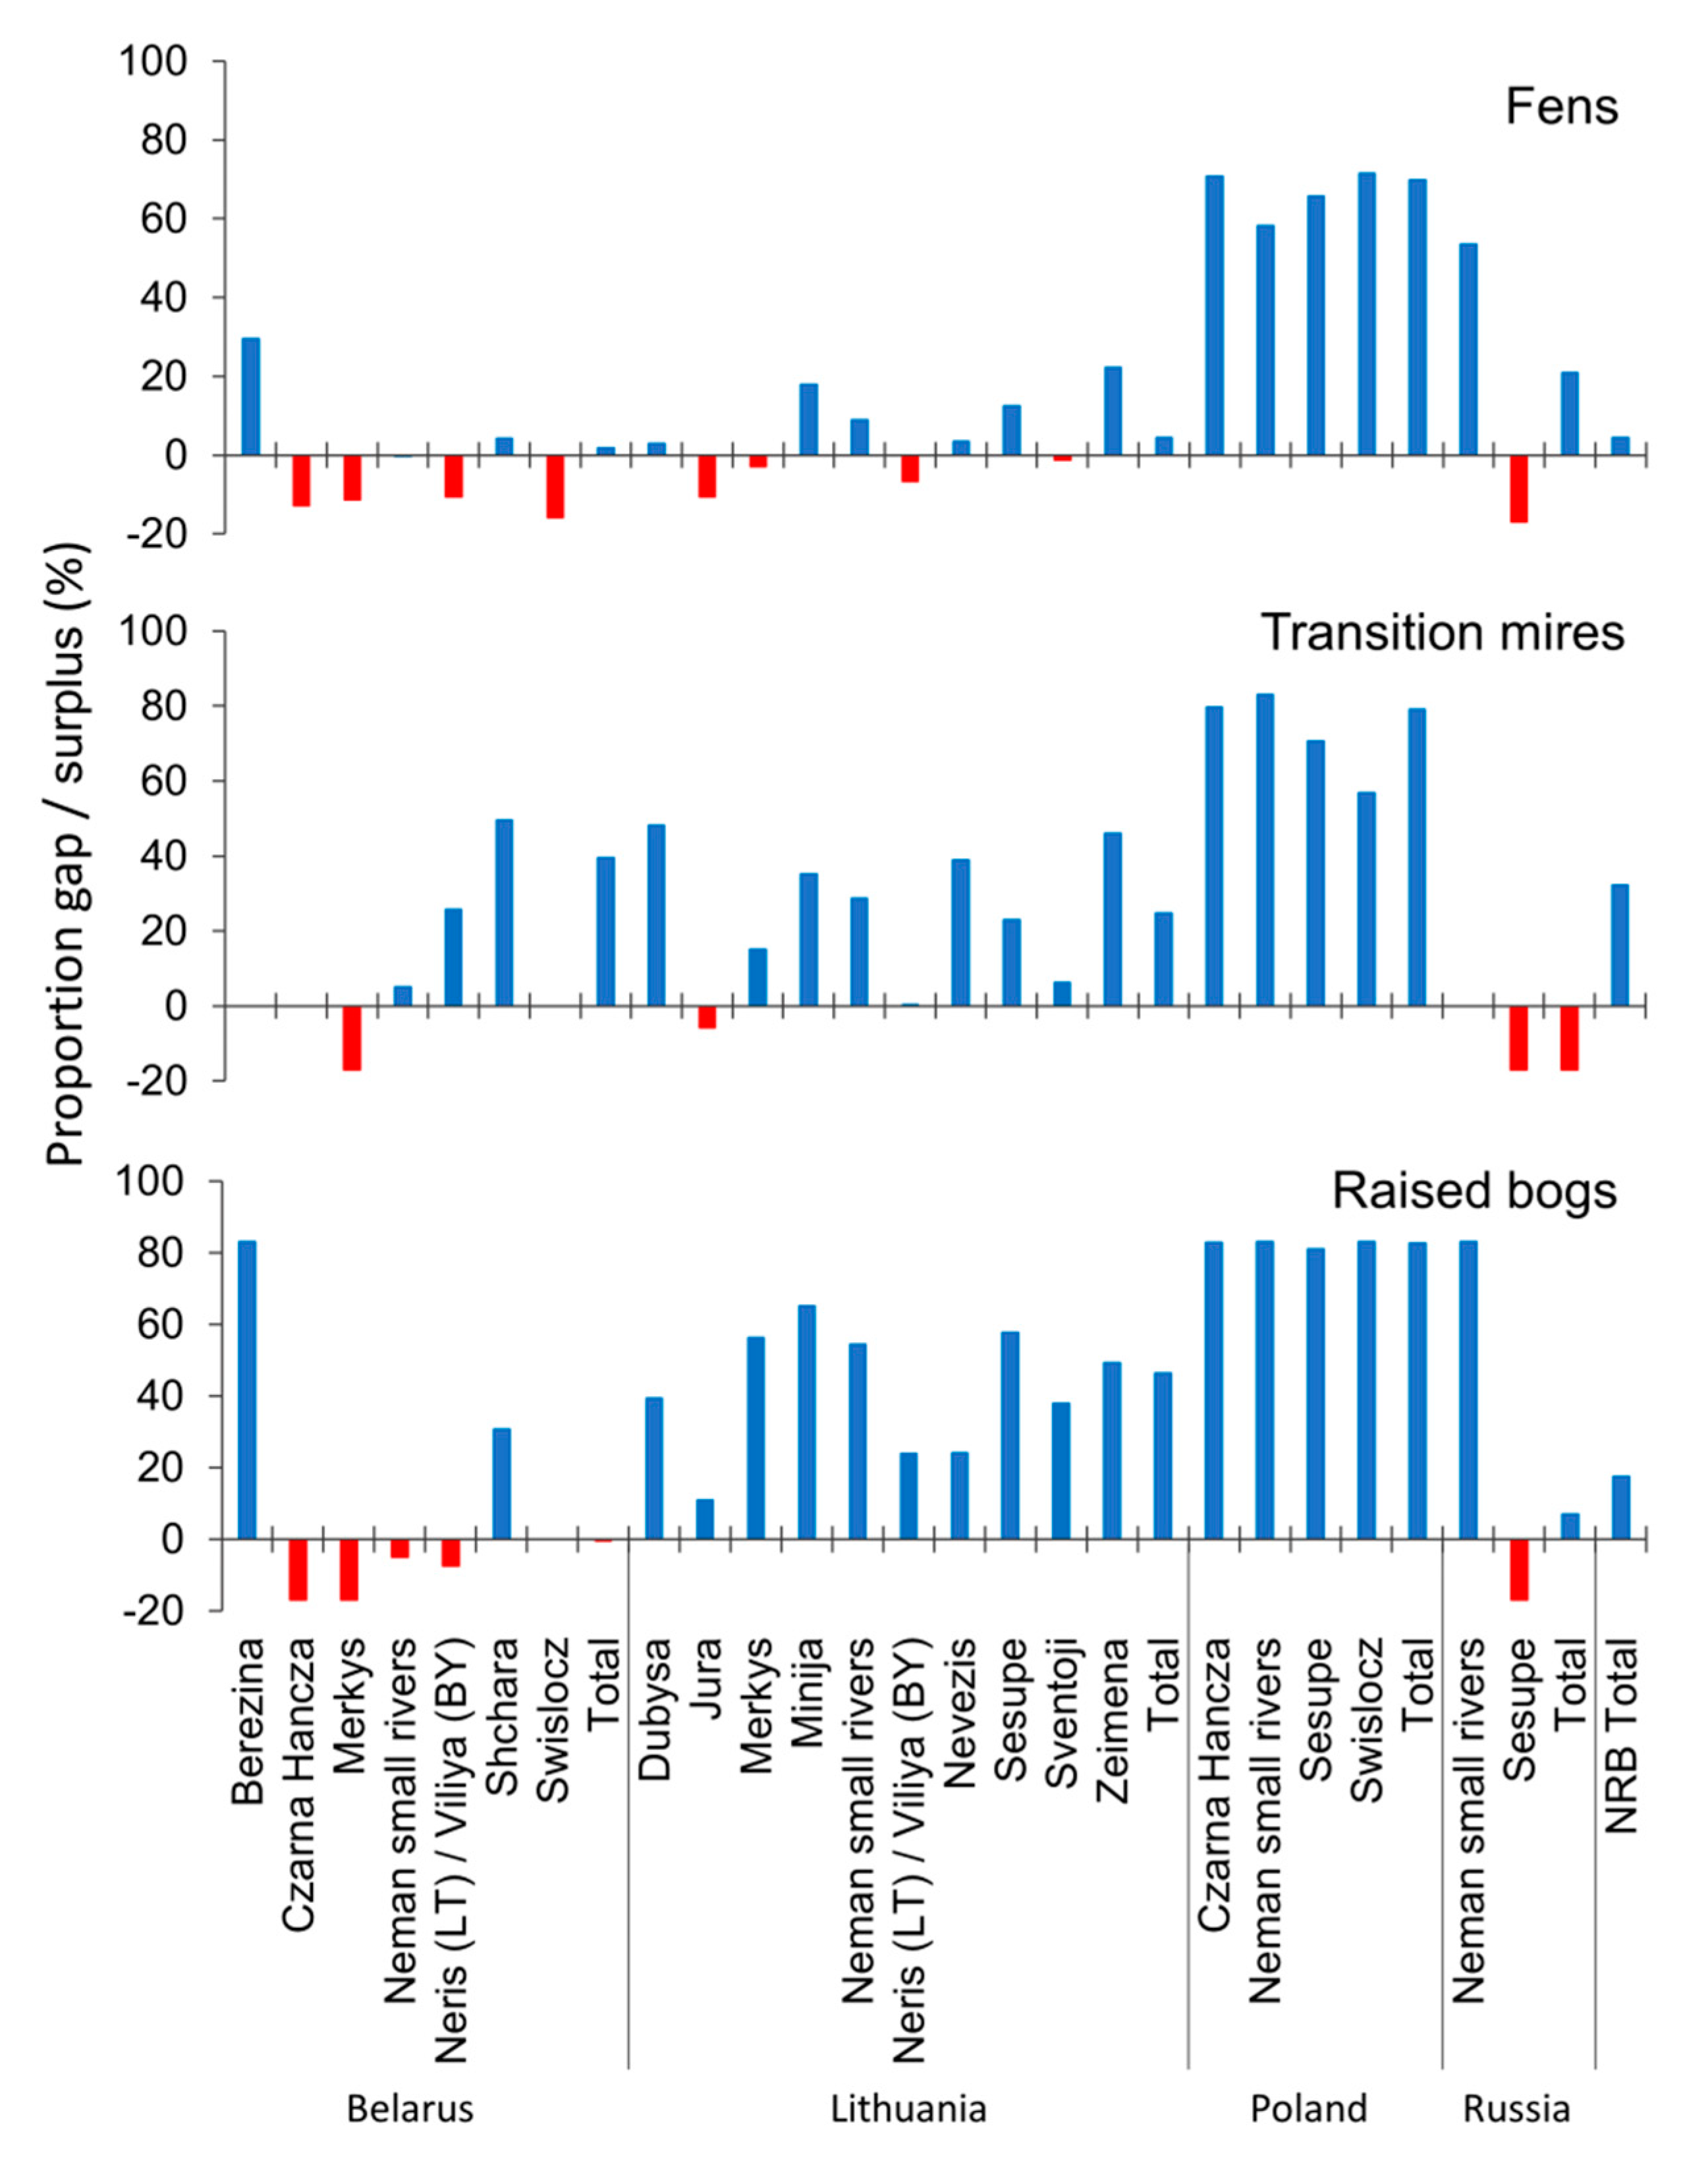
3.2.2. Regional Level by Peatland Type and Sub-Basin

At the national level, results showed surpluses in protection for all countries, with Poland leading the way at 70% followed by Belarus 21%, Lithuania 4%, and Russia 2%. However, at the sub-basin level, results showed that 9 out of the 23 sub-basins did not meet the CBD’s 17% protection targets for fens (Figure 5, Supplementary Material 1-Table S1). The Russian part of the Sesupe River sub-basin had the largest protection gap at 100%, whereas the Polish part of the Swislocz River sub-basin had the largest protection surplus, 72%.
Secondly, the analysis of transitional mires at the Neman River basin level showed an overall surplus in protection of 35% compared to the CBD’s [21] nominated target of 17%. At the country level, Poland recorded the largest protection surpluses with 79% followed by Belarus 39% and Lithuania 25%. However, Russia had a 100% gap in transitional mire protection. The results at the sub-basin level show that only 3 sub-basins had protection gaps and did not meet the CBD’s 17% target (Belarus—Merkys 100%, Russia—Sesupe 100%, and Lithuania—Jura 7% protection gaps) (Figure 5, Supplementary Material 1-Table S2).
Thirdly, the analysis of raised bogs at the Neman River basin level showed an 18% surplus protection compared to the CBD’s [21] nominated target of 17%. At a country level, Poland, Lithuania, and Russia recorded surpluses in protection, with an 83%, 46%, and 7%, respectively (Figure 5, Supplementary Material 1-Table S3). However, Belarus showed a 1% gap in protection of raised bogs. The results at the sub-basin level show vast differences in protection gaps and surpluses, with 3 sub-basins recording protection gaps of 100% (Belarus—Czarna Hancza and Merkys sub-basins, and Russia—Sesupe sub-basin). Only 5 of the 23 sub-basins by country did not meet the CBD’s 17% protection goals at this level of analysis (Figure 5).

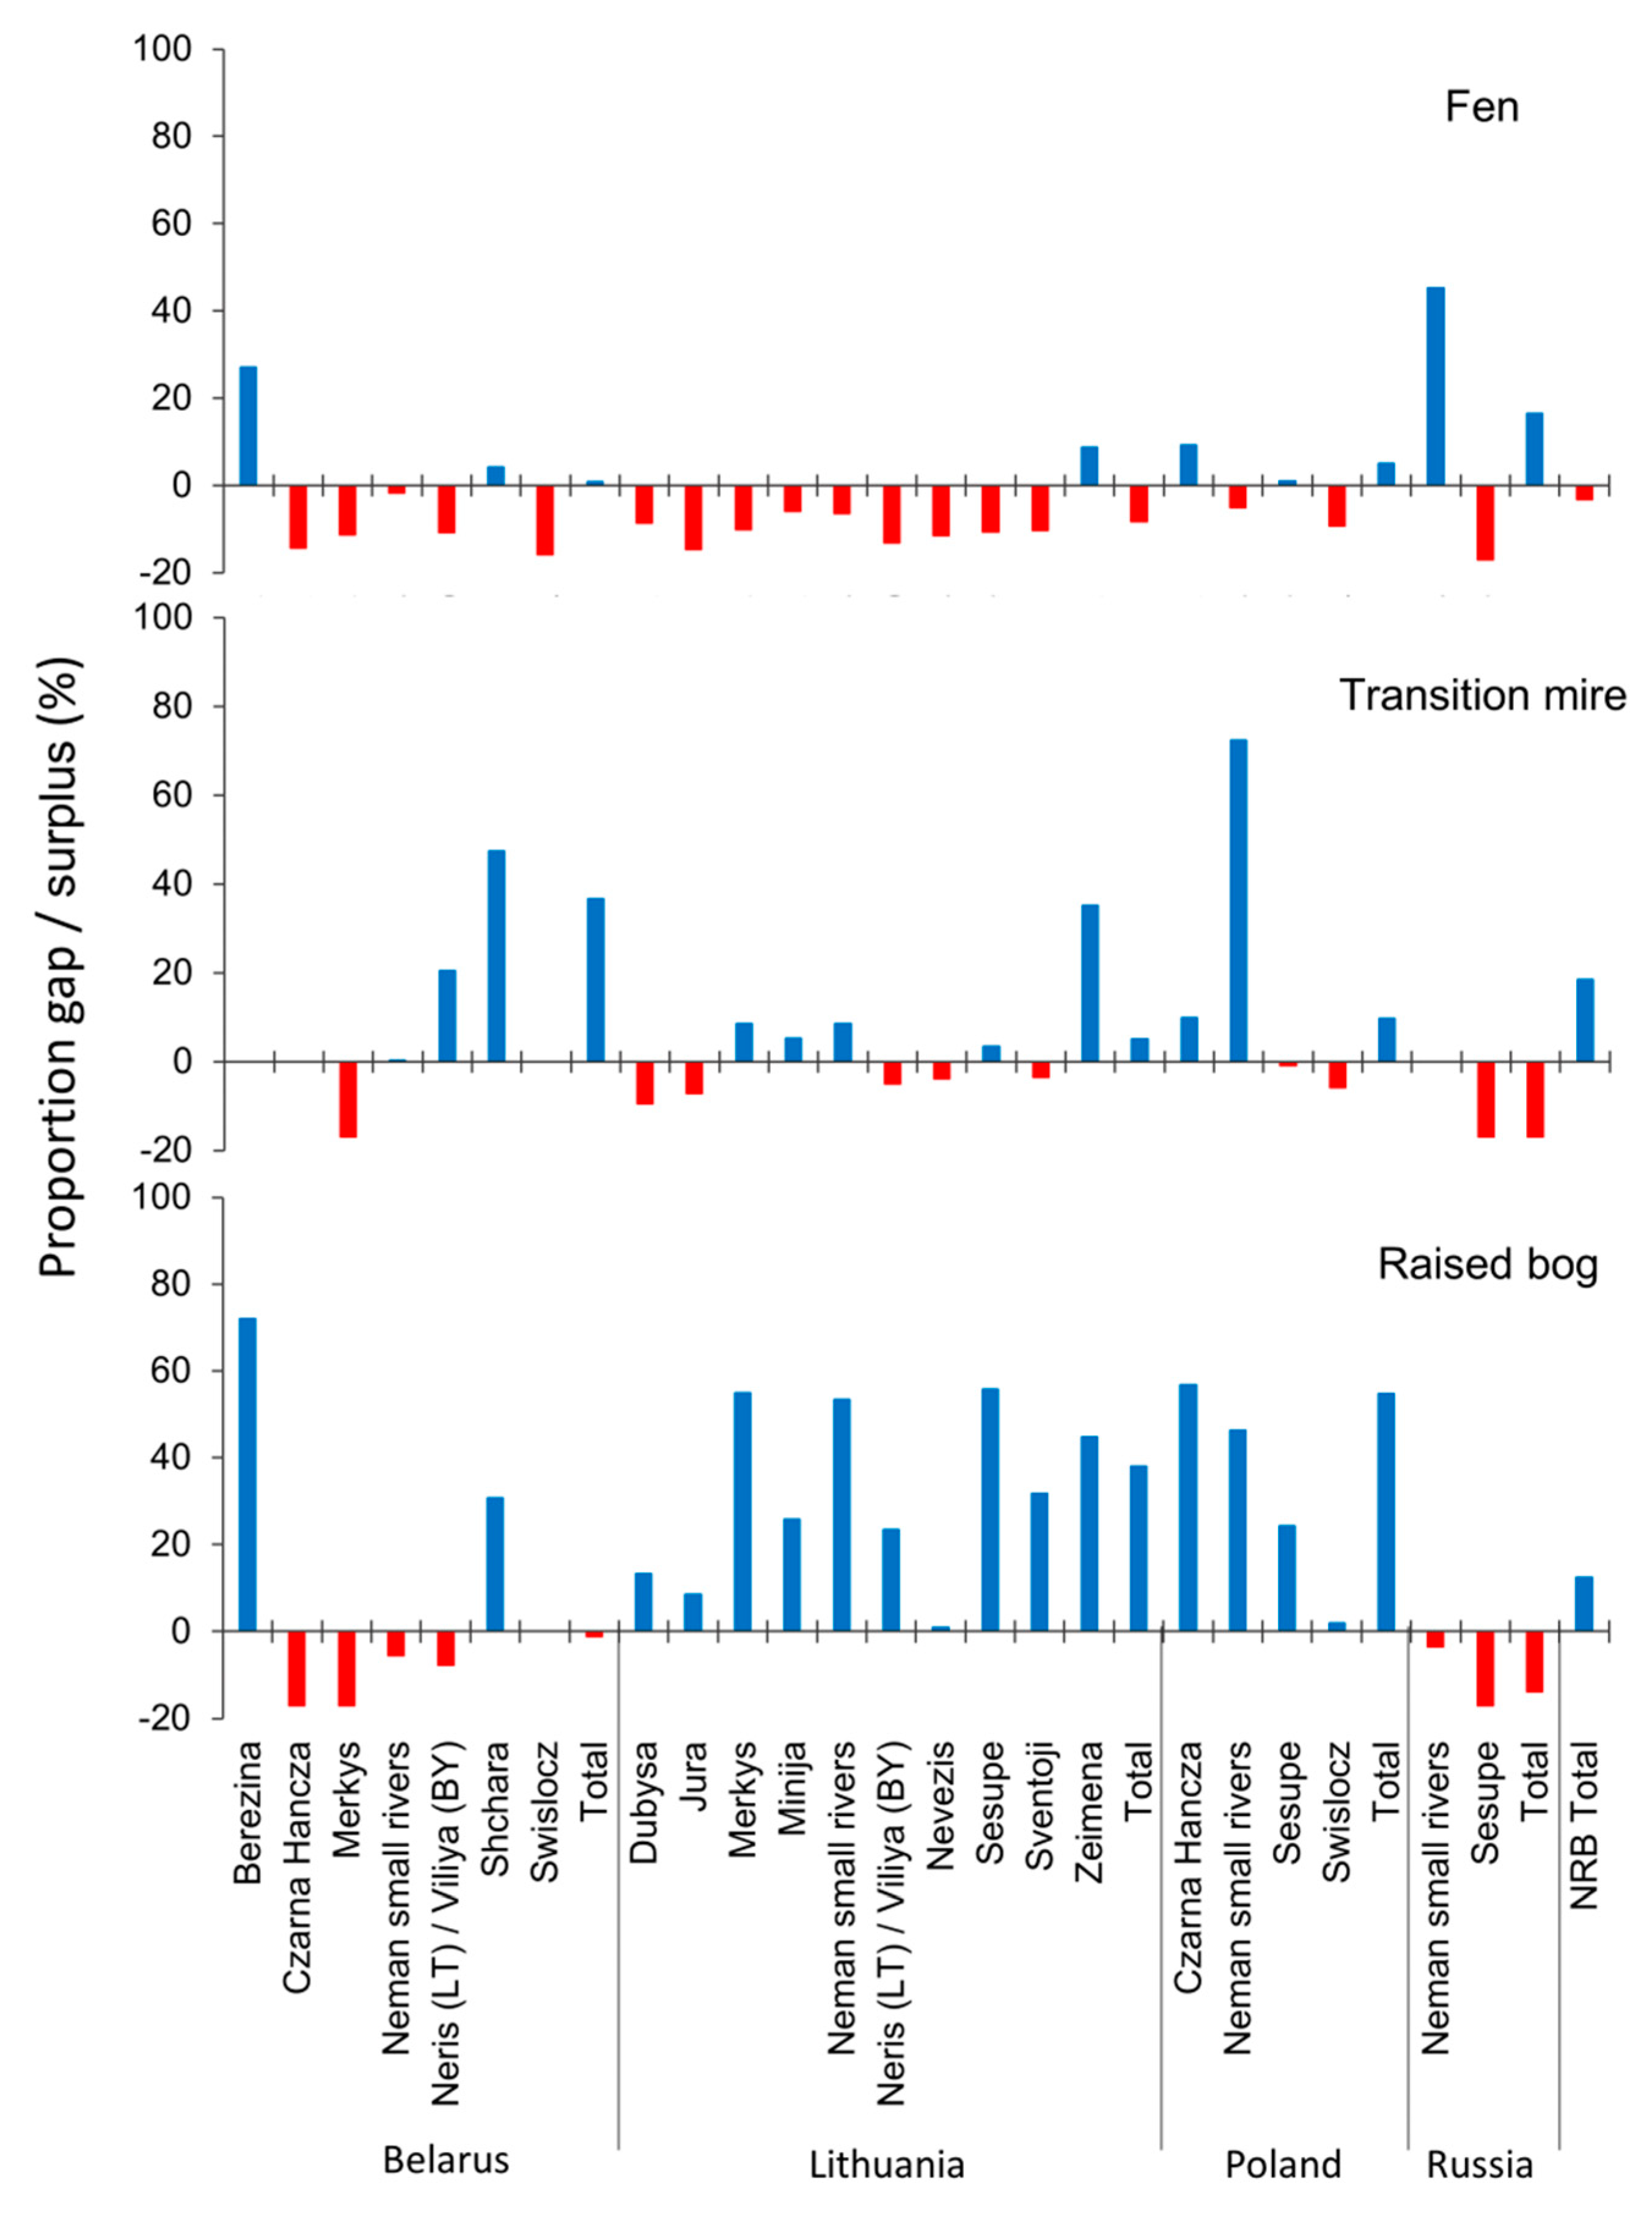
3.2.3. Impacts of Drainage

Our results show large variation at the finest level of the gap analysis for undrained protected peatlands. Firstly, the gap analysis for undrained protected fens showed a large decrease in protection, with an overall 3% gap in protection. At the sub-basin level, out of the 4 countries’ 23 sub-basins, 17 did not meet CBD’s 17% protection target (Figure 6, Supplementary Material 1-Table S1). Lithuania had the biggest overall protection gap (8%), with 9 out of 10 sub-basins not meeting the proxy target of 17%.
Secondly, the gap analysis for undrained protected transitional mires showed an overall surplus in overall protection of 18%. Indeed, three of the countries still meet the international target applied in this assessment, with a surplus in protection of 37% for Belarus, 10% for Poland, and 5% for Lithuania. However, at the sub-basin level, 9 out of 23 sub-basins did not meet CBD’s 17% protection goals (Figure 6, Supplementary Material 1-Table S2).
Thirdly, the gap analysis for protected undrained raised bogs showed an overall 12% surplus in protection at the Neman River basin level showed compared to the CBD’s (2010) nominated target of 17%. At this level of analysis, both Russia and Belarus recorded an overall protection gap of 1% and 14%, respectively. Out of the 4 countries’ 23 sub-basins, 6 did not meet CBD’s 17% protection goals (Figure 6, Supplementary Material 1-Table S3). Both Lithuania and Poland recorded surpluses in raised bog protection for all sub-basins.

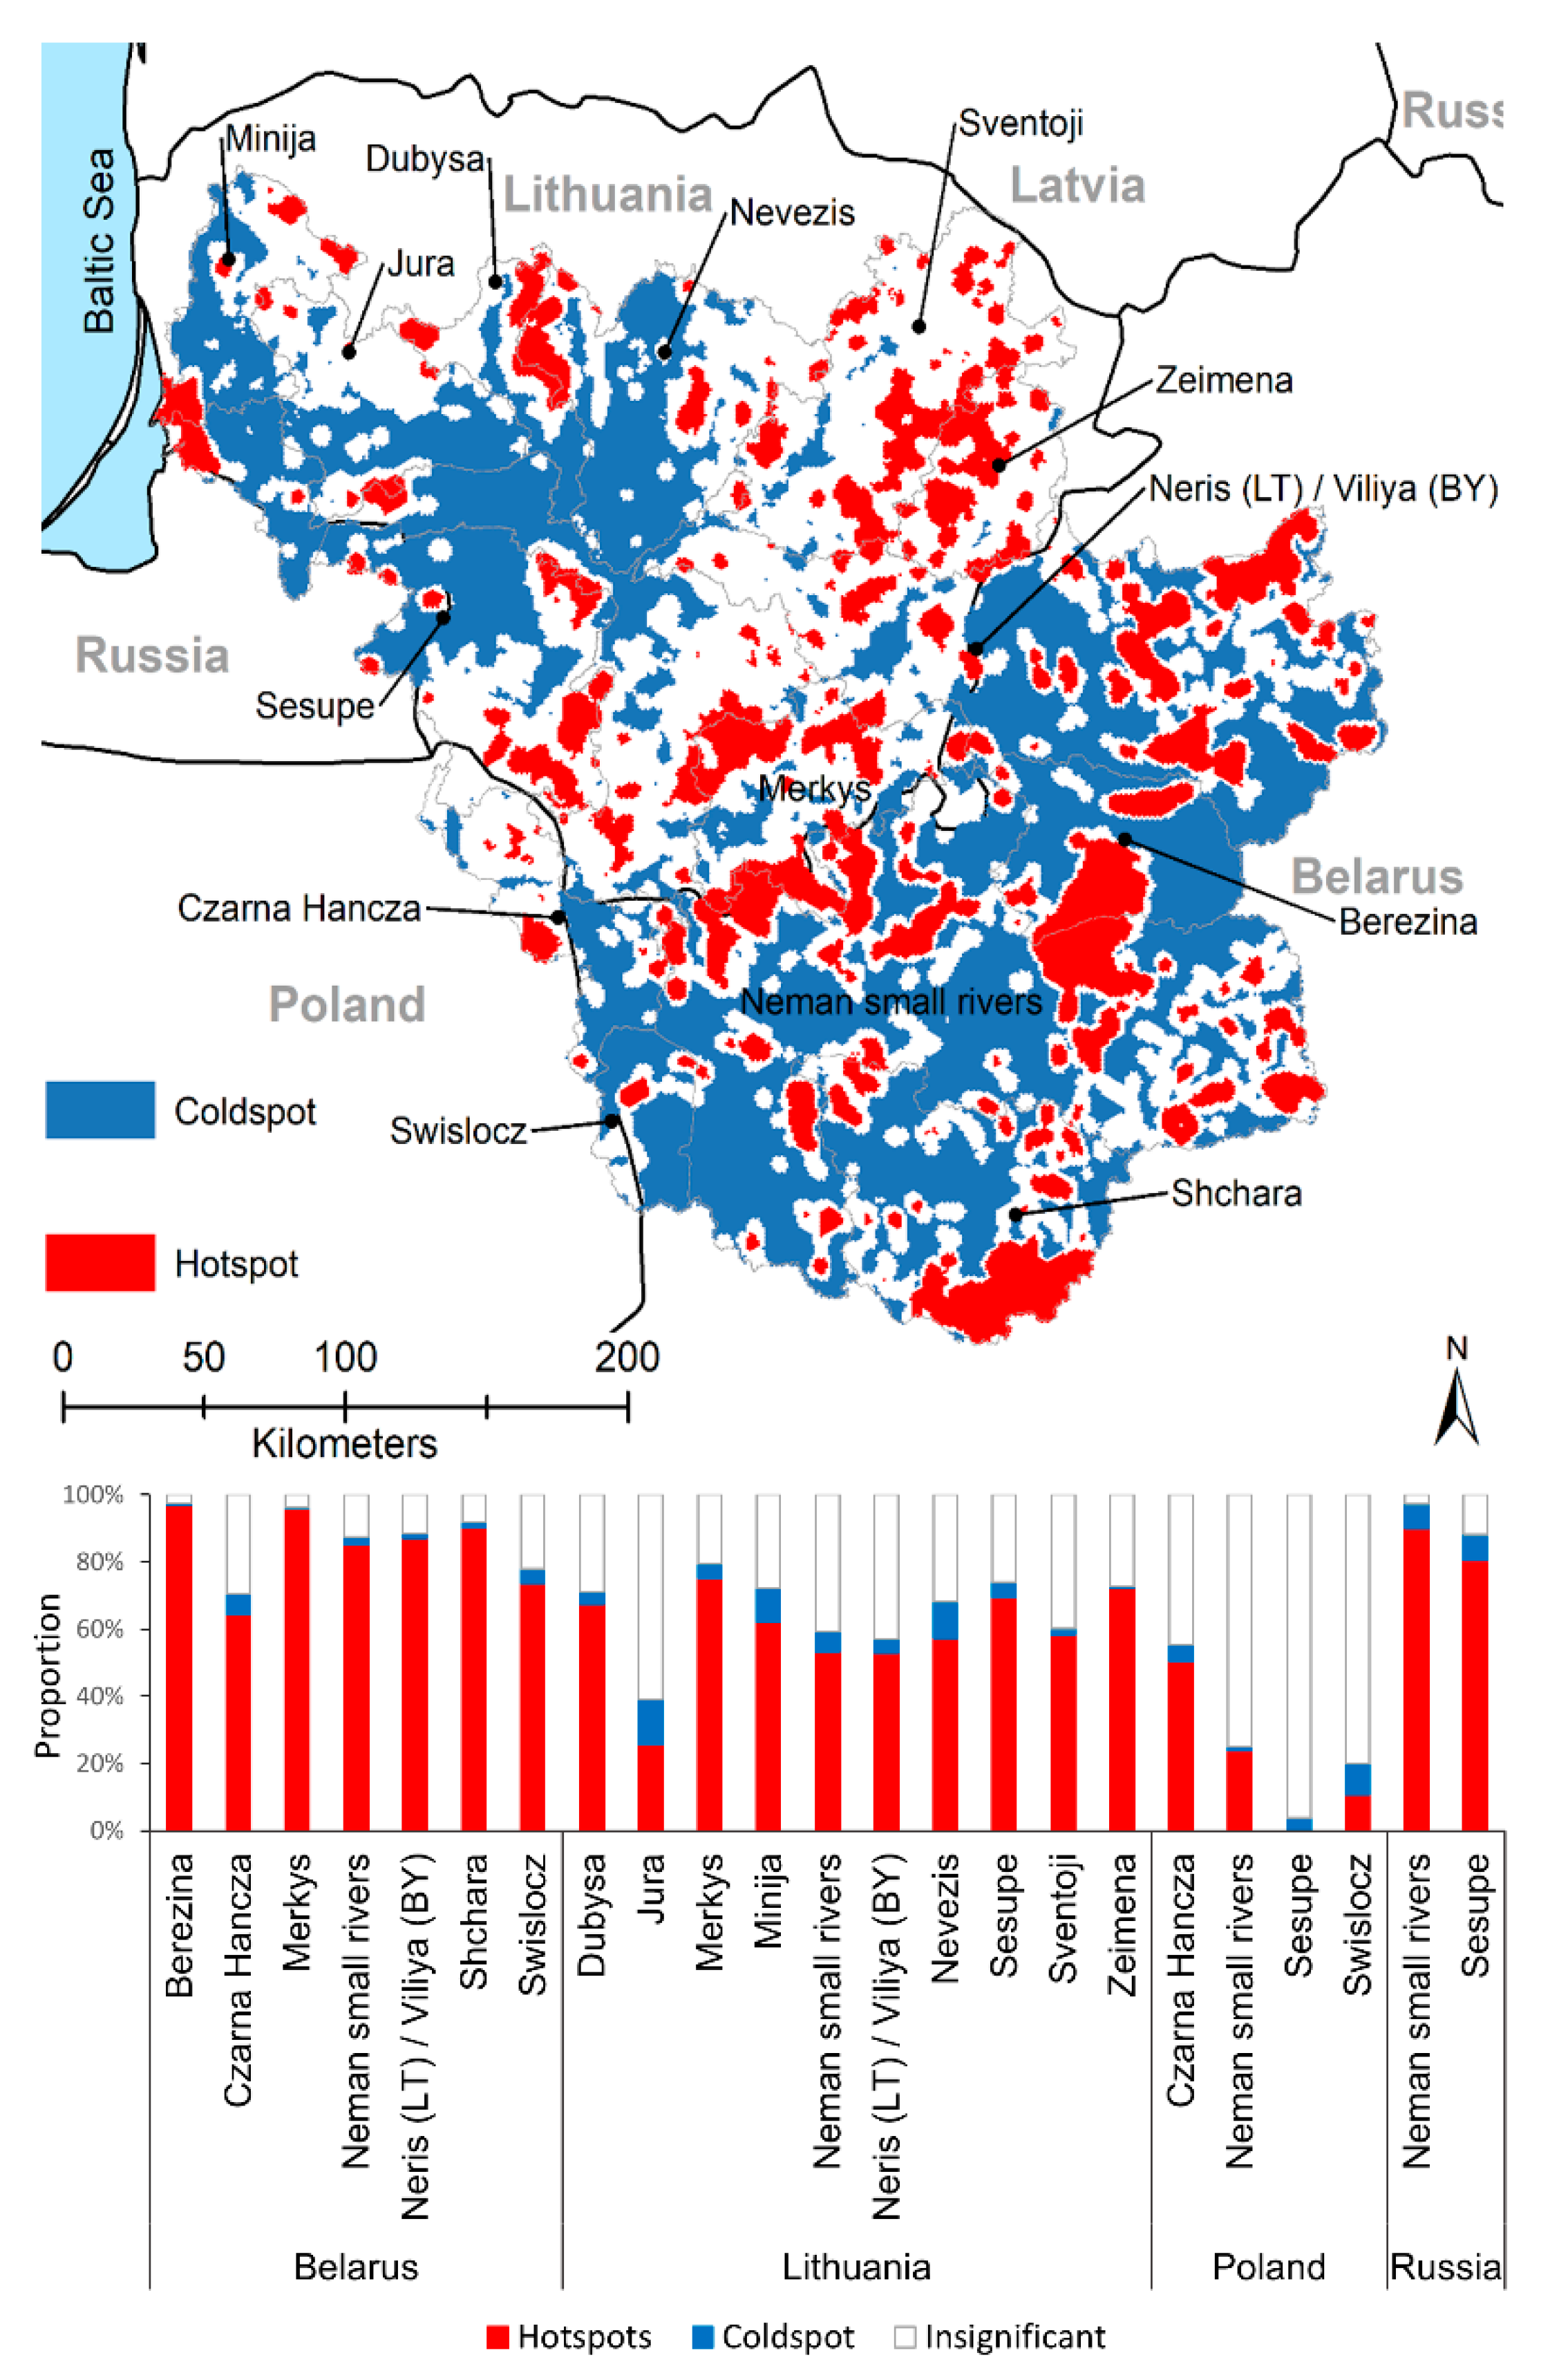
3.3. Priority Areas for Restoration

The cluster analysis identified that 747,830 ha (74%) of peatlands were within hotspots, that 35,068 ha were within significant coldspots, and that 223,904 ha were identified as neither a hotspot nor a coldspot (Figure 7). Results show Belarus had the most peatland hotspots (456,049 ha), followed by Lithuania (274,053 ha), Poland (9510 ha), and Russia (8217 ha), respectively.
The priority areas analysis of peatlands within the hotspots of Neman River basin showed firstly that while 27% of all raised bogs have been secured by protection, only 12% of both fens and transitional mires, respectively, have been secured (i.e., protected and are not impacted by drainage) (Table 3). Secondly, the results show that in total, 20% of transitional mires and 5% of both fens and raised bogs are available for restoration (i.e., they are protected and impacted by drainage) (Table 3). Thirdly, we show that availability of peatland for conservation (i.e., peatland that is not protected and is not impacted by drainage) consists of 34%, 30%, and 15% for raised bogs, fens, and transitional mires, respectively. Finally, results show that 24%, 27%, and 29% of fens, raised bogs, and transitional mire, respectively, are within the category of needing both conservation and restoration (i.e., not protected and impacted by drainage) (Table 3).

4. Discussion

4.1. Gap Analysis Is an Assessment Tool Supporting Planning

Supporting the need for strategic and tactical spatial conservation planning, this case study of the trans-border Neman River basin demonstrates a methodology to assess the opportunities for conservation, management, and restoration of different peatland types at multiple scales. The trans-border context offered several challenges for the establishment of a harmonised spatial peatland database, which could be overcome by international collaboration made possible through EU InterReg funding. The peatland size distribution showed that the proportion of peatland patches exceeding 100 ha (i.e., the approximate minimum area requirement for peatland umbrella bird species) can be used as a criterion to estimate peatland functionality [37]. This minimum area size is assumed to also ensure key ecosystem processes, and that subsequent ecosystem service benefits are secured.
Nationally, our gap analysis showed that the protection of peatlands meets the international conservation target for the Neman River basin. However, assessment of different peatland types, and the exclusion of peatlands that are negatively impacted by drainage resulted in large gaps in the quantity and quality of peatlands for some sub-catchments. Thus, restoration of peatlands is required to improve their quality. The results also showed that raised bogs were better conserved than the other peatland types (Figure 6). It is likely that this results from the larger size of raised bogs, and that they have been traditionally protected for years due to their inaccessibility and the larger costs to drain. This can be attributed to the perception that they are more ecologically valuable, being predominantly located on near-natural forest land. In contrast, fens and transitional mires, which are both relatively smaller in size and relatively uniformly distributed throughout the Neman River basin, have been subject to increased exploitation due to their greater economic value for agricultural use. Our results show that restoration is particularly needed for fens in agricultural landscapes, as they are both the most extensive (76 %, Figure 3) and also the most degraded peatland type, but the least protected type in the Neman River basin (Figure 6). Additionally, using a cluster analysis, we could identify the most important peatlands and the area amounts available for conservation and restoration for each Neman River sub-basin. These priority peatland areas should be the focal points for conservation, management, and restoration (Figure 7, Table 3).

4.2. Methodological Considerations That Underestimate Gaps

The peatland patch size distribution showed that both Belarus and Russia host larger peatland patches compared to Lithuania and Poland. This is due to both natural and anthropogenic factors. However, there are some caveats. For instance, in Lithuania, the peatland GIS layer was created using detailed spatial data [54], whereas in Poland and Russia, each peatland data set was created using remote sensing imagery validated in the field. However, for the peatlands of the Belarusian part of the Neman River basin, it can be argued that the peatland data was not of the same quality. In Lithuania, Poland, and Russia, we had peatland specialists on the ground, who could verify the data, whereas in Belarus, mapping such a large area is difficult, because data verification was lacking, and the high level of confidentiality of the spatial data. Thus, the results are less confident.
Moreover, considering the complex private landowner patterns in Lithuania and Poland, and subsequent difficulty for spatial planning of peatlands, would further decrease effective peatland patch sizes and increase fragmentation [72]. This applies in particular to fens. In Belarus, agricultural land is not subject to private ownership, thus management intensity is undertaken at an industrial scale [73]. In Russia, farming and agriculture is also dominated by industrial-scale operations [74], but there are also small landholders, which are in decline [75]. The collapse of the Soviet bloc in 1991 triggered large-scale land abandonment in Russia and Lithuania but not in Belarus and Poland [76]. Raised bogs, on the other hand, are usually embedded in forest landscapes, which are dominated by state ownership in Poland, Belarus, and Russia, and also in Lithuania, where only approximately 40% of forest land is privately owned [77].
Protected areas can be broadly divided into formal and voluntary [78], and management objectives and actions can vary enormously, from strict protection with no intervention to protected areas with management interventions. The four countries in the Neman River basin have different categories of protected areas, which are extremely complex and not harmonised. In the local context, the assignment of categories according to the IUCN World Commission on Protected Areas is thus extremely difficult [79,80]. In this light, we adopted a binary approach to peatland protection for this analysis. In summary, further data analysis on both land ownership and protection status is needed. We predict that such analysis would also show larger gaps in protection. Thus, we argue that the results in this paper are likely to be an underestimation of the protection gaps.
An important aspect of the gap analysis approach is the selection of the performance target that should be compared with indicators of ecosystem patterns and processes. In this study, we applied, as a negotiated and ratified performance target guided by evidence-based knowledge, the CDB’s Aichi Target No. 11 of 17% as a proxy for sustainable ecosystems. However, evidence-based targets rather suggest that 30-40% is a critical threshold interval and natural tipping point for sustainable ecosystems [28,29]. Additionally, qualitative targets need to be met. The recent EU Biodiversity Strategy for 2030 [20] has thus set a re-negotiated target of 30% to be protected by 2030 for Lithuania and Poland. Belarus and Russia have both committed to the United Nations; Convention to Combat Desertification. Belarus has set targets of at least 60% of degraded land (natural meadows, forest land, woodlands and forest plantations, bogs and land of water bodies) to be stabilized and 60,000 ha of peatlands to be rehabilitated by 2030 [81] and Russia is still defining its targets [82]. Thus, applying either original evidence-based qualitative and quantitative targets, or revised negotiated targets, would reduce any surpluses and increase the gaps in protected peatland areas.
In summary, the methodology applied in this study is a promising avenue towards supporting assessments of ecosystem patterns and processes as foundations for strategic and tactical conservation planning. Concerning performance targets, a comprehensive research agenda is needed to define and validate evidenced-based knowledge on the tipping points and thresholds for variables supporting the conservation of peatland patterns and processes, which affect water quality, water retention, nutrient filtration, carbon storage, and the maintenance of biodiversity.
A gap analysis can vary from simple exercises based on a spatial comparison of a particular landcover with existing protected areas in terms of quantity to complex studies that can also include quality (such as the drainage of peatlands in this study). Moreover, gap analyses can be further developed to assess multiple landcover representing both potential natural vegetation types and cultural landscapes [37,62].

4.3. A Call for Adaptive Maintenance Actions of Fens

Our results show that restoration is particularly needed for fens in agricultural landscapes. This is partly determined by the fact that fens were drained and converted into agricultural land very intensively during the 20th century throughout the Neman River basin. Sustainable management of fens and the implementation of paludiculture approaches could stop further degradation and significantly improve the water quality. Therefore, focusing on fens as the most degraded peatland type, we discuss protection, management and restoration alternatives, and effective ways to mitigate the negative effects of intensive agriculture.
The evolution of peatland ecosystems is controlled by regional climate, landscape topography, water supply, nutrient, natural (e.g., fire, flooding) and anthropogenic (grazing, mowing, draining) disturbances, and autogenic processes associated with aging of individual peatlands [53,83,84,85]. The aim of peatland restoration is to re-establish the desired vegetation and initiate self-regulatory mechanisms [86]. Hydrology is the critical element through the restoration of “pulse stability” [87], which maintains ecosystems’ specific structures and functions. Although establishing the relevant hydrology can be achieved relatively quickly, restoration of fully functioning peat-accumulating mire ecosystems is a long-term process involving both active and passive measures.
Peatland vegetation may be re-established through natural succession [88] or be assisted by active measures using seeding diaspore (mosses and vascular plants) transferred from donor sites, planting potted young plants grown from seeds or from rhizomes, and other actions [71,89,90,91,92]. This is less common in European restoration projects, where the regulation of hydrology and water chemistry dominates [86,93]. However, amelioration of internal eutrophication by sod cutting or topsoil removal, together with plant seeding, may be applied [71,89]. Passive restoration through natural re-vegetation is likely to succeed relatively quickly in fens [89]. However, the peat re-establishment action in mined peatbogs progresses very slowly and is even unlikely to succeed [94], thus requiring additional measures [90,95,96].
There are several trajectories of historic development of different peatlands types [84]. Fens are usually composed of large homogeneous patches with well-marked zonation from the waterlogged areas of riverbeds and oxbow lakes to the elevated edge-on parts of the valley that are not subject to inundation [38]. The typical vegetation of fens is relatively uniform and composed of ubiquitous and often expansive species. Habitats abundantly supplied with water are mainly occupied by Phragmites australis and Carex species, while Phalaris arundinacea, Calamagrostis canescens, Alopecurus pratensis, and Deschampsia caespitosa dominate the botanical composition of drier fen variants. According to Kołos and Banaszuk [97,98], the historic transformation of fens has resulted in five dominant vegetation types (Table 4). Most open wetlands ecosystems were developed in Eastern Europe to support animal husbandry through the removal of black alder (Alnus glutinosa) wet forests on floodplains. For centuries, they were transformed into wet meadows and pastures [99]. Regular mowing, grazing, and occasional fires maintained species-rich wet meadows and fen vegetation, and protected them from encroachment and overgrowing of shrubs and trees. Subsequently, intensive agriculture and widespread drainage of peatlands has led to a drastic decline in the area of species-rich wet grassland, meadows, and fens [37,100], and transformed the species composition [68,101,102,103,104]. Finally, numerous peatlands were drained for peat mining. Peat extraction has affected 4.2% of the raised bogs in the Baltic States [105], and in Belarus, peat extraction covers 11.7% of the total peatland area [106].
To conclude, re-colonization of desirable peatland species to form the “ideal” historically natural biotopes and habitats of focal species is difficult, costly, and time demanding, and often not possible. There is concern that restoration will not be sustainable or successful under the unknown condition of future environmental conditions [107]. Restoration may also create a novel ecosystem, with no past analogue that are far away from an “ideally reconstructed” ecosystem by referring to its historical predecessors [86,108]. However, they may nevertheless provide ecosystem services comparable to natural mires. In addition, the benchmark for landscape restoration depends on the timeframe used as a reference point [37]. Thus, understanding the history of peatland development, past trajectories, and current trends and states is of key importance.
Changes in vegetation are difficult to predict due to synergistic interactions and the stochastic nature of these processes [109]. Fens are the most important mire type supporting the “kidney” and biodiversity conservation functions in sub-catchments. However, open fens require ongoing management to maintain their ecosystem functions [68]. This includes grazing of fens throughout late spring, summer, and autumn with low densities of large herbivores [110] or traditional mowing of fens to hinder the regeneration of trees (mostly Alnus glutinosa and Salix spp.) and the encroachment of shrubs [98]. Mowing should be performed at the beginning of August when plant species have finished flowering, so that seeds have had a chance to germinate in exposed areas, and wetland birds have finished nesting.
In addition to direct peatland restoration efforts through re-wetting, the establishment of wetland buffer zones surrounding peatlands can significantly improve water quality by filtering agricultural pollutants (mainly N and P) from the outflowing water by 43% for N (at a load of >500 kg N/ha/yr) and 21% for P (at a load of 20 kg P/ha/yr) [111]. Hence, a landscape perspective is needed, both in terms of spatial extent, and by considering landscapes as social-ecological systems [112].

4.4. Planning

4.4.1. Framing Peatland Restoration

To advocate restoration of peatlands, there are several relevant concepts that aim towards both balancing and maintaining landscapes’ goods, services, and values, to mitigate global change and thus securing human well-being [113]. Firstly, the ecosystem services concept was presented in the 1980s, within the context of biodiversity conservation [114], and refers to “the direct and indirect contributions of ecosystems to human well-being” [14]. Ecosystem services emphasize societies’ dependence on nature. However, this concept has been criticized, as it fails to include the complexity of both natural systems [115] and social-ecological systems [116,117].
Secondly, to support the vision of sustainable social-ecological systems, the landscape service concept was proposed to endorse participatory landscape planning [118]. The use of this concept is attractive to stakeholders from social and business disciplines [119] and can help facilitate inter- and trans-disciplinary research involving both researchers and practitioners [120]. The differences between ecosystem services and landscape services have arisen from the difference between an ecosystem viewed as a natural science phenomenon, and landscape as one integrating biophysical, anthropogenic, and perceived dimensions of social-ecological systems [121]. Moreover, landscape services have been deemed to address the spatial heterogeneity of landscapes more adequately [122].
Finally, “Nature’s Contributions to People”, which is used in the assessment by IPBES [123], acknowledges the central role that culture plays in defining all links between people and nature, and focuses on the role of indigenous and local knowledge [124]. While some believe that there is no fundamental difference between Nature’s Contributions to People and ecosystem services [6], others claim that the ecosystem services concept already covers social sciences and other topics [113].
Irrespective of the framework chosen for analyses and valuation of peatlands, as a foundation for comprehensive spatial planning, portfolios of value items need to be identified, and the extent to which they are rival needs to be assessed. Gap analysis is such a tool. Adding analyses of spatial relations between particular complexes of peatlands in the Neman River basin, on top of indicating the data-supported needs for conservation and restoration, is an important foundation for the planning of peatland protection, management, and restoration. This applies both to ecosystem functions and conservation of habitat patterns for focal species.
Knowing the physical features of peatlands as well as their status may help in prioritising restoration oriented at systematic provision of ecosystem services. Referring to possible gains from increased water retention in rewetted mires to artificial retention in the catchment may indicate the relevance of restoration for mitigation low flows, acting simultaneously as a nature-based solution for reducing flood risk throughout the catchment [125]. Interrelation between the sites to be re-wetted and preserved may optimize a large-scale facilitation of nutrient retention in wetland buffer zones [111]. One should also consider that the costs of restoring wetland buffer zones are expected to be lower than the values of gains expressed as ecosystem services provided by the restored sites [84]. For instance, Valasiuk et al. [68] showed that citizens in Belarus are willing to pay a substantial amount of money for peatland habitat conservation, restoration, and maintenance for wetland birds, such as the aquatic warbler. This would support other key peatland functions, such as water retention, nutrient filtration, carbon capture, and support wetland biodiversity. Thus, restoration and integrated management of peatlands to combat land-degradation, through the provisions of water retention, nutrient filtration, carbon capture, and biodiversity maintenance, can have multiple positive societal impacts [126,127]. Concerted action for the protection and wise use of peatlands should therefore be a global priority linking planning and restoration activities at global, regional, and local levels.

4.4.2. Including Peatlands in River Basin Management Plans and Agricultural Strategic Plans

Our results emphasise the need to include peatland conservation in River Basin Management Plans and Agricultural Strategic Plans. For example, peatland re-wetting combined with paludiculture can provide win-win-options for various aspects of society, including social (additional employment in rural areas), economy (alternative incomes in agriculture), and environment (ecosystem services, substitution of fossil resources). Peatland conservation and restoration cuts across most United Nations Sustainable Development Goals and should be an instrumental part of the European Green Deal [16].
Regarding water policies, such as the EU Water Framework Directive, peatlands are still not adequately considered in the Neman River basin management plans (RMMPs), neither in terms of water retention, nutrient filtration and carbon capture [128], nor biodiversity conservation. This is in spite of positive affects at the entire sub-basin level. Therefore, the European Commission recommends the integration of wetlands including peatlands into the RBMP of the Water Framework Directive in its guidance for implementation [129]. This guidance should be adequately followed in drafting the update for the RBMPs of the Neman River catchment in the EU Member States Poland and Lithuania.
Besides water policies, agricultural policies, such as the EU Common Agricultural Policy (CAP), are the main drivers for management of drained organic soils including extensive drainage activities. Peatlands require a specific management approach due to their unique soil conditions. To maintain the carbon and nutrient stocks and reduce the release of large emissions, the raising of water levels up to or close to the soil surface is required. As a guiding principle, no landowner or user in the EU should be economically or socially disadvantaged by maintaining wetlands or developing re-wetted peatland management. This should be addressed by coherent standards for agricultural practices on peatlands and focused agri-environmental and climate schemes (AECSs) incentivising climate-smart water management, paludiculture, and implementation of wetland buffer zones. In the new CAP, which is currently under negotiation and will likely start in 2023, standards will set as conditionality with specific ‘Good Agricultural and Environmental Conditions’ (GAECs) [130]. For peatland management and water quality, two proposed GEACs are of special importance: GAEC 2—Preservation of carbon rich soils such as peatlands and wetlands and GAEC 4—Establishment of buffer strips along watercourses [130]. The detailed definition of the conditionality standards will be part of the National CAP strategic plans, which needs to be ambitious to fulfil other policy target—namely climate change mitigation and water quality.
Agri-environmental and climate schemes are programmed within the second pillar of the CAP, but the direct payments are contained within the first pillar. So far, the payments mostly serve biodiversity conservation purposes in the EU Member States. However, payments for the re-wetting and raising of water levels, which are instrumental towards mitigating climate change, are not included [131,132]. Thus, the payment schemes should be changed to support fit-for-purpose interventions described in the CAP strategic plans. For an overview of the different policy options for peatlands in the CAP, see Tanneberger et al. [16]. However, beneficiaries within the EU are individual farmers that operate as business enterprises. This complicates co-ordination among neighbouring landowners and often results in short-term commitments to managing individual landcover patches with many landowners. This could be solved by measures like AECS designed for environmental cooperatives of farmers [131] or with special programs for consolidation of land parcels. The complexity of land ownership in both Poland and Lithuania requires further analysis. Additionally, more harmonized information about possibilities of climate-smart management of wet organic soils in the Neman River basin including both EU and non-EU countries is needed.

4.4.3. Learning from Top-Down vs. Bottom-Up Legacies

Cross-border governance of peatlands is complicated by biophysical, historical, cultural, economic, and natural dimensions and the social-ecological system. All four countries that contain the Neman River basin were either part of the Soviet Union or part of the Soviet eastern bloc states with social systems characterised by state-centric top-down management control. Thus, there are several kinds of transitions affecting the approaches to planning and governance.
During the Soviet period (1922 to 1991), centralised planning ensured that peat extraction was concentrated in regions with significant peat resources. The gaps in peatland conservation between fens and raised bogs can be explained by traditional nature conservation where most protected areas were designated on forest land. In contrast, agricultural lands were managed for production and economic output and were not considered for nature conservation. Thus, many of these constraints were related to institutional, socio-cultural, biophysical, and economic legacies of the Soviet and post-Soviet periods. The collapse of the Soviet bloc changed this; currently, peat extraction locations are determined by market-economic demand and agricultural lands are becoming important areas for nature conservation. However, EU bureaucracy and complex stakeholder portfolios also offer numerous governance challenges for Lithuania and Poland, which calls for actions at multiple scales [133].
The European Union’s eastern border can be viewed as a fault line regarding the past level of modification of ecosystems with better conservation status in the East than the West [43,134]. Across Europe, peatland exploitation, protection and restoration have started to develop during different time periods, and at different basic levels of past transformation and rates of change [37]. While in the East, a significant proportion of natural mires have been retained, most other countries in the West have suffered severe losses [17]. The Central European trans-border regions, and regions where topography or other features hamper economic development, therefore often host valuable natural and cultural heritage [43,135]. This has led to improved retention of biodiversity, including species, habitat networks, and natural processes, compared to Western Europe [136], and cultural values [137]. However, regions located along the eastern border of the EU currently stand at a crossroad between increased production for economic benefits and the need for nature conservation [138,139]. Although Belarus still has a strong state-centric management control, they have been able to develop flexible nature conservation legislation, which has translated into success stories for peatland protection, management, and restoration [40]. This includes broader public awareness on nature values and ecosystem services in Belarus [68].
Therefore, central and eastern Europe’s trans-border regions and landscapes are of particular importance for knowledge production and learning towards sustaining a wide variety of different ecosystems, ranging from those remaining with high levels of naturalness (i.e., raised bogs) to those built on traditional low-intensity farming including animal husbandry (i.e., fens). While the former requires protected area networks that allow natural disturbances, the latter requires maintenance of traditional multifunctional agricultural systems. This means that both historic permanent loss of peatlands as potential natural vegetation, and current transition trajectories in both ecological and social systems need to be understood [140,141]. However, trans-boundary collaboration both in terms of planning and management practices is not coherent because legislation and spatial planning are not effectively linked among countries [138].

5. Conclusions

This case study and the resulting discussion on the maintenance of peatlands through conservation, management, and restoration within the trans-border Neman River basin shows that the setting and interpretation of quantitative evidence-based performance targets need to be complemented with qualitative targets that mirror both ecosystem patterns and processes. At a national scale, all four countries meet the quantitative area protection targets for peatlands within the Neman River basin. However, factoring in additional qualitative aspects, including peatland type and history of drainage, shows that there are large protection gaps in some sub-basins. Fens were the dominant peatland type but also the most degraded and least protected. Our systematic regional gap analyses show that peatland restoration with sustained actions for maintenance is required, and the cluster analysis identified priority peatland hotspots for these actions. Thus, this study emphasises the need to include peatland conservation, management, and restoration into river basin management plans and agricultural strategic plans, and that planning should be adapted to meet the needs of different social-ecological systems. Comparative studies of trans-border regions can encourage knowledge production and learning about the past and current states and trends of both natural and anthropogenic peatlands. The governance and management of different green infrastructures, like peatlands, for human well-being is a concrete and suitable topic for place-based development cooperation among EU and non-EU countries. This requires research that integrates policy makers, planners, and stakeholders, as well as disciplines that mirror social-ecological systems, including landscape ecology, conservation biology, sustainability science, environmental policy, governance, assessment, and planning.

Supplementary Materials

Supplementary Material 1: Outputs of the Neman River basin peatlands gap analysis (Tables S1–S3) https://www.mdpi.com/2073-445X/10/2/174/s1.

Author Contributions

Conceptualization, M.M. and P.A.; methodology, M.M., E.M., and P.A.; formal analysis, M.M. and E.M.; investigation, M.M.; data curation, M.M., N.Z., A.K. (Andrzej Kamocki) and M.N.; writing—original draft preparation, M.M., E.M. and P.A.; writing—review and editing, M.M., P.A., E.M., P.B., A.K. (Aleksander Kołos), A.K. (Andrzej Kamocki), M.G., M.S., L.J., N.Z., J.S., J.P., M.N. and W.W.; visualization, M.M.; project administration, W.W.; funding acquisition, W.W. All authors have read and agreed to the published version of the manuscript.

Funding

This research was funded by the Interreg Baltic Sea Region project DESIRE (Development of sustainable (adaptive) peatland management by restoration and paludiculture for nutrient retention and other ecosystem services in the Neman River catchment) Index number R3071, project number #R091 implemented in the framework of the Interreg Baltic Sea Region Program, co-funded by the European Regional Development Fund.

Institutional Review Board Statement

Not applicable.

Informed Consent Statement

Not applicable.

Data Availability Statement

Data used in this study can be found and downloaded at www.neman-peatlands.eu.

Conflicts of Interest

The authors declare no conflict of interest. The funders had no role in the design of the study; in the collection, analyses, or interpretation of data; in the writing of the manuscript, or in the decision to publish the results.

References

  1. Joosten, H. Human impacts: Farming, fire, forestry and fuel. In The Wetlands Handbook; Maltby, E., Barker, T., Eds.; Blackwell Publishing Ltd: West Sussex, UK, 2009; pp. 689–718. [Google Scholar]
  2. Grand-Clement, E.; Anderson, K.; Smith, D.; Luscombe, D.; Gatis, N.; Ross, M.; Brazier, R. Evaluating ecosystem goods and services after restoration of marginal upland peatlands in South-West England. J. Appl. Ecol. 2013, 50, 324–334. [Google Scholar] [CrossRef]
  3. Parish, F.; Sirin, A.; Charman, D.; Joosten, H.; Minayeva, T.; Silvius, M.; Stringer, L.E. Assessment on Peatlands, Biodiversity and Climate Change: Main Report; Global Environment Centre: Kuala Lumpur, Malaysia; Wetlands International: Wageningen, The Netherlands, 2008; p. 179. ISBN 978-983-43751-0-2. [Google Scholar]
  4. Xu, J.; Morris, P.J.; Liu, J.; Holden, J. PEATMAP: Refining estimates of global peatland distribution based on a meta-analysis. Catena 2018, 160, 134–140. [Google Scholar] [CrossRef] [Green Version]
  5. International Union for Conservation of Nature. Peatlands and Climate Change; ICUN: Gland, Switzerland, 2017. [Google Scholar]
  6. Costanza, R.; d´Agre, R.; De Groot, R.S.; Farber, S.; Grasso, M.; Hannon, B.; Limburg, K.; Naeem, S.; O´Neill, R.V.; Paruelo, J.; et al. The value of the world´s ecosystem services and natural capital. Nature 1997, 385, 253–260. [Google Scholar] [CrossRef]
  7. Costanza, R.; Daly, H.E. Natural capital and sustainable development. Conserv. Biol. 1992, 6, 37–46. [Google Scholar] [CrossRef]
  8. Zak, D.; McInnes, R.J.; Gelbrecht, J. Managing phosphorus release from restored minerotrophic peatlands. In The Wetland Book: I: Structure and Function, Management, and Methods; Finlayson, C.M., Everard, M., Irvine, K., McInnes, R.J., Middleton, B.A., van Dam, A.A., Davidson, N.C., Eds.; Springer: Dordrecht, The Netherlands, 2018; pp. 1321–1327. [Google Scholar]
  9. Joosten, H. The Global Peatland CO2 Picture: Peatland Status and Drainage Related Emissions in All Countries of the World; Wetlands International: Wageningen, The Netherlands, 2009; p. 35. [Google Scholar]
  10. Leifeld, J.; Menichetti, L. The underappreciated potential of peatlands in global climate change mitigation strategies. Nat. Commun. 2018, 9, 1–7. [Google Scholar] [CrossRef] [PubMed] [Green Version]
  11. Maltby, E.; Acreman, M.C. Ecosystem services of wetlands: Pathfinder for a new paradigm. Hydrol. Sci. J. 2011, 56, 1341–1359. [Google Scholar] [CrossRef]
  12. Joosten, H.; Clarke, D. Wise Use of Mires and Peatlands: Background and Principles Including a Framework for Decision Making; International Mire Conservation Group/International Peat Society: Saarijärvi, Finland, 2002; p. 304. [Google Scholar]
  13. Joosten, H. Peatlands across the globe. In Peatland Restoration and Ecosystem Services: Science, Policy, and Practice; Bonn, A., Allott, T., Evans, M., Joosten, H., Stoneman, R., Eds.; Cambridge University Press: Cambridge, UK, 2016; pp. 19–43. [Google Scholar]
  14. De Groot, R.S.; Wilson, M.A.; Boumans, R.M.J. A typology for the classification, description and valuation of ecosystem functions, goods and services. Ecol. Econ. 2002, 41, 393–408. [Google Scholar] [CrossRef] [Green Version]
  15. Tanneberger, F.; Tegetmeyer, C.; Busse, S.; Barthelmes, A.; Shumka, S.; Moles Mariné, A.; Jenderedjian, K.; Steiner, G.M.; Essl, F.; Etzold, J.; et al. The peatland map of Europe. Mires Peat 2017, 19, 1–17. [Google Scholar]
  16. Tanneberger, F.; Appulo, L.; Ewert, S.; Lakner, S.; Brolcháin, N.Ó.; Peters, J.; Wichtmann, W. The power of nature-based solutions: How peatlands can help us to achieve key EU sustainability objectives. Adv. Sustain. Syst. 2020, 5, 2000146. [Google Scholar] [CrossRef]
  17. Joosten, H.; Tanneberger, F.; Moen, A. Mires and Peatlands of Europe: Status, Distribution and Conservation; Schweizerbart Science Publishers: Stuttgart, Germany, 2017; p. 780. [Google Scholar]
  18. Kern, J.; Tammeorg, P.; Shanskiy, M.; Sakrabani, R.; Knicker, H.; Kammann, C.; Tuhkanen, E.-M.; Smidt, G.; Prasad, M.; Tiilikkala, K.; et al. Synergistic use of peat and charred material in growing media—An option to reduce the pressure on peatlands? J. Environ. Eng. Landsc. Manag. 2017, 25, 160–174. [Google Scholar] [CrossRef]
  19. Turner, M.G. Landscape ecology: The effect of pattern on process. Annu. Rev. Ecol. Syst. 1989, 20, 171–197. [Google Scholar] [CrossRef]
  20. European Commission. EU Biodiversity Strategy for 2030: Bringing Nature Back into Our Lives; European Commission: Brussels, Belgium, 2020. [Google Scholar]
  21. Secretariat of the Convention on Biological Diversity. Global Biodiversity Outlook 3; Secretariat of the Convention on Biological Diversity: Montreal, QC, Canada, 2010. [Google Scholar]
  22. European Commission. The European Green Deal; European Commission: Brussels, Belgium, 2019. [Google Scholar]
  23. Haines, A.; Scheelbeek, P. European Green Deal: A major opportunity for health improvement. Lancet 2020, 395, 1327–1329. [Google Scholar] [CrossRef]
  24. Forman, R.T.T. Some general principles of landscape and regional ecology. Landsc. Ecol. 1995, 10, 133–142. [Google Scholar] [CrossRef]
  25. Jongman, R.H. Nature conservation planning in Europe: Developing ecological networks. Landsc. Urban Plan. 1995, 32, 169–183. [Google Scholar] [CrossRef]
  26. Jones-Walters, L.M.; Ivic, K.C. Implementing green infrastructure and ecological networks in Europe: Lessons learned and future perspectives. J. Green Eng. 2015, 4, 307–324. [Google Scholar] [CrossRef]
  27. European Commission. Green Infrastructure (GI)—Enhancing Europe’s Natural Capital. Communication from the Commission to the European Parliament, the Council, the European Economic and Social Committee and the Committee of the Regions; European Commission Environment: Brussels, Belgium, 2013. [Google Scholar]
  28. Svancara, L.K.; Brannon, R.; Scott, M.; Groves, C.R.; Noss, R.F.; Pressey, R.L. Policy-driven versus evidence-based conservation: A review of political targets and biological needs. BioScience 2005, 55, 989–995. [Google Scholar] [CrossRef]
  29. Tear, T.H.; Kareiva, P.; Angermeier, P.L.; Comer, P.; Czech, B.; Kautz, R.; Landon, L.; Mehlman, D.; Murphy, K.; Ruckelshaus, M.; et al. How much is enough? The recurrent problem of setting measurable objectives in conservation. BioScience 2005, 55, 835. [Google Scholar] [CrossRef] [Green Version]
  30. Nilsson, J. Critical loads for sulphur and nitrogen. In Air Pollution and Ecosystems; Mathy, P., Ed.; Springer: Dordrecht, The Netherlands, 1988. [Google Scholar]
  31. De Jager, N.R.; Thomsen, M.A.; Yin, Y. Threshold effects of flood duration on the vegetation and soils of the Upper Mississippi River floodplain, USA. For. Ecol. Manag. 2012, 270, 135–146. [Google Scholar] [CrossRef]
  32. Gergle, S.E.; Turner, M.G. Learning Landscape Ecology: A Practicle Guide to Concepts and Techniques; Springer: New York, NY, USA, 2001. [Google Scholar]
  33. Fahrig, L. Effects of habitat fragmentation on biodiversity. Annu. Rev. Ecol. Evol. Syst. 2003, 34, 487–515. [Google Scholar] [CrossRef] [Green Version]
  34. Minayeva, T.; Sirin, A.; Bragg, O. A Quick Scan of Peatlands in Central and Eastern Europe; Wetlands International: Wageningen, The Netherlands, 2009; p. 132. [Google Scholar]
  35. Howlett, M.; Ramesh, M.; Perl, A. Studying Public Policy: Policy Cycles and Policy Subsystems; Oxford University Press: Oxford, UK, 2009; Volume 3. [Google Scholar]
  36. Angelstam, P.; Törnblom, J. Maintaining forest biodiversity in actual landscapes—European gradients in history and governance systems as a “landscape lab”. In Monitoring and Indicators of Forest Biodiversity in Europe—From Ideas to Operationality; European Forest Institute: Joensuu, Finland, 2005; pp. 299–315. [Google Scholar]
  37. Manton, M.; Angelstam, P. Defining benchmarks for restoration of green infrastructure: A case study combining the historical range of variability of habitat and species’ requirements. Sustainability 2018, 10, 326. [Google Scholar] [CrossRef] [Green Version]
  38. Minayeva, T.; Bragg, O.; Cherednichenko, O.; Couwenberg, J.; Duinen, G.A.; Giesen, W.; Grootjans, A.P.; Grundling, P.; Nikolaev, V.; van der Schaaf, S. Peatlands and biodiversity. In Assessment on Peatlands, Biodiversity and Climate Change: Main Report; Global Environment Centre: Kuala Lumpur, Malaysia; Wetlands International: Wageningen, The Netherlands, 2008; pp. 60–98. [Google Scholar]
  39. Minayeva, T.; Bragg, O.; Sirin, A. Towards ecosystem-based restoration of peatland biodiversity. Mires Peat 2017, 19, 1. [Google Scholar]
  40. Dawson, L.; Elbakidze, M.; Schellens, M.; Shkaruba, A.; Angelstam, P.K. Bogs, birds, and berries in Belarus: The governance and management dynamics of wetland restoration in a state-centric, top-down context. Ecol. Soc. 2021, 26. [Google Scholar] [CrossRef]
  41. Westbrook, C.J.; Noble, B.F. Science requisites for cumulative effects assessment for wetlands. Impact Assess. Proj. Apprais. 2013, 31, 318–323. [Google Scholar] [CrossRef] [Green Version]
  42. Angelstam, P.; Manton, M.; Green, M.; Jonsson, B.-G.; Mikusiński, G.; Svensson, J.; Sabatini, F.M. Sweden does not meet agreed national and international forest biodiversity targets: A call for adaptive landscape planning. Landsc. Urban Plan. 2020, 202, 103838. [Google Scholar] [CrossRef]
  43. Angelstam, P.; Manton, M.; Yamelynets, T.; Sørensen, O.J.; Kondrateva (Stepanova), S.V. Landscape approach towards integrated conservation and use of primeval forests: The transboundary Kovda River catchment in Russia and Finland. Land 2020, 9, 144. [Google Scholar] [CrossRef]
  44. Global Runoff Data Centre. Long–Term Mean Monthly Discharges and Annual Characteristics of GRDC Station; Federal Institute of Hydrology: Koblenz, Germany, 2009. [Google Scholar]
  45. Korneev, N.; Volchak, A.; Hertman, L.; Usava, I.; Anufriev, V.; Pakhomau, A.; Rusaya, I.; Bulak, I.; Bahadziazh, E.; Dubenok, S. Strategic Framework for Adaptation to Climate Change in the Neman River Basin; United Nations: Brest, Belarus, 2015. [Google Scholar]
  46. Gailiušis, B.; Kriaučiūnienė, J.; Jakimavičius, D.; Šarauskienė, D. The variability of long-term runoff series in the Baltic Sea drainage basin. Baltica 2011, 24, 45–54. [Google Scholar]
  47. Guobytė, R. A brief outline of the quaternary of Lithuania and the history of its investigation. In Quaternary Glaciations: Extent and Chronology. Part I. Europe; Elsevier: Amsterdam, The Netherlands, 2004; Volume 2, pp. 245–250. [Google Scholar]
  48. Karácsonyi, D.; Kocsis, K.; Bottlik, Z. Belarus in Maps; Geographical Research Institute CSFK MTA: Budapest, Hungary, 2017. [Google Scholar]
  49. Weber, C.A.; Couwenberg, J.; Joosten, H.C.A. Weber and the Raised Bog of Augstumal: With A Translation of the 1902 Monograph by Weber on the “Vegetation and Development of the Raised Bog of Augstumal in the Memel Delta”; International Mire Conservation Group/PPE Grif & K, Tula: Greifswald, Germany, 2002; pp. 52–270. [Google Scholar]
  50. Mercer, J.L. Strategic Planning for Public Managers; ABC-CLIO: Santa Barbara, CA, USA, 1991. [Google Scholar]
  51. Rydin, H.; Jeglum, J.K. The Biology of Peatlands, 2nd ed.; Oxford University Press: Oxford, UK, 2013; p. 382. [Google Scholar]
  52. Kharanzhevskaya, Y.; Maloletko, A.; Sinyutkina, A.; Giełczewski, M.; Kirschey, T.; Michałowski, R.; Mirosław-Świątek, D.; Okruszko, T.; Osuch, P.; Trandziuk, P.; et al. Assessing mire-river interaction in a pristine Siberian bog-dominated watershed—Case study of a part of the Great Vasyugan Mire, Russia. J. Hydrol. 2020, 590, 125315. [Google Scholar] [CrossRef]
  53. Mitsch, W.J.; Gosselink, J.G. Wetlands, 5th ed.; Wiley: New York, NY, USA, 2015; p. 456. [Google Scholar]
  54. National Land Service under the Ministry of Agriculture of the Republic of Lithuania. Dirv_DR10LT—1:10,000 Soil Spatial Data Set of the Territory of the Republic of Lithuania; National Land Service under the Ministry of Agriculture of the Republic of Lithuania: Vilnius, Lithuania, 2020. Available online: https://www.geoportal.lt/ (accessed on 7 March 2020).
  55. Broxton, P.D.; Zeng, X.; Sulla-Menashe, D.; Troch, P.A. A global land cover climatology using MODIS data. J. Appl. Meteorol. Clim. 2014, 53, 1593–1605. [Google Scholar] [CrossRef]
  56. Gardner, R.H.; Turner, M.G.; O’Neill, R.V.; Lavorel, S. Simulation of the scale-dependent effects of landscape boundaries on species persistence and dispersal. In Ecotones; Springer Nature: Boston, MA, USA, 1991; pp. 76–89. [Google Scholar]
  57. Roberge, J.-M.; Angelstam, P. Usefulness of the umbrella species concept as a conservation tool. Conserv. Biol. 2004, 18, 76–85. [Google Scholar] [CrossRef]
  58. Lambeck, R.J. Focal species: A multi-species umbrella for nature conservation. Conserv. Biol. 1997, 11, 849–856. [Google Scholar] [CrossRef] [Green Version]
  59. Angelstam, P.; Dönz-Breuss, M.; Roberge, J.-M. Targets and tools for the maintenance of forest biodiversity: An introduction. Ecol. Bull. 2004, 51, 11–24. [Google Scholar] [CrossRef]
  60. Scott, J.M.; Davis, F.; Csuti, B.; Noss, R.; Butterfield, B.; Groves, C.; Anderson, H.; Caicco, S.; D’Erchia, F.; Edwards, T.C., Jr.; et al. Gap analysis: A geographic approach to protection of biological diversity. Wildl. Monogr. 1993, 123, 3–41. [Google Scholar]
  61. Angelstam, P.; Andersson, L. Estimates of the needs for forest reserves in sweden. Scand. J. For. Res. 2001, 16, 38–51. [Google Scholar] [CrossRef]
  62. Angelstam, P.; Yamelynets, T.; Elbakidze, M.; Prots, B.; Manton, M. Gap analysis as a basis for strategic spatial planning of green infrastructure: A case study in the Ukrainian Carpathians. Ecoscience 2017, 24, 41–58. [Google Scholar] [CrossRef]
  63. Angelstam, P.; Mikusiński, G.; Rönnbäck, B.-I.; Östman, A.; Lazdinis, M.; Roberge, J.-M.; Arnberg, W.; Olsson, J. Two-dimensional gap analysis: A tool for efficient conservation planning and biodiversity policy implementation. Ambio 2003, 32, 527–534. [Google Scholar] [CrossRef]
  64. Page, S.E.; Baird, A. Peatlands and global change: Response and resilience. Annu. Rev. Environ. Resour. 2016, 41, 35–57. [Google Scholar] [CrossRef]
  65. Rannap, R.; Kaart, T.; Pehlak, H.; Kana, S.; Soomets, E.; Lanno, K. Coastal meadow management for threatened waders has a strong supporting impact on meadow plants and amphibians. J. Nat. Conserv. 2017, 35, 77–91. [Google Scholar] [CrossRef]
  66. Manton, M.; Angelstam, P.; Milberg, P.; Elbakidze, M. Wet grasslands as a green infrastructure for ecological sustainability: Wader conservation in Southern Sweden as a case study. Sustainability 2016, 8, 340. [Google Scholar] [CrossRef] [Green Version]
  67. Robledano, F.; Esteve, M.A.; Farinós, P.; Carreño, M.F.; Martínez-Fernández, J. Terrestrial birds as indicators of agricultural-induced changes and associated loss in conservation value of Mediterranean wetlands. Ecol. Indic. 2010, 10, 274–286. [Google Scholar] [CrossRef]
  68. Valasiuk, S.; Giergiczny, M.; Żylicz, T.; Klimkowska, A.; Angelstam, P. Conservation of disappearing cultural landscape’s biodiversity: Are people in Belarus willing to pay for wet grassland restoration? Wetl. Ecol. Manag. 2018, 26, 943–960. [Google Scholar] [CrossRef] [Green Version]
  69. Getis, A.; Ord, J.K. The analysis of spatial association by use of distance statistics. In Perspectives on Spatial Data Analysis; Anselin, L., Rey, S.J., Eds.; Springer: Berlin/Heidelberg, Germany, 2010; pp. 127–145. [Google Scholar]
  70. Manton, M.; Angelstam, P.; Mikusiński, G. Modelling habitat suitability for deciduous forest focal species—A sensitivity analysis using different satellite land cover data. Landsc. Ecol. 2005, 20, 827–839. [Google Scholar] [CrossRef]
  71. Klimkowska, A.; Van Diggelen, R.; Grootjans, A.P.; Kotowski, W. Prospects for fen meadow restoration on severely degraded fens. Perspect. Plant Ecol. Evol. Syst. 2010, 12, 245–255. [Google Scholar] [CrossRef]
  72. Siegrist, H.; Müller, D. Property in East Central Europe: Notions, Institutions, and Practices of Landownership in the Twentieth Century; Berghahn Books: New York, NY, USA, 2014. [Google Scholar]
  73. Takun, A. Agricultural Sector in Belarus is in Search of Investors. Available online: https://www.largescaleagriculture.com/home/news-details/anatoli-takun-agricultural-sector-in-belarus-is-in-search-of-investors/ (accessed on 27 November 2020).
  74. Kuns, B.; Visser, O.; Wästfelt, A. The stock market and the steppe: The challenges faced by stock-market financed, Nordic farming ventures in Russia and Ukraine. J. Rural Stud. 2016, 45, 199–217. [Google Scholar] [CrossRef] [Green Version]
  75. Wegren, S.K. The “left behind”: Smallholders in contemporary Russian agriculture. J. Agrar. Chang. 2018, 18, 913–925. [Google Scholar] [CrossRef]
  76. Prishchepov, A.V.; Radeloff, V.C.; Baumann, M.; Kuemmerle, T.; Müller, D. Effects of institutional changes on land use: Agricultural land abandonment during the transition from state-command to market-driven economies in post-Soviet Eastern Europe. Environ. Res. Lett. 2012, 7, 024021. [Google Scholar] [CrossRef]
  77. Ministry of Environment State Forest Service. Lithuanian Statistical Yearbook of Forestry 2019; Ministry of Environment State Forest Service: Vilnius, Lithuania, 2020.
  78. Elbakidze, M.; Ražauskaitė, R.; Manton, M.; Angelstam, P.; Mozgeris, G.; Brūmelis, G.; Brazaitis, G.; Vogt, P. The role of forest certification for biodiversity conservation: Lithuania as a case study. Eur. J. For. Res. 2016, 135, 361–376. [Google Scholar] [CrossRef]
  79. Lazdinis, I. Implementation of international requirements for protected areas in Lithuanian forestry. In Proceedings of the Legal Aspects of European Forest Sustainable Development; IUFRO: Kaunas, Lithuania, May 2011; pp. 89–96. [Google Scholar]
  80. Frank, G.; Latham, J.; Little, D.; Parviainen, J.; Schuck, A.; Vandekerkhove, K. Analysis of protected forest areas in Europe—provisional results of COST action E27 PROFOR. In Natural Forests in the Temperate Zone of Europe—Values and Utilisation; Swiss Federal Research Institute: Vienna, Austria, 2005; pp. 377–386. [Google Scholar]
  81. ANON. Strategy of Implementation of the United Nations Convention to Combat Desertification in Those Countries Experiencing Serious Drought and/or Desertification, Particularly in Africa: 2016–2020 National Action Plan for the Prevention of Land (and Soil) Degradation; Resolution of the Council of Ministers of the Republic of Belarus: Minsk, Belarus, 2015. [Google Scholar]
  82. ANON. Final Country Report of the Land Degradation Neutrality Target Setting Programme: Russian Federation; United Nations: Bonn, Germany, 2018. [Google Scholar]
  83. Vitt, D.H. An overview of factors that influence the development of Canadian peatlands. Mem. Entomol. Soc. Can. 1994, 126, 7–20. [Google Scholar] [CrossRef]
  84. Jabłońska, E.; Michaelis, D.; Tokarska, M.; Goldstein, K.; Grygoruk, M.; Wilk, M.; Wyszomirski, T.; Kotowski, W. Alleviation of plant stress precedes termination of rich fen stages in peat profiles of lowland mires. Ecosystems 2019, 23, 730–740. [Google Scholar] [CrossRef] [Green Version]
  85. Aumen, N.G.; Keddy, P.A. Wetland ecology: Principles and conservation. J. N. Am. Benthol. Soc. 2001, 20, 683–685. [Google Scholar] [CrossRef]
  86. Craft, C. Creating and Restoring Wetlands: From Theory to Practice; Elsevier: Oxford, UK, 2015; p. 348. [Google Scholar]
  87. Odum, E.P. The strategy of ecosystem development. In The Ecological Design and Planning Reader; Ndubisi, F.O., Ed.; Island Press/Center for Resource Economics: Washington, DC, USA, 2014; pp. 203–216. [Google Scholar]
  88. Morimoto, J.; Shibata, M.; Shida, Y.; Nakamura, F. Wetland restoration by natural succession in abandoned pastures with a degraded soil seed bank. Restor. Ecol. 2017, 25, 1005–1014. [Google Scholar] [CrossRef]
  89. Lamers, L.P.; Vile, M.A.; Grootjans, A.P.; Acreman, M.C.; Van Diggelen, R.; Evans, M.; Richardson, C.J.; Rochefort, L.; Kooijman, A.M.; Roelofs, J.G.M.; et al. Ecological restoration of rich fens in Europe and North America: From trial and error to an evidence-based approach. Biol. Rev. 2015, 90, 182–203. [Google Scholar] [CrossRef] [Green Version]
  90. Quinty, F.; Rochefort, L. Peatland Restoration Guide; Canadian Sphagnum Peat Moss Association: Fredericton, NB, Canada, 2003. [Google Scholar]
  91. Gaudig, G.; Krebs, M.; Joosten, H. Sphagnum farming on cut-over bog in NW Germany: Long-term studies on Sphagnum growth. Mires Peat 2017, 20, 4. [Google Scholar]
  92. Rochefort, L.; Leblanc, M.-C.; Bérubé, V.; Hugron, S.; Boudreau, S.; Pouliot, R. Reintroduction of fen plant communities on a degraded minerotrophic peatland. Botany 2016, 94, 1041–1051. [Google Scholar] [CrossRef]
  93. Boers, A.M.; Frieswyk, C.B.; Verhoeven, J.T.A.; Zedler, J.B. Contrasting approaches to the restoration of diverse vegetation in herbaceous wetlands. In Wetlands: Functioning, Biodiversity Conservation, and Restoration; Bobbink, R., Beltman, B., Verhoeven, J.T.A., Whigham, D.F., Eds.; Springer: Berlin/Heidelberg, Germany, 2006; pp. 225–246. [Google Scholar]
  94. Farrell, C.; Doyle, G. Rehabilitation of industrial cutaway Atlantic blanket bog in County Mayo, North-West Ireland. Wetl. Ecol. Manag. 2003, 11, 21–35. [Google Scholar] [CrossRef]
  95. Gorham, E.; Rochefort, L. Peatland restoration: A brief assessment with special reference to Sphagnum bogs. Wetl. Ecol. Manag. 2003, 11, 109–119. [Google Scholar] [CrossRef]
  96. Karofeld, E.; Jarašius, L.; Priede, A.; Sendžikaitė, J. On the after-use and restoration of abandoned extracted peatlands in the Baltic countries. Restor. Ecol. 2016, 25, 293–300. [Google Scholar] [CrossRef]
  97. Kołos, A.; Banaszuk, P. Mowing as a tool for wet meadows restoration: Effect of long-term management on species richness and composition of sedge-dominated wetland. Ecol. Eng. 2013, 55, 23–28. [Google Scholar] [CrossRef]
  98. Kołos, A.; Banaszuk, P. Mowing may bring about vegetation change, but its effect is strongly modified by hydrological factors. Wetl. Ecol. Manag. 2018, 26, 879–892. [Google Scholar] [CrossRef] [Green Version]
  99. Kaplan, J.O.; Krumhardt, K.M.; Zimmermann, N. The prehistoric and preindustrial deforestation of Europe. Quat. Sci. Rev. 2009, 28, 3016–3034. [Google Scholar] [CrossRef]
  100. Tye, H. The Lowland Grasslands of Central and Eastern Europe; IUCN: Oxford, UK, 1991; Volume 4. [Google Scholar]
  101. Manton, M.; Angelstam, P.; Naumov, V. Effects of land use intensification on avian predator assemblages: A comparison of landscapes with different histories in Northern Europe. Diversity 2019, 11, 70. [Google Scholar] [CrossRef] [Green Version]
  102. Diekmann, M.; Andres, C.; Becker, T.; Bennie, J.; Blüml, V.; Bullock, J.M.; Culmsee, H.; Fanigliulo, M.; Hahn, A.; Heinken, T.; et al. Patterns of long-term vegetation change vary between different types of semi-natural grasslands in Western and Central Europe. J. Veg. Sci. 2019, 30, 187–202. [Google Scholar] [CrossRef] [Green Version]
  103. Vogt-Schilb, H.; Munoz, F.; Richard, F.; Schatz, B. Recent declines and range changes of orchids in Western Europe (France, Belgium and Luxembourg). Biol. Conserv. 2015, 190, 133–141. [Google Scholar] [CrossRef]
  104. Immoor, A.; Zacharias, D.; Müller, J.; Diekmann, M. A re-visitation study (1948–2015) of wet grassland vegetation in the Stedinger Land near Bremen, North-western Germany. Tuexenia 2017, 37, 271–288. [Google Scholar]
  105. Hofer, B.; Huwald, G.; Lehmann, J. Studie zur Situation des Torfabbaus im Baltikum. TELMA Ber. Dtsch. Ges. Moor Torfkunde 2012, 42, 43–56. [Google Scholar] [CrossRef]
  106. Kozulin, A.; Tanovitskaya, N.; Minchenko, N. Developing a national strategy for the conservation and sustainable use of peatlands in the Republic of Belarus. Mires Peat 2018, 21, 1–17. [Google Scholar]
  107. Choi, Y.D.; Temperton, V.M.; Allen, E.B.; Grootjans, A.P.; Halassy, M.; Hobbs, R.J.; Naeth, M.A.; Török, K. Ecological restoration for future sustainability in a changing environment. Ecoscience 2008, 15, 53–64. [Google Scholar] [CrossRef]
  108. Hobbs, R.J.; Hallett, L.M.; Ehrlich, P.R.; Mooney, H.A. Intervention ecology: Applying ecological science in the twenty-first century. BioScience 2011, 61, 442–450. [Google Scholar] [CrossRef] [Green Version]
  109. Hobbs, R.J.; Jentsch, A.; Temperton, V.M. Restoration as a process of assembly and succession mediated by disturbance. In Environmental Problem Solving; Springer Nature: Amsterdam, The Netherlands, 2007; pp. 150–167. [Google Scholar]
  110. Ottvall, R.; Smith, H.G. Effects of an agri-environment scheme on wader populations of coastal meadows of southern Sweden. Agric. Ecosyst. Environ. 2006, 113, 264–271. [Google Scholar] [CrossRef]
  111. Walton, C.R.; Zak, D.; Audet, J.; Petersen, R.J.; Lange, J.; Oehmke, C.; Wichtmann, W.; Kreyling, J.; Grygoruk, M.; Jabłońska, E.; et al. Wetland buffer zones for nitrogen and phosphorus retention: Impacts of soil type, hydrology and vegetation. Sci. Total Environ. 2020, 727, 138709. [Google Scholar] [CrossRef]
  112. Angelstam, P.; Munoz-Rojas, J.; Pinto-Correia, T. Landscape concepts and approaches foster learning about ecosystem services. Landsc. Ecol. 2019, 34, 1445–1460. [Google Scholar] [CrossRef] [Green Version]
  113. Millennium Ecosystem Assessment. Ecosystems and Human Well-Being; Synthesis Island Press: Washington, DC, USA, 2005. [Google Scholar]
  114. Bull, J.W.; Jobstvogt, N.; Böhnke-Henrichs, A.; Mascarenhas, A.; Sitas, N.; Baulcomb, C.; Lambini, C.; Rawlings, M.; Baral, H.; Zähringer, J.; et al. Strengths, weaknesses, opportunities and threats: A SWOT analysis of the ecosystem services framework. Ecosyst. Serv. 2016, 17, 99–111. [Google Scholar] [CrossRef]
  115. Huntsinger, L.; Oviedo, J.L. Ecosystem services are social–ecological services in a traditional pastoral system: The case of California’s Mediterranean rangelands. Ecol. Soc. 2014, 19, 8. [Google Scholar] [CrossRef] [Green Version]
  116. Angelstam, P.; Manton, M.; Cruz, F.; Fedoriak, M.; Pautov, Y. Learning landscape approach through evaluation: Opportunities for pan-European long-term socio-ecological research. In Current Trends in Landscape Research; Mueller, L., Eulenstein, F., Eds.; Springer: Cham, Switzerland, 2019; pp. 303–319. [Google Scholar]
  117. Lele, S.; Springate-Baginski, O.; Lakerveld, R.P.; Deb, D.; Dash, P. Ecosystem services: Origins, contributions, pitfalls, and alternatives. Conserv. Soc. 2013, 11, 343. [Google Scholar] [CrossRef] [Green Version]
  118. Bastian, O.; Haase, D.; Grunewald, K. Ecosystem properties, potentials and services—The EPPS conceptual framework and an urban application example. Ecol. Indic. 2012, 21, 7–16. [Google Scholar] [CrossRef]
  119. Koschke, L.; Fürst, C.; Frank, S.; Makeschin, F. A multi-criteria approach for an integrated land-cover-based assessment of ecosystem services provision to support landscape planning. Ecol. Indic. 2012, 21, 54–66. [Google Scholar] [CrossRef]
  120. Termorshuizen, J.W.; Opdam, P. Landscape services as a bridge between landscape ecology and sustainable development. Landsc. Ecol. 2009, 24, 1037–1052. [Google Scholar] [CrossRef]
  121. Angelstam, P.; Grodzynskyi, M.; Andersson, K.; Axelsson, R.; Elbakidze, M.; Khoroshev, A.; Kruhlov, I.; Naumov, V. Measurement, collaborative learning and research for sustainable use of ecosystem services: Landscape concepts and Europe as laboratory. Ambio 2013, 42, 129–145. [Google Scholar] [CrossRef] [Green Version]
  122. Turner, M.G.; Donato, D.C.; Romme, W.H. Consequences of spatial heterogeneity for ecosystem services in changing forest landscapes: Priorities for future research. Landsc. Ecol. 2012, 28, 1081–1097. [Google Scholar] [CrossRef]
  123. IPBES. Global Assessment Report on Biodiversity and Ecosystem Services of the Intergovernmental Science Policy Platform on Bio-Diversity and Ecosystem Services; IPBES: Bonn, Germany, 2019. [Google Scholar]
  124. Díaz, S.; Pascual, U.; Stenseke, M.; Martín-López, B.; Watson, R.T.; Molnár, Z.; Hill, R.; Chan, K.M.A.; Baste, I.A.; Brauman, K.A.; et al. Assessing nature’s contributions to people. Science 2018, 359, 270–272. [Google Scholar] [CrossRef] [Green Version]
  125. Grygoruk, M.; Mirosław-Świątek, D.; Chrzanowska, W.; Ignar, S. How much for water? Economic assessment and mapping of floodplain water storage as a catchment-scale ecosystem service of wetlands. Water 2013, 5, 1760–1779. [Google Scholar] [CrossRef] [Green Version]
  126. Nielsen-Pincus, M.; Moseley, C. The economic and employment impacts of forest and watershed restoration. Restor. Ecol. 2012, 21, 207–214. [Google Scholar] [CrossRef]
  127. Bendor, T.; Lester, T.W.; Livengood, A.; Davis, A.S.; Yonavjak, L. Estimating the size and impact of the ecological restoration economy. PLoS ONE 2015, 10, e0128339. [Google Scholar] [CrossRef] [PubMed]
  128. Trehan, T. Analysis of River Basin Management Plan for the Neman River and discussion, How Peatland Rewetting as a Measure for Improvement of Water Quality Could Be Considered; University of Greifswald: Greifswald, Germany, 2020; p. 19. [Google Scholar]
  129. European Commission. Common Implementation Strategy for the Water Framework Directive (2000/60/EC); European Commission: Luxembourg, 2003; p. 69. [Google Scholar]
  130. European Commission. Annexes to the Proposal for a Regulation of the European Parliament and of the Council Establishing Rules on Support for Strategic Plans to Be Drawn Up by Member States under the Common Agricultural Policy (CAP Strategic Plans) and Financed by the European Agricultural Guarantee Fund (EAGF) and by the European Agricultural Fund for Rural Development (EAFRD) and Repealing Regulation (EU) No1305/2013 of the European Parliament and of the Council and Regulation (EU) No 1307/2013 of the European Parliament and of the Council; COM(2018) 392 Final; European Commission: Brussels, Belgium, 2018; p. 143. [Google Scholar]
  131. Wichmann, S. Economic incentives for climate smart agriculture on peatlands in the EU. Proc. Greifswald Mire Cent. 2018, 1, 1–38. [Google Scholar]
  132. Peters, J.; Unger, M. Peatlands in the EU Regulatory Environment; Bundesamt für Naturschutz: Bonn, Germany, 2017; p. 106. [Google Scholar]
  133. Battisti, C.; Fanelli, G. Don’t think local! Scale in conservation, parochialism, dogmatic bureaucracy and the implementing of the European Directives. J. Nat. Conserv. 2015, 24, 24–30. [Google Scholar] [CrossRef]
  134. Edman, T.; Angelstam, P.; Mikusiński, G.; Roberge, J.-M.; Sikora, A. Spatial planning for biodiversity conservation: Assessment of forest landscapes’ conservation value using umbrella species requirements in Poland. Landsc. Urban Plan. 2011, 102, 16–23. [Google Scholar] [CrossRef]
  135. Valasiuk, S.; Czajkowski, M.; Giergiczny, M.; Żylicz, T.; Veisten, K.; Elbakidze, M.; Angelstam, P. Are bilateral conservation policies for the Białowieża forest unattainable? Analysis of stated preferences of Polish and Belarusian public. J. For. Econ. 2017, 27, 70–79. [Google Scholar] [CrossRef] [Green Version]
  136. Puumalainen, J.; Kennedy, P.; Folving, S. Monitoring forest biodiversity: A European perspective with reference to temperate and boreal forest zone. J. Environ. Manag. 2003, 67, 5–14. [Google Scholar] [CrossRef]
  137. Elbakidze, M.; Angelstam, P. Cross-border cooperation along the eastern border of European Union: A review and approach to learning for sustainable landscapes. Cent. Eur. J. Spat. Landsc. Plan. 2009, 20, 33–42. [Google Scholar]
  138. Angelstam, P.; Khaulyak, O.; Yamelynets, T.; Mozgeris, G.; Naumov, V.; Chmielewski, T.J.; Elbakidze, M.; Manton, M.; Prots, B.; Valasiuk, S. Green infrastructure development at European Union’s eastern border: Effects of road infrastructure and forest habitat loss. J. Environ. Manag. 2017, 193, 300–311. [Google Scholar] [CrossRef]
  139. Dawson, L.; Elbakidze, M.; Angelstam, P.; Gordon, J. Governance and management dynamics of landscape restoration at multiple scales: Learning from successful environmental managers in Sweden. J. Environ. Manag. 2017, 197, 24–40. [Google Scholar] [CrossRef]
  140. Angelstam, P.; Manton, M.; Yamelynets, T.; Fedoriak, M.; Albulescu, A.-C.; Bravo, F.; Cruz, F.; Jaroszewicz, B.; Kavtarishvili, M.; Muñoz-Rojas, J.; et al. Maintaining natural and traditional cultural green infrastructures across Europe: Learning from historic and current landscape transformations. Landsc. Ecol. 2021, 36, 637–663. [Google Scholar] [CrossRef]
  141. Angelstam, P.; Fedoriak, M.; Cruz, F.; Muñoz-Rojas, J.; Yamelynets, T.; Manton, M.; Washbourne, C.; Dobrynin, D.; Izakovicova, Z.; Jansson, N.; et al. Meeting places and social capital supporting rural landscape stewardship: A pan-European horizon scanning. Ecol. Soc. 2021, 26, 11. [Google Scholar] [CrossRef]
Figure 1. Map of the Neman River basin, its sub-basins, and tributaries in the territories of Belarus, Lithuania, Poland, and Russia (Kaliningrad region).
Land 10 00174 g001
Figure 2. The analytic approach in four steps applied in this study. The strategic planning approach refers to the organizational process of defining high-level directions and making decisions on allocating resources to achieve an overall objective [50]. The cluster analysis aims at serving the subsequent tactical planning in local sub-basins.
Land 10 00174 g002
Figure 3. Map of peatlands and their area proportions within the entire Neman River basin by country, sub-basin, and peatland type (fen, transitional mire, and raised bog).
Land 10 00174 g003
Figure 4. Peatland patch size class distribution by peatland types in the four countries of the Neman River basin. Note the changing scale on the vertical axis.
Land 10 00174 g004
Figure 5. Regional distribution of peatland protection gaps and surpluses for each country by the Neman Rivers’ sub-basins. In addition, the overall protection gap/surpluses are contained in the Neman River basin Total. Values equalling more than zero indicate the protection surplus in area proportion, values below zero indicate a gap in the protection of peatlands base on the Convention of Biological Diversity target #11 (17% protection).
Land 10 00174 g005
Figure 6. Protection gaps and surpluses of peatlands that are protected and have no drainage as a proxy for peatland quality, for each country and sub-river basins of the Neman River basin. In addition, the overall protection gap/surpluses are contained in the NRB Total. Values equalling more than zero indicate a protection surplus in area proportion, values below zero indicate a gap in the protection of peatlands base on the Convention of Biological Diversity target #11 (17% protection).
Land 10 00174 g006
Figure 7. Map identifying peatland hotspots (red) and coldspots (blue) at the landscape scale for the Neman River basin. The graph at the bottom of the figure indicates the proportion of peatlands within the hot and cold spots for each sub-basin.
Land 10 00174 g007
Table 1. Criteria used to determine priority actions for peatland re-wetting. We define this selection as a priority to reduce the peatland protection gaps in terms of both quality and quantity and thus their function to provide a greater range of ecosystem services within the hotspots of the cluster analysis.
Not DrainedDrained
ProtectedSecuredRestoration needed
Not protectedConservation neededConservation and Restoration
Table 2. Peatland distribution of the Neman River basin by country and peatland type.
BelarusLithuaniaPolandRussia
FensTotal area (ha)396,782349,05616,3651801
Patch size range (ha)1–17,5771–7341–6111–392
Mean patch size (ha)625840
Transitional miresTotal area (ha)48,96264,2023163180
Patch size range (ha)1–75121–19531–53333–88
Mean patch size (ha)15371260
Raised bogsTotal Area (ha)73,93140,73137377887
Patch size range (ha)1–43261–15471–4892–1634
Mean patch size (ha)82279657
Total peatland area (ha)519,676453,98923,2669869
Table 3. Areas of secured peatlands (i.e., protected and are not impacted by drainage) and opportunities for peatland restoration (i.e., protected but impacted by drainage), peatland conservation (i.e., not protected and are not impacted by drainage), and peatlands that need both conservation and restoration (i.e., not protected and impacted by drainage) within the hotspots of the key peatland cluster analysis (Figure 7) of the Neman River basin for the three peatland types by country and sub-basin.
CountrySub BasinFenTransitional MireRaised Bog
SecuredRestorationConservationConservation
and
Restoration
SecuredRestorationConservationConservation
and
Restoration
SecuredRestorationConservationConservation
and
Restoration
BelarusBerezina22,756118419,43465210000204625100
Czarna Hancza011922189300000084819
Merkys5120528626280088913800090
Neman small rivers26,751181691,84031,951521927381852211611012,5803546
Neris (LT)/Viliya (BY)463013042,89512,976283440118921672421011720,77518,560
Shchara14,5719131,09112,91322,80576510,33214923281017511703
Swislocz002619104300000000
LithuaniaDubysa56110328955426257292745864051446282587
Jura21139781213864625611536101521241
Merkys20922007421820,854150134215512007263051498370
Minija13873038432449677210181746291908188610086
Neman small rivers34014359438013,81921291697125217294982243311324
Neris (LT)/Viliya (BY)4311500492710,60125914916859441485165651189
Nevezis1616421581411,40484228222191375594264551020
Sesupe16726781212612,84055260732388344801251931277
Sventoji30714289897023,263688479209524521731239626619
Zeimena5667288247059488349371711806852201111786177
PolandCzarna Hancza102438893158455176100103570100
Neman small rivers742008000166100
Swislocz02600000000000
RussiaNeman small rivers60379000000257163400
Sesupe000000000032992346
Table 4. Five dominant types of vegetation currently found based on historically transformed fens according to Kołos and Banaszuk [97,98].
Vegetation TypeDescriptionCharacteristic Plant Species
Permanent grasslands (hay meadows)Rarely flooded habitats, managed extensively every year and not well-fertilized with two variants: drier with low grasses and moist with low herbs and grassesDrier variant: Festuca rubra, Poa pratensis, Holcus lanatus, Anthoxanthum odoratum
Moist variant: Geum rivale, Polygonum bistorta, Alopecurus pratensis, Deschampsia caespitosa
Tall herb communities (abandoned hay meadows)Moist (often in the ecotone of alder forests), usually not mown or mown only exceptionally and irregularlyFilipendula ulmaria, Lysimachia vulgaris, Lythrum salicaria, Geranium palustris
Sedge communitiesRarely mown or unmanaged, occupying local, moist depressionsCarex acutiformis, C. acuta, and less often C. rostrata, C. cespitosa; Phalaris arundinacea
Rush communitiesSwamps, oxbows, riverbedsPhragmites australis, Typha latifolia, Glyceria maxima
Shrub and tree aggregationsEncroaching bushes and trees after abandonment of grazing and mowingSalix cinerea, Alnus glutinosa
Publisher’s Note: MDPI stays neutral with regard to jurisdictional claims in published maps and institutional affiliations.

