
Mid-Infrared Spectroscopy Supports Identification of the Origin of Organic Matter in Soils
by
 , and
, and
Michał Dudek
1,*, 
Cezary Kabała
1,
Beata Łabaz
1,
Paweł Mituła
2,
Magdalena Bednik
1 and
Agnieszka Medyńska-Juraszek
1 1
Institute of Soil Sciences and Environmental Protection, Wroclaw University of Environmental and Life Sciences, Grunwaldzka 53 St., 50-357 Wroclaw, Poland
2
Institute of Environmental Engineering, Wroclaw University of Environmental and Life Sciences, Grunwaldzka 24 St., 50-375 Wroclaw, Poland
*
Author to whom correspondence should be addressed.
Land 2021, 10(2), 215; https://doi.org/10.3390/land10020215
Submission received: 25 January 2021
/
Revised: 15 February 2021
/
Accepted: 19 February 2021
/
Published: 21 February 2021
(This article belongs to the Special Issue Application of Spectroscopy and Other Instrumental Methods for Soil)
Abstract
:Spectroscopic methods combined with statistics have recently gathered substantial interest in pedological studies. Near-infrared (NIR) spectroscopy has been utilized, for example, for reconstructions of the history and transformations of Chernozems, although no similar research was conducted based on mid-infrared (MIR). In this paper, the relevance of MIR spectroscopy was tested in studies on the origin/affinity of organic matter from chernozemic soils. Samples collected from three vegetation classes (grasslands, forests and arable lands) were investigated using MIR spectroscopy in order to create a statistical model, which was applied on buried profiles of unknown origin. The results showed a clear disjunction of vegetation classes. Samples of buried soil were placed in the space between all classes, indicating the relation to variable vegetation. Therefore, arable lands should not be omitted in paleoecological reconstructions, because we cannot exclude the cultivation of fertile soils before their burial. It was concluded that MIR methods may have similar applicability to NIR spectroscopy. Additionally, MIR spectra may also be discriminated according to the recognized soil type, which allows for direct reconstructions of the transformation trends in buried profiles.
1. Introduction
Reflectance spectroscopy has gathered significant interest in environmental studies, particularly in recent years. Spectroscopic methods have been applied for quantitative and qualitative analysis of soil components, such as humic substances, carbonates and clay minerals [1,2]. However, the main reason for its popularity is the possibility to analyze the entire soil sample at once to obtain information about its chemistry [3,4,5]. The main advantages of spectroscopy are rapid spectral measurements and minimal, nondestructive sample preparation, highlighted in contrast to destructive chemical analysis [6]. The most promising spectral methods, such as visible (VIS), mid-infrared (MIR) and near-infrared (NIR) spectroscopies, create new possibilities in the process of assessing soil quality, mainly due to the complex insight into its physical and chemical properties [7]. These approaches could have a particular importance for large-scale inventories and long-term monitoring programs [8]. Moreover, reflectance spectroscopy has been widely adopted for the simultaneous prediction of a variety of soil attributes, such as texture, carbonate content, soil organic carbon and cation exchange capacity, all of which are particularly useful for soil cartography to increase the precision of agricultural treatments [9,10]. This approach requires calibration to relate the spectra with the measured properties of soils/materials. Furthermore, additional pre-mathematical processing is necessary due to an overlapping or low intensity of peaks from various chemical functional groups [11,12].
Absorbing groups in the IR electromagnetic spectrum describe the organic and mineral composition of the compartments in the soil mixture. Many papers provide detailed descriptions of selected ranges of VIS, NIR or MIR spectra that correspond to specific functional groups of components [13,14]. In the context of mid-infrared spectra studies, the presence of peaks between 3000 and 2820 cm–1 is highly related to C-H aliphatic chain vibrations, which are characteristic of soil organic matter (SOM). Other popular regions of interest reflect clay mineralogy such as kaolinite, smectite and illite (3900–3600 cm−1 and 1200–1000 cm−1) [15]. The bands at 1500–1400 cm−1 may be useful for the detection of carbonates in soils [14].
The more specific application of various ranges of absorption spectroscopy strongly depends on the aforementioned techniques’ limitations. For example, due to significantly less sensitivity to background interference caused by soil mineralogy, NIR spectroscopy seems to be more suitable for predicting soil properties [16] or pollution concentrations [17]. Recently, a new application of NIR spectroscopy has been tested for distinguishing soil organic matter type (or origin) according to various kinds of vegetation. It is assumed that the single soil spectra contain “fingerprints” of plant materials, which may be used to identify the vegetation that provides the biomass for SOM actually present in the soil [18]. Following this assumption, researchers [19,20] attempted to reconstruct the vegetation history on the chernozemic soils in Central Europe. Due to the capacity of mineral and organic signature detection, the application of MIR is preferentially centered on clay mineral and humic and fulvic acid studies [21]. However, MIR is increasingly being introduced in similar research where NIR has been used or is even used simultaneously [22,23]. However, there is no research focused on paleoenvironmental reconstruction based on organic matter that uses this spectral range.
This research aimed to verify the usefulness of the MIR spectral range (4000–525 cm−1) in the process of differentiating SOM under various types of vegetation, as well as to examine the paleoenvironmental reconstruction of a few buried profiles of chernozemic soils. The investigations may contribute to the further development of reflectance spectroscopy methods that pursue answers to the process of self-preservation of Chernozems until modern times in Central Europe along with their possibility of transformation into other soil types (e.g., Phaeozems, Luvisols).
2. Materials and Methods
2.1. Soil Sample Collection
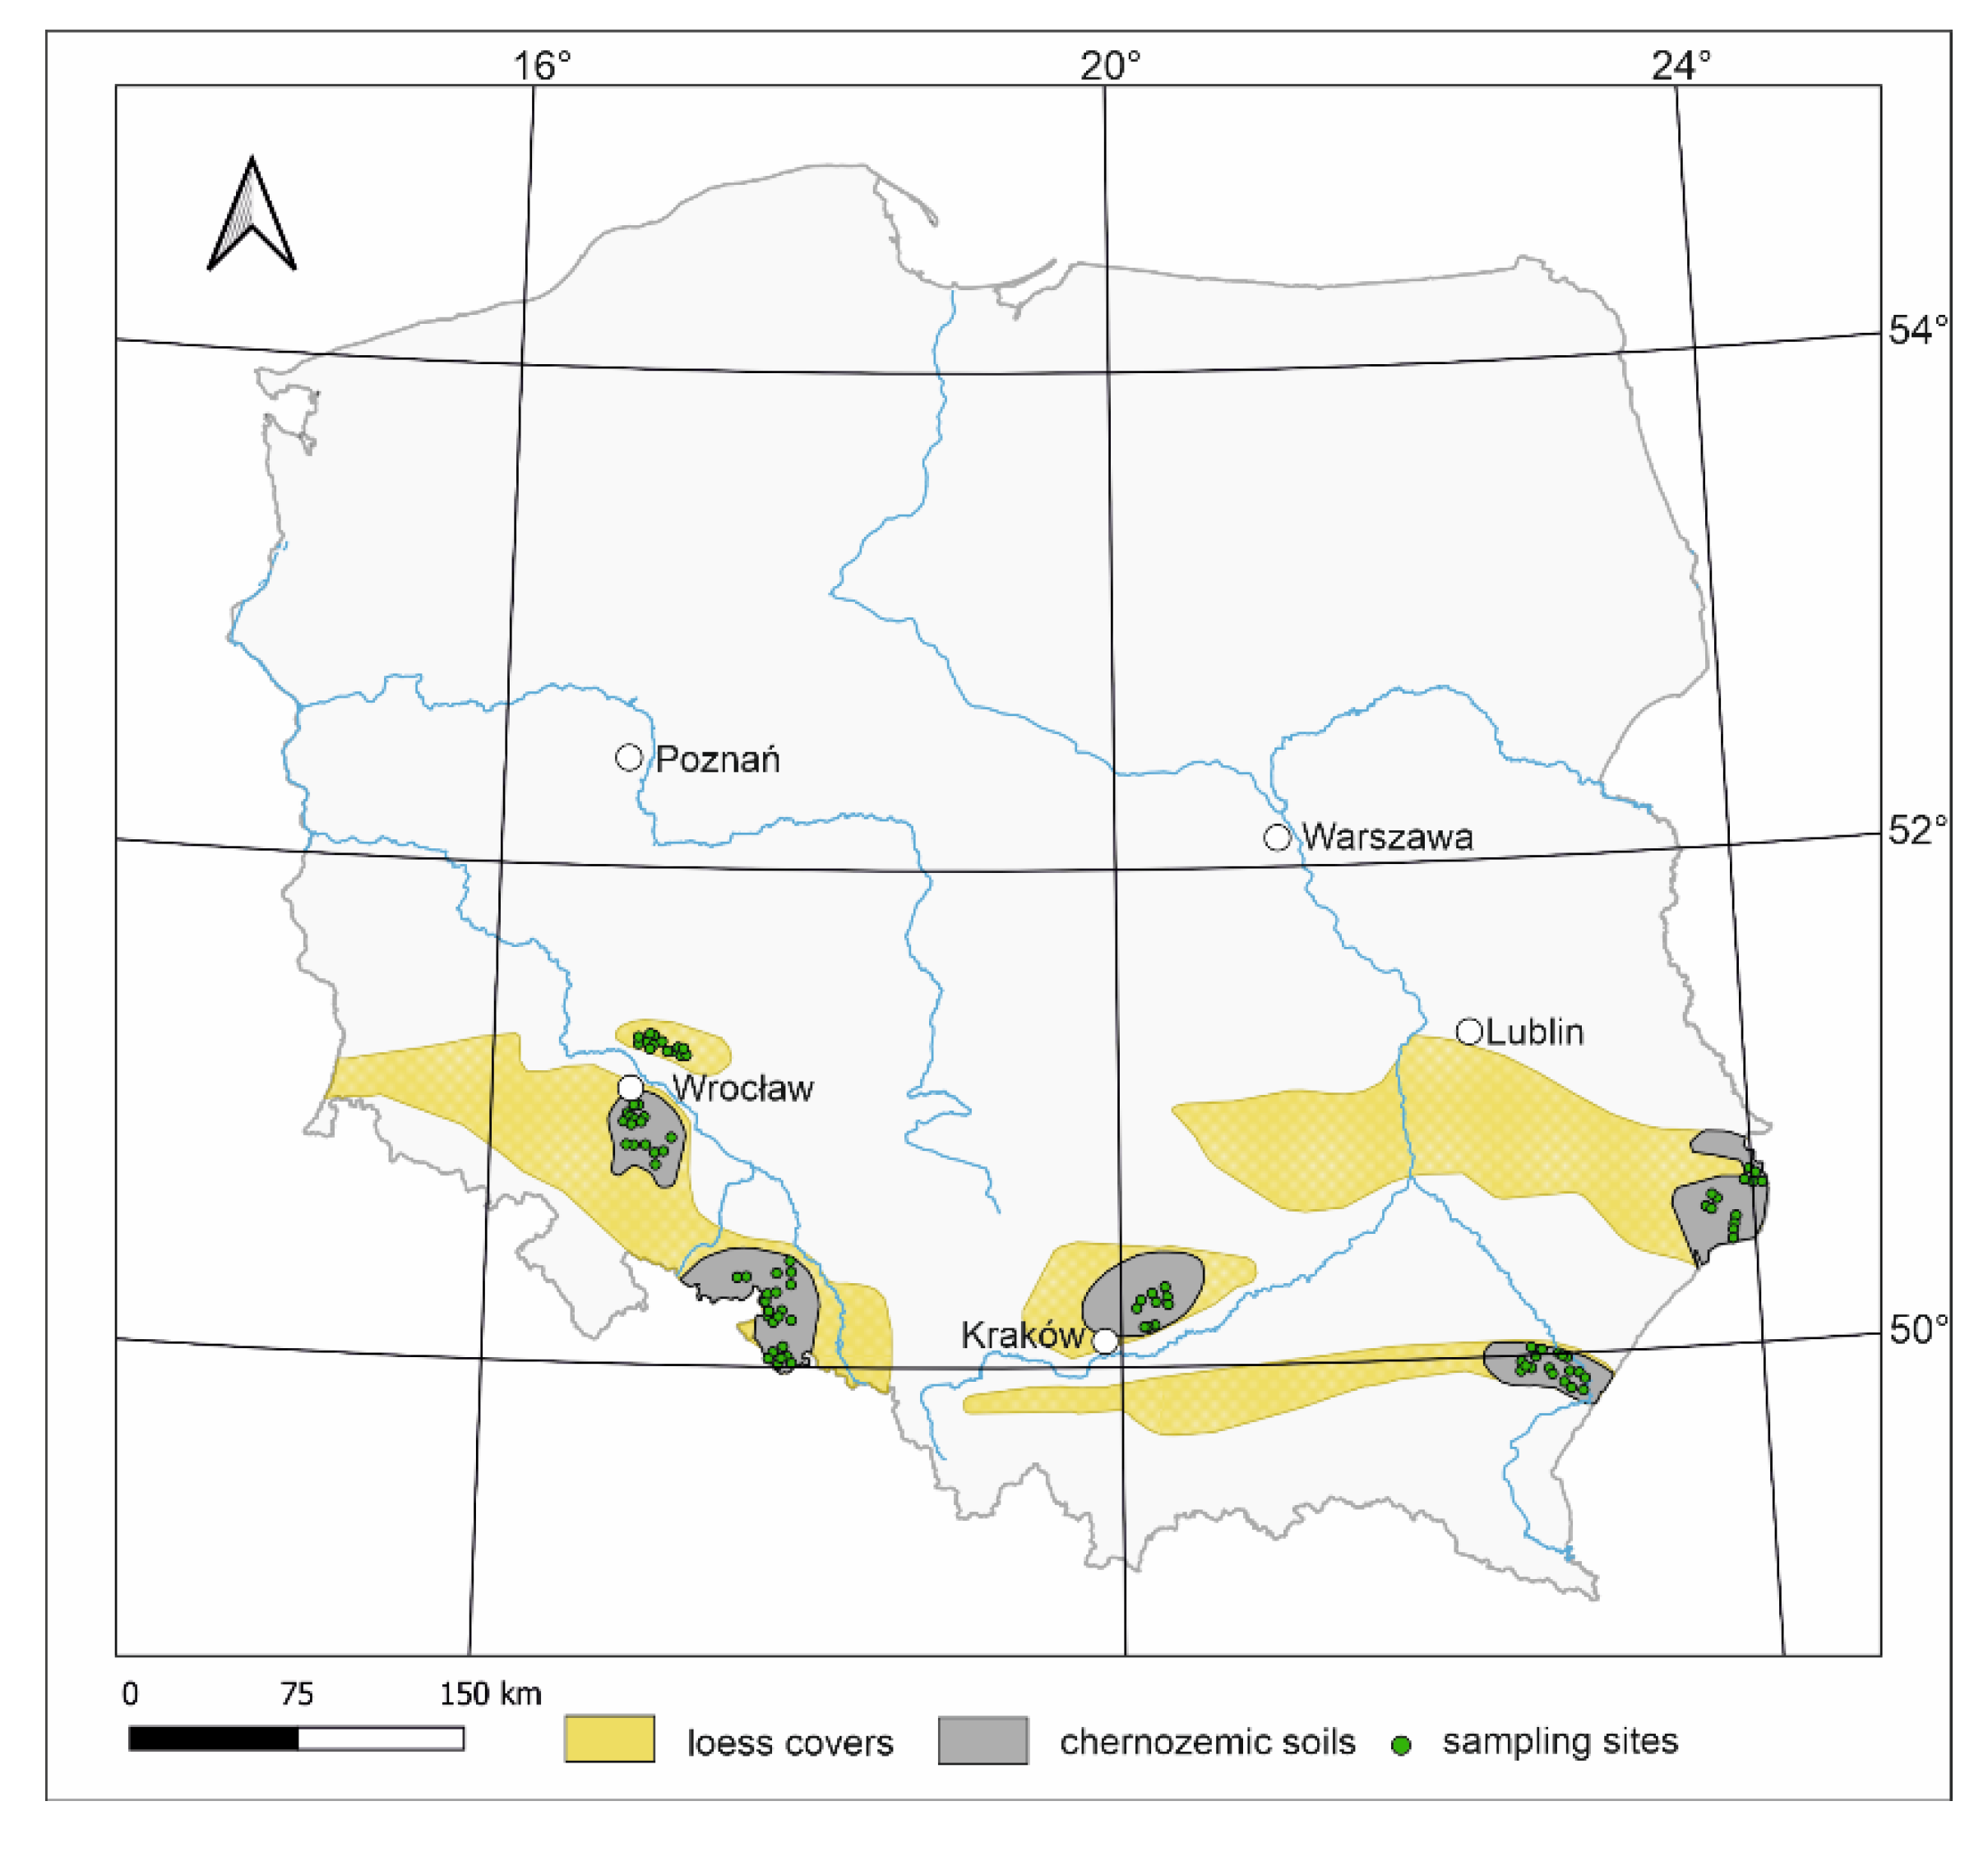
The study focused on the Chernozems and related soils developed from loess, having a similar texture of silt loam. Samples were collected from arable fields, forests and grasslands existing under the same land use for a long time (at least since the beginning of the 20th century) that is checked on available topographical maps [19]. The sampling sites were located in the patches of Chernozems preserved in the loess belt of South Poland (Wrocław Plain, Głubczyce Plateau, Miechów Upland, Hrubieszów Basin and Przemyśl Foothills) (Figure 1). However, field inspection during the sampling has revealed a deep leaching of carbonates or a lack of mollic/chernic horizons in some profiles respective to the present temperate climate [23] or history of occupation and land use [24]. Therefore, some soils did not fulfil the criteria of Chernozems in terms of World Reference Base (WRB) classification [25] and were classified as Phaeozems or Luvisols, in line with recent reports [26,27,28].
Soil samples were collected from the topsoil humus layers (i.e., from the depth of 0–10 cm in forest and grassland soils, and from the plow layer of arable soils) to obtain the closest relationship between the spectral picture of organic matter present in soil samples and the current vegetation cover. The plant cover of the non-arable areas consisted of multi-species grasslands and, in case of forest, we limited the type of vegetation to deciduous trees only. In the forest composition, we discriminated three main groups of stands, according to prevailing tree species: oak- (Quercus robur L.), beech- (Fagus sylvatica L.) and hornbeam-/maple-/lime- (Carpinus betulus, Acer pseudoplatanus L., Tilia cordata Mill) dominated stands.
As a testing material for the created statistical model, three buried soils from SW Poland were chosen from the barrows (kurgans) of the Funnel Beaker culture formed during the Neolithic period [29,30,31,32]. All buried soils were covered by a thick overlying barrow mound (up to 100 cm), which has preserved their humus horizons from transformation into Luvisols that naturally occurred in a direct surrounding of the kurgans. Samples from approximately 20 cm-thick layers were collected starting from the uppermost buried A horizon, down to the transitional AB horizons (the sampling depths differed in particular kurgans).
2.2. Sample Preparation and Analysis
From each location that represented a different type of vegetation cover, 2 to 5 samples were taken. The final database contained 348 soil samples in total. Samples were air-dried, crushed and sieved through a 2 mm mesh. For standard soil characteristics, the particle-size distribution was analyzed using the hydrometer method. The pH in a water suspension (1:5 v/v) was measured potentiometrically with a Mettler Toledo pH-meter, and the calcium carbonate content (equivalent) was determined by a volumetric method. The soil organic carbon (SOC) content was determined using a dry combustion method (CS-MAT analyzer, Bruker AXS Inc., Madison, USA). An estimation of SOC content allowed us to verify the correct selection of samples because it is recommended to build the spectral library using samples containing at least 0.3% SOC [19]. Before spectral measurements, samples were additionally ground to pass a 0.1 mm mesh, which aimed to homogenize the material as thoroughly as possible. Then, samples were dried at 37 °C to remove water absorbed from the air.
MIR spectra were performed on approx. 0.5 g of material using a Nicolet iZ10 FT-IR spectrometer with the Smart iTX accessory supplied with a diamond plate (Thermo Scientific) in the range 4000–525 cm−1 with a resolution of 2 cm−1. Recorded reflectance was transformed automatically into absorbance. Obtained spectra created a data matrix with 348 rows (samples) and 7200 columns (peaks), which were later averaged in blocks (consisting of 20 subsequent readings) to 340 columns that allowed for further discriminant analysis. Thus, the final resolution of spectral database was 40 cm−1.
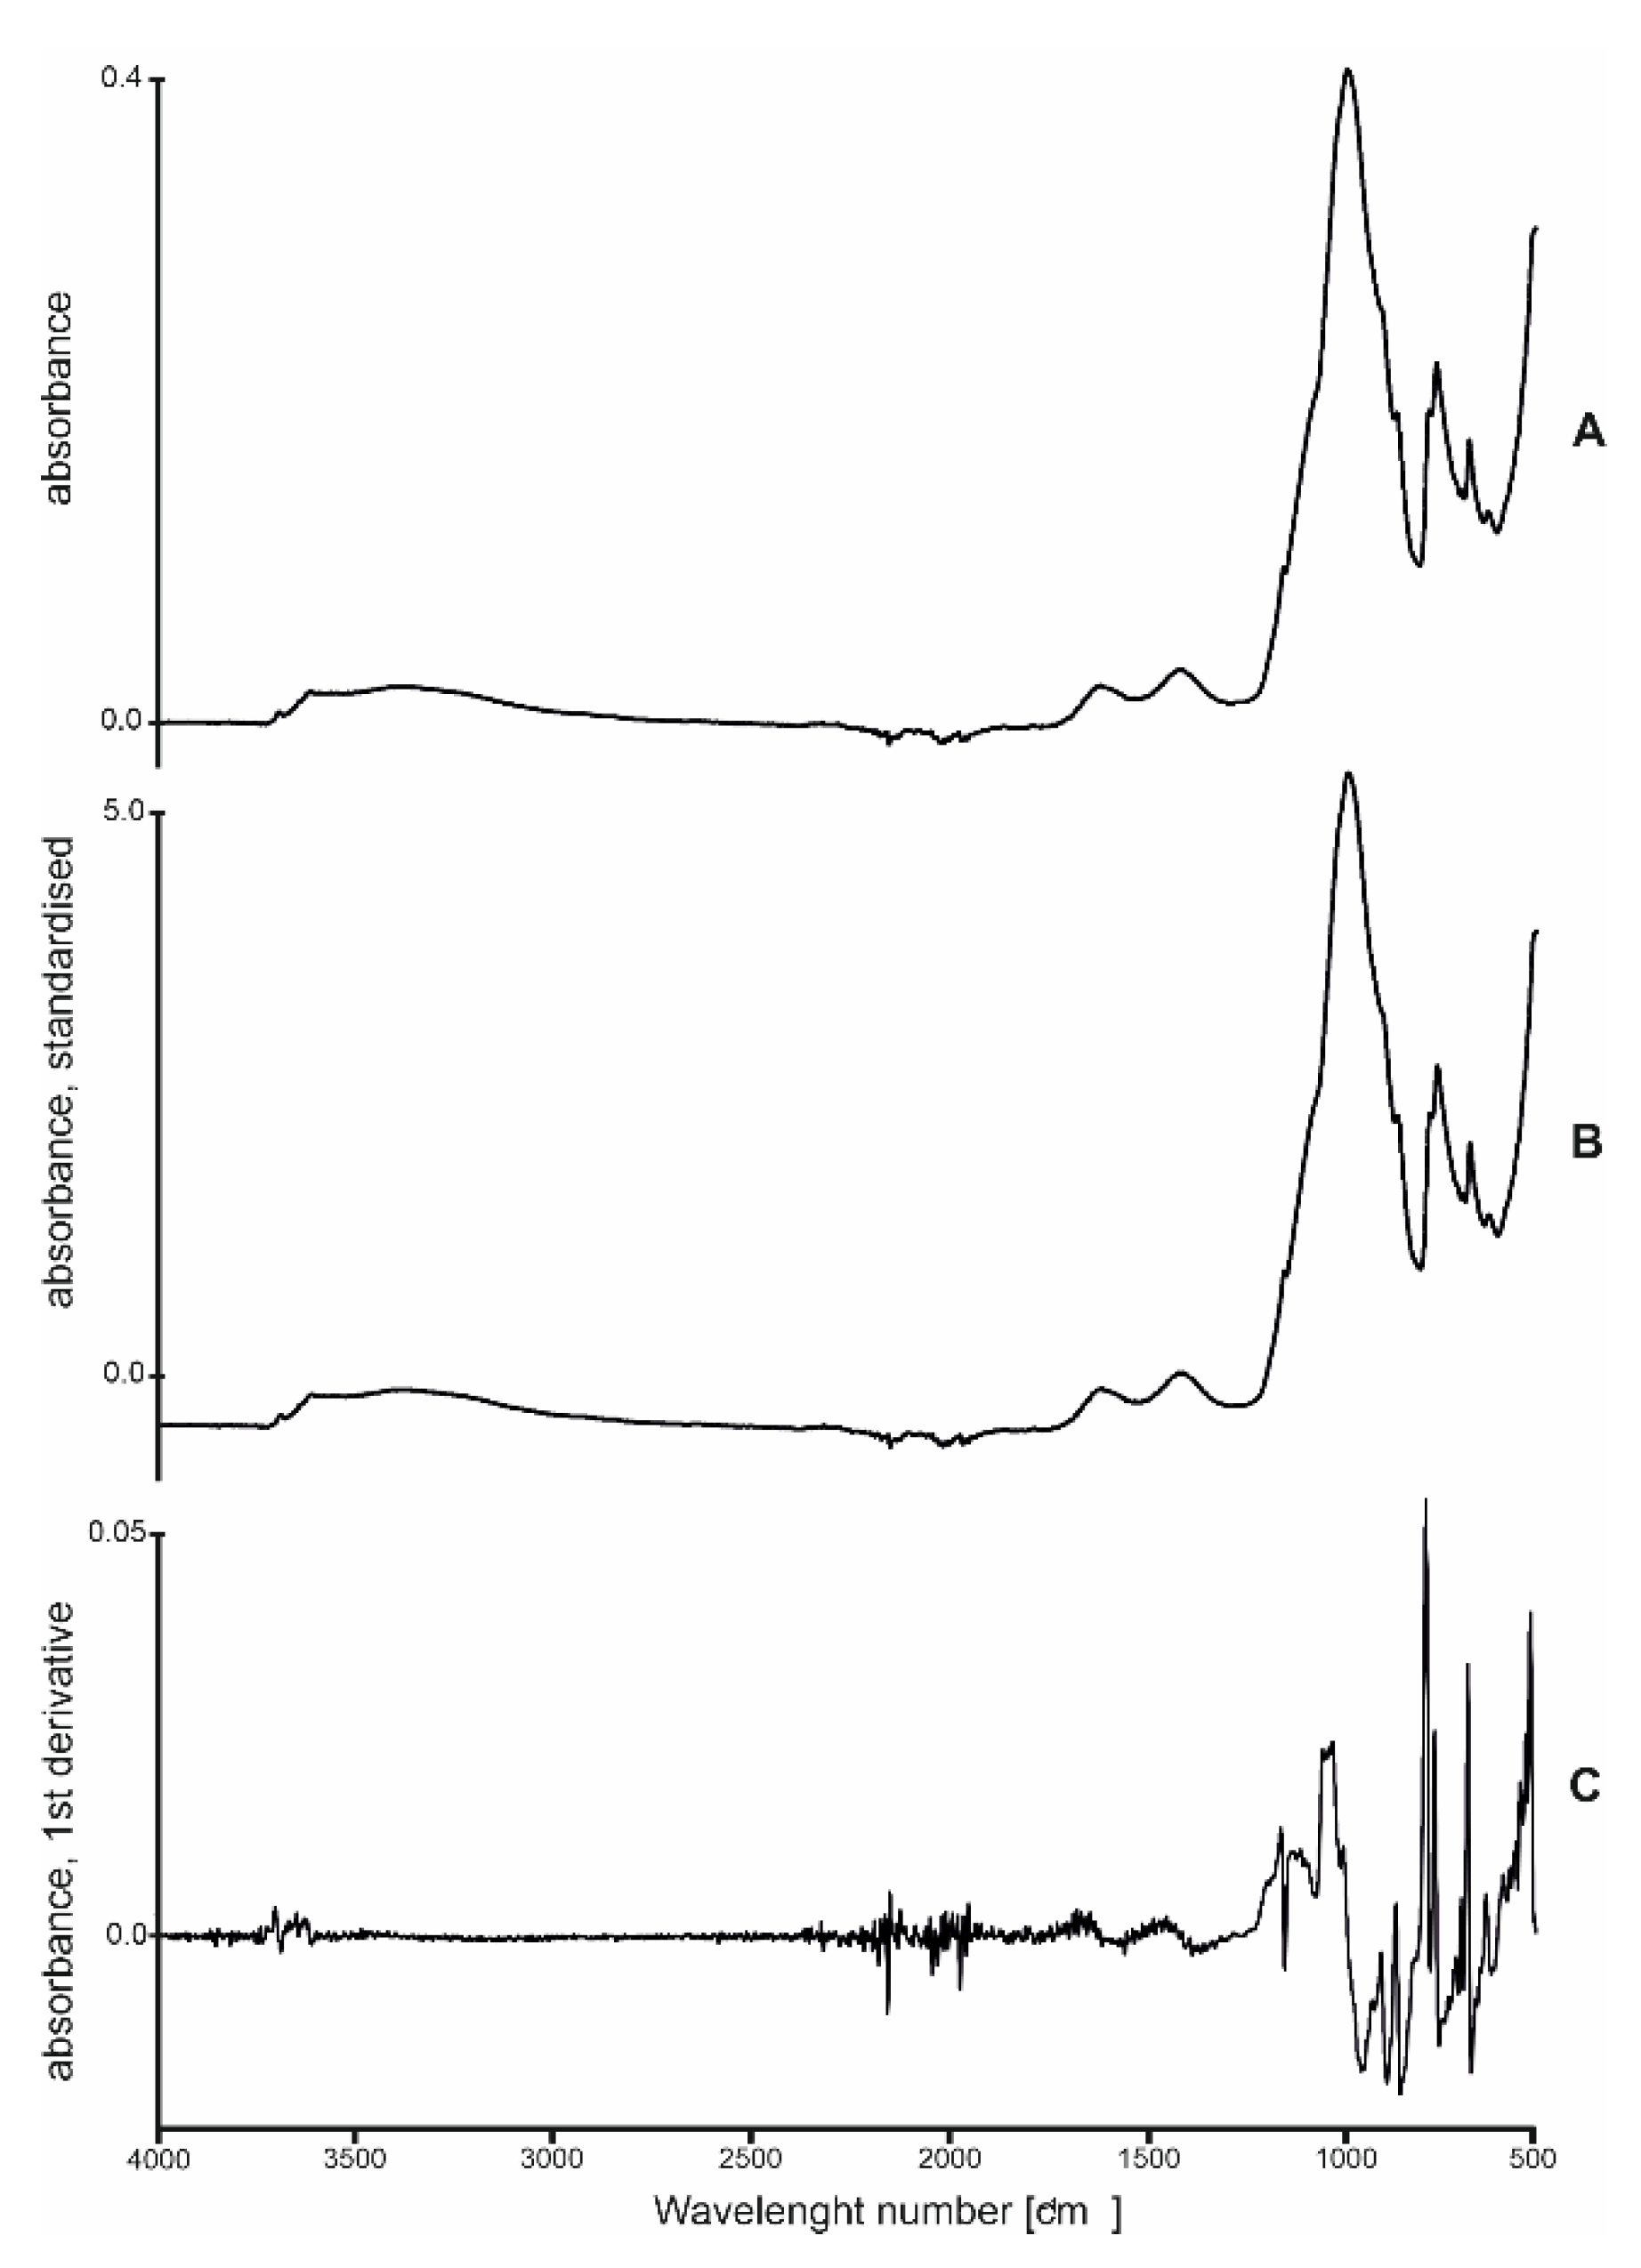
Two-step mathematical pretreatment [19,33] was performed (Unscrambler 10.4 software, Norway) to maximize the differentiation between the target groups of samples. First, the spectra were standardized to zero mean and variance = 1 (Figure 2B) to reduce the influence of organic matter quantity and the size of particles on the final spectral image. Then, the first derivative was applied (Figure 2C), which, as expected, increased the quantity of information from functional groups of organic compounds.
Ertlen [33] recommended the first or second derivative, respectively, to the Mahalanobis distances. The Mahalanobis distance, defined as the distance between means of canonical scores, was used to assess the discrimination between examined groups [34,35]. In the present study, no significant increase in Mahalanobis distances was observed between derived groups after the second derivative application; thus, further calculations were performed using the spectra after the standardization and application of the first derivative.
Canonical variate analysis (CVA), was applied (using a Systat 13.2 software, Chicago) to (a) distinguish the groups of samples based on multiple variables, i.e., the transformed MIR spectra, (b) to measure the Mahalanobis distances between groups and (c) predict the affinity of samples of unknown type/origin to the distinguished groups [33]. Additionally, basic properties of the distinguished groups were statistically characterized. SOC content and pH values had a normal distribution, checked by the Kruskal–Wallis test; thus, the mean values, standard errors and standard deviations were calculated to characterize the central tendency and data dispersion. The significance of differences between means was checked using the post-hoc LSD Fisher test at p < 0.05. All above mentioned calculations and related graphs were performed using the Statistica 13 package (USA).
3. Results
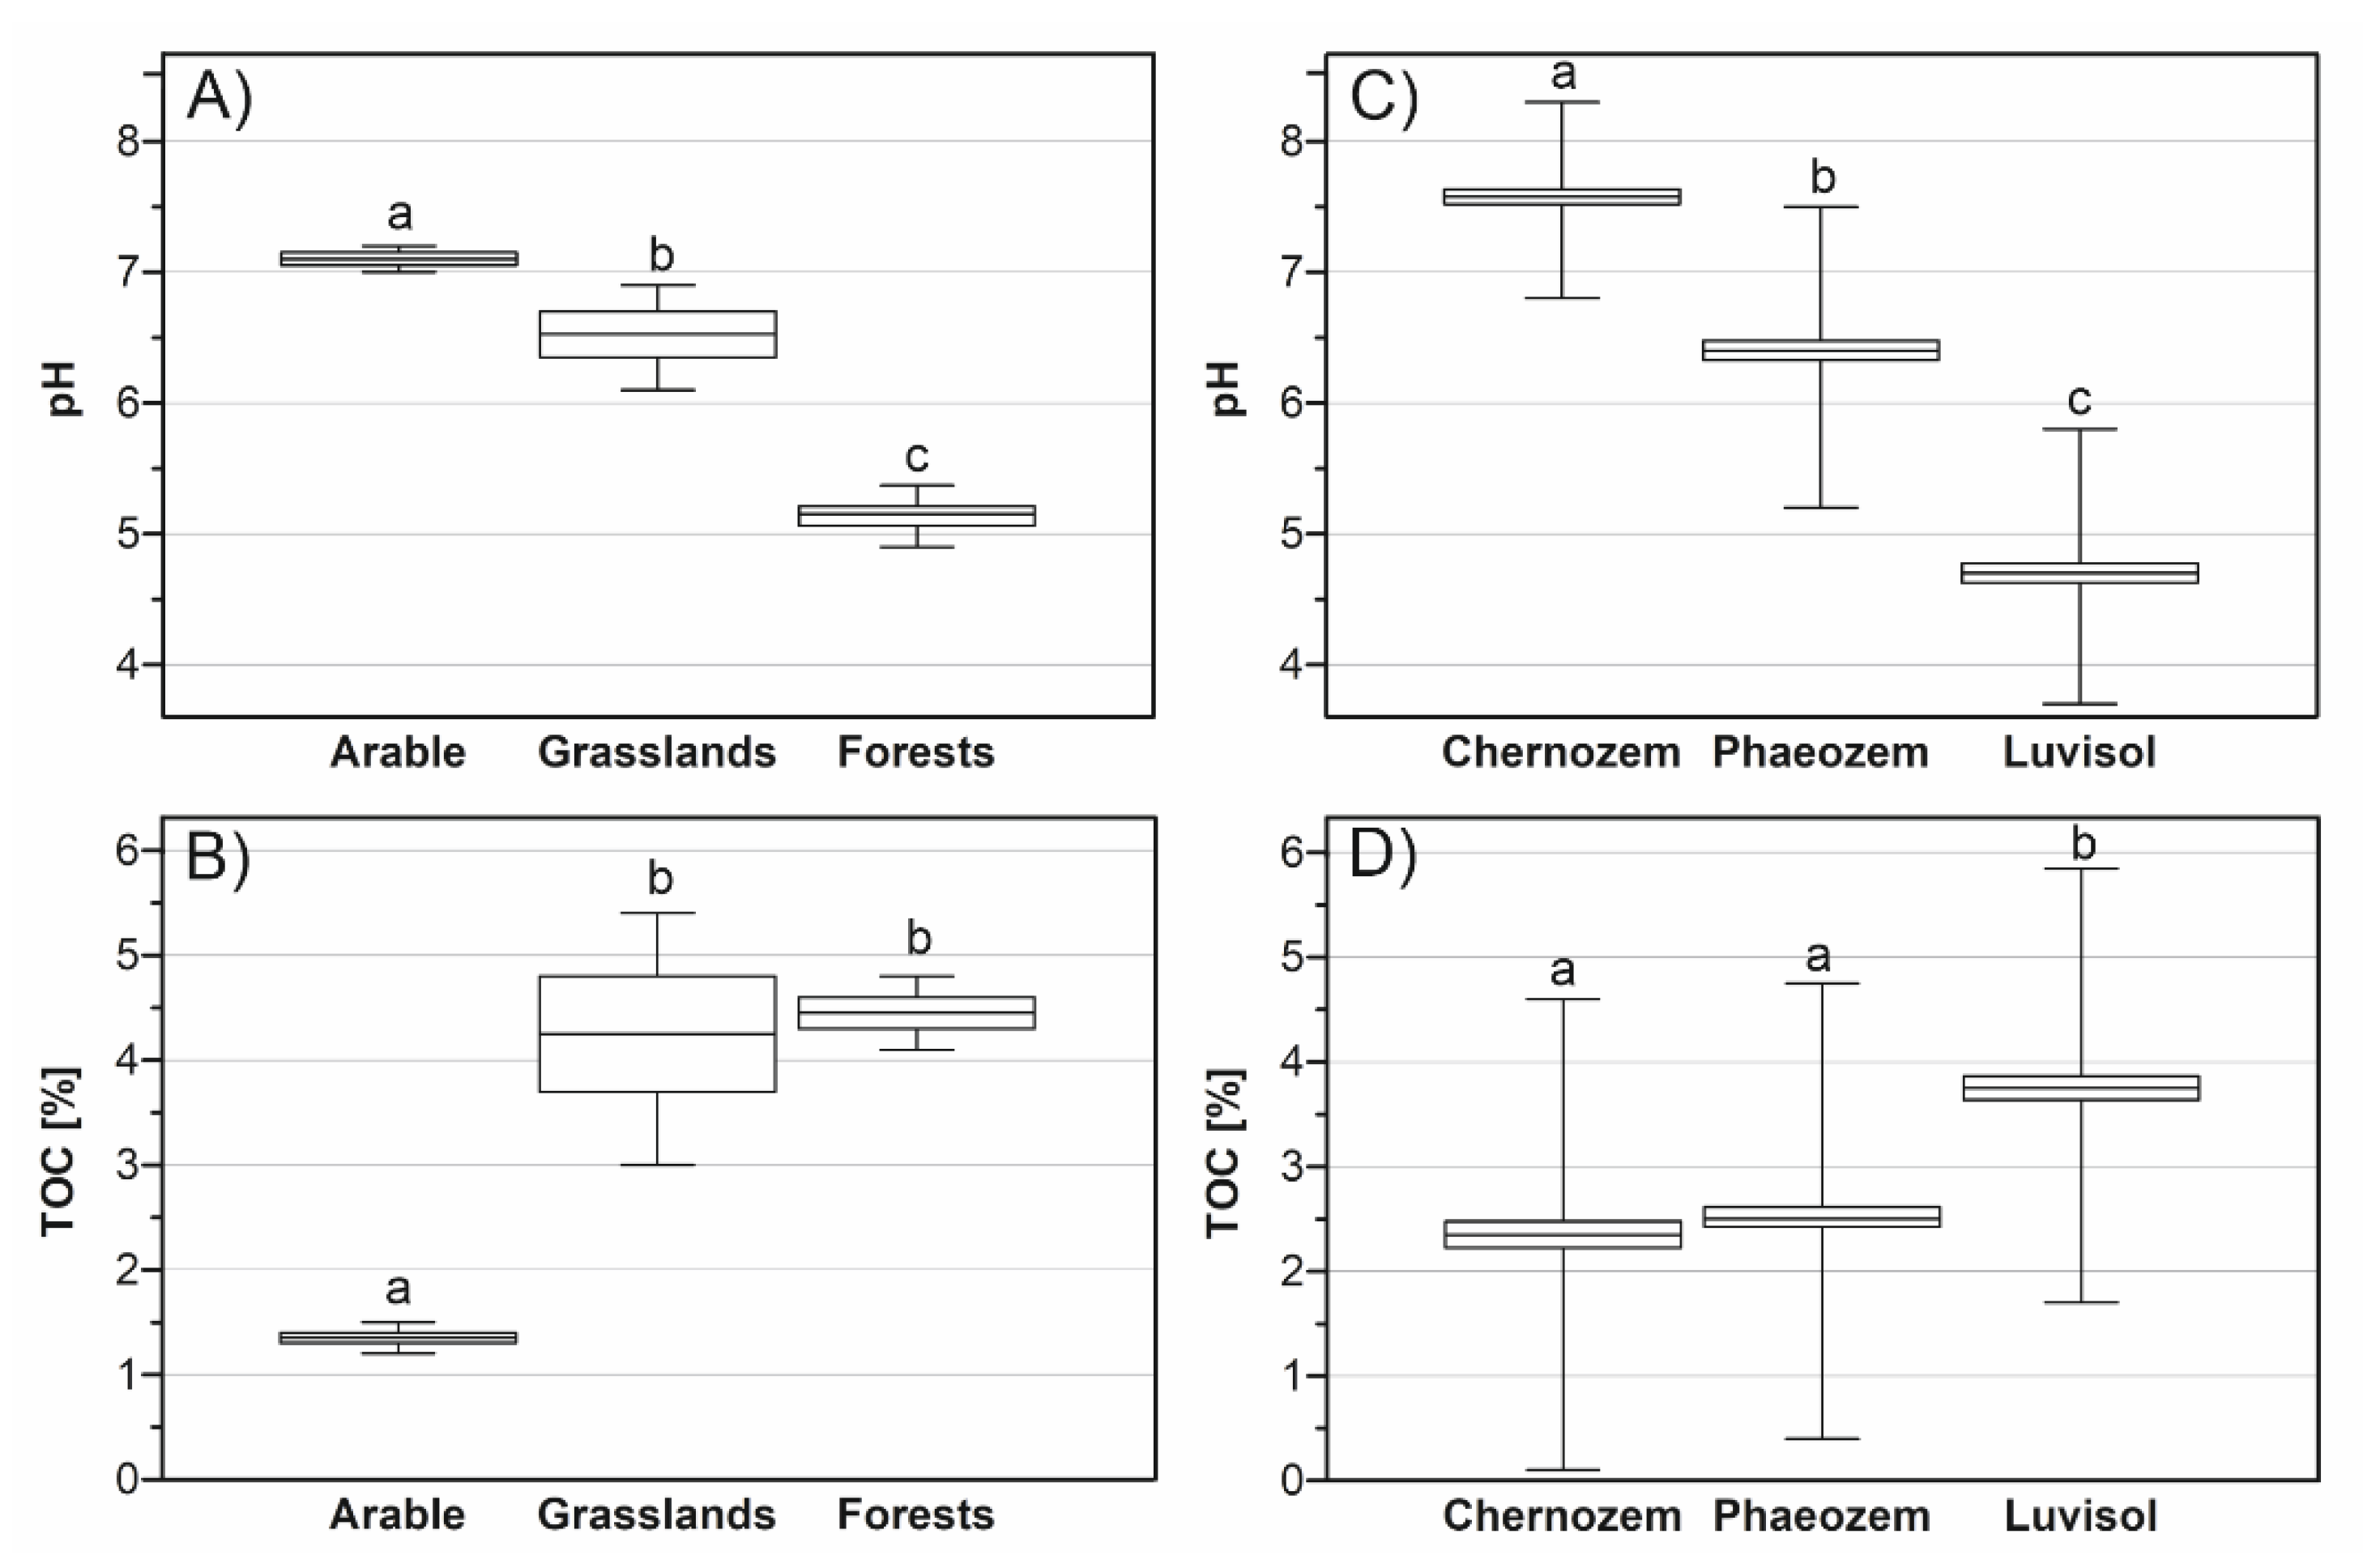
Although all soils under study were developed from similar parent material (loess) and presumably had a similar primary chernozemic origin, presently they differ in their physicochemical properties, mainly depending on land management. Arable soil had the highest, whereas forest soils—the lowest pH values, ca. 7 and 5, respectively (Figure 3A). Contrastingly, the SOC content was significantly higher in the forest and grassland than in arable soils, with average values ca. 4.3% and 1.3%, respectively (Figure 3B). Among the dominant soil types (i.e., reference soil groups in terms of WRB classification), the topsoil samples of Luvisols were acid, whereas the topsoil samples of Chernozems and Phaeozems were neutral or alkaline, with mean pH values of ca. 4.6 and 7.5, respectively (Figure 3C). The SOC content was less differentiated, but the mean SOC values in Luvisols, ca. 3.7%, were significantly higher than the mean SOC in Chernozems and Phaeozems, ca. 2.1–2.5% (Figure 3D).
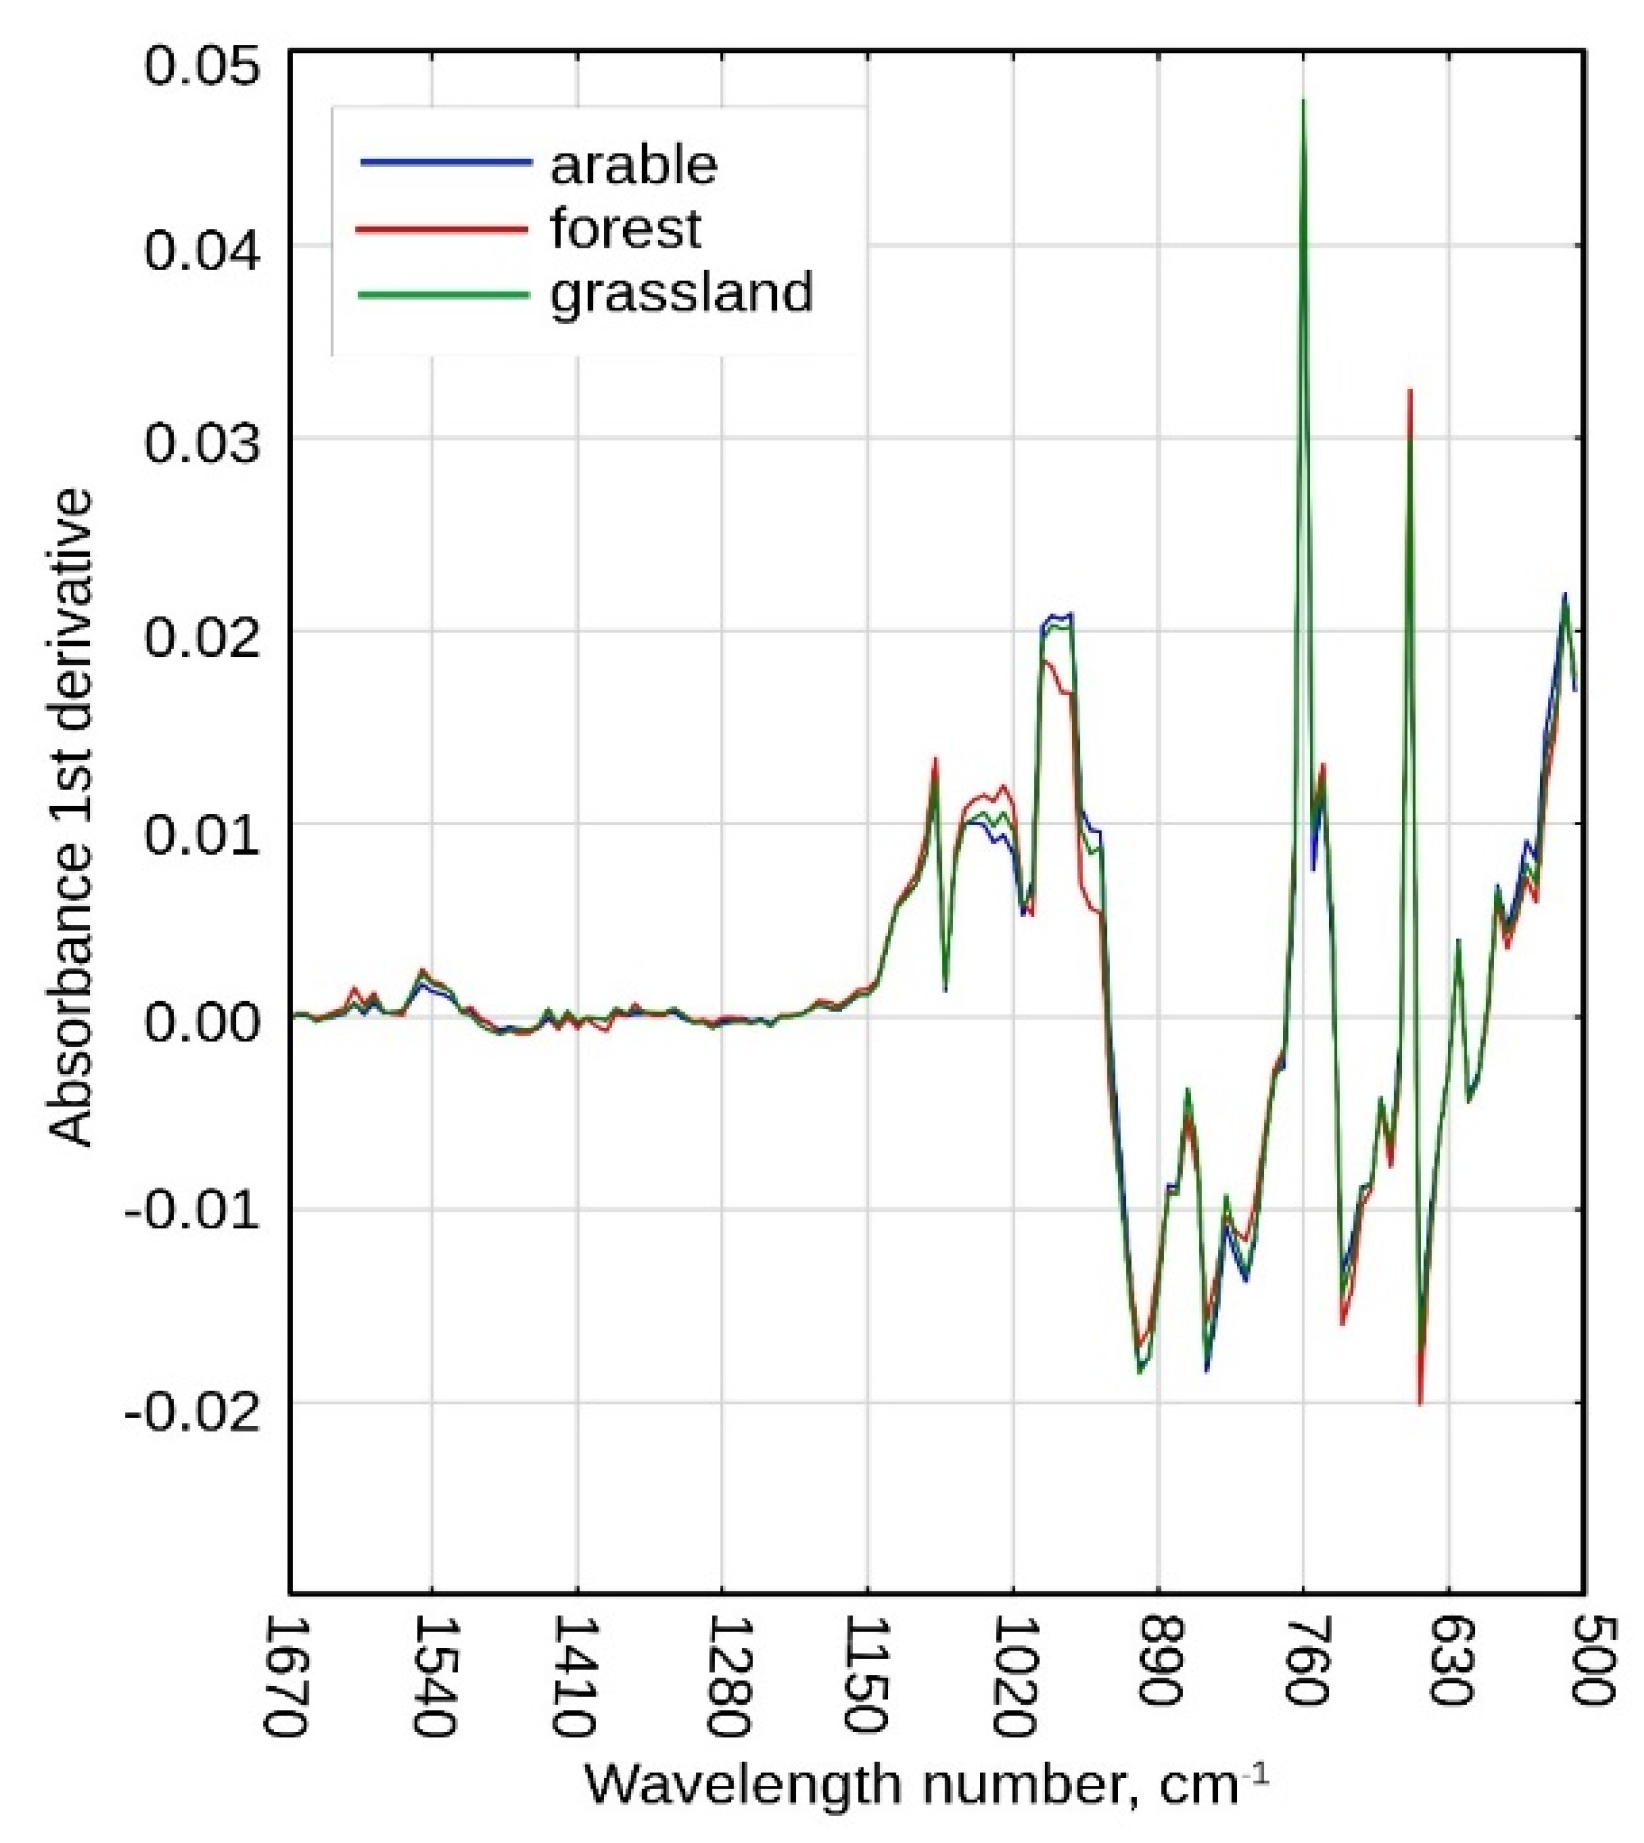
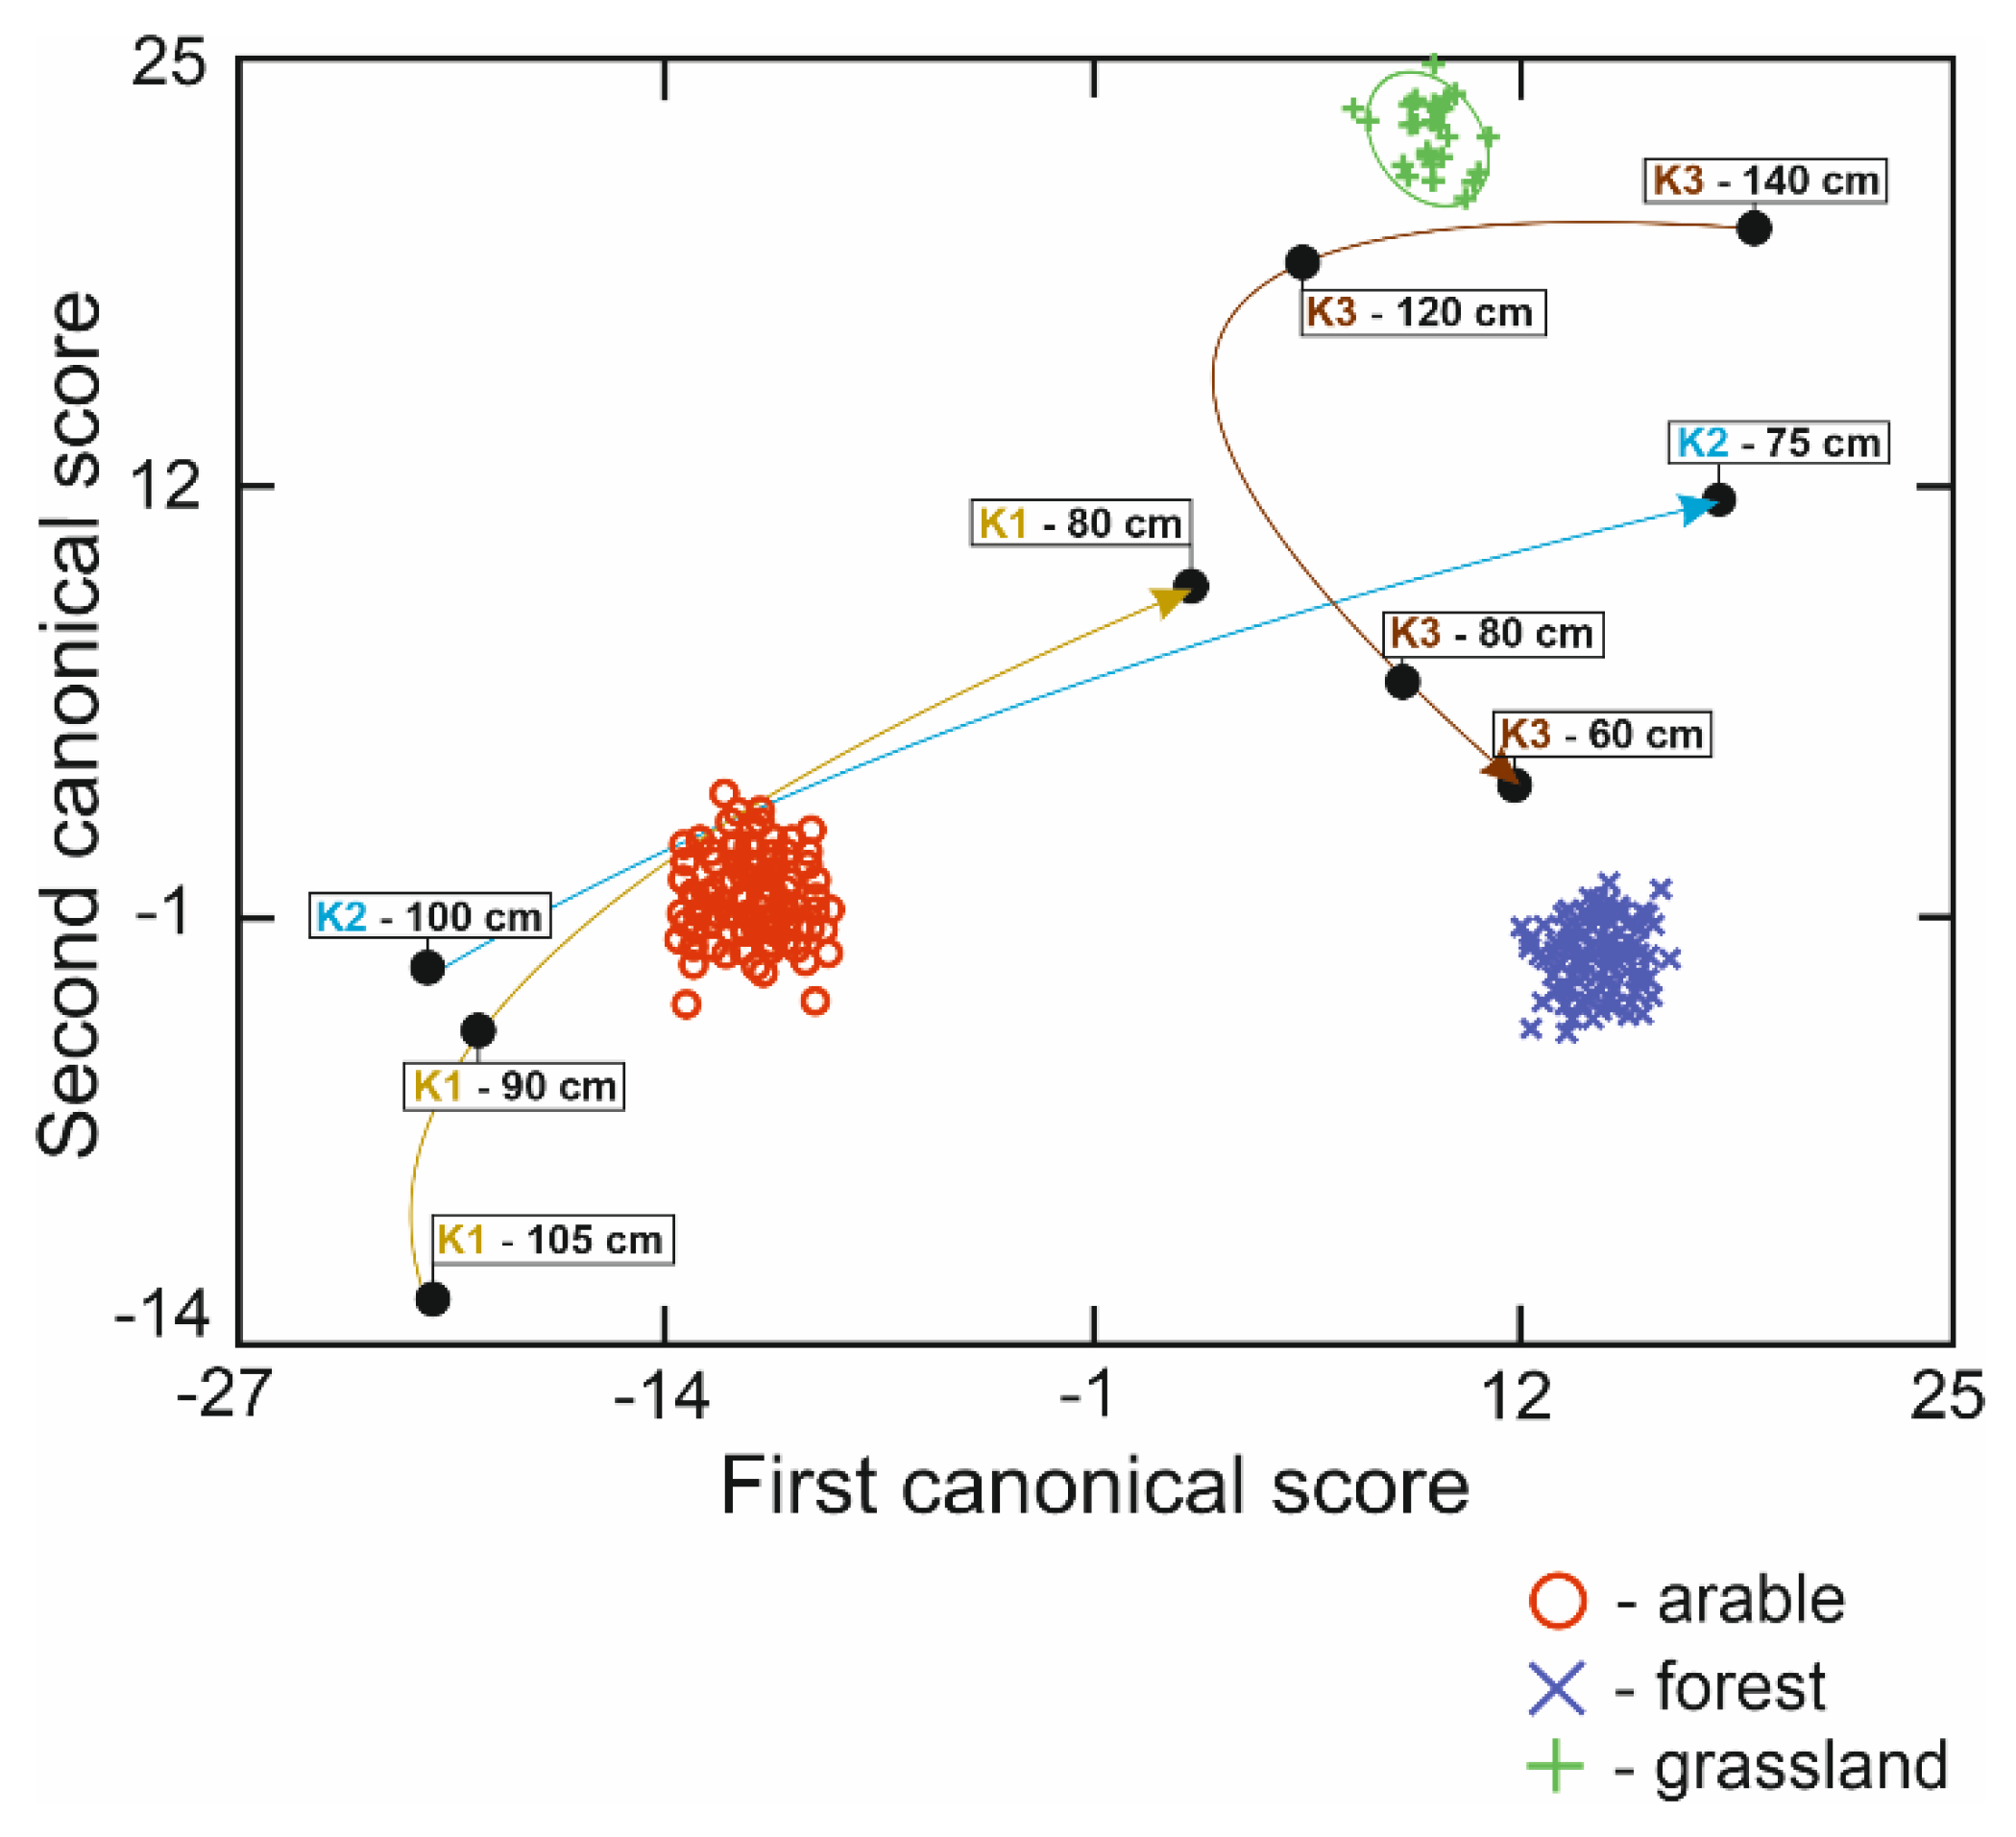
The MIR spectra (standardized, first derivative) averaged for the distinguished land-use classes clearly differed in intensity and width of characteristic bands, in particular in the Section 900–1100 cm−1 (Figure 4). These differences have variable scales for particular bands and their individual analysis does not reflect, neither quantitatively nor qualitatively, the mutual relationship between classes. In contrast, the canonical variate analysis yielded a clear differentiation, without mutual overlapping, of the soil samples into classes according to land use (Figure 5).
The Mahalanobis distances, used for quantification of the discrimination, exceeded the high values of 20–25 (Table 1). These high values related typically to one of two canonical variables, whereas they were much lower in relation to the other one (Table 1). Only the discrimination between arable and grassland soils was similarly strong in relation to both canonical variates (Table 1). The scores of the samples from buried humus horizons (where the land use of soil before the burial was unknown) were, in general, in the same range as those of surface soils but not always within the space between the land-use classes (Figure 5). However, the depth-related trends may be distinguished from an arrangement of the particular samples. In kurgans K2 and K3, the signal from the forest became stronger towards the buried soil surface. In kurgan K3, samples collected at a lower depth (115–140 cm) were placed closer to the grassland class, whereas in kurgan K2 the signal indicated arable lands. In both cases, the samples from a depth of 60–80 cm were located closer to the forest class. The score from the topsoil sample of buried soil in kurgan K1 was placed apparently in the center of the space between all three classes, indicating the relation to variable vegetation connected with these land-use forms.
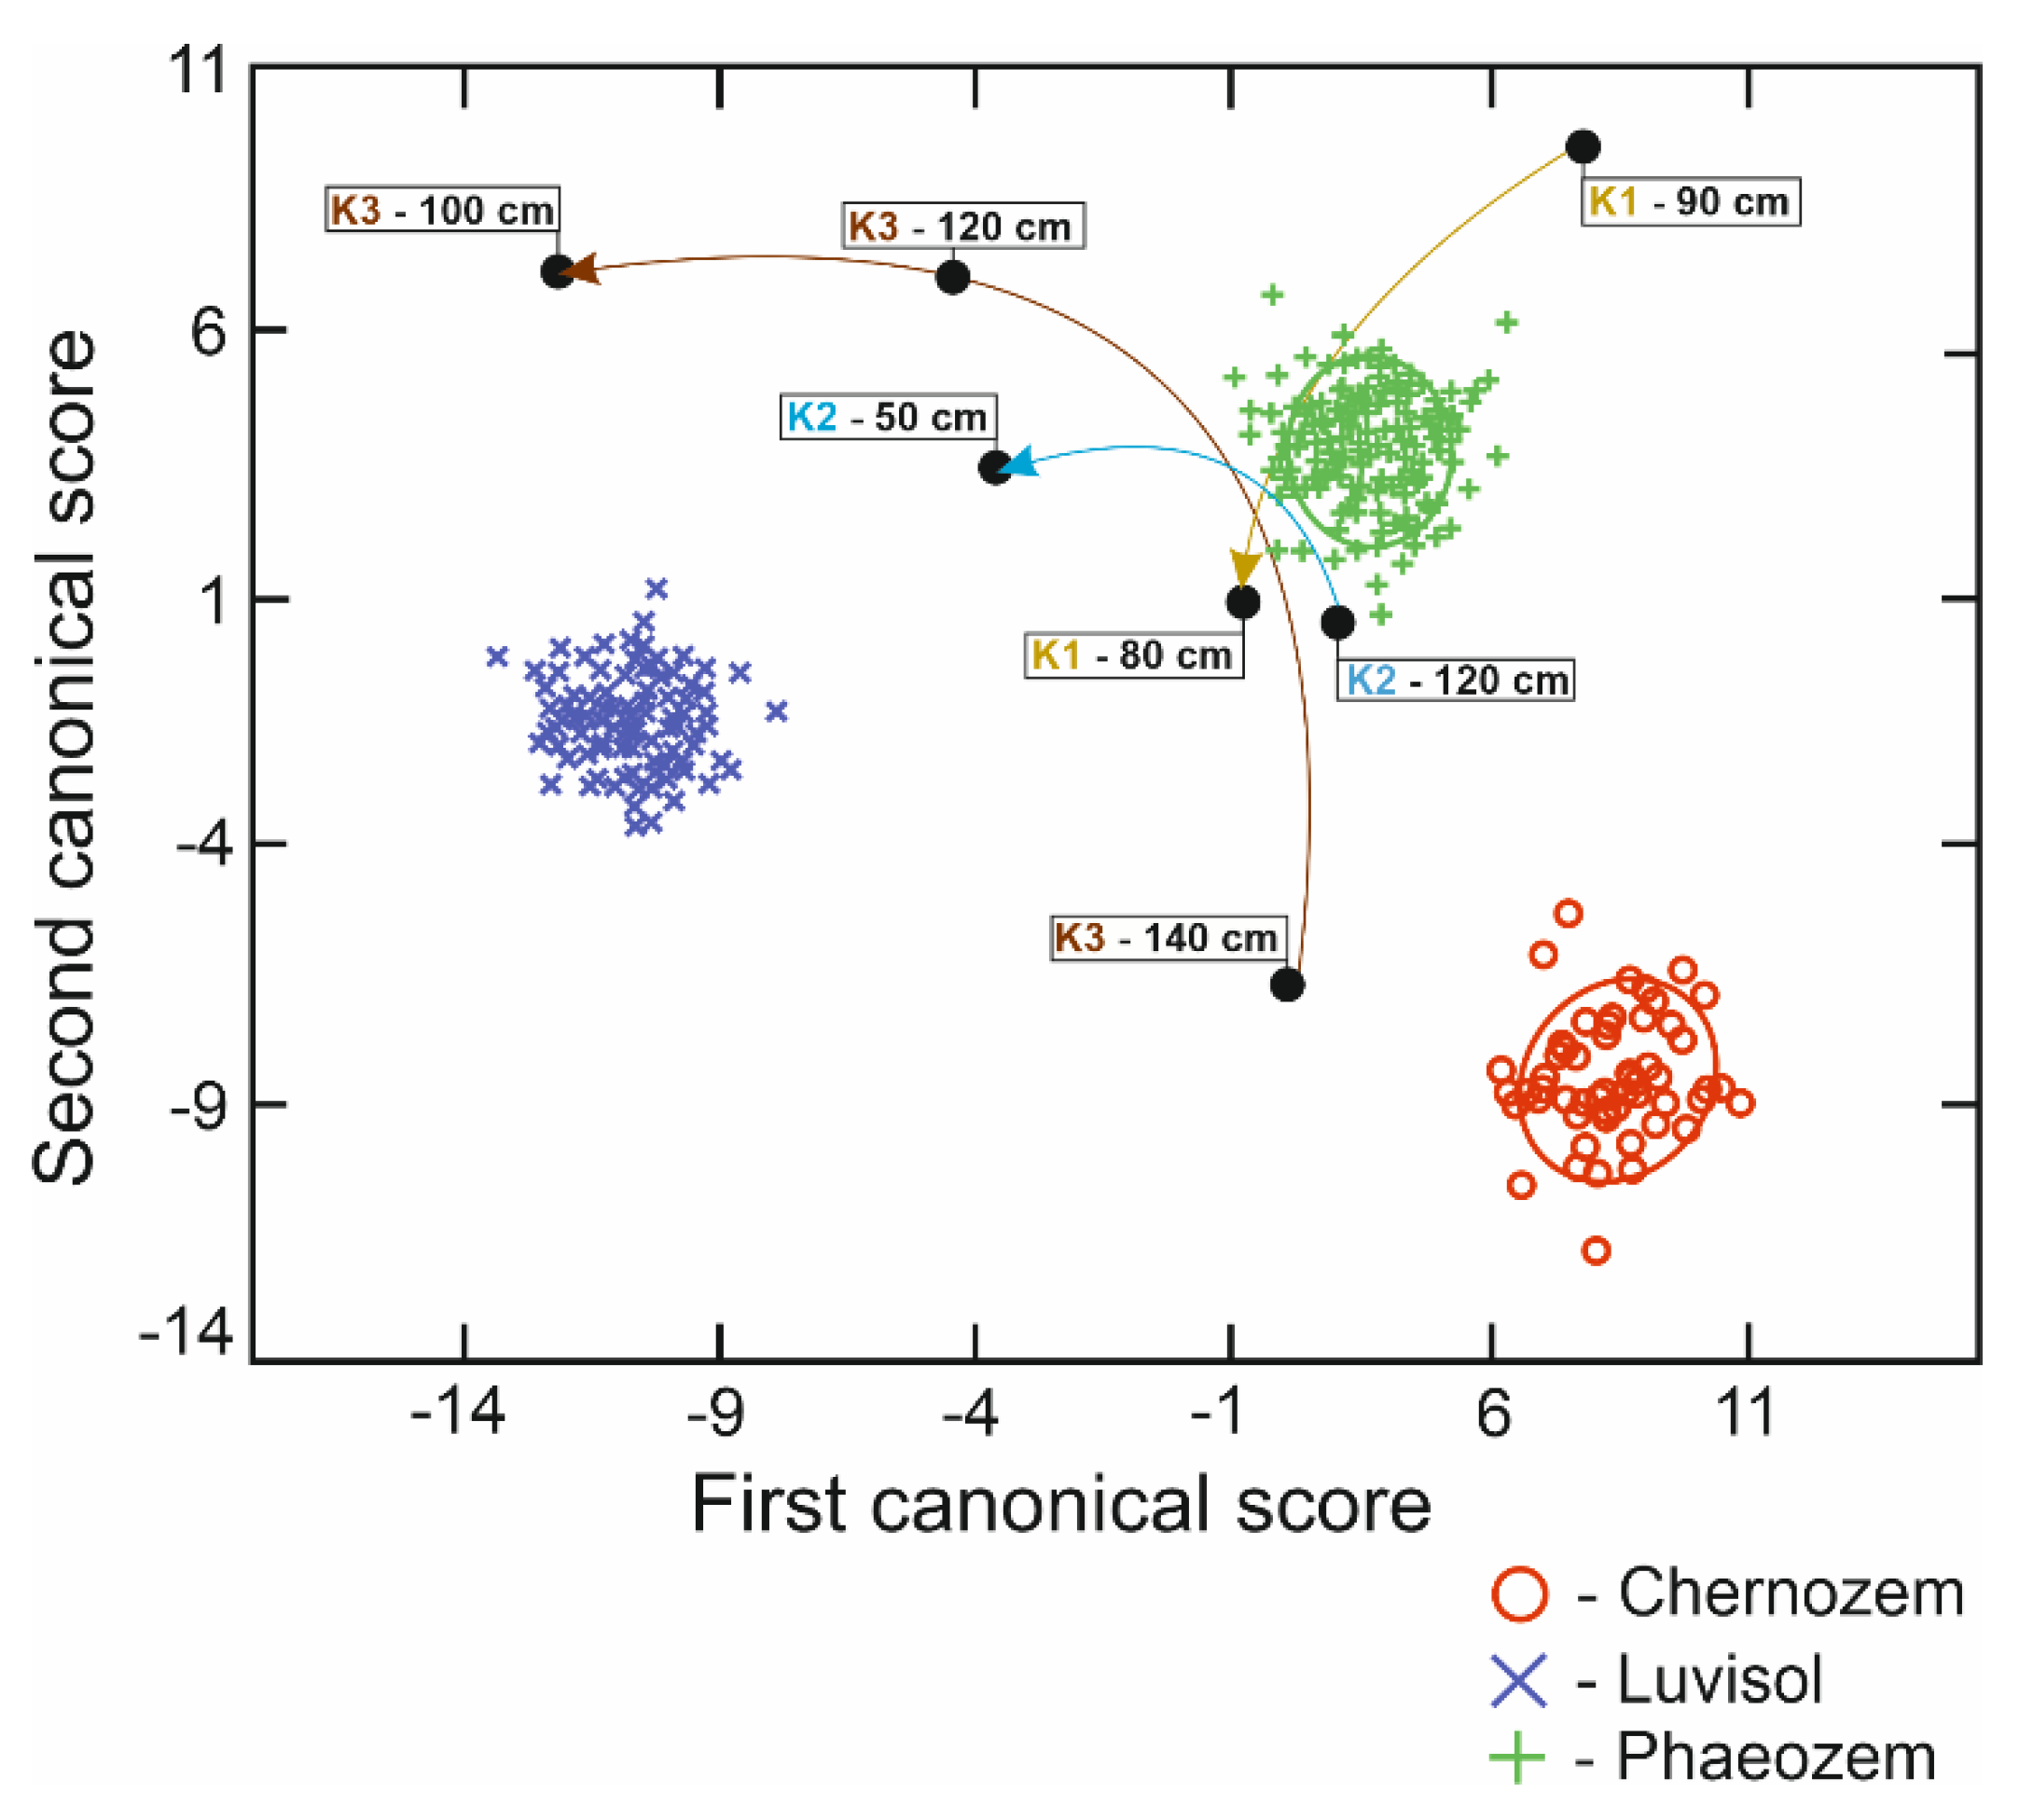
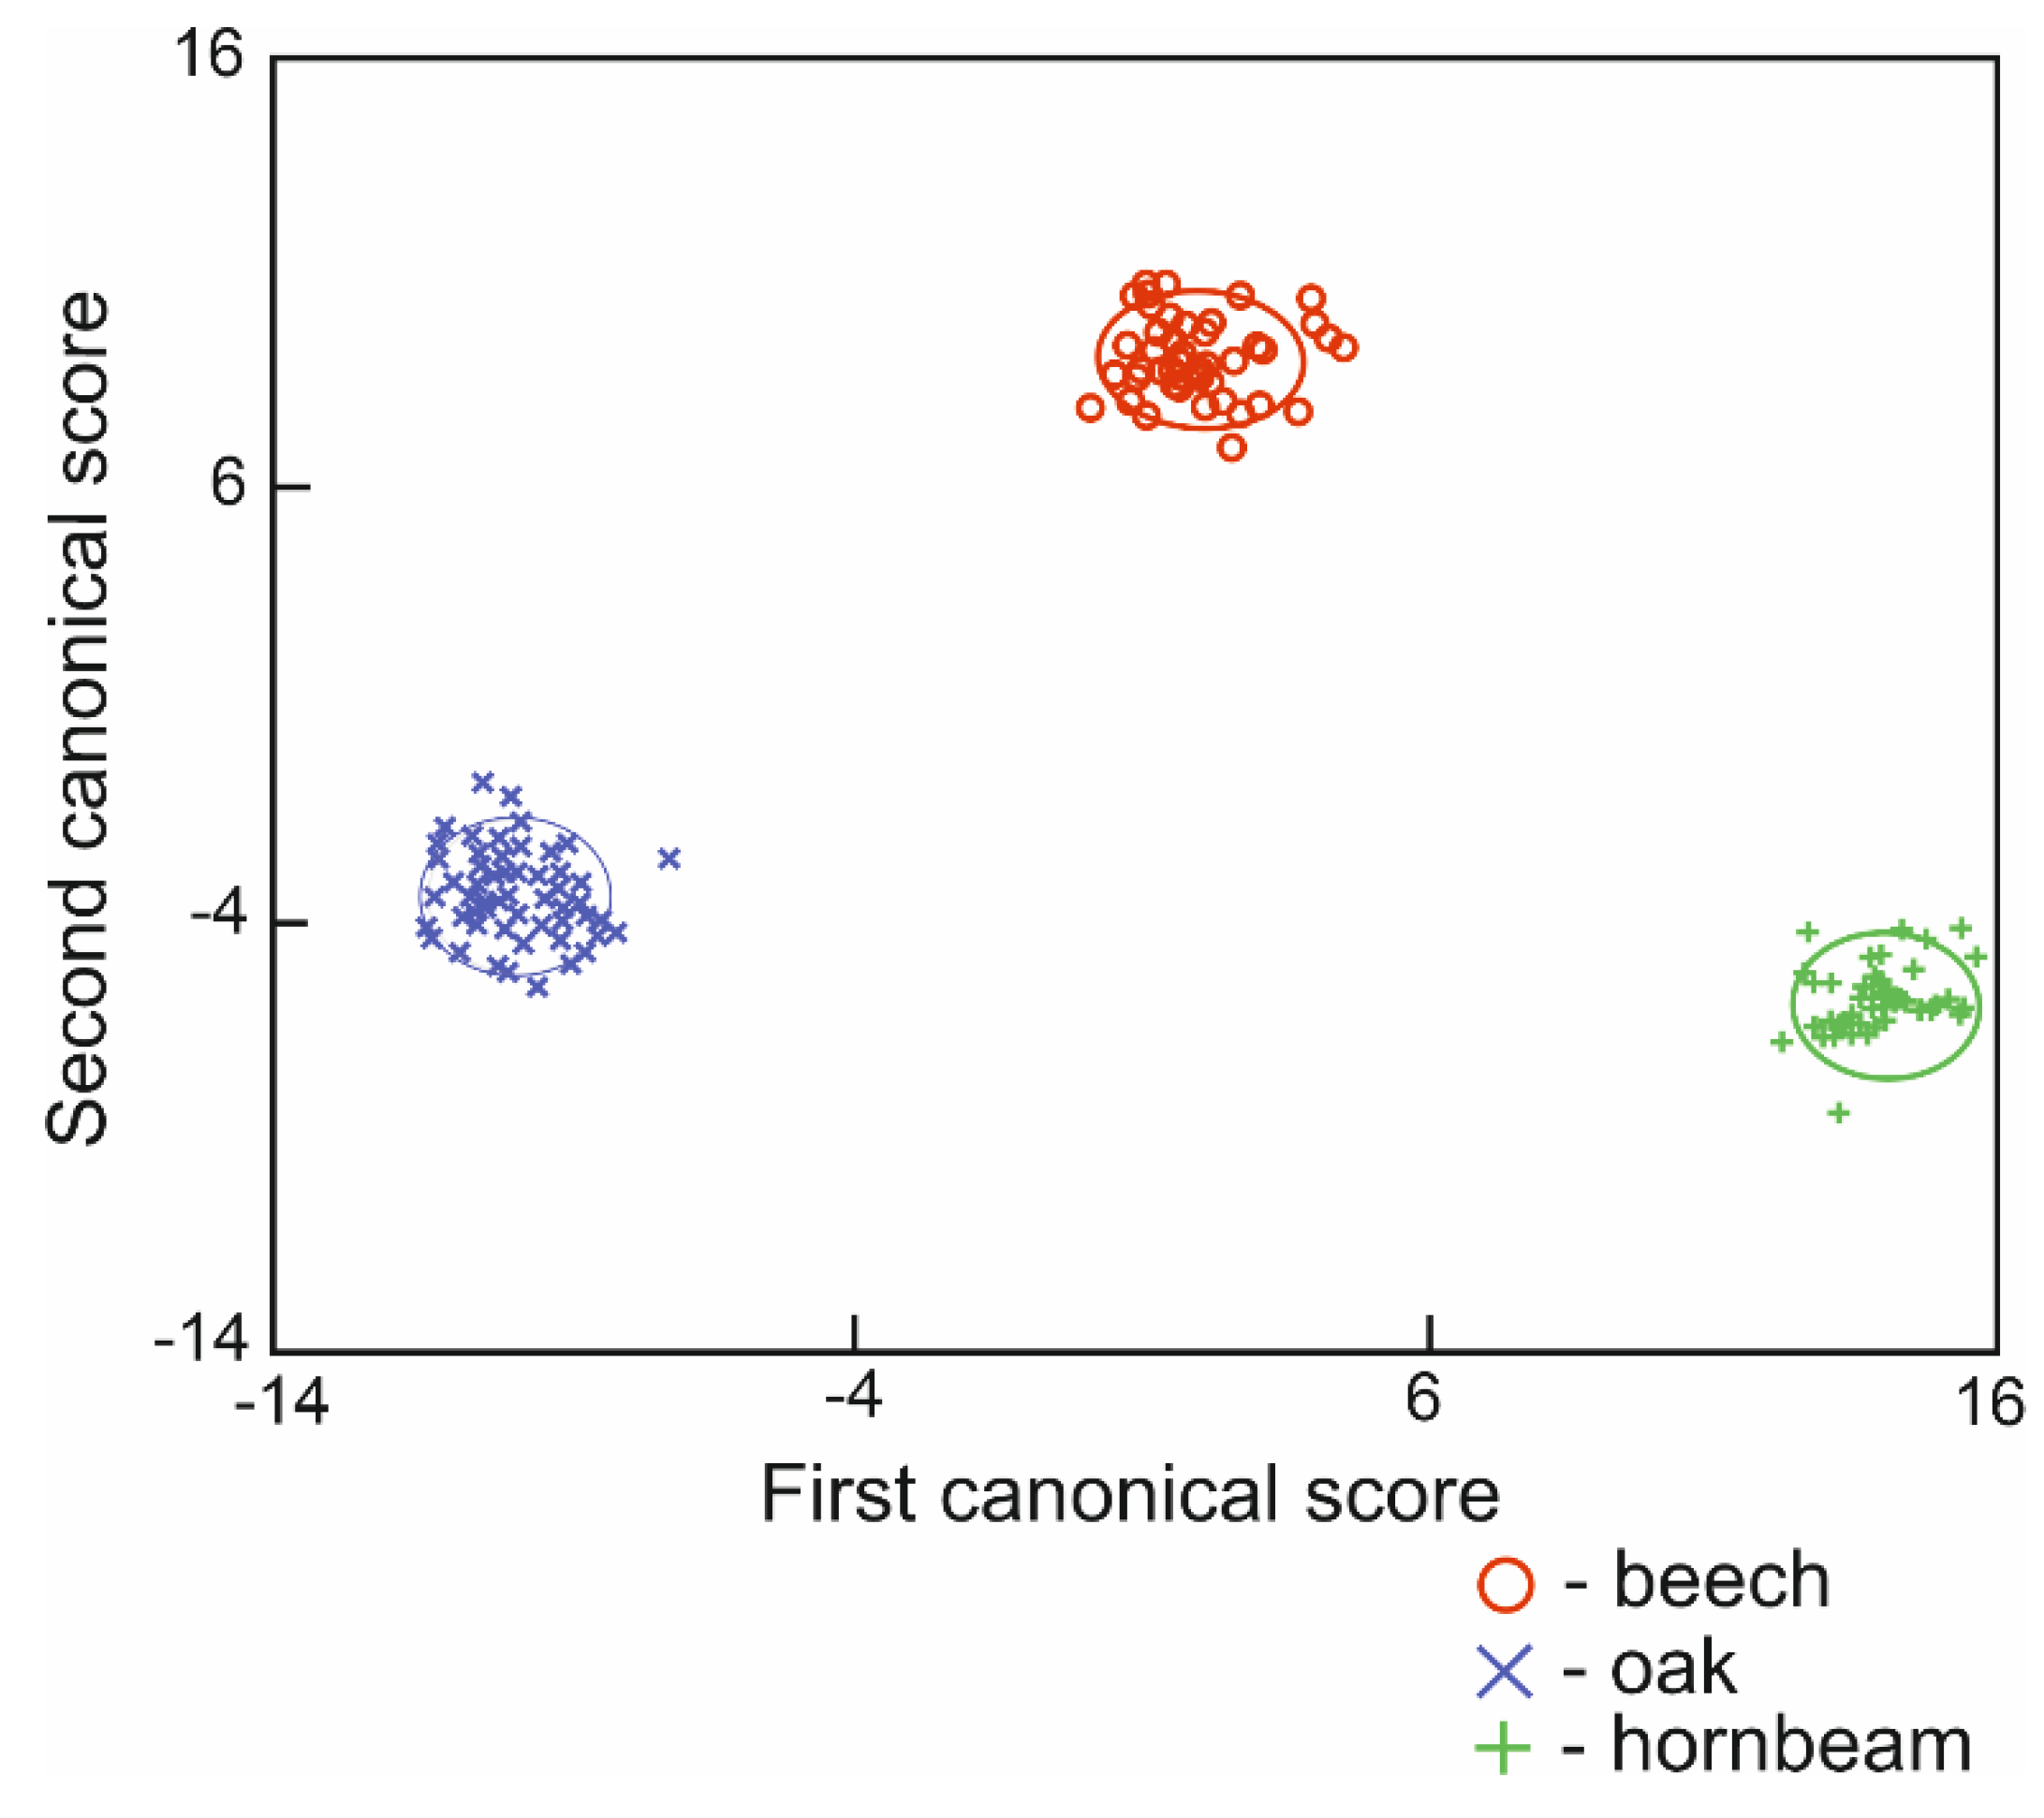
The canonical variate analysis applied to discriminate the samples among the classes related to soil type (reference soil group, i.e., Chernozems, Phaeozems and Luvisols) yielded a differentiation without mutual class overlapping but less prominent as compared to land-use classes (Figure 6). The Mahalanobis distances reached values of 13–19 between Chernozems/Phaeozems and Luvisols (according to the 1st variate), whereas the distances according to the 2nd variate were much lower (Table 1). The scores of the samples from buried humus horizons in the K3 kurgan indicated a poorly marked depth-related trend (i.e., samples from a lower depth are located closer to the Chernozem class, whereas samples from a shallower depth are located closer to the Phaeozem or Luvisols group). The sample from the deeper sub-layer of the buried humus horizon in kurgan K1 was close to Phaeozems, and the sample from an overlying sublayer was placed between Phaeozems and Luvisols. In general, the samples from soils buried under kurgans rarely had scores indicating their adjacency to Chernozems (Figure 6). Furthermore, the canonical variate analysis was applied to discriminate the samples of forest soils in relation to dominant forest vegetation. Even if the broadleaf forests under study had mixed species composition, the three classes were clearly differentiated (i.e., beech-, oak- and hornbeam-/maple-/lime-dominated stands (Figure 7). The 1st variate strongly discriminated between oak- and hornbeam-dominated forests (with the Mahalanobis distance reaching a value of 24, Table 1), whereas the 2nd variate clearly discriminated samples from beech-dominated forests from the other broadleaf stands (Mahalanobis distances of 12–15). Although the majority of buried soils under study did not indicate their adjacency to the forest class, a clear discrimination into classes related to species composition was not possible. However, the connection of buried soil’s organic matter with forest vegetation is not excluded, and further investigation on this field may require a larger set of data from burial profiles.
4. Discussion
The simple relationship of an origination of Chernozems and the presence of steppe vegetation and continental climate in Central Europe was recently questioned due to paleobotanic studies, which demonstrated the predominance of forest vegetation and strong human impacts during the Holocene. However, the other findings suggested that the early removal of forests and the expansion of pastures and arable lands since the Neolithic period could preserve or even restore some of these soils [28,29,36,37]. The determination of organic matter was successfully conducted by [19] in some buried Central European Chernozems using NIR spectroscopy. In this reconstruction, the bottom parts of the humus horizons predominantly had a signature of grasslands, whereas the spectra from topsoil horizons indicated stronger influences of broadleaf forests. Contrary to [19], we believe that such paleopedological reconstructions should involve the humus horizons of arable soils, in addition to grassland and forests soils, because we cannot exclude that the fertile Chernozems were cultivated before their burial [37,38]. The spectroscopic signal from the humus horizons from arable, forest and grassland soils (all developed from loess and originally located in chernozemic zones) differed clearly in this study (Figure 5 and Figure 6), which allowed displaying the samples of unknown history in relation to three (instead of two) classes of vegetation, as previously tested by Ertlen [18]. The spectroscopic signals in the samples collected from sublayers of three soils buried under Neolithic kurgans in SW Poland suggested various scenarios (from the bottom towards topsoil layers of the buried soil). The change from grassland to forest vegetation (kurgan K3) is consistent with the findings of [19]. In contrast, the change from arable to mixed grassland/forest vegetation (kurgans K1 and K2) indicates that the period of early cultivation was replaced further with pastures or open forests, which also may indicate human occupation and intentional land management, but less intense [24].
The MIR spectra analyzed in relation to the recognized soil type (reference soil group in terms of WRB classification) yielded three well-discriminated classes (Chernozems, Phaeozems and Luvisols), which suggested the possibility of a direct reconstruction of the transformation trends in the buried soils (Figure 5). The canonical scores of some soil samples did not fit the “space” created by the abovementioned three classes. This result suggests possible influences from the other physicochemical soil components important for pedogenic processes, such as carbonates and clay minerals [39]. However, the placement of some samples indicated the soil transformation (analyzed as the change from the bottom towards topsoil layers of the buried soil) from Chernozem through Phaeozem towards Luvisol (kurgan K3) and from Phaeozem towards Luvisol (kurgans K1 and K2), which is consistent with opinions regarding the transformations of chernozemic soils during the Holocene period [19,29,40,41]. Clear discrimination of the topsoil horizons of modern soils into non-overlapping classes referring to the land use and soil type has confirmed the potential of non-destructive spectroscopic methods in paleopedological studies. Unfortunately, the samples tested in the present research were obtained from three already available buried profiles; therefore, the presented findings are single case studies, and a larger number of buried soils must be investigated to draw more general conclusions.
In the present research, we tested the relevance of MIR spectroscopy in the studies on the origin/affinity of organic matter in humus horizons of chernozemic soils as well as the applicability of MIR spectroscopy for studies on the composition of transformation or organic substances [42,43,44]. However, the spectral range 4000–525 cm−1 was considered by some researchers to be too resourceful for efficient work due to the much stronger peaks in the entire spectrum compared to VIS and NIR spectroscopy [45,46,47]. Previous attempts of paleoenvironmental reconstructions were conducted using NIR spectroscopy [18,19]. However, the Mahalanobis distances between the identified classes, obtained in the present research, were relatively high and even exceeded the value of 20 (Table 1), which guaranteed the clear disjunction of classes (Figure 5 and Figure 6). Thus, despite the large variety of information in the MIR spectrum, MIR may differentiate samples in relation to analyzed variables after respective mathematical pretreatment and using multivariate discrimination analysis. It was, therefore, concluded that MIR spectroscopy may have similar applicability in the paleopedological and paleoecological reconstructions as NIR spectroscopy. As shown in Figure 7, MIR spectra discriminate clearly between topsoil samples in relation to dominant forest vegetation, which confirms the applicability of this technique for studies of forest soil transformation, as previously confirmed for NIR spectroscopy [48,49,50,51].
5. Conclusions
Our study showed that MIR application in the process of reconstruction of Chernozems’ history may have similar applicability to previous studies using NIR spectroscopy. This conclusion results from the high Mahalanobis values and clear disjunction of vegetation classes presented in this study. However, we also stated that further paleopedological studies on Chernozems’ history by using infrared spectroscopy should involve additional groups of arable soils samples, in addition to grassland and forests groups. Results acquired by the addition of a third set of data to the procedure support the theory that one preservation mechanism of Chernozems in the Holocene could be the introduction of early cultivation, pastures and open forests by human occupation. Additionally, the combination of canonical data of MIR spectra in relation to the soil reference groups and dominant forest vegetation showed the potential applicability of this technique in studies of soil transformation; for example, under forest ecosystems. However, it should be noted that minimizing background interference and using a large set of samples is crucial to draw conclusions with increased certainty.
Author Contributions
All authors contributed to the development of the ideas and authoring of the paper. Conceptualization, M.D., C.K. and B.Ł.; methodology, M.D. and C.K.; software, M.D.; formal analysis, M.D., P.M., B.Ł.; investigation, M.D., P.M., M.B., A.M.-J.; resources, M.D., C.K., B.Ł.; data curation, M.D., C.K. and B.Ł.; writing—original draft preparation, M.D., M.B.; writing—review and editing, C.K., B.Ł., A.M.-J.; visualization, M.D., C.K.; supervision, C.K., B.Ł., A.M.-J.; project administration, B.Ł.; funding acquisition, C.K. and B.Ł. All authors have read and agreed to the published version of the manuscript.
Funding
This work was founded by the National Science Center, from the project: “Origin and transformation of chernozemic soils in Poland in relation to the climatic changes and influence of settlement and human activity since the beginning of the Neolithic period” (grant no. 2018/29/B/ST10/00610).
Data Availability Statement
All field and analytical data will be available from public repository after project finalizing and data completing.
Acknowledgments
We express our gratitude to Damien Ertlen for his guidance and supervision during the development of spectral database. Moreover, we would like to express gratitude to the staff of: Regional Director of Environmental Protection in Lublin, Forest District Mircze and Forest District Kańczuga for enabling conduction of forest research and soil sampling.
Conflicts of Interest
The authors declare no conflict of interest. The funders had no role in the design of the study; in the collection, analyses, or interpretation of data; in the writing of the manuscript, or in the decision to publish the results.
References
- Aguiar, N.O.; Novotny, E.H.; Oliveira, A.L.; Rumjanek, V.M.; Olivares, F.L.; Canellas, L.P. Prediction of humic acids bioactivity using spectroscopy and multivariate analysis. J. Geochem. Explor. 2013, 129, 95–102. [Google Scholar] [CrossRef]
- Madejová, J. FTIR techniques in clay mineral studies. Vib. Spectrosc. 2003, 31, 1–10. [Google Scholar] [CrossRef]
- Workman, J.; Shenk, J. Understanding and using the near-infrared spectrum as an analytical method. Near-Infrared Spectrosc. Agric. 2004, 44, 1–10. [Google Scholar] [CrossRef]
- Tinti, A.; Tugnoli, V.; Bonora, S.; Francioso, O. Recent applications of vibrational mid-infrared (IR) spectroscopy for studying soil components: A review. J. Cent. Eur. Agric. 2015, 16. [Google Scholar] [CrossRef]
- Javadi, S.H.; Munnaf, M.A.; Mouazen, A.M. Fusion of Vis-NIR and XRF spectra for estimation of key soil attributes. Geoderma 2020, 385. [Google Scholar] [CrossRef]
- Waruru, B.K.; Shepherd, K.D.; Ndegwa, G.M.; Sila, A.; Kamoni, P.T. Application of mid-infrared spectroscopy for rapid characterization of key soil properties for engineering land use. Soils Found. 2015, 55, 1181–1195. [Google Scholar] [CrossRef] [Green Version]
- Cozzolino, D.; Morón, A. The potential of near-infrared reflectance spectroscopy to analyse soil chemical and physical characteristics. J. Agric. Sci. 2003, 140, 65. [Google Scholar] [CrossRef]
- Barthès, B.G.; Kouakoua, E.; Coll, P.; Clairotte, M.; Moulin, P.; Saby, N.P.A.; Le Cadre, E.; Etayo, A.; Chevallier, T. Improvement in spectral library-based quantification of soil properties using representative spiking and local calibration—The case of soil inorganic carbon prediction by mid-infrared spectroscopy. Geoderma 2020, 369, 114272. [Google Scholar] [CrossRef]
- Viscarra Rossel, R.A.; McBratney, A.B. Soil chemical analytical accuracy and costs: Implications from precision agriculture. Aust. J. Exp. Agric. 1998, 38, 765–775. [Google Scholar] [CrossRef]
- Chodak, M.; Niklińska, M.; Beese, F. Near-infrared spectroscopy for analysis of chemical and microbiological properties of forest soil organic horizons in a heavy-metal-polluted area. Biol. Fertil. Soils 2007, 44, 171–180. [Google Scholar] [CrossRef]
- Chang, C.-W.; Laird, D.A.; Mausbach, M.J.; Hurburgh, C.R. Near-infrared reflectance spectroscopy-principal components regression analyses of soil properties. Soil Sci. Soc. Am. J. 2001, 65, 480–490. [Google Scholar] [CrossRef] [Green Version]
- Raspolli Galletti, A.M.; D’Alessio, A.; Licursi, D.; Antonetti, C.; Valentini, G.; Galia, A.; Nassi, O.; Di Nasso, N. Midinfrared FT-IR as a tool for monitoring herbaceous biomass composition and its conversion to furfural. J. Spectrosc. 2015. [Google Scholar] [CrossRef] [Green Version]
- Calderón, F.J.; Reeves, J.B.; Collins, H.P.; Paul, E.A. Chemical differences in soil organic matter fractions determined by Diffuse-Reflectance Mid-Infrared Spectroscopy. Soil Sci. Soc. Am. J. 2011, 75, 568–579. [Google Scholar] [CrossRef] [Green Version]
- Müller, C.M.; Pejcic, B.; Esteban, L.; Piane, C.D.; Raven, M.; Mizaikoff, B. Infrared attenuated total reflectance spectroscopy: An innovative strategy for analyzing mineral components in energy relevant systems. Sci. Rep. 2014, 4, 6764. [Google Scholar] [CrossRef] [Green Version]
- Le Guillou, F.; Wetterlind, W.; Viscarra Rossel, R.A.; Hicks, W.; Grundy, M.; Tuomi, S. How does grinding affect the mid-infrared spectra of soil and their multivariate calibrations to texture and organic carbon? Soil Res. 2015, 53, 913–921. [Google Scholar] [CrossRef]
- Allo, M.; Todoroff, P.; Jameux, M.; Stern, M.; Paulin, L.; Albrecht, A. Prediction of tropical volcanic soil organic carbon stocks by visible-near- and mid-infrared spectroscopy. Catena 2020, 189, 104452. [Google Scholar] [CrossRef]
- Corradini, F.; Bartholomeus, H.; Huerta Lwanga, E.; Gertsen, H.; Geissen, V. Predicting soil microplastic concentration using vis-NIR spectroscopy. Sci. Total Environ. 2019, 650, 922–932. [Google Scholar] [CrossRef] [PubMed]
- Ertlen, D.; Schwartz, D.; Brunet, D.; Trendel, J.M.; Adam, P.; Schaeffer, P. Qualitative near infrared spectroscopy, a new tool to recognize past vegetation signature in soil organic matter. Soil Biol. Biochem. 2015, 82, 127–134. [Google Scholar] [CrossRef]
- Vysloužilová, B.; Ertlen, D.; Šefrna, L.; Novák, T.; Virágh, K.; Rué, M.; Campaner, A.; Dreslerová, D.; Schwartz, D. Investigation of vegetation history of buried chernozem soils using near-infrared spectroscopy (NIRS). Quat. Int. 2015, 365, 203–211. [Google Scholar] [CrossRef]
- Strouhalová, B.; Ertlen, D.; Šefrna, L.; Novák, T.J.; Virágh, K.; Schwartz, D. Assessing the vegetation history of European Chernozems through qualitative near infrared spectroscopy. Quaternaire 2019, 30, 227–241. [Google Scholar] [CrossRef]
- Seybold, C.A.; Ferguson, R.; Wysocki, D.; Bailey, S.; Anderson, J.; Nester, B.; Schoeneberger, P.; Wills, S.; Libohova, Z.; Hoover, D.; et al. Application of Mid-Infrared spectroscopy in soil survey. Soil Sci. Soc. Am. J. 2019, 83, 1746–1759. [Google Scholar] [CrossRef]
- Dos Santos, U.J.; de Demattê, J.A.; Menezes, R.S.C.; Dotto, A.C.; Guimarães, C.C.B.; Alves, B.J.R.; Primo, D.C.; de Sampaio, E.V. Predicting carbon and nitrogen by visible near-infrared (Vis-NIR) and mid-infrared (MIR) spectroscopy in soils of Northeast Brazil. Geoderma Reg. 2020, 23, e00333. [Google Scholar] [CrossRef]
- Ng, W.; Minasny, B.; Montazerolghaem, M.; Padarian, J.; Ferguson, R.; Bailey, S.; McBratney, A.B. Convolutional neural network for simultaneous prediction of several soil properties using visible/near-infrared, mid-infrared, and their combined spectra. Geoderma 2019, 352, 251–267. [Google Scholar] [CrossRef]
- Kasielke, T.; Poch, R.M.; Wiedner, K. Chernozem relics in the Hellweg Loess Belt (Westphalia, NW Germany)—Natural or man-made? Quat. Int. 2019. [Google Scholar] [CrossRef]
- Strouhalová, B.; Gebhardt, A.; Ertlen, D.; Šefrna, L.; Flašarová, K.; Kolařík, P.; Schwartz, D. From Chernozem to Luvisol or from Luvisol to Chernozem? A discussion about the relationships and limits of the two types of soils. a case study of the soil catena of Hrušov, Czechia. Geogr. CGS 2020, 125, 473–500. [Google Scholar] [CrossRef]
- IUSS Working Group WRB. World reference base for soil resources 2014. International Soil Classification System for Naming Soils and Creating Legends for Soil Maps; Food and Agriculture Organization (FAO): Rome, Italy, 2014; ISBN 9789251083697.
- Chodorowski, J.; Bartmiński, P.; Plak, A.; Dȩbicki, R. Chernozems of Lubelszczyzna (eastern Poland). Soil Sci. Annu. 2019, 70, 258–269. [Google Scholar] [CrossRef]
- Drewnik, M.; Zyła, M. Properties and classification of heavily eroded post-chernozem soils in Proszowice Plateau (southern Poland). Soil Sci. Annu. 2019, 70, 225–233. [Google Scholar] [CrossRef] [Green Version]
- Łabaz, B.; Kabała, C.; Dudek, M.; Waroszewski, J. Morphological diversity of chernozemic soils in south-western Poland. Soil Sci. Annu. 2019, 70, 211–224. [Google Scholar] [CrossRef] [Green Version]
- Kabała, C.; Przybył, A.; Krupski, M.; Łabaz, B.; Waroszewski, J. Origin, age and transformation of Chernozems in northern Central Europe—New data from Neolithic earthen barrows in SW Poland. Catena 2019, 180, 83–102. [Google Scholar] [CrossRef]
- Krupski, M.; Mackiewicz, M.; Kabała, C.; Ehlert, M.; Cendrowska, M. Earthen mounds in the Głubczyce Forest (SW Poland)—Are they prehistoric long barrows? Geoarcheology of the Silesian soil record and human-environment interplay in the Holocene. Praehist. Z. 2021, in press. [Google Scholar] [CrossRef]
- Przybył, A. Newly Recorded Neolithic Earthen Long Barrows in South-Western Poland: Unexpected Discoveries, Expanded Perspectives, New Interpretations. In Fonctions, Utilisations et Représentations de L’espace Dans les Sépultures Monumentales du Néolithique Européen. Préhistoires Méditerr. Colloque. 2014. Available online: http://journals.openedition.org/pm/996 (accessed on 21 February 2021).
- Ertlen, D.; Schwartz, D.; Trautmann, M.; Webster, R.; Brunet, D. Discriminating between organic matter in soil from grass and forest by near-infrared spectroscopy. Eur. J. Soil Sci. 2010, 61, 207–216. [Google Scholar] [CrossRef]
- De Maesschalck, R.; Jouan-Rimbaud, D.; Massart, D.L. The Mahalanobis Distance. Chemom. Intell. Lab. Syst. 2000, 50, 1–18. [Google Scholar] [CrossRef]
- Viscarra Rossel, R.A.; Webster, R. Discrimination of Australian soil horizons and classes from their visible-near infrared spectra. Eur. J. Soil Sci. 2011, 62, 637–647. [Google Scholar] [CrossRef]
- Chmielewski, T.J.; Furmanek, M.; Patay, R.; Sady, A. Needle Grass (Stipa sp.) in the Neolitic and Eneolithic Periods in Central Europe. Contribution to the Discussion on the Phenomenon; Arheovest, JatePress Kiado: Szeged, Hungary, 2014; pp. 109–133. [Google Scholar]
- Deák, J.; Gebhardt, A.; Lewis, H.; Usai, M.R.; Lee, H. Soils disturbed by vegetation clearance and tillage. In Archaeological Soil and Sediment Micromorphology; Nicosia, C., Stoops, G., Eds.; John Wiley & Sons Ltd.: Oxford, UK, 2017; pp. 233–264. [Google Scholar]
- Hejcman, M.; Součková, K.; Krištuf, P.; Peška, J. What questions can be answered by chemical analysis of recent and paleosols from the Bell Beaker barrow (2500-2200BC), Central Moravia, Czech Republic? Quat. Int. 2013, 316, 179–189. [Google Scholar] [CrossRef]
- Von Suchodoletz, H.; Tinapp, C.; Lauer, T.; Glaser, B.; Stäuble, H.; Kühn, P.; Zielhofer, C. Distribution of Chernozems and Phaeozems in Central Germany during the Neolithic period. Quat. Int. 2019, 511, 166–184. [Google Scholar] [CrossRef]
- Goydaragh, M.G.; Jafarzadeh, A.A.; Shahbazi, F.; Oustan, S.; Taghizadeh-Mehrjardi, R.; Lado, M. Estimation of elemental composition of agricultural soils from West Azerbaijan, Iran, using mid-infrared spectral models. Rev. Bras. Eng. Agric. Ambient. 2019, 23, 460–466. [Google Scholar] [CrossRef]
- Alexandrovskiy, A.L. Holocene development of soils in response to environmental changes: The Novosvobodnaya archaeological site, North Caucasus. Catena 2000, 41, 237–248. [Google Scholar] [CrossRef]
- Chendev, Y.G.; Aleksandrovskii, A.L.; Khokhlova, O.S.; Dergacheva, M.I.; Petin, A.N.; Golotvin, A.N.; Sarapulkin, V.A.; Zemtsov, G.L.; Uvarkin, S.V. Evolution of forest pedogenesis in the south of the forest-steppe of the Central Russian Upland in the Late Holocene. Eurasian Soil Sci. 2017, 50, 1–13. [Google Scholar] [CrossRef]
- Gałka, B.; Łabaz, B. Properties of humic acids in humus horizons in forest soils of the Stołowe Mountains. Sylwan 2013, 157, 780–785. [Google Scholar]
- Pietrzykowski, M.; Chodak, M. Near infrared spectroscopy—A tool for chemical properties and organic matter assessment of afforested mine soils. Ecol. Eng. 2014, 62, 115–122. [Google Scholar] [CrossRef]
- Wang, X.; Butterly, C.R.; Baldock, J.A.; Tang, C. Long-term stabilization of crop residues and soil organic carbon affected by residue quality and initial soil pH. Sci. Total Environ. 2017, 587, 502–509. [Google Scholar] [CrossRef]
- Cañasveras Sánchez, J.C.; Barrón, V.; Del Campillo, M.C.; Viscarra Rossel, R.A. Reflectance spectroscopy: A tool for predicting soil properties related to the incidence of Fe chlorosis. Span. J. Agric. Res. 2012, 10, 1133–1142. [Google Scholar] [CrossRef] [Green Version]
- Knox, N.M.; Grunwald, S.; McDowell, M.L.; Bruland, G.L.; Myers, D.B.; Harris, W.G. Modelling soil carbon fractions with visible near-infrared (VNIR) and mid-infrared (MIR) spectroscopy. Geoderma 2015, 239, 229–239. [Google Scholar] [CrossRef]
- Viscarra Rossel, R.A.; Walvoort, D.J.J.; McBratney, A.B.; Janik, L.J.; Skjemstad, J.O. Visible, near infrared, mid infrared or combined diffuse reflectance spectroscopy for simultaneous assessment of various soil properties. Geoderma 2006, 131, 59–75. [Google Scholar] [CrossRef]
- Chodak, M.; Ludwig, B.; Khanna, P.; Beese, F. Use of near infrared spectroscopy to determine biological and chemical characteristics of organic layers under spruce and beech stands. J. Plant. Nutr. Soil Sci. 2002, 165, 27–33. [Google Scholar] [CrossRef]
- Chodak, M. Application of near infrared spectroscopy for analysis of Soils, litter and plant materials. Pol. J. Environ. Stud. 2008, 17, 631–642. [Google Scholar]
- Gholizadeh, A.; Viscarra Rossel, R.A.; Saberioon, M.; Borůvka, L.; Kratina, J.; Pavlů, L. National-scale spectroscopic assessment of soil organic carbon in forests of the Czech Republic. Geoderma 2020, 385. [Google Scholar] [CrossRef]
Figure 1.
Localization of sampling areas in Southern Poland.

Figure 2.
Mid-infrared absorbance spectra: (A)—without processing, (B)—after standardization, (C)—after standardization and 1st derivative.
Figure 2.
Mid-infrared absorbance spectra: (A)—without processing, (B)—after standardization, (C)—after standardization and 1st derivative.

Figure 3.
Basic properties of topsoil layers in the distinguished classes of land use: (A) soil pH, (B) SOC content, and soil type: (C) soil pH, (D) SOC content. Explanation: SOC—soil organic carbon; horizontal line—mean value, box—standard error, whiskers—standard deviation. Categories with the same letters (a, b) are not significantly different (Fisher test at p < 0.05) for the particular soil property.

Figure 4.
MIR spectra (in a range 500–1700 cm−1) averaged for land use classes.

Figure 5.
Canonical scores of arable, grassland, forest soils and buried humus horizons from three Neolithic kurgans (black circles with depth indication).
Figure 5.
Canonical scores of arable, grassland, forest soils and buried humus horizons from three Neolithic kurgans (black circles with depth indication).

Figure 6.
Canonical scores of Chernozem, Phaeozem and Luvisol classes.

Figure 7.
Canonical scores of topsoil samples from oak forests, beech forests and hornbeam/maple-dominated forests.
Figure 7.
Canonical scores of topsoil samples from oak forests, beech forests and hornbeam/maple-dominated forests.


Table 1.
Mahalanobis distances between groups depending on the land use, soil reference group and forest stands.
Table 1.
Mahalanobis distances between groups depending on the land use, soil reference group and forest stands.
| Factor 1 | Factor 2 | |
|---|---|---|
| Soil groups | ||
| Arable—grassland | 25.7 | 23.1 |
| Arable—forest | 20.6 | 1.96 |
| Forest—grassland | 5.1 | 25.1 |
| Soil types | ||
| Chernozem—Phaeozem | 12.0 | 12.3 |
| Chernozem—Luvisol | 19.1 | 10.2 |
| Luvisol—Phaeozem | 14.3 | 5.3 |
| Forest stands | ||
| Oak—beech | 7.1 | 12.4 |
| Oak—HML | 24.0 | 2.7 |
| HML—beech | 12.2 | 15.1 |
Publisher’s Note: MDPI stays neutral with regard to jurisdictional claims in published maps and institutional affiliations. |
© 2021 by the authors. Licensee MDPI, Basel, Switzerland. This article is an open access article distributed under the terms and conditions of the Creative Commons Attribution (CC BY) license (http://creativecommons.org/licenses/by/4.0/).
Share and Cite
MDPI and ACS Style
Dudek, M.; Kabała, C.; Łabaz, B.; Mituła, P.; Bednik, M.; Medyńska-Juraszek, A. Mid-Infrared Spectroscopy Supports Identification of the Origin of Organic Matter in Soils. Land 2021, 10, 215. https://doi.org/10.3390/land10020215
AMA Style
Dudek M, Kabała C, Łabaz B, Mituła P, Bednik M, Medyńska-Juraszek A. Mid-Infrared Spectroscopy Supports Identification of the Origin of Organic Matter in Soils. Land. 2021; 10(2):215. https://doi.org/10.3390/land10020215
Chicago/Turabian StyleDudek, Michał, Cezary Kabała, Beata Łabaz, Paweł Mituła, Magdalena Bednik, and Agnieszka Medyńska-Juraszek. 2021. "Mid-Infrared Spectroscopy Supports Identification of the Origin of Organic Matter in Soils" Land 10, no. 2: 215. https://doi.org/10.3390/land10020215
Note that from the first issue of 2016, this journal uses article numbers instead of page numbers. See further details here.