Crystal Chemistry of an Erythrite-Köttigite Solid Solution (Co3–xZnx) (AsO4)2·8H2O
by
 , ,
, ,
Justyna Ciesielczuk
1,*, 
Mateusz Dulski
2,
Janusz Janeczek
1,
Tomasz Krzykawski
1,
Joachim Kusz
3 and
Eligiusz Szełęg
1 1
Institute of Earth Sciences, University of Silesia, Będzińska 60, 41-200 Sosnowiec, Poland
2
Institute of Materials Engineering, University of Silesia, 75 Pułku Piechoty 1a, 41-500 Chorzów, Poland
3
Institute of Physics, University of Silesia, 75 Pułku Piechoty 1, 41-500 Chorzów, Poland
*
Author to whom correspondence should be addressed.
Minerals 2020, 10(6), 548; https://doi.org/10.3390/min10060548
Submission received: 7 May 2020
/
Revised: 8 June 2020
/
Accepted: 9 June 2020
/
Published: 17 June 2020
(This article belongs to the Section Crystallography and Physical Chemistry of Minerals & Nanominerals)
Abstract
:A wide compositional range, covering about 90% of an expected erythrite-köttigite substitutional solid solution with extreme compositions of (Co2.84Mg0.14Zn0.02) (AsO4)2·8H2O and (Zn2.74Co0.27) (AsO4)2·8H2O, was revealed in a suite of samples from a polymetallic ore deposit in Miedzianka, SW Poland. Members of the solid solution series were examined by means of Electron Probe Microanalysis (EPMA), Scanning Electron Microscopy (SEM)/Energy-Dispersive Spectrometer (EDS), X-ray single-crystal and powder diffraction, and Raman spectroscopy. Metal cations were randomly distributed between two special octahedral sites in the erythrite–köttigite structure. In response to Co ↔ Zn substitutions, small but significant changes in bond distances (particularly in [AsO4] tetrahedra), rotation, and distortion of co-ordination polyhedra were observed. Two sub-series of dominant cationic substitutions (Co-Mg-Ni and Co-Fe-Zn) were noted within the arsenate series of vivianite-group minerals linked by erythrite. The paragenetic sequence erythrite → Zn-rich erythrite → Co-rich köttigite → köttigite reflects the evolution of the solution’s pH towards increased acidity and a relative increase in the concentration of Zn ions following precipitation of erythrite.
1. Introduction
Erythrite and köttigite belong to the arsenate series of vivianite-group minerals with the general formula of M3(AsO4)2·8 H2O, where M represents divalent cations of Co (erythrite), Cu (babánekite), Fe (parasymplesite), Mg (hörnesite), Ni (annabergite), and Zn (köttigite). Minerals of the arsenate series occur in the oxide zones of numerous polymetallic deposits. Erythrite is by far the most common of these minerals.
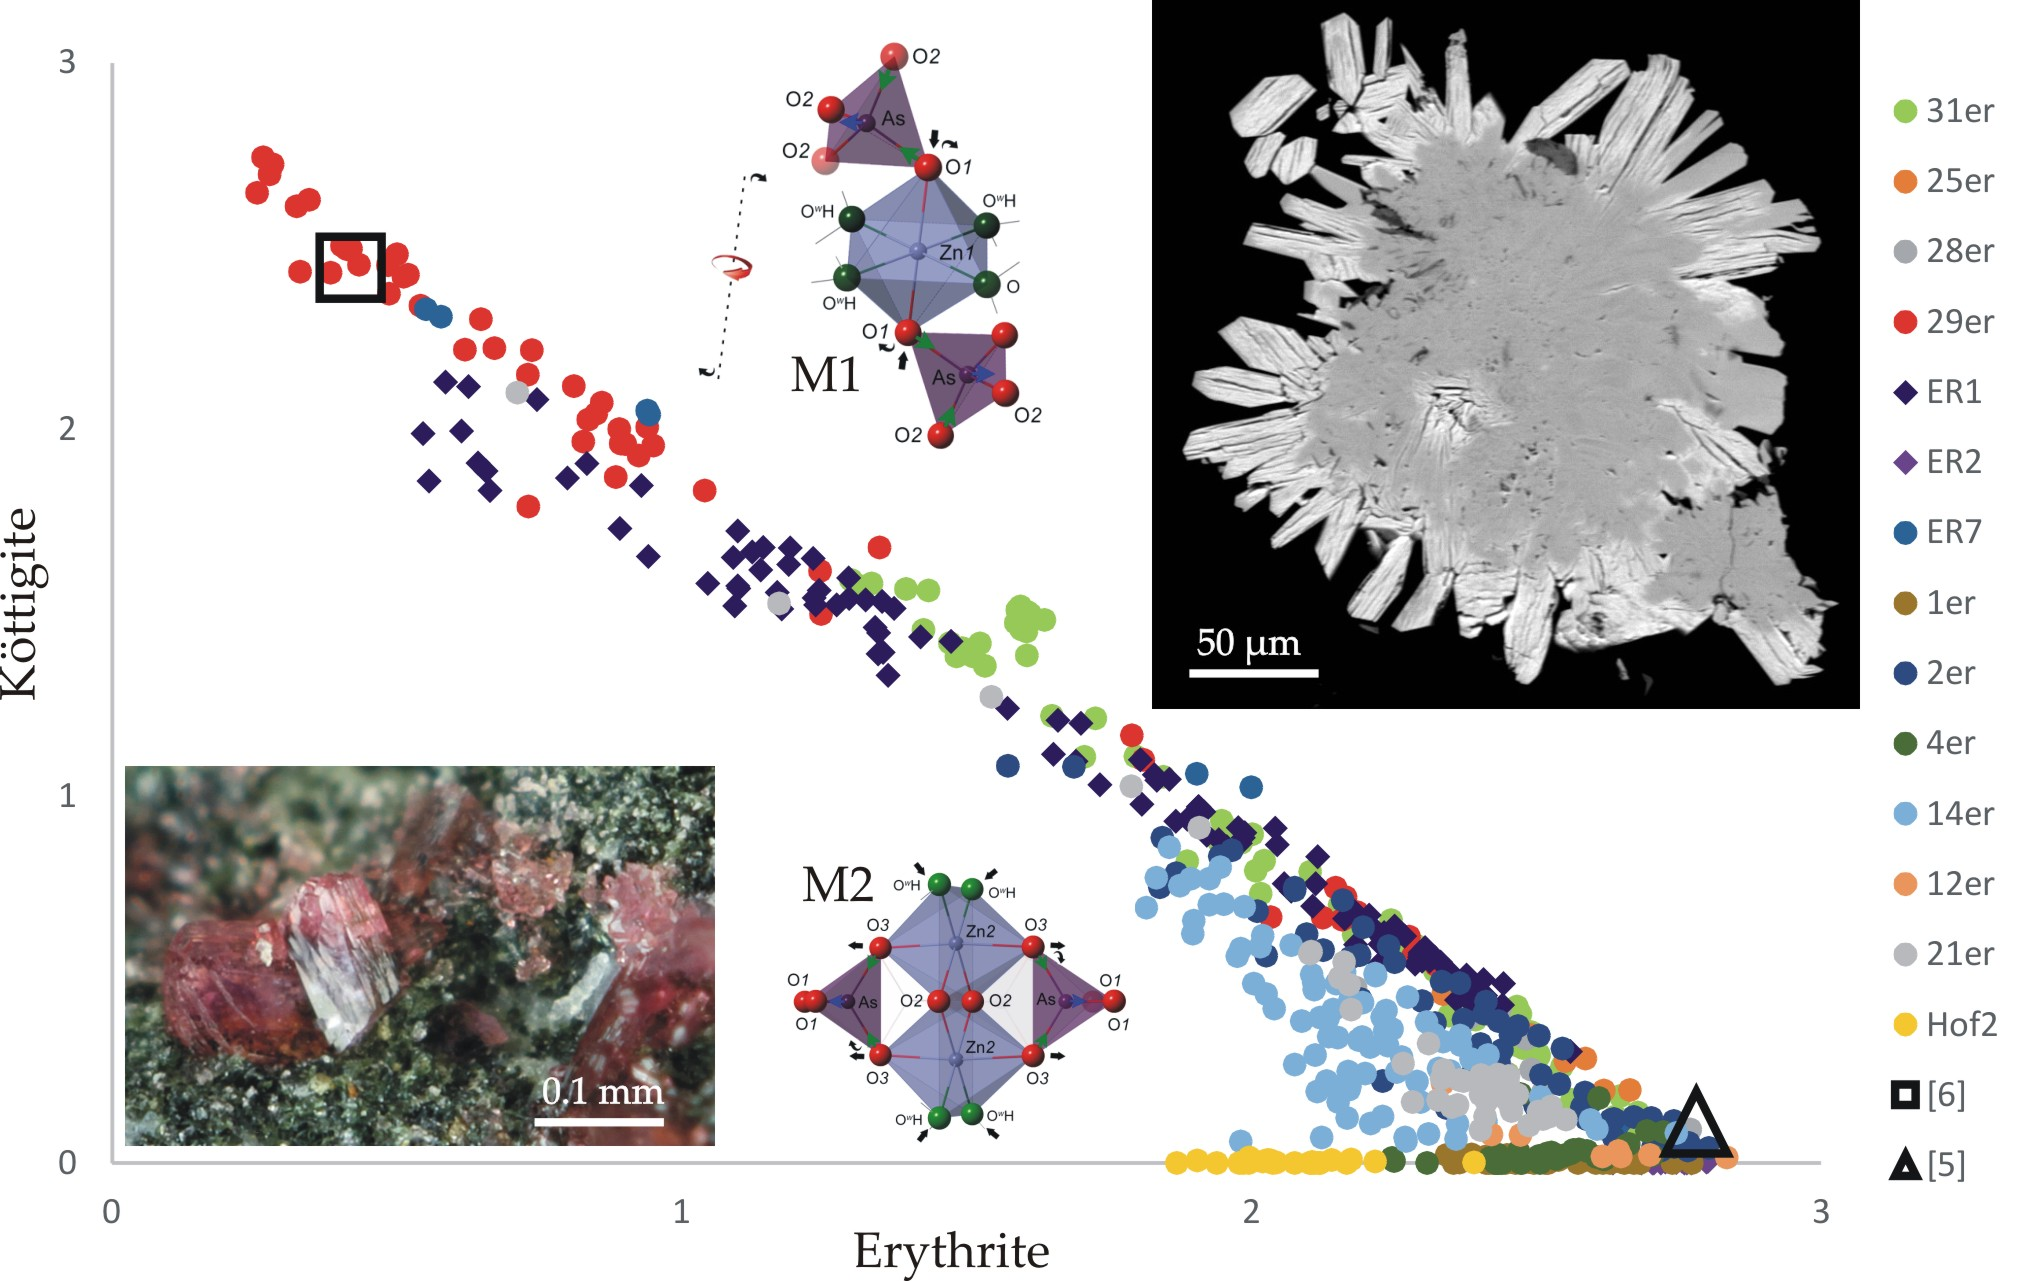
Members of the arsenate series are isostructural (space group C2/m), as revealed by the structure refinement of annabergite [1] and its Mg-rich variety cabrerite [2] as well as babánekite [3], erythrite [1,4,5], köttigite [6], köttigite–parasymplesite intermediate [7], and parasymplesite [8]. The latter was originally referred to as symplesite [8], which is at present the name for a triclinic dimorph of parasymplesite. Metals in these minerals occupy two types of octahedral sites: insular M1 and double edge-sharing M2 (Figure 1). Metals in the M1 octahedra are coordinated by two oxygens and four water molecules [M1O2(H2O)4], while those in the M2 octahedra are coordinated by four oxygens and two water molecules [M2O4(H2O)2]. The structure is layered parallel to the (010) mirror plane. The layers consist of octahedra linked by [AsO4] tetrahedra and hydrogen bonds. The adjacent layers are held together by a network of hydrogen bonds. According to some investigators [4,6], transition metals and Mg are randomly distributed over both octahedral sites. Others suggest that Co, Ni, and Zn cations tend to occupy larger M1 sites, whereas Mg and Fe2+ prefer M2 octahedra [1,7].
While reports on the occurrence of limited solid solutions within the arsenate series minerals are frequent [5,9,10,11,12], no complete or extended solid solutions have been observed as yet in natural samples. Experiments involving syntheses showed a complete solid solution for the erythrite–annabergite binary [13,14,15] and a continuous solid solution for the erythrite–annabergite–hörnesite ternary up to the experimental limits [13].
The inspection of published chemical analyses of the arsenate-series minerals show that despite possible multi-element solid solutions, binary substitutions are dominant, i.e., two substituting cations occupy over 90% of cation sites (Table 1). Therefore, the chemical composition of the arsenate series in most cases can be presented as a set of binary solid solutions, i.e., CoNi–1, CoMg–1, CoFe–1, CoZn–1, NiMg–1, and FeZn–1, with other substituting metals as subordinate constituents. Ternary annabergite–hörnesite–erythrite from Złoty Stok [11] (Table 1) and babánekite (Cu1.12Zn0.78Co0.69Ni0.32)Σ2.91 (AsO4)2·8H2O [3] are exceptional in this respect. Babánekite forms a quaternary solid solution of babánekite (38 mol%), köttigite (27 mol%), erythrite (24 mol%), and annabergite (11 mol%).
No pure erythrite and köttigite compositions have been reported. Closest to the ideal compositions are erythrite from Bou Azzer, Morocco with 93 mol% Co3(AsO4)2·8H2O [5] and köttigite from the type locality in Schneeberg, Germany with 81 mol% Zn3(AsO4)2·8H2O [16]. Erythrite crystals from Bou Azzer show compositional oscillatory zoning [5] in the range of 49–84 mol% Co and 11–46 mol% Mg and are characterised by a constant content of 5 mol% Ni [10].
No crystal chemical constraints hinder the unlimited solid solution between erythrite and köttigite. The similarity of the effective ionic radii ([6]Co2+ = 74.5 pm, [6]Zn2+ = 74 pm [17]) enables easy CoZn–1 exchange in octahedral sites of the vivianite-type structure. Therefore, the limited compositional range between these two minerals reported in the literature (Table 1) may reflect an insufficient number of analysed samples.
In this paper, we report on the chemical composition, structure refinement, and results of Raman spectroscopy of an extended erythrite–köttigite [(Co1–xZnx)3(AsO4)2·8H2O] solid solution from a polymetallic ore deposit in Miedzianka, Sudetes Mts, SW Poland. It is not often that an extended solid solution occurs within a single locality. Miedzianka is unique in this respect, as two other extended solid solutions (77.5 mol% cornwallite–pseudomalachite and 75 mol% kipushite–philipsburgite) have been observed among base-metal arsenates and phosphates in samples from this locality [18].
2. Sampling Site
Thirty-seven samples for this study were collected from dumps around the historic mining town of Miedzianka (known as Kupferberg prior to 1945) (50°52′41.06″ N; 15°56′34.91″ E; 504 m above sea level) in the Sudetes Mts, SW Poland. The hydrothermal vein-type Miedzianka polymetallic deposit was mined for copper, silver, lead, arsenic, and pyrite from the beginning of the fourteenth century until 1925 and for uranium between 1948 and 1952. Miedzianka is a type locality for uranophane.
The Miedzianka ore deposit occurs within amphibolites, quartz–mica schists, and subordinated hornfelses, phyllites, and calc–silicate rocks of the eastern metamorphic cover of the Karkonosze granitic pluton (328–304 Ma) [19]. There are three types of ore mineralisation: (a) magnetite (+ sulphides) in skarns developed at the contact with the Karkonosze granite; (b) polymetallic veins with Cu-sulphides (bornite, chalcopyrite, chalcocite) as major ore minerals associated with sulphides, arsenides, and sulphosalts of Ag, As, Bi, Co, Ni, Fe, and Pb; (c) polymetallic veins with uraninite (pitchblende variety) [19]. Calcite, barite, fluorite, and quartz are gangues. The primary sources of Co, Zn, and As in the Miedzianka deposit are sphalerite, arsenopyrite, As-sulphosalts, and Co-Ni-Fe-arsenides.
The oxidative supergene alteration zone in the Miedzianka ore deposit extends to a depth of 178 m below ground level [19]. Two principal secondary supergene assemblages have been distinguished [20]. The most common assemblage consists of abundant chrysocolla and Cu-arsenates ± malachite and Cu-phosphates. The second assemblage consists of Cu-sulphates, mostly brochantite, langite, and devilline. In total, 38 secondary supergene minerals have been observed in old dumps and in museum specimens [18,19,20,21]. Arsenates of the vivianite group are represented by abundant erythrite, less abundant köttigite, and rare annabergite.
3. Experimental Methods
3.1. Sample Description
The examined minerals occur as radial aggregates or crystal clusters, either directly on the altered (chloritised) amphibolite or on the chrysocolla coating of host rocks. Similar to the erythrite–hörnesite solid solution [9], the colour of members of the erythrite–köttigite series changes with increasing Zn content from dark pink or crimson erythrite to the pale pink and pinkish white observed in intermediate compositions to colourless köttigite (Figure 2). Crystal habit changes from tabular {010} in erythrite to prismatic with well-developed forms {010}, {100}, {201}, and to less frequent {110} in köttigite (Figure 3).
3.2. Scanning Electron Microscopy (SEM)
Mineral morphology and spatial relationships between observed minerals were examined using a Philips XL 30 ESEM/TMP scanning electron microscope coupled with an energy-dispersive spectrometer (EDS; EDAX type: Sapphire) at the Institute of Earth Sciences, University of Silesia (Sosnowiec, Poland). Operating conditions were: accelerating voltage 15 kV; working distance ca 10 mm; counting time 40 s. The same conditions were applied for back-scattered electron (BSE) imaging.
3.3. Electron Probe Microanalysis (EPMA)
The chemical composition of the investigated minerals was determined at the Inter-Institute Laboratory of the Microanalysis of Minerals and Synthetic Materials (Faculty of Geology, University of Warsaw, Warszawa, Poland) using a CAMECA SX-100 microprobe operated in wavelength-dispersive (WDS) mode at an accelerating voltage of 15 kV with a beam current of 10 nA. Counting time for each element was 40 s at the peak position and 20 s for background. Numerous test analyses with varying beam currents, probe diameters, and counting times were performed in order to optimise the experimental conditions. A beam diameter of 1–2 μm diameter caused significant damage to the sample, whereas a value of 5 μm and greater was in most cases too wide to collect X-rays from a single homogeneous grain. The optimal beam diameter was 3 μm, representing a compromise between the precision and accuracy of the measurements and the availability of suitable spots for analysis. However, the 3-μm beam caused partial dehydration of the köttigite-rich compositions, whereas erythrite was not affected. Lα lines were measured for As; Kα lines were measured for other elements. The following standards were used: GaAs for As; YPO4 for Y, CoO for Co, NiO for Ni, chalcopyrite for Cu, hematite for Fe, sphalerite for Zn, barite for S, diopside for Si, Ca, and Mg. Mn and Cr occurred below the detection limit of the microprobe. In total, 656 electron probe microanalyses were performed.
3.4. Structure Refinement
Single-crystal X-ray refinement was performed at room temperature with a single crystal (0.18 mm × 0.09 mm × 0.07 mm) mounted on a quartz capillary. The single-crystal composition was 1.92 Zn and 1.08 Co atoms per formula unit (apfu) as determined by SEM/EDS. A four-circle SuperNova X-ray diffractometer with a microfocus X-ray tube, optimised multi-layer optics for MoKα (λ = 0.71073 Å) radiation, and an Atlas CCD detector were used. Control of the measurement procedure and data reduction were performed by CrysAlisPro software (version 1.171.38.41q; Rigaku Oxford Diffraction, 2015); the same program was used to determine and refine the lattice parameters. For integration of the collected data and correction of Lorentzian and polarisation effects, the CrysAlis RED program was used (version 1.171.38.41q; Rigaku Oxford Diffraction, 2015). Experimental details are summarised in Table 2.
The köttigite–erythrite structure was solved using direct methods with the SHELXS-2013 program [22] and refined by the full-matrix least-squares method on all F2 data using the SHELXL program (version 2018/3) [22]. Structure refinement, including anisotropic atom displacement parameters, was carried out with neutral-atom scattering factors. All hydrogen atoms were found using the difference Fourier synthesis after a number of cycles of anisotropic refinement. Then their isotropic temperature factors, equal to 1.5 times the value of the equivalent displacement parameters, were assigned and suitable restraints used (DFIX).
3.5. X-ray Powder Diffraction (XRD)
Powdered samples weighing 50 mg were examined to determine unit cell parameters using a fully automated X-ray PANalytical X’Pert PRO PW 3040/60 X-ray diffractometer equipped with CuKα1 source radiation (λ = 1.540598 Å) operated at 45 kV and 30 mA at the Institute of Earth Sciences, University of Silesia (Sosnowiec, Poland). Graphite-monochromated CuKα radiation was applied. Samples were placed on the surface of a silicon plate (zero background holder). Measurement parameters were: 10–70° or 5–65° 2θ range, time limit 2500 s or 3000 s, step size 0.02° 2θ. Quantitative analysis of the collected data was carried out using X’Pert HighScore Plus software with the newest PDF-4+ database.
3.6. Raman Spectroscopy
Raman spectra were recorded within the range 120–4000 cm−1 using a WITec alpha 300R confocal Raman microscope equipped with an air-cooled solid-state laser (λ = 532 nm) and a CCD camera. The excitation laser radiation was introduced into the microscope through a single-mode optical fibre 50 μm in diameter. An air Olympus MPLAN (100×/0.90NA) objective was used. Raman scattered light was focused onto a multi-mode fibre (100 μm in diameter) and onto a monochromator with a 600 line/mm grating. Raman spectra were accumulated by 10 scans with integration time of 10 s and a resolution of 3 cm−1. The monochromator was calibrated using the Raman scattering line of a silicon plate (520.7 cm−1). To avoid possible polarisation of scattered light, all analysed crystals were oriented along (010) cleavage planes. Baseline correction and cosmic ray removal were performed using WITec Four Plus software. Peak fitting was done using GRAMS software. Spectra were fitted using a Voigt function with preservation of a minimum number of components.
4. Results and Discussion
4.1. Paragenetic Sequence
The following paragenetic sequence was inferred from the spatial relationships between the observed minerals: erythrite → Zn-rich erythrite → Co-rich köttigite → köttigite (Figure 4 and Figure 5). This finding is in accordance with the solubility studies of erythrite and köttigite. Erythrite is less soluble (solubility constant: Ksp = 10−34.02 [15]) than köttigite (Ksp = 10−32.40 [23]). Moreover, whereas erythrite is stable in a near-neutral pH range (pH 5–8) [24], köttigite requires an acidic environment (pH < 3) for stability [25]. Therefore, the observed paragenetic sequence may reflect both the evolution of the solution pH towards increased acidity and a relative increase in Zn(II) concentration following precipitation of erythrite. The unspecified hydrous Zn-arsenate (46–47 wt% ZnO, 1.3 wt% CoO, and 38 wt% As2O5) crystallised as the last mineral in the investigated assemblage (Figure 4d).
4.2. Chemical Composition
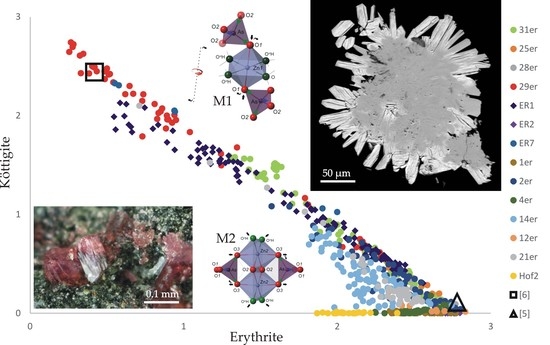
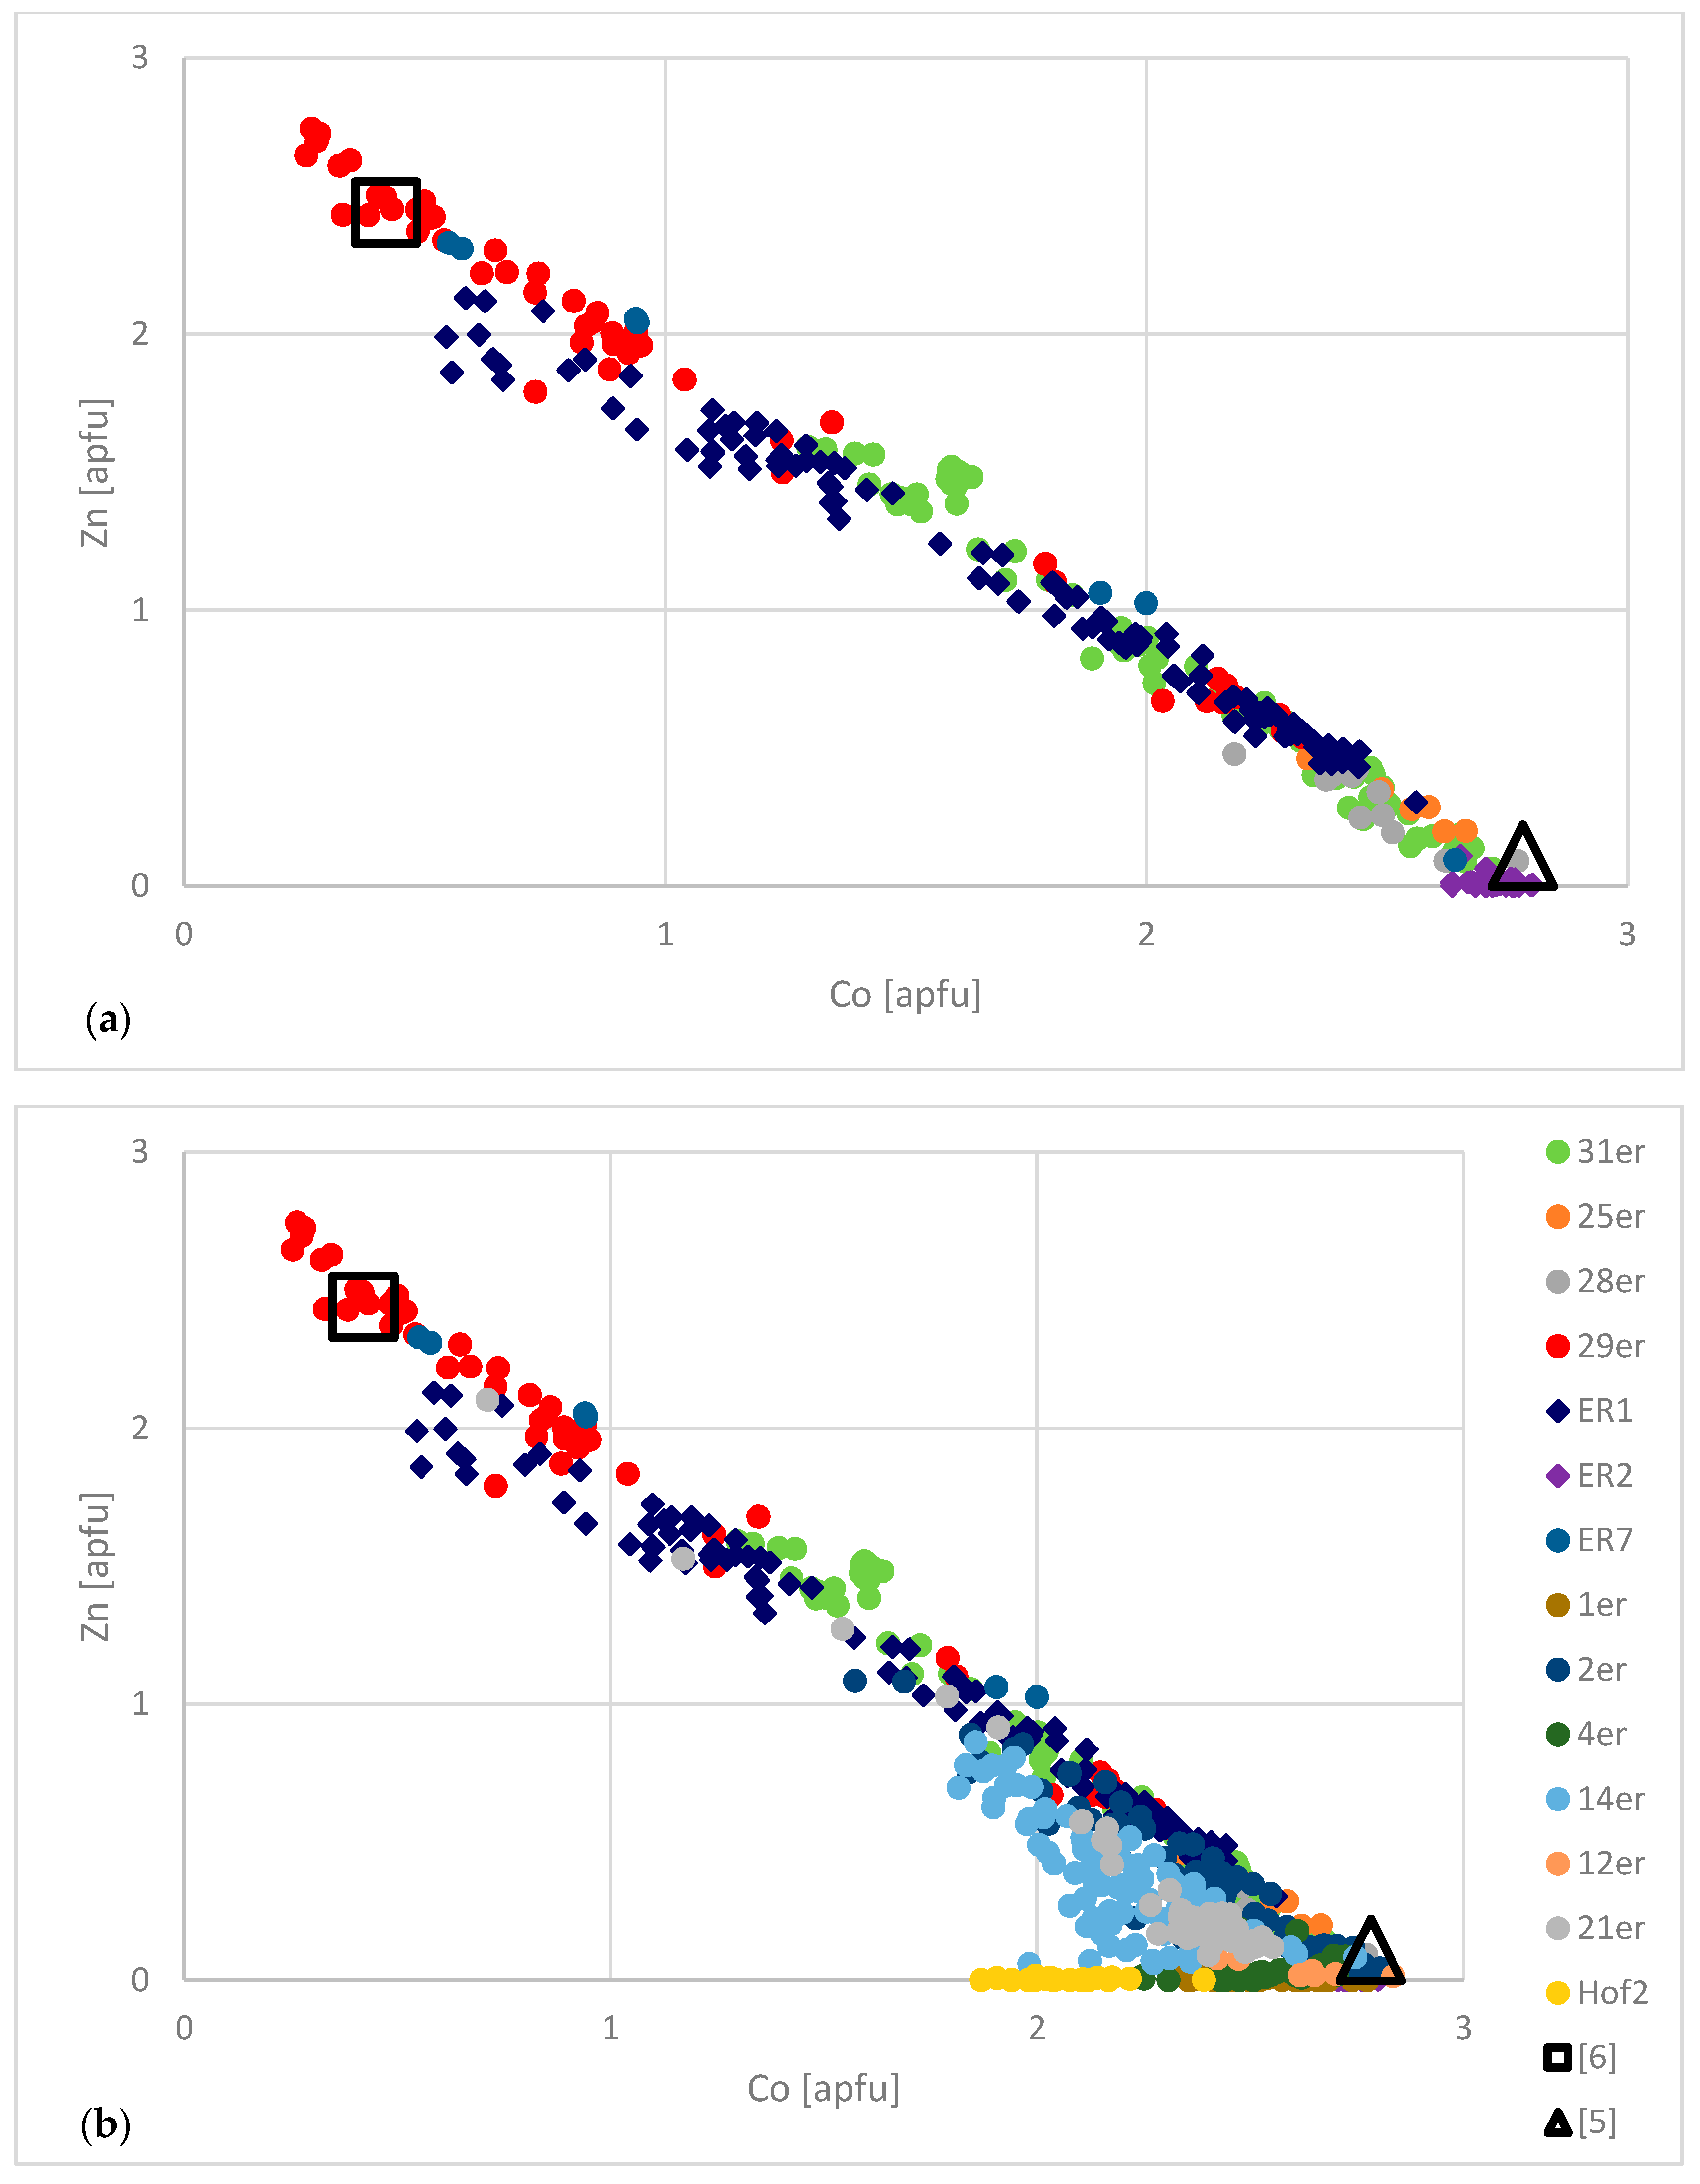
Representative EPMA data for the erythrite–köttigite series are presented in Table 3. The analysed samples contain three sets of chemical compositions (Figure 6). One set of EPMA data plots linearly (R2 = 0.9812) and continuously along the 3.00 apfu tie line in the Co vs. Zn diagram (Figure 6a), covering about 90% of the expected erythrite–köttigite solid solution. A compositional gap of 0.26 apfu (9%) extends towards the köttigite end-member. The Zn-poor compositions are relatively enriched in Mg (Table 3). Two other compositional datasets of erythrite with a more complex pattern of isomorphous substitutions (Figure 6b) include Zn-free erythrite and erythrites with Co > 1.75 apfu which display scattered data points in the Co vs. Zn diagram below the Co-Zn regression line (Figure 6b) due to substitutions of Mg, Ni, and Zn for Co (Figure 7).
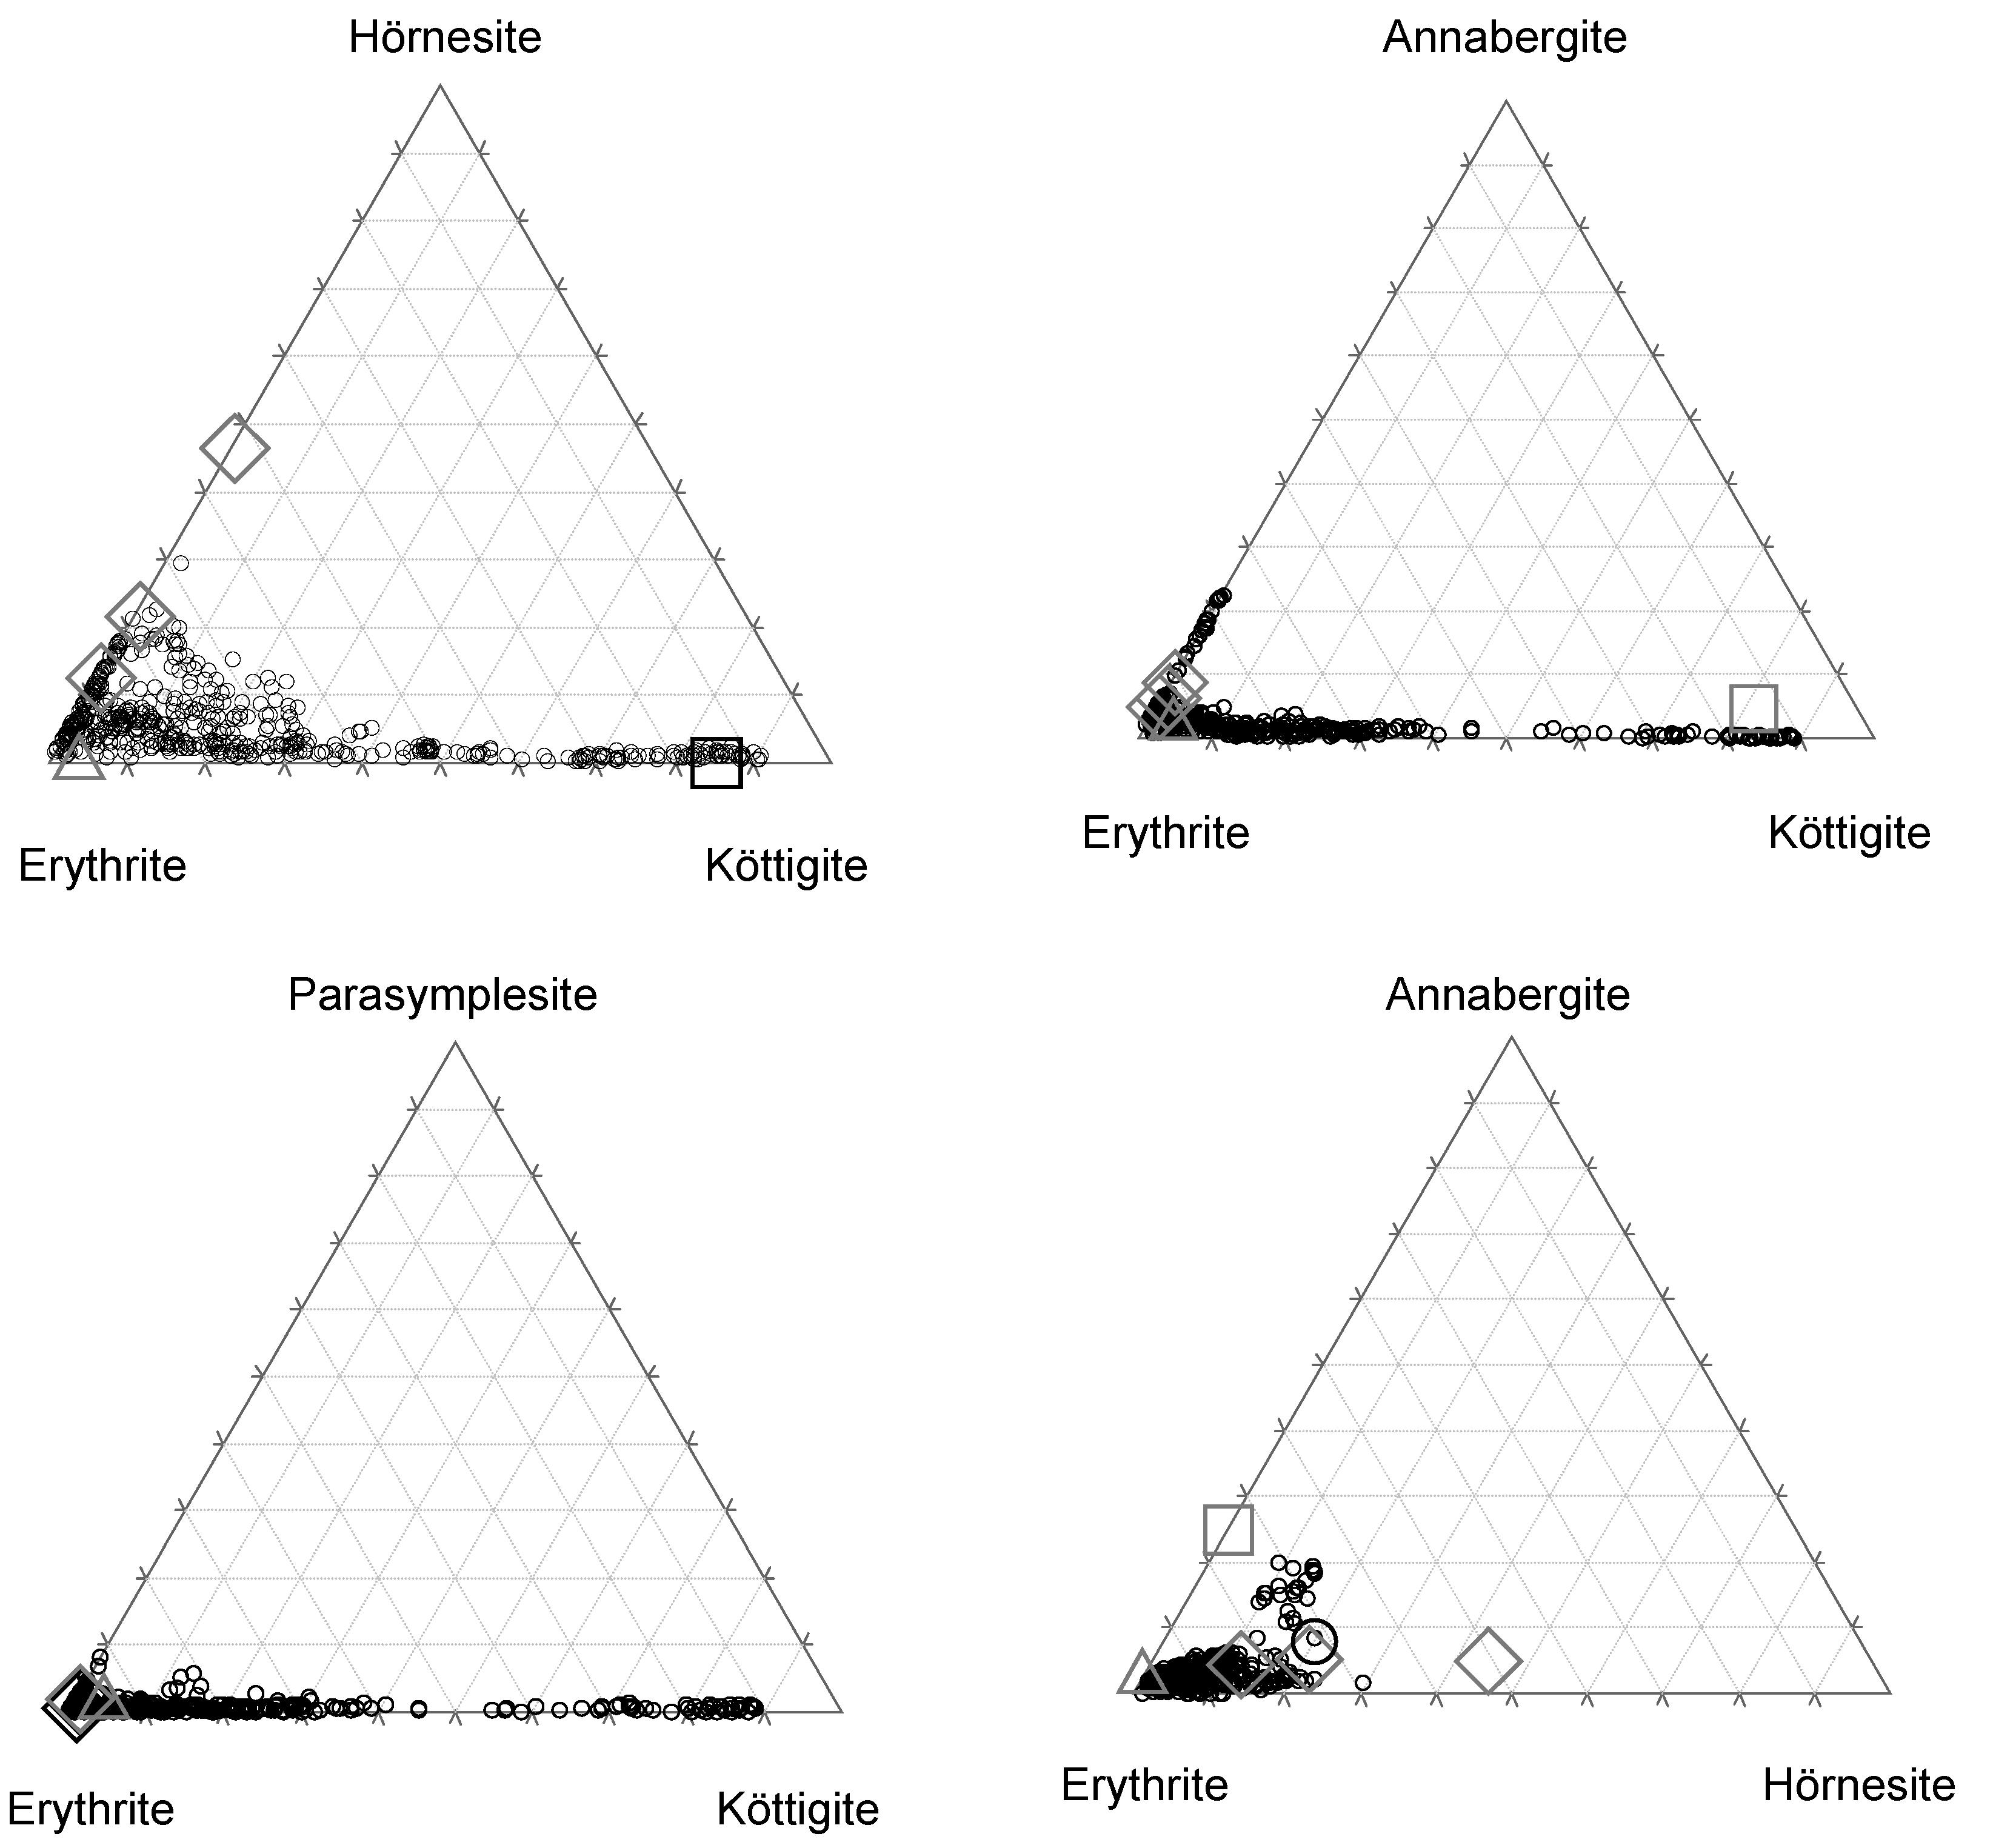
Elevated contents of Mg were found in numerous erythrite analyses with Mg > Zn (Table 3, Figure 7). The highest Mg content in a single analysis (No. 27 in Table 3) was 4.04 wt% MgO (0.58 apfu; 29 mol% hörnesite); however, in most compositions the hörnesite mole fraction was <0.20. One group of analyses corresponded to a limited erythrite–hörnesite binary with up to 22 mol% hörnesite, whereas most analyses represented a limited erythrite–hörnesite–köttigite ternary (Figure 7). With increasing Zn content, the amount of Mg decreased to 1 mol% hörnesite, or even less.
Ni content was low in köttigite-rich compositions, increasing slightly in erythrite up to 5 mol% Ni3(AsO4)2·8H2O (Figure 7). One compositional branch in the annabergite–erythrite–köttigite ternary represented a limited erythrite–annabergite solid solution with up to 23 mol% annabergite (Figure 7). The parasymplesite component, which ranged from 0 to 5 mol%, averaged 1.5 mol%.
Some minor elements reported in Table 3 were considered to be impurities. Copper, ranging from 0.4 to 1.5 wt% CuO, was detected in two samples, most probably due to contamination with co-occurring pseudomalachite. Silicon is most probably an impurity element from host rocks and, as such, was not considered in crystal chemical calculations. Calcium occurred persistently in almost all analyses, particularly in erythrite-rich compositions with a maximum content of 0.82 wt% CaO. However, due to its erratic content and incompatibility with the erythrite–köttigite structure, it was also considered an impurity and excluded from crystal chemical calculations.
The content of water was not determined. The ideal number of eight H2O molecules was assumed in crystal–chemical formulae. However, Zn-rich analyses (Zn >> Co) display totals too high to account for the eight H2O molecules in köttigite with an ideal formula (Table 3). Test analyses indicated a high vacuum and a small electron beam size as causes of the partial dehydration of köttigite resulting in elevated totals (Figure 5). Based on the evaluation of EPMA data obtained during this study as well as on theoretical considerations, we found that the water molecule content in the köttigite formula unit decreased during partial dehydration from eight to (8 – n), where n is an even number of water molecules. Inspection of the data in Table 3 shows that analyses with Zn >> Co are characterised by totals close to or even exceeding those for n = 4, i.e., they are close to the stoichiometry of arsenohopeite (Zn3(AsO4)2 4H2O). The decrease in H2O does not change the metal-to-arsenate ion ratio.
The small beam size and high vacuum did not affect the erythrite-rich (Co >> Zn) analyses (Table 3). The different behaviour of erythrite and köttigite under the same analytical conditions can be explained by considering the electronic structure of Co and Zn in relation to the crystal field stabilisation energy (CFSE) of the octahedral sites. Cobalt is an open-shell d7 transition metal, whereas Zn is a closed-shell d10 transition metal. The electronic configuration of Co favours octahedral coordination, as suggested by a CFSE value of approximately 0.8. The CFSE value for octahedral Zn is 0.0, meaning that there is no difference in CFSE between octahedral and tetrahedral sites. Therefore, the structure with octahedral Zn is relatively unstable. This structural instability may explain the apparent susceptibility of the köttigite to both electron beam damage and high-vacuum dehydration.
4.3. Structure Refinement
The topology of the refined Co-rich köttigite (Zn/Co = 1.78) structure (Figure 1 and Figure 8) is exactly the same as that determined by previous investigators for all vivianite-type arsenates [1,2,3,4,5,6,7,8]. Atomic coordinates, equivalent isotropic displacement parameters, selected inter-atomic distances and angles in the examined crystal are presented in Table 4 and Table 5. Anisotropic displacement atom parameters together with bond lengths and angles not included in Table 4 and Table 5 are given in supplementary Tables S1 and S2. As in all vivianite-type structures of arsenates and phosphates, the average M2–O bond length (2.103 Å) is shorter than the average M1–O distance (2.122 Å). The <M1–O> average bond length in erythrite with 0.11 apfu Zn (2.122 Å) is greater than that in köttigite with 0.42 apfu Co (2.115 Å) (Table 6), whereas the average <M2–O> distance is smaller in erythrite (2.088 Å) than in köttigite (2.100 Å). Inter-atomic distances in Co-köttigite (64 mol% köttigite, 36 mol% erythrite) do not follow this trend. The <M1–O> distance in Co-köttigite is the same as in erythrite, whereas the <M2–O> distance is slightly greater (by 0.003 Å) than that in köttigite (Table 6). Regularity is, however, observed for changes in <As–O> distances (Table 6). With increases in Zn, all <As–O> distances are shortened on average from 1.710 Å in erythrite to 1.691 Å in Co-erythrite to 1.682 Å in köttigite. This bond shortening is associated with the slight increase in the <O–As–O> angle from 109.36° in erythrite to 109.41° in Co-köttigite.
The refinement of the Co and Zn occupancies in the M1 (0 0 0) and M2 [(0.5, y, 1), (0.5, –y, 1)] octahedra did not reveal any significant differences between these sites. The calculated value of the total scattering power (S) for both M1 and M2 sites is 28.92 epfu (electrons per formula unit). The calculated average bond lengths (based on values of ionic radii in [17]) are 2.140 Å for Zn-O, 2.145 Å for Co-O, and 2.142 Å for the presented model of the refined structure with Zn/Co of 1.8. The differences in bond lengths are not large enough to counter the statistically random distribution of Zn and Co between the M1 and M2 sites. This observation is in accord with conclusions in [4,6] that the transition metals are randomly distributed over both octahedral sites in köttigite and erythrite. However, according to Yoshiasa et al. [7], Zn ions prefer larger M1 sites, whereas Fe2+ occupies M2 octahedra in köttigite–parasymplesite intermediate composition. Antao and Dhaliwal [5] suggest that minor Ni and Zn may preferentially occupy M1 sites and that Fe2+ occupies the M2 site in erythrite, with site occupancy factors for the M1 and M2 sites of 1.028 and 0.912, respectively. In the erythrite–köttigite solid solution, the close similarity of [6]Co and [6]Zn ionic radii enables the randomisation of site occupancy upon Co ↔ Zn substitution.
Yoshiasa et al. [7] noted a significantly greater M2–O2 distance (2.112 Å), i.e., between the metal ion and oxygens of the O2–O2 sharing edge, than that between the metal ion and oxygens O5 in the M2-coordinating H2O molecules (M2–O5 = 2.094 Å) in the intermediary of the parasymplesite (54 mol%)–köttigite (46 mol%) series. They explained the difference in bond length (0.018 Å) as the result of cation repulsion in the edge-sharing octahedra. A similar but smaller difference in the bond distances of M2–O2 and M2–O5 (0.006 Å) can be inferred from the data in [6] for köttigite. However, this is not the case in the examined Co-rich köttigite. The M2–O2 distance is shorter than the M2–O5 distance by 0.015 Å (Table 4). In this respect, the Co-rich köttigite is similar to Zn-bearing erythrite [5] with M2–O2 < M2–O5, although in the latter the difference between bonds is much greater (0.039 Å).
4.4. Unit-Cell Dimensions
The similarity of the [6]Co2+ and [6]Zn2+ crystal radii (88.5 and 88.0 pm, respectively [17]) suggests that the unit-cell dimensions of isostructural erythrite and köttigite are similar, with the former’s volume being slightly larger. Data in Table 7 confirm this supposition. The unit-cell volume decreases from 632.7 Å3 in erythrite (Co/(Co + Zn) = 0.996) to 630.2 Å3 in köttigite from Schneeberg (Co/(Co + Zn) = 0.15) (Table 7). However, these changes are not linear, and some intermediary minerals are characterised by unit cells (Table 7) larger than expected for a solid solution conforming to Vegard’s law. Perhaps subordinate cations (Mg and Ni) and distortion of the coordination polyhedra (discussed later) disrupt the linear trend. The β angle is the most sensitive to Co ↔ Zn substitutions, increasing linearly by 0.13° from erythrite (ER2) to köttigite (Table 7). The c parameter is practically constant in all samples, whereas changes in the a and b parameters equal approximately 0.03 Å.
4.5. Raman Spectroscopy
Whereas Raman spectroscopy results for the vivianite-group arsenates have been reported by numerous authors [10,14,26,27,28,29,30,31], no data for an erythrite–köttigite solid solution are available in the literature.
The low-frequency region (i.e., <1000 cm−1) in the Raman spectra of the arsenate series (Figure 9) of the vivianite group minerals consists of numerous overlapping bands related to stretching and bending modes of the major structural units [AsO4] and [MO6] (M = Co, Cu, Ni, Mg, Zn, Fe) as well as of librational modes of H2O [14]. The two highest-intensity bands at 854 and 794 cm−1 in the Raman spectrum of erythrite (Figure 9) correspond to the asymmetric (ν3) and symmetric (ν1) vibrations of [AsO4], respectively [10,14,26]. With increasing substitution of Zn2+ for Co2+, the ν3 and ν1 vibration bands shift towards higher wavenumbers up to 861 and 803 cm−1 in 90 mol% köttigite (Figure 9). This upshift is caused by the contraction of chemical bonds as Co is being replaced by Zn. Otherwise, it would be difficult to explain the upshift of Raman bands, since the atomic mass of Zn (65.38) is higher than that of Co (58.93). In fact, the <As–O> bonds become shorter with increasing Zn content (Table 6). The shortening of the As–O distances is associated with the O1–As–O2 angle adjustment, from 105.5° in erythrite [5] to 106.6° in köttigite [6].
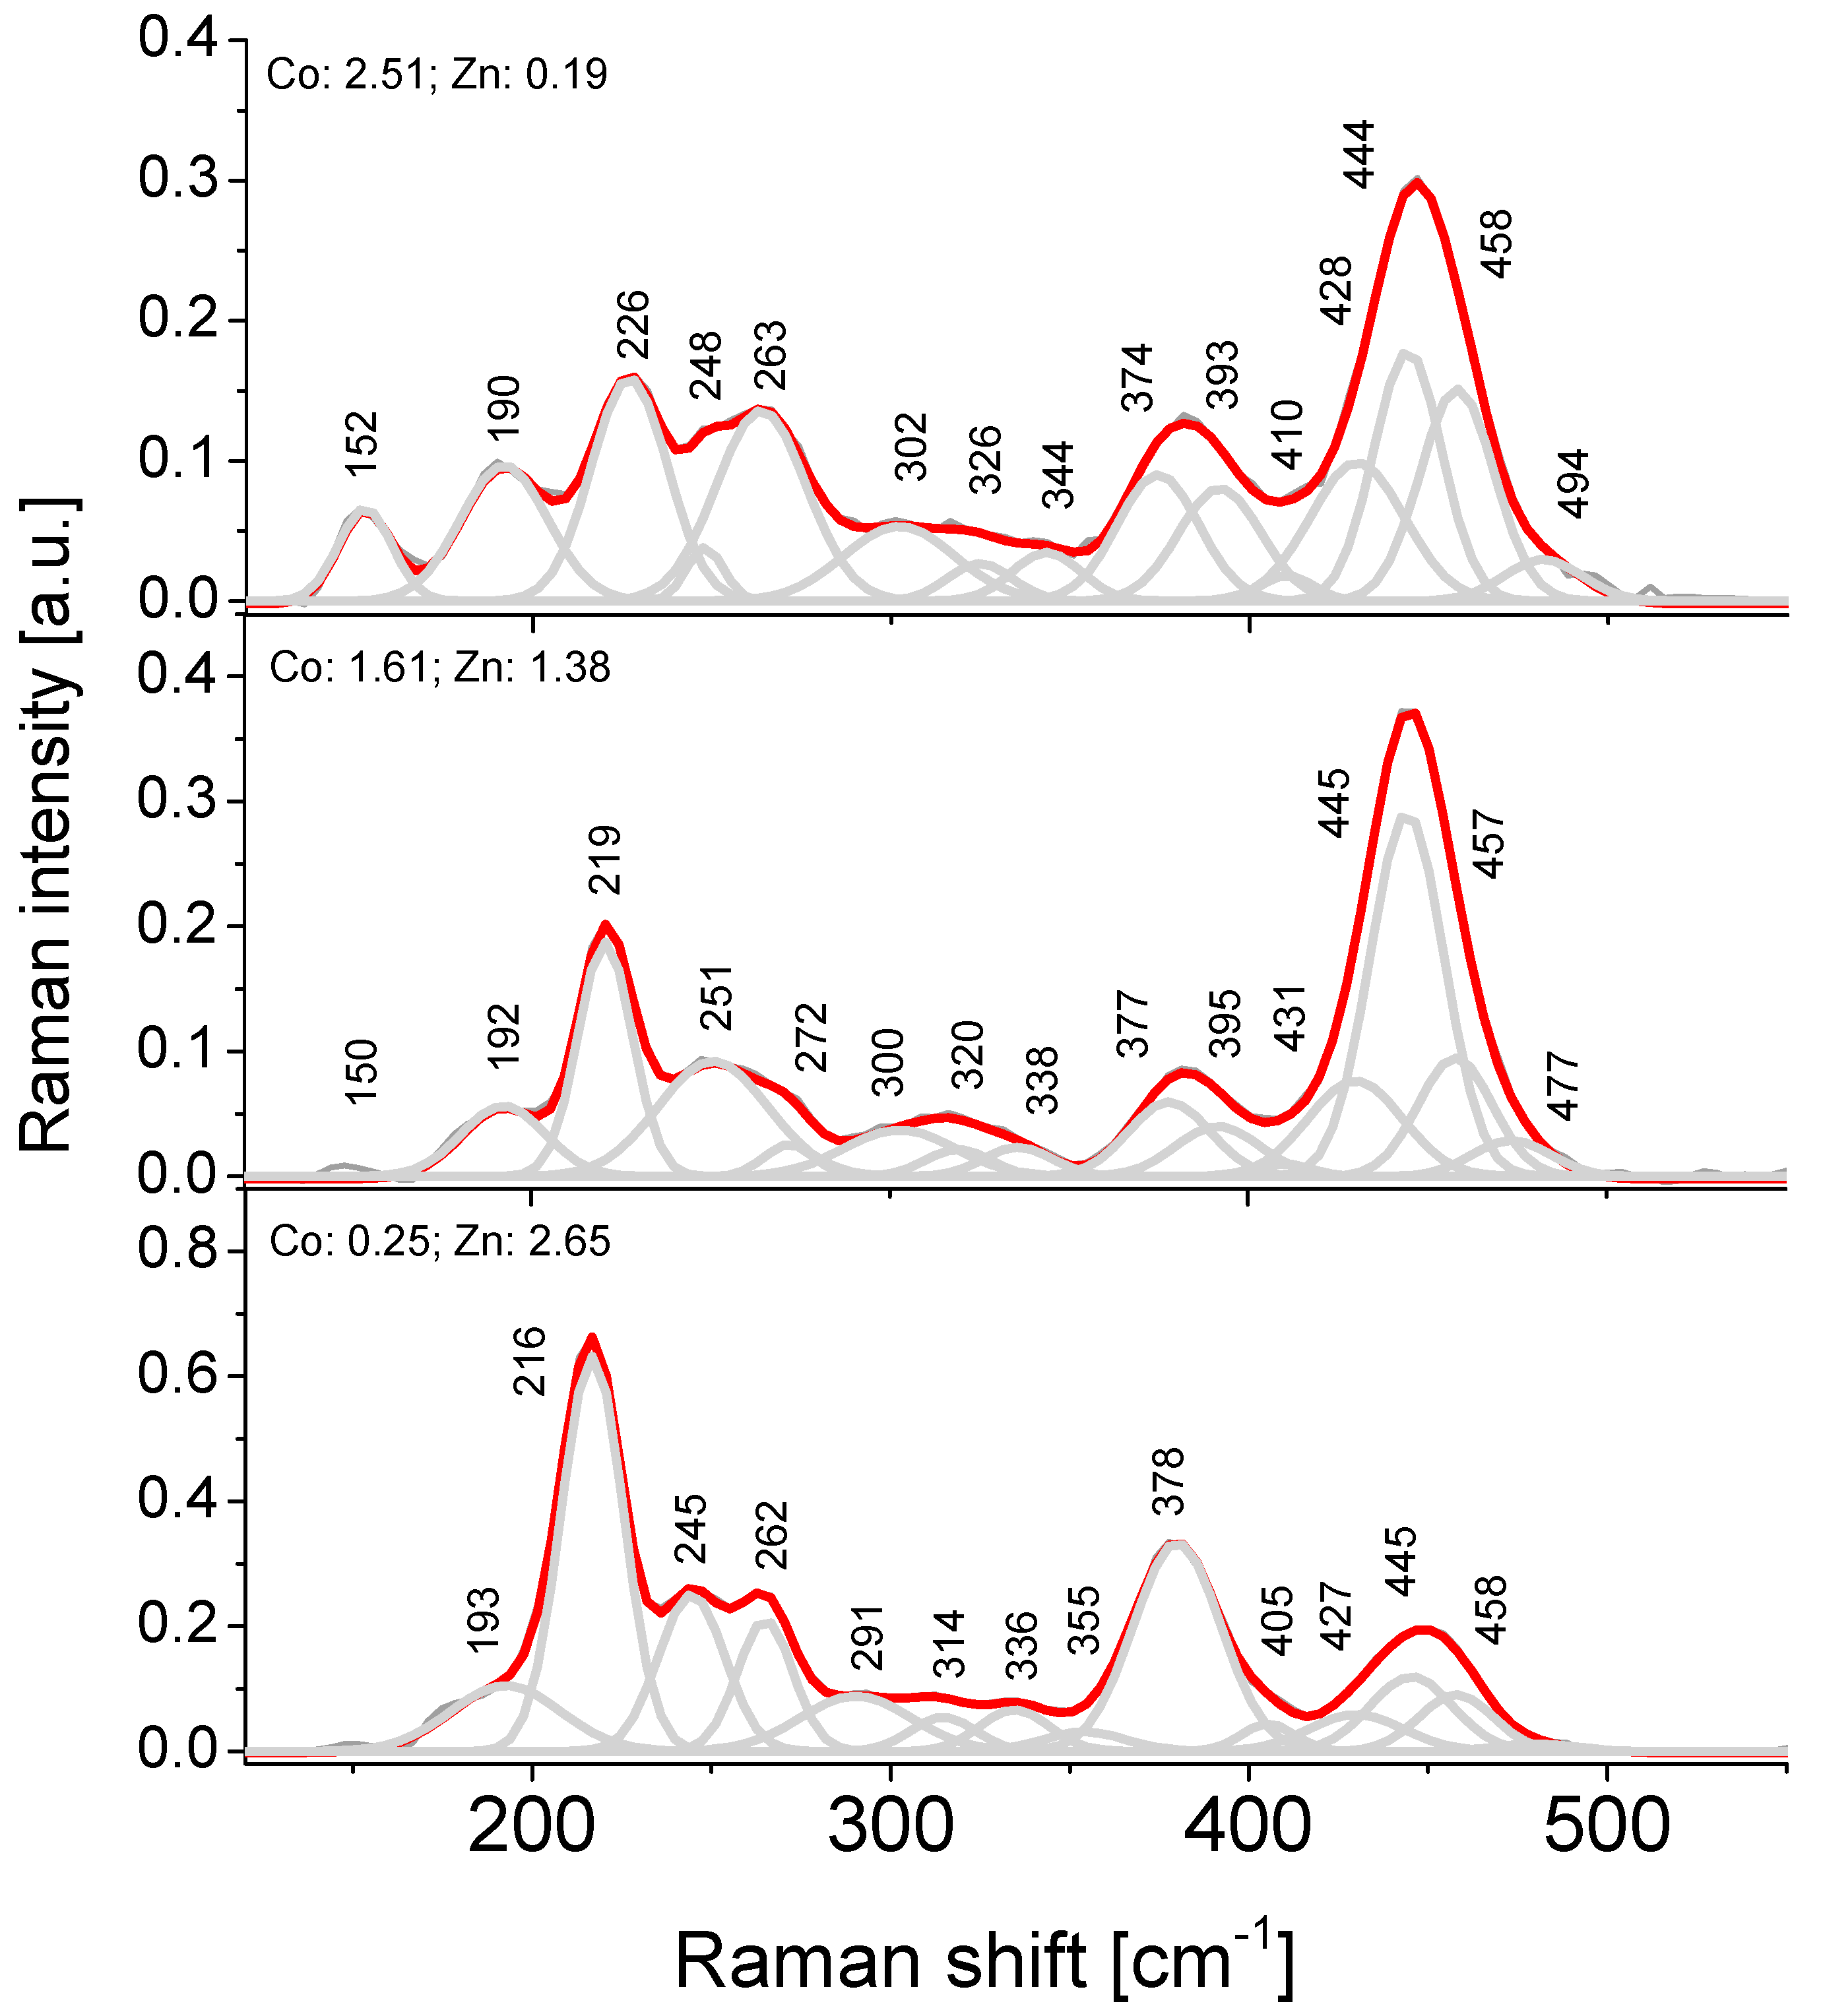
The Raman spectrum below 500 cm−1 is complex due to the multitude of overlapping bands which are difficult to assign to particular vibrational modes (Figure 10). It is, however, possible to distinguish a region of ν4 and ν2 deformation modes of [AsO4] tetrahedra in the range 500–400 cm−1 and 400–250 cm−1 from the lattice modes below 250 cm−1 (Figure 10). This observation is in agreement with previously published data for erythrite [10,14,26]. The occurrence of a HAsO4 group in erythrite may activate a deformational type of vibration at 374 and 344 cm−1 [32]. Substitution of Co by Zn causes these bands to shift to 378 and 336 cm−1, respectively (Figure 10).
The octahedral Co should activate stretching vibrations of Co–O expressed as a band at ~690 cm−1 in the Raman spectrum. However, there is no such band in the erythrite spectrum, possibly due to its downshift to ~450 cm−1, caused by the Jahn–Teller distortion of octahedra and a resulting overlap with the deformational modes of arsenate tetrahedra. Two structurally different Co environments may induce band asymmetry at around 450 cm−1, which can be deconvoluted into three bands at 458, 444, and 428 cm−1. A similar effect may induce deformational modes assigned to bands at about 226 cm−1 (Figure 10). All of these band assignments are supported by intensity changes in bands related to the Co ↔ Zn substitution. The band at 445 cm−1 in the Raman spectrum of köttigite is characterised by much lower intensity than the equivalent band at 444 cm−1 in erythrite (Figure 10). The opposite is observed for a band at 226 cm−1 in erythrite, which, upon an increase in Zn content, shifts to 216 cm−1 in köttigite. This downshift is associated with an increase in intensity (Figure 10). Bands centred at 393, 374, 263, and 248 cm−1 in the Raman spectrum of erythrite (Co >> Zn) are observed at 378, 262, and 245 cm−1 in köttigite (Zn >> Co) (Figure 10).
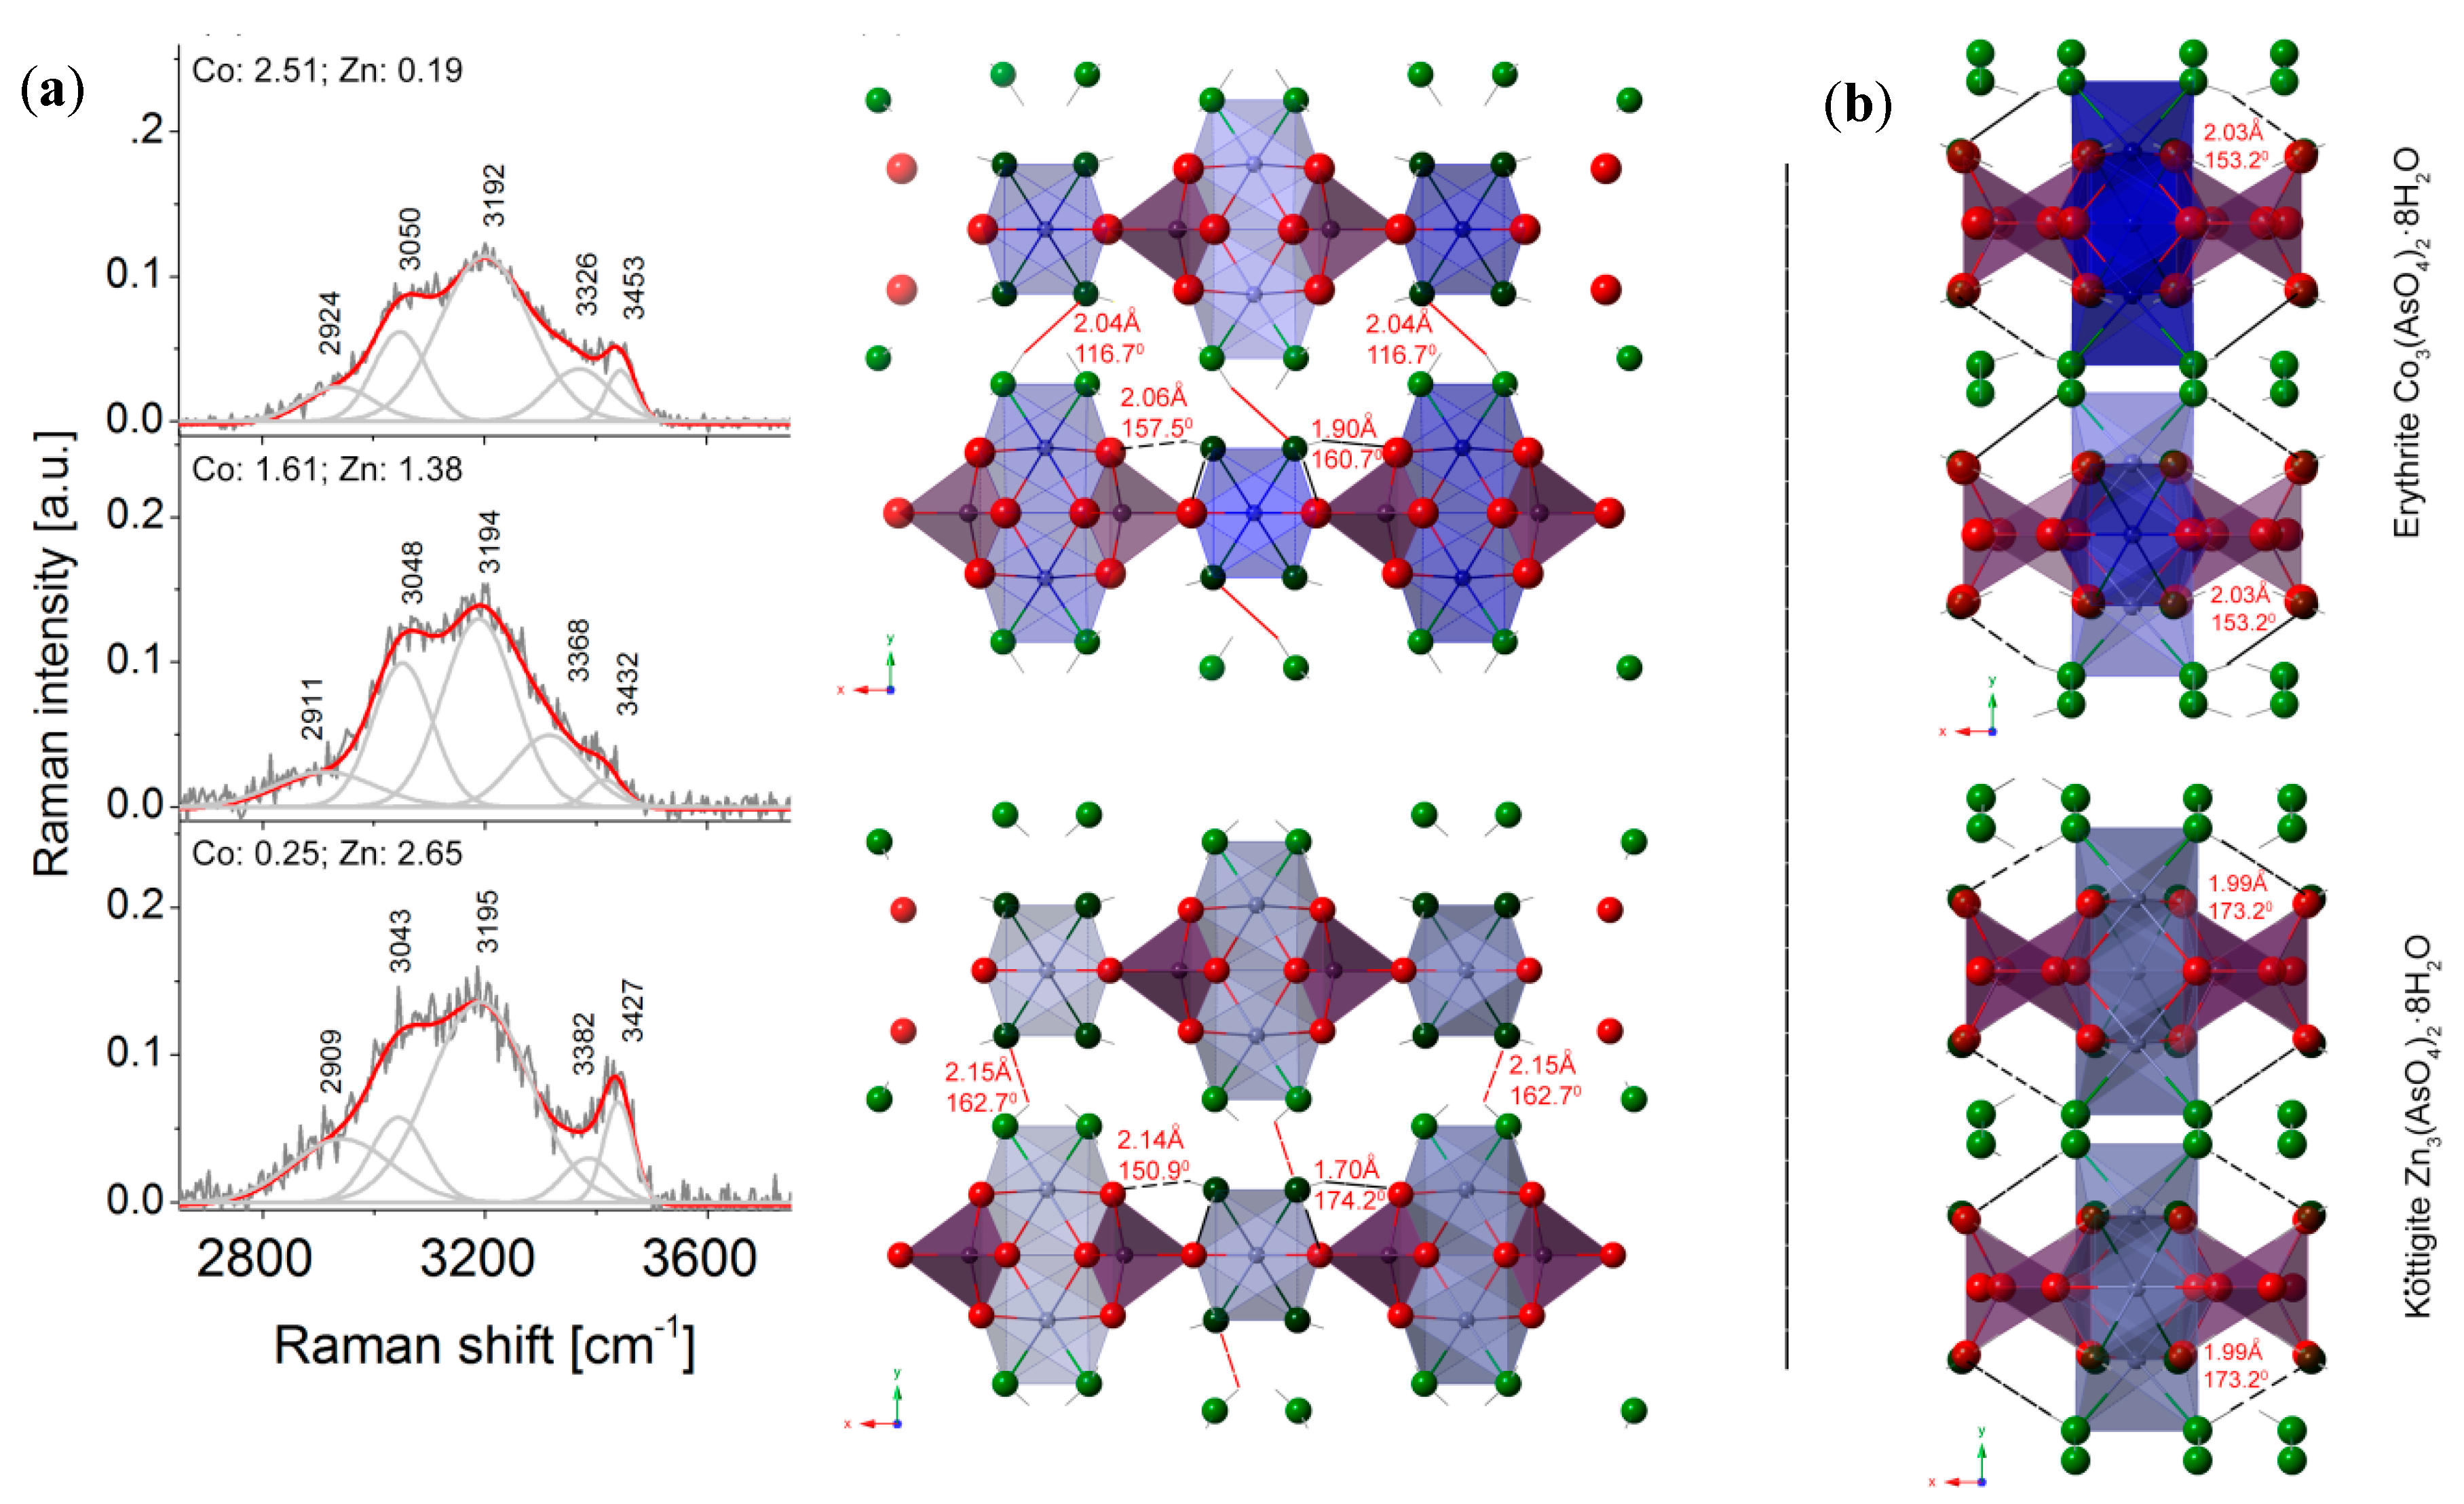
Factor group analysis of erythrite from Miedzianka predicts 12 active internal modes of structural water in accord with the previously reported data [10,14,26], of which five are typical of hydroxyl stretching vibrations (3800–2900 cm−1) (Figure 11); the other seven occur within the range 1800–100 cm−1.
The relationship between band positions caused by the O–H stretching vibrations in the Raman spectra of the erythrite–köttigite solid solution and the donor-acceptor hydrogen bond length was determined using Libowitzky’s equation [33]. The Raman spectrum of erythrite in the region of the O–H stretching vibrations consists of a narrow band at 3453 cm−1 corresponding to dH…O ≈ 1.98 Å and four broader bands at 3326, 3192, 3050, and 2924 cm−1 corresponding to dH…O of 1.89, 1.78, 1.72, and 1.68 Å, respectively (Figure 11). In köttigite, the equivalent band positions are at 3427, 3382, 3195, 3043, and 2909 cm−1 (Figure 11) corresponding to dH…O ≈ 1.95, 1.91, 1.79, 1.72, and 1.68 Å, respectively. The Raman spectrum of Co-rich köttigite examined in this study show intermediate band positions between the two end members. The intensity of the band at 3432 cm−1 in the Co-rich köttigite spectrum is much lower than those of the equivalent bands in the spectra of erythrite and köttigite and is also lower than the intensity of a band at 3368 cm−1. The opposite is observed in the Raman spectrum of köttigite, in which the band at 3427 cm−1 is a very pronounced feature (Figure 11).
5. Conclusions
A wide compositional range, covering about 90% of the expected erythrite–köttigite substitutional solid solution, was revealed in a suite of samples from a single polymetallic deposit, thus proving the miscibility between Co and Zn cations. This solid solution was possible due to combinations of favourable conditions, i.e., the availability of essential cations, the absence of crystal chemical constraints, and a suitable Eh-pH range. Perhaps it would not have been possible to directly prove the occurrence of such an extended solid-solution series within a single locality if not for the large numbers of representative samples (37) and of performed electron microprobe analyses (656). The absence of the köttigite end member may have resulted from changes in the geochemical environment that precluded its crystallisation. Instead of köttigite, unspecified hydrous Zn-arsenate crystallised as the last mineral in the examined assemblage (Figure 4d).
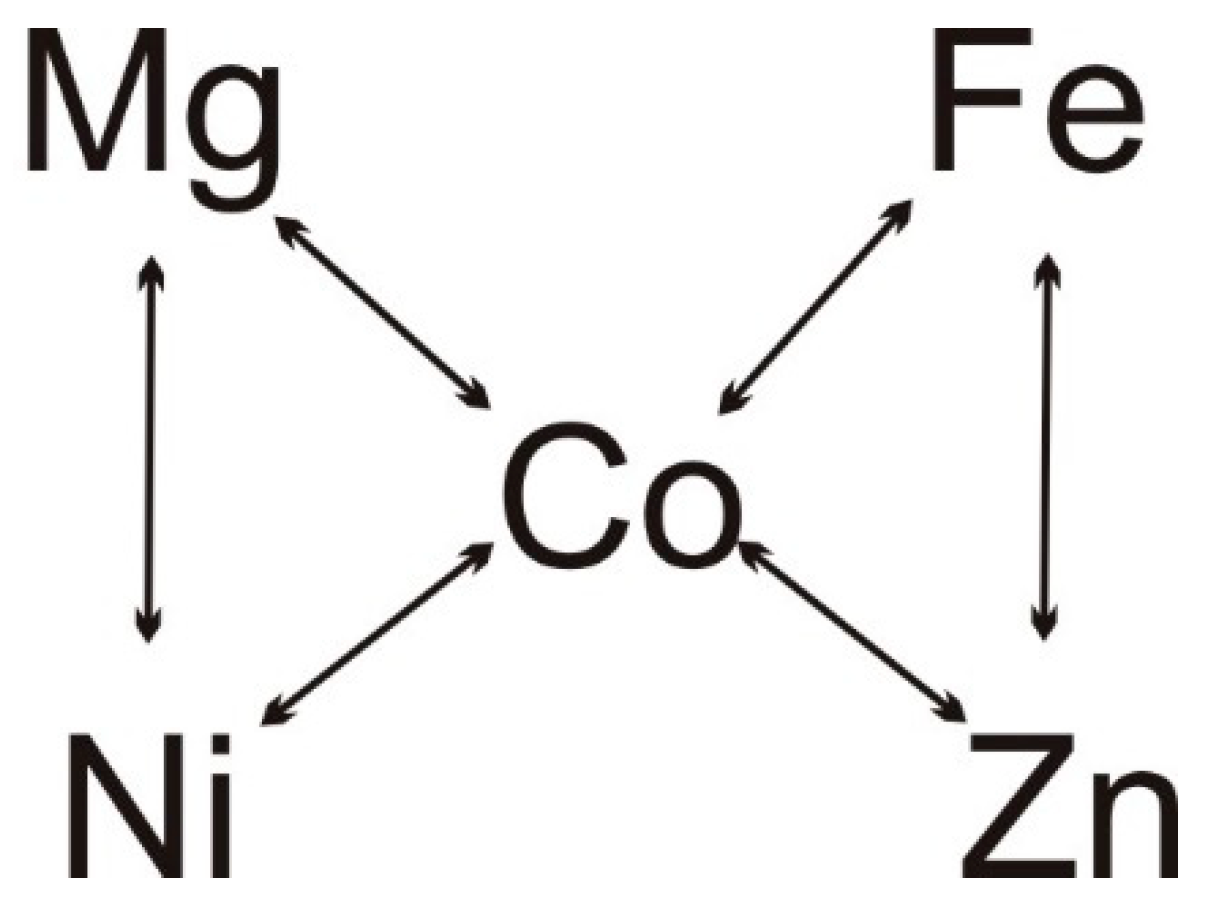
In addition to the unlimited erythrite–köttigite binary, erythrite also displays a more complex pattern of isomorphous substitutions, including limited erythrite–hörnesite, erythrite–annabergite, erythrite–hörnesite–köttigite, and erythrite–hörnesite–annabergite solid-solution series. Unlike erythrite, köttigite lacks significant substitutions of Zn with Mg and Ni. This observation, combined with the data in Table 1, leads to the conclusion that there are two subseries of dominant cationic substitutions within the arsenate series linked by erythrite (Figure 12). Substitutions between these subseries are possible but rather limited. Whether these two subseries are an artefact of a limited amount of data or are genuine is an open question that requires further investigation.
The ternary solid solution between erythrite, hörnesite, and annabergite appears to have been enabled by their overlapping Eh-pH stability fields [24,25]. This external factor explains the preferred incorporation of Mg and Ni into erythrite in the examined samples.
The single-crystal refinement of köttigite and Co-rich köttigite, as performed by Hill [6] and as part of the present study, suggests structural disorder in the erythrite–köttigite solid solution, i.e., the random distribution of Co and Zn ions over two special octahedral sites. This is in contrast with the parasymplesite–köttigite solid solution, which displays cations partitioned between octahedral sites [7]. Therefore, there are two structural types of solid solutions within the arsenate series of the vivianite group minerals: disordered and ordered.
Small but significant changes in bond distances, rotation, and distortion of coordination polyhedra were observed in response to the Co ↔ Zn substitutions (Figure 13). Raman spectra are extremely sensitive to these changes and can be used to distinguish between both end members and intermediary compositions in the erythrite–köttigite solid-solution series.
The structure of köttigite is less stable in a vacuum, as well as more susceptible to electron beam-induced dehydration, than erythrite, due to the instability of Zn ions in the octahedral coordination.
The paragenetic sequence within the extended erythrite–köttigite solid solution reflects the chemical evolution of supergene fluids towards higher acidity associated with a gradual increase in Zn(II) activity related to the exhaustion of Co(II) due to the early precipitation of erythrite.
Supplementary Materials
The following are available online at https://www.mdpi.com/2075-163X/10/6/548/s1, Table S1: Anisotropic displacement parameters in Co-rich köttigite, Table S2: Selected bond distances (Å) and angles (°) in Co-rich köttigite.
Author Contributions
J.C. conceptualisation, sample selection, performance of EPMA, acquisition of SE/BSE images, and editorial work. M.D. performed the Raman spectroscopy analyses and interpreted the obtained spectra. J.J. analysed the chemical composition data and wrote the article. T.K. performed the X-ray powder diffraction experiment and calculated unit cell parameters. J.K. performed single-crystal structure refinement. E.S. provided the samples and took microphotographs. All authors have read and agreed to the published version of the manuscript.
Funding
This research received no external funding.
Acknowledgments
We are grateful to Piotr Dzierżanowski, Beata Marciniak-Maliszewska and Petras Jokubauskas, for their EPMA technical support and discussions. Przemysław Cyberski and Mariusz Oleszczuk are thanked for their help in samples collection. We want to thank Rafał Juroszek for the separation of crystals to single-crystal diffraction measurements. This manuscript has benefitted from the reviews by two Minerals anonymous reviewers.
Conflicts of Interest
The authors declare no conflict of interest.
References
- Wildner, M.; Giester, G.; Lengauer, C.; McCammon, C. Structure and crystal chemistry of vivianite-type compounds: Crystal structures of erythrite and annabergite with a Mössbauer study of erythrite. Eur. J. Miner. 1996, 8, 187–192. [Google Scholar] [CrossRef]
- Giuseppetti, G.; Tadini, C. The crystal structure of cabrerite, (Ni, Mg)3(AsO4)2·H2O, a variety of annabergite. Bull. Minéral. 1982, 105, 333–337. [Google Scholar] [CrossRef]
- Plášil, J.; Škácha, P.; Sejkora, J.; Škoda, R.; Novák, M.; Veselovský, F.; Hloušek, J. Babánekite, Cu3(AsO4)2 ∙8H2O, from Jáchymov, Czech Republic—A new member of the vivianite group. J. Geosci. 2017, 62, 261–270. [Google Scholar] [CrossRef] [Green Version]
- Capitelli, F.; Elaatmani, M.; Lalaoui, M.D.; Piniella, J.F. Crystal structure of a vivianite-type mineral: Mg-rich erythrite, (Co2.16Ni0.24Mg0.60)(AsO4)2·8H2O. Zeitschrift für Kristallographie -Cryst. Mater. 2007, 222, 676–679. [Google Scholar] [CrossRef]
- Antao, S.M.; Dhaliwal, I. Growth oscillatory zoning in erythrite, ideally Co3(AsO4)2·8H2O: Structural variations in vivianite-group minerals. Minerals 2017, 7, 136. [Google Scholar] [CrossRef]
- Hill, R.J. The crystal structure of köttigite. Am. Mineral. 1979, 64, 376–382. [Google Scholar]
- Yoshiasa, A.; Miyano, Y.; Isobe, H.; Sugiyama, K.; Arima, H.; Nakatsuka, A.; Momma, K.; Miyawaki, R. Structural refinement of köttigite–parasymplesite solid solution: Unique cation site occupancy and chemical bonding with water molecules. J. Miner. Pet. Sci. 2016, 111, 363–369. [Google Scholar] [CrossRef] [Green Version]
- Mori, H.; Ito, T. The structure of vivianite and symplesite. Acta Crystallogr. 1950, 3, 1–6. [Google Scholar] [CrossRef]
- Markl, G.; Marks, M.A.W.; Derrey, I.; Gühring, J.-E. Weathering of cobalt arsenides: Natural assemblages and calculated stability relations among secondary Ca-Mg-Co arsenates and carbonates. Am. Miner. 2014, 99, 44–56. [Google Scholar] [CrossRef]
- Dumańska-Słowik, M.; Pieczka, A.; Natkaniec-Nowak, L.; Kunecki, P.; Gaweł, A.; Heflik, W.; Smoliński, W.; Kozub-Budzyń, G. Mg-enriched erythrite from Bou Azzer, Anti-Atlas Mountains, Morocco: Geochemical and spectroscopic characteristics. Miner. Pet. 2018, 112, 381–392. [Google Scholar] [CrossRef] [Green Version]
- Siuda, R.; Macioch, A. Secondary arsenic minerals from the Złoty Stok As-Au abandoned mine (SW Poland). Geol. Quaterly 2018, 62, 925–940. [Google Scholar] [CrossRef] [Green Version]
- Anthony, J.W.; Bideaux, R.A.; Bladh, K.W.; Nichols, M.C. Handbook of Mineralogy: Arsenates, Phosphates, Vanadates; Mineral Data Publishing: Tucson, AZ, USA, 2000; Volume IV, p. 159. [Google Scholar]
- Jambor, J.L.; Dutrizac, J.E. Solid solutions in the annabergite-erythrite-hörnesite synthetic system. Can. Miner. 1995, 33, 1063–1071. [Google Scholar]
- Martens, W.N.; Kloprogge, J.T.; Frost, R.L.; Rintoul, L. Site occupancy of Co and Ni in erythrite-annabergite solid solutions deduced by vibrational spectroscopy. Can. Miner. 2005, 43, 1065–1075. [Google Scholar] [CrossRef]
- Wei, C.; Zhu, Y.; Zhang, X.; Wang, X.; Liu, J. Dissolution and solubility of the erythrite/annabergite solid solution [(CoxNi1-x)3(AsO4)2·8H2O] at 25 °C. Asian J. Chem. 2013, 25, 7687–7696. [Google Scholar] [CrossRef]
- Sturman, B.D. New data for köttigite and parasymplesite. Can. Miner. 1976, 14, 437–441. [Google Scholar]
- Shannon, R.D. Revised effective ionic radii and systematic studies if interatomic distances in halides and chalcogenides. Acta Cryst. 1976, A32, 751–767. [Google Scholar] [CrossRef]
- Ciesielczuk, J.; Janeczek, J.; Dulski, M.; Krzykawski, T. Pseudomalachite–cornwallite and kipushite–philipsburgite solid solutions: Chemical composition and Raman spectroscopy. Eur. J. Miner. 2016, 28, 555–569. [Google Scholar] [CrossRef]
- Mochnacka, K.; Oberc-Dziedzic, T.; Mayer, W.; Pieczka, A. Ore mineralization related to geological evolution of the Karkonosze-Izera Massif (the Sudetes, Poland)–Towards a model. Ore Geol. Rev. 2015, 64, 215–238. [Google Scholar] [CrossRef]
- Parafiniuk, J.; Siuda, R.; Borkowski, A. Sulphate and arsenate minerals as environmental indicators in the weathering zones of selected ore deposits, Western Sudetes, Poland. Acta Geol. Pol. 2016, 66, 493–508. [Google Scholar] [CrossRef]
- Siuda, R.; Gołębiowska, B. New data on supergene minerals from Miedzianka-Ciechanowice deposit in the Rudawy Janowickie Mountains (Lower Silesia, Poland). Prz. Geol. 2011, 59, 226–234, (In Polish with English Abstract). [Google Scholar]
- Sheldrick, G.M. Crystal structure refinement with SHELXL. Acta Cryst. 2015, 71, 3–8. [Google Scholar]
- Lee, J.S.; Nriagu, J.O. Stability constants for metal arsenates. Environ. Chem. 2007, 4, 123–133. [Google Scholar] [CrossRef]
- Charykova, M.V.; Krivovichev, O.S.; Yakovenko, O.S.; Depmeier, W. Thermodynamics of arsenates, selenites, and sulfates in the oxidation zone of sulfide ores: Part III: Eh–pH diagrams of the Me–As–H2O Systems (Me = Co, Ni, Fe, Cu, Zn, Pb) at 25°C. Geol. Ore Depos. 2011, 53, 501–513. [Google Scholar] [CrossRef]
- Magalhães, M.C.F.; Pedrosa de Jesus, J.D. The chemistry of formation of some secondary arsenate minerals of Cu(II), Zn(II) and Pb(II). Miner. Mag. 1988, 52, 679–690. [Google Scholar] [CrossRef] [Green Version]
- Frost, R.L.; Martens, W.N.; Williams, P.; Kloprogge, J.T. Raman spectroscopic study of the vivianite arsenate minerals. J. Raman Spectrosc. 2003, 34, 751–759. [Google Scholar] [CrossRef] [Green Version]
- Rojo, J.M.; Mesa, J.L.; Pizarro, J.L.; Lezama, L.; Arriotua, M.I.; Rojo, T. Spectroscopic and magnetic study of the (Mg,M)3(AsO4)2 8H2O (M = Ni2+, Co2+) arsenates. Mater. Res. Bull. 1996, 31, 925–934. [Google Scholar] [CrossRef]
- Frost, R.L.; Kloprogge, T.; Weier, M.L.; Martens, W.N.; Ding, Z.; Edwards, G.H. Raman spectroscopy of selected arsenates–implications for soil remediation. Spectrochim. Acta A 2003, 59, 2241–2246. [Google Scholar] [CrossRef] [Green Version]
- Martens, W.N.; Frost, R.L.; Kloprogge, T. Raman spectroscopy of synthetic erythrite, partially dehydrated erythrite and hydrothermally synthesized dehydrated erythrite. J. Raman Spectrosc. 2003, 34, 90–95. [Google Scholar] [CrossRef] [Green Version]
- Martens, W.N.; Kloprogge, T.; Frost, R.L.; Rintoul, L. Single-crystal Raman study of erythrite Co3(AsO4)2·H2O. J. Raman Spectrosc. 2004, 35, 208–216. [Google Scholar] [CrossRef] [Green Version]
- Makreski, P.; Stefov, S.; Pejov, L.; Jovanovski, G. Theoretical and experimental study of the vibrational spectra of (para)symplesite and hornesite. Spectrochim. Acta A 2015, 144, 155–162. [Google Scholar] [CrossRef]
- Čejka, J.; Sejkora, J.; Bahfenne, S.; Palmer, S.J.; Plášil, J.; Frost, R.L. Raman spectroscopy of hydrogen-arsenate group (AsO3OH) in solid-state compounds: Cobalt mineral phase burgessite Co2(H2O)[AsO3OH]2·H2O. J. Raman Spectrosc. 2011, 42, 214–218. [Google Scholar] [CrossRef] [Green Version]
- Libowitzky, E. Correlation of the O-H stretching frequencies and the OH… H hydrogen bond lengths in minerals. Monatschefte für Chemie 1999, 130, 1047–1049. [Google Scholar]
Figure 1.
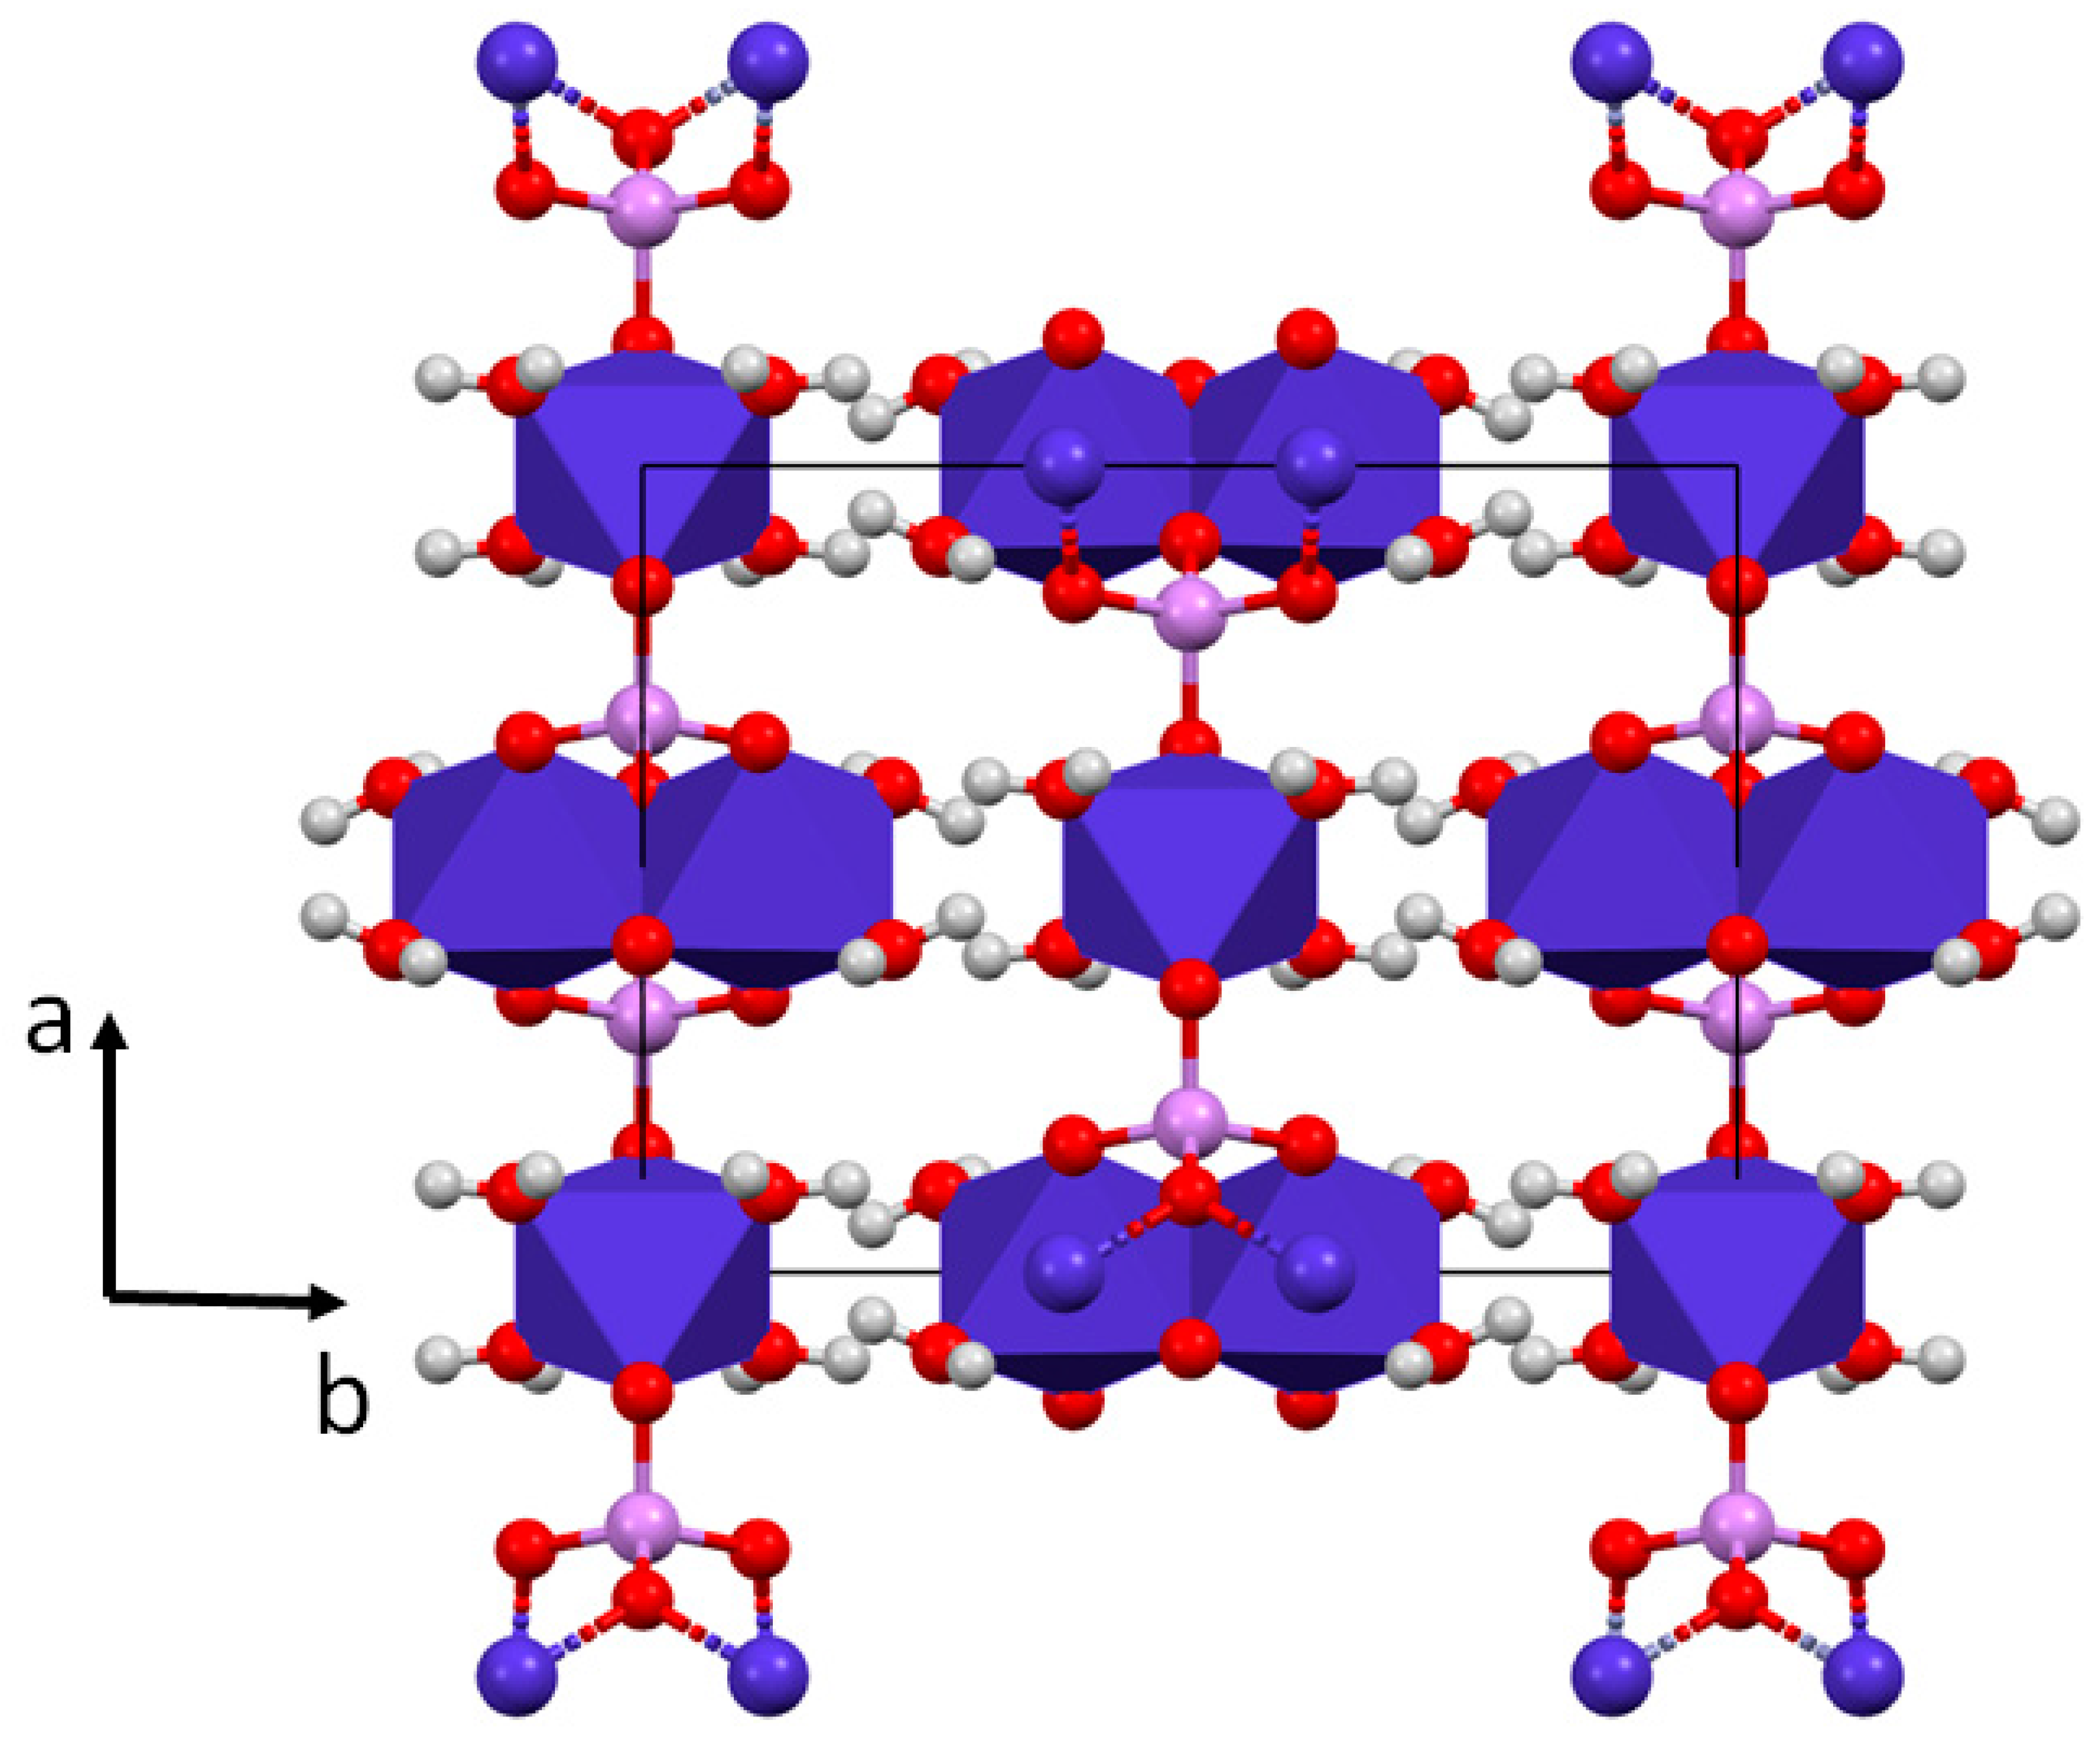
Crystal structure of arsenate-series vivianite-group minerals viewed along the c axis. Metals occupy insular and double-edged octahedra (blue). Red spheres—oxygen; violet spheres—arsenic; grey spheres—hydrogen.
Figure 1.
Crystal structure of arsenate-series vivianite-group minerals viewed along the c axis. Metals occupy insular and double-edged octahedra (blue). Red spheres—oxygen; violet spheres—arsenic; grey spheres—hydrogen.

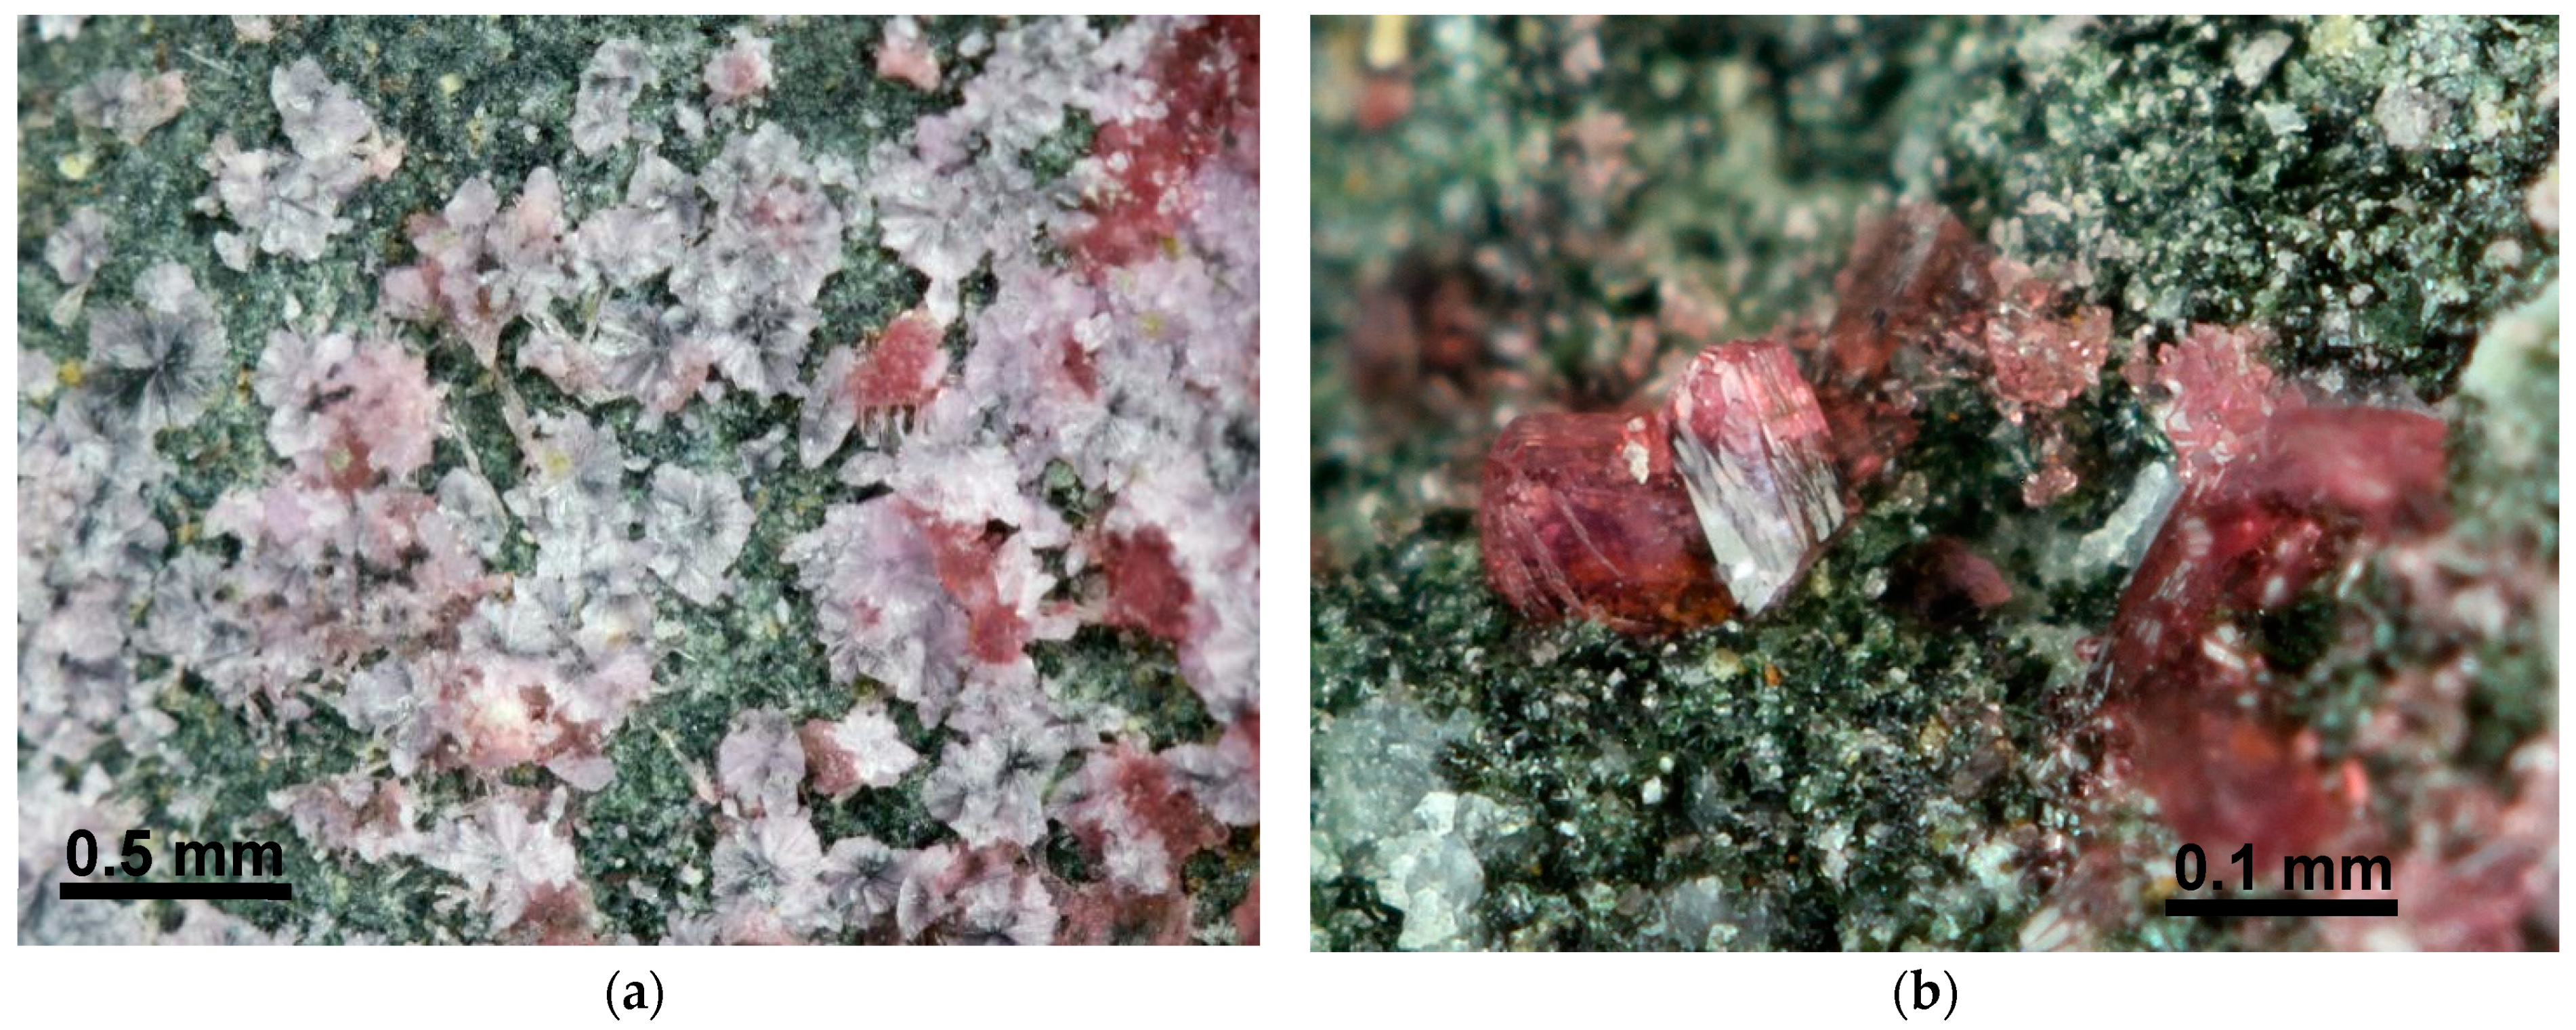
Figure 2.
Variation in colour in the erythrite–köttigite series minerals from the Miedzianka polymetallic ore deposit: (a) aggregates of köttigite (colourless and white) and erythrite (pink) on the surface of chloritised amphibolite; (b) pink erythrite crystal overgrown by colourless köttigite.
Figure 2.
Variation in colour in the erythrite–köttigite series minerals from the Miedzianka polymetallic ore deposit: (a) aggregates of köttigite (colourless and white) and erythrite (pink) on the surface of chloritised amphibolite; (b) pink erythrite crystal overgrown by colourless köttigite.

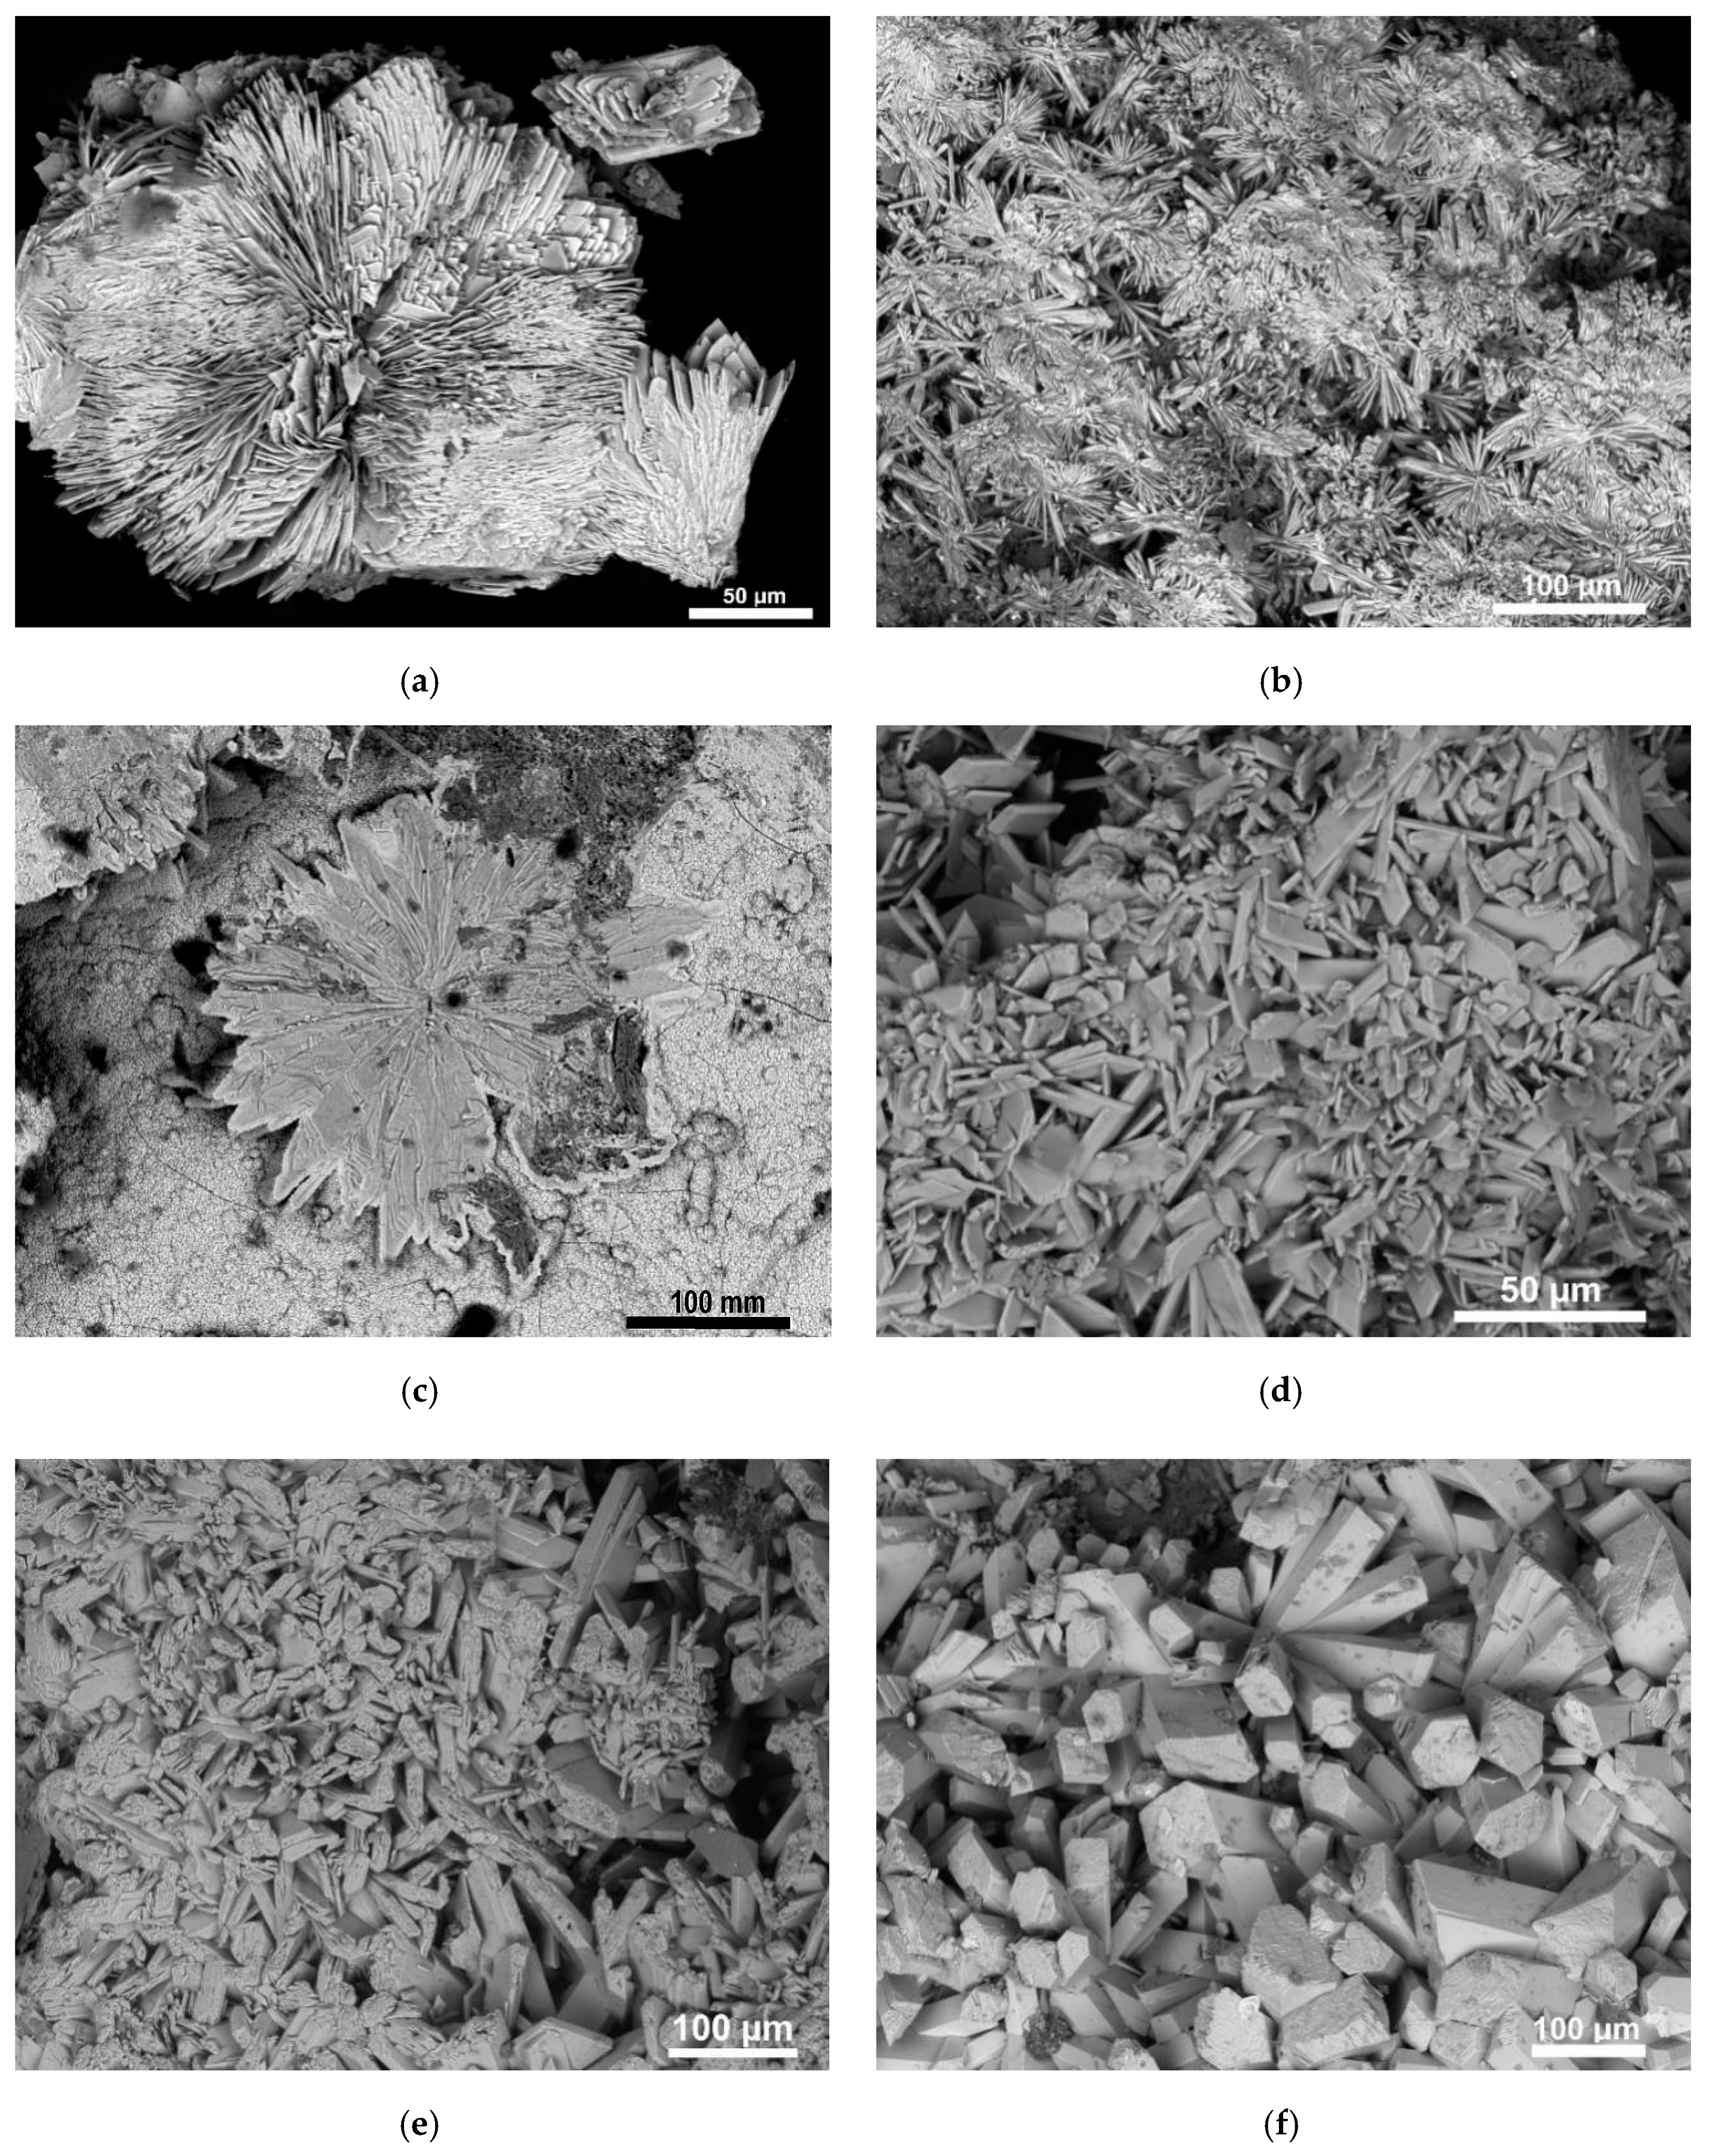
Figure 3.
Secondary electron images of crystal aggregates of the erythrite–köttigite solid solution from Miedzianka: (a) radial platy crystal aggregates of erythrite with features indicative of autoepitaxial growth (upper and lower right); (b) polycentric radial aggregates of erythrite; (c) flat radial aggregate of erythrite (Co >> Zn) on the chrysocolla crust; (d) aggregates of Zn-rich erythrite; (e) aggregate of thick platy crystals of Co-rich köttigite; (f) prismatic crystals of köttigite.

Figure 4.
Back-scattered electron (BSE) images showing the spatial relationships between compositionally different members of the erythrite–köttigite solid solution in Miedzianka. (a) Radial aggregate of erythrite. (b) Prismatic crystals of Zn-rich erythrite. (c) Crystals with intermediate composition between köttigite and erythrite. (d) Unidentified Zn-anhydrous arsenate occupies the space between prismatic köttigite crystals. (e,f) Zoned aggregates of the erythrite- köttigite crystals. The outer portions of the aggregates are enriched in Zn (EPMA). Chl—chlorite; Qz—quartz; Cal—calcite. EPMA spots are marked with crosses.

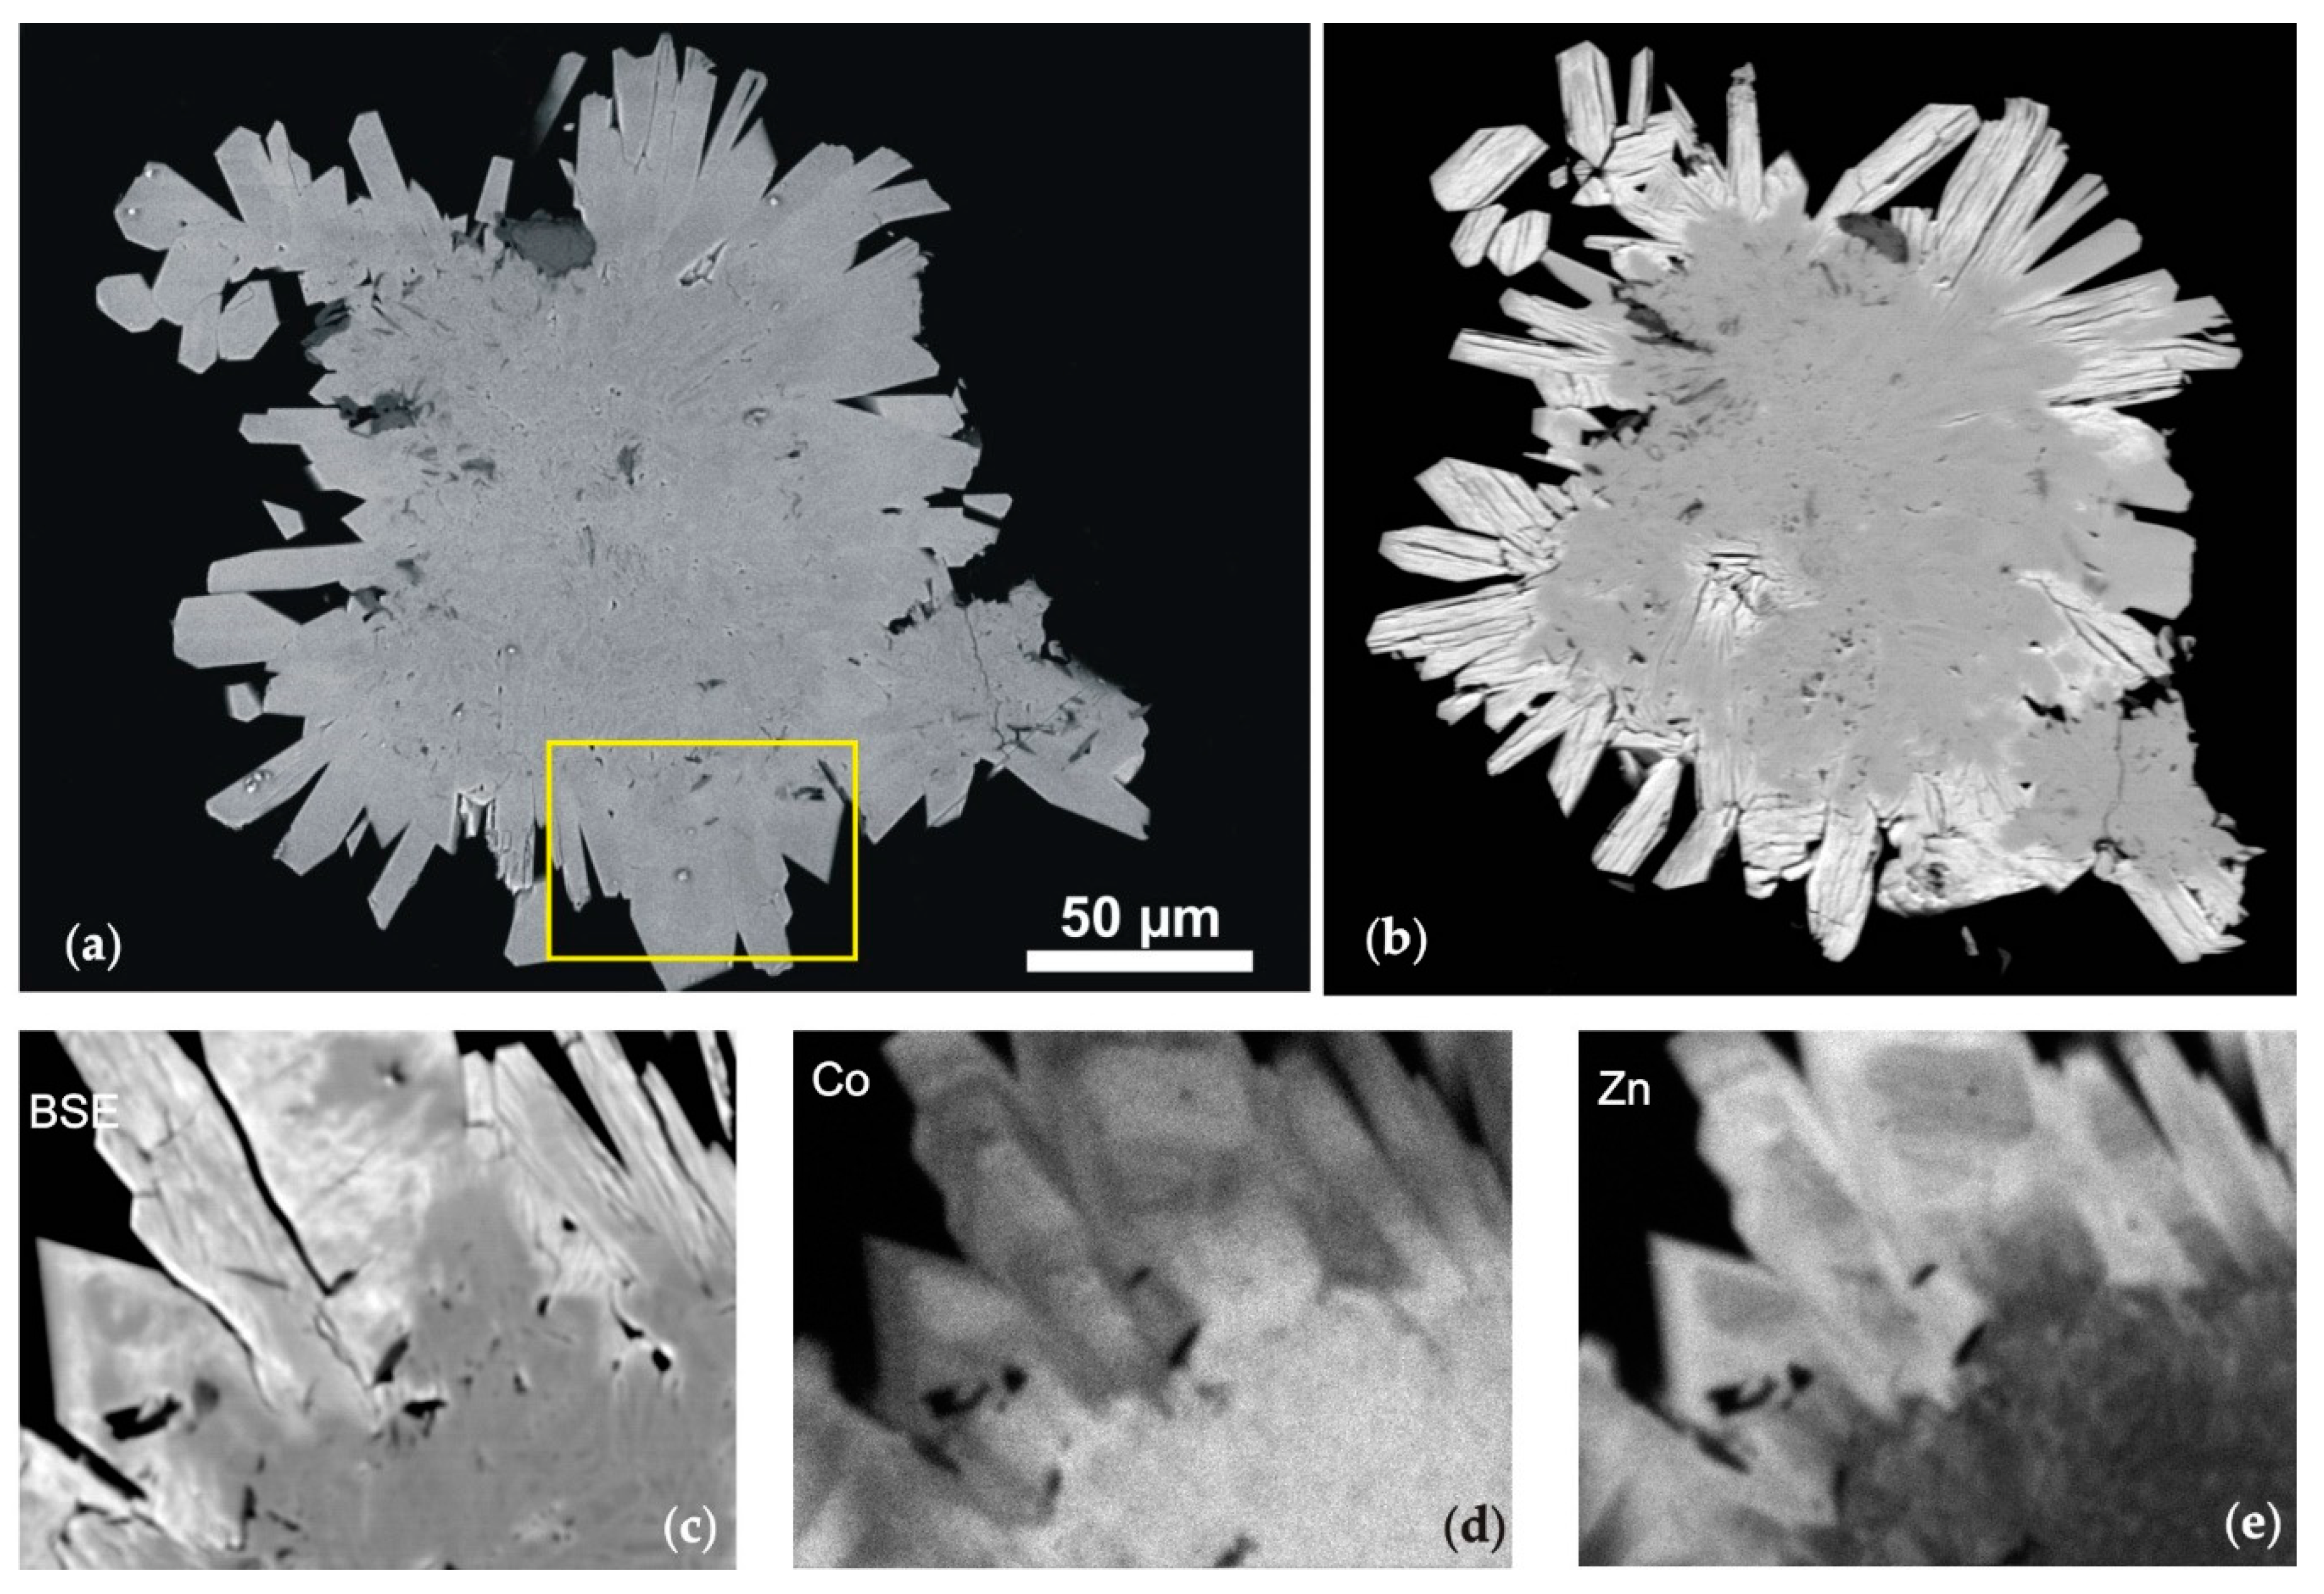
Figure 5.
(a) BSE image of erythrite overgrown by prismatic crystals of köttigite prior to electron microprobe analysis. Köttigite is only slightly brighter than erythrite due to the greater atomic weight of Zn compared to Co. (b) BSE image of (a) obtained following electron microprobe analysis and kept for three hours in high vacuum conditions. Köttigite crystals display bright contrast and pronounced (010) cleavage with fractures along cleavage planes not seen in the same crystals in (a). Relics of unchanged (lower contrast) köttigite crystals are present in the upper right portion of the image. (c–e) BSE image and elemental maps of an area framed in (a).

Figure 6.
Plot of Co vs. Zn in atoms per formula unit (apfu): (a) in the erythrite–köttigite solid solution singled out from all analyses shown in (b). Symbols refer to 14 samples from Miedzianka and data in the literature.
Figure 6.
Plot of Co vs. Zn in atoms per formula unit (apfu): (a) in the erythrite–köttigite solid solution singled out from all analyses shown in (b). Symbols refer to 14 samples from Miedzianka and data in the literature.

Figure 7.
Ternary compositional plots for erythrites and köttigites from Miedzianka supplemented by data in the literature. Diamond—[10], triangle—[5], square—[6], circle—[4].

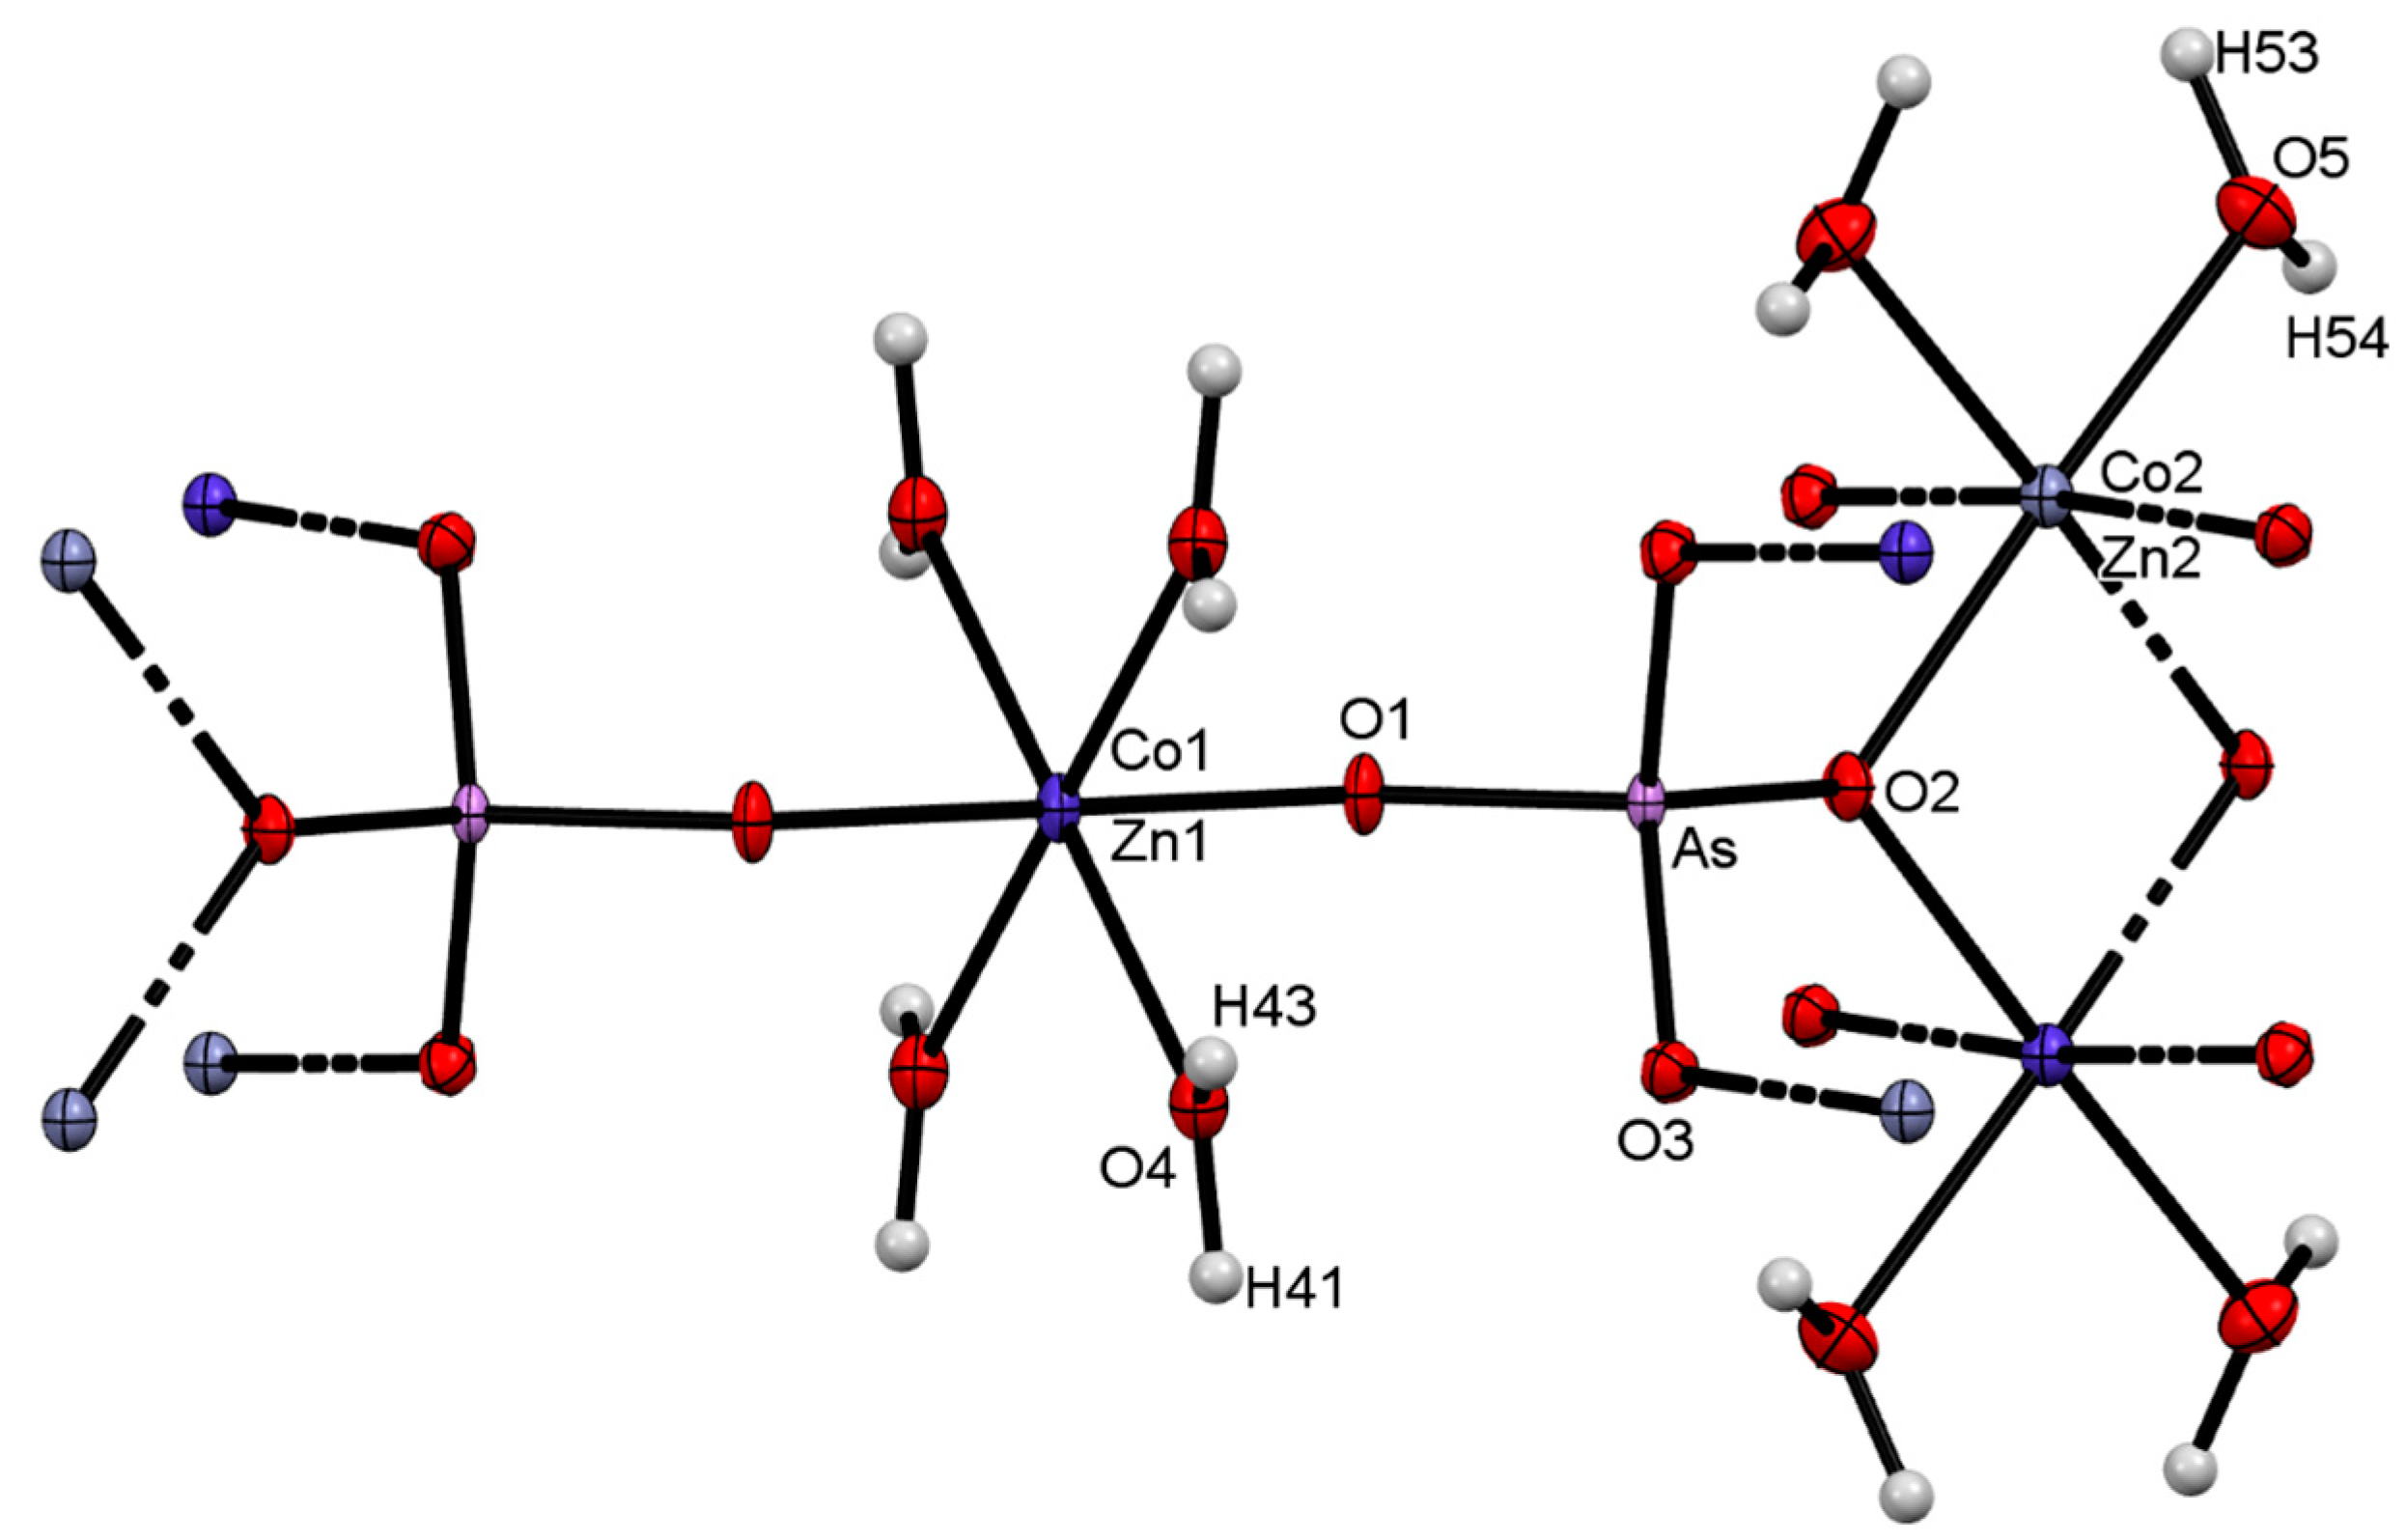
Figure 8.
Topology of M1, M2, and As sites in Co-rich köttigite. Probability level for thermal ellipsoids: 50%. Labels of symmetrically equivalent atoms are omitted for clarity.
Figure 8.
Topology of M1, M2, and As sites in Co-rich köttigite. Probability level for thermal ellipsoids: 50%. Labels of symmetrically equivalent atoms are omitted for clarity.

Figure 9.
Fitted Raman spectra of members of the erythrite–köttigite solid solution in the region of stretching vibrations of [AsO4]. Shaded band in each spectrum corresponds to the vibrations of [(Co,Zn)O6]. Changes in the band intensity correlate well with the Co ↔ Zn isomorphic substitutions.
Figure 9.
Fitted Raman spectra of members of the erythrite–köttigite solid solution in the region of stretching vibrations of [AsO4]. Shaded band in each spectrum corresponds to the vibrations of [(Co,Zn)O6]. Changes in the band intensity correlate well with the Co ↔ Zn isomorphic substitutions.

Figure 10.
Fitted Raman spectra of members of the erythrite–köttigite solid solution within the range 100–500 cm−1.
Figure 10.
Fitted Raman spectra of members of the erythrite–köttigite solid solution within the range 100–500 cm−1.

Figure 11.
(a) Fitted Raman spectra of erythrite–köttigite solid solution in the hydroxyl region; (b) part of the structure of erythrite and köttigite with the probable H-bond pattern between hydrogen and oxygen shown in the right side of the figure. Spheres: O (green) related to H-bonds, O (red) in the polyhedra, Co or Zn (blue).

Figure 12.
Schematic representation of dominant cationic substitutions within the arsenate series of vivianite-group minerals.
Figure 12.
Schematic representation of dominant cationic substitutions within the arsenate series of vivianite-group minerals.

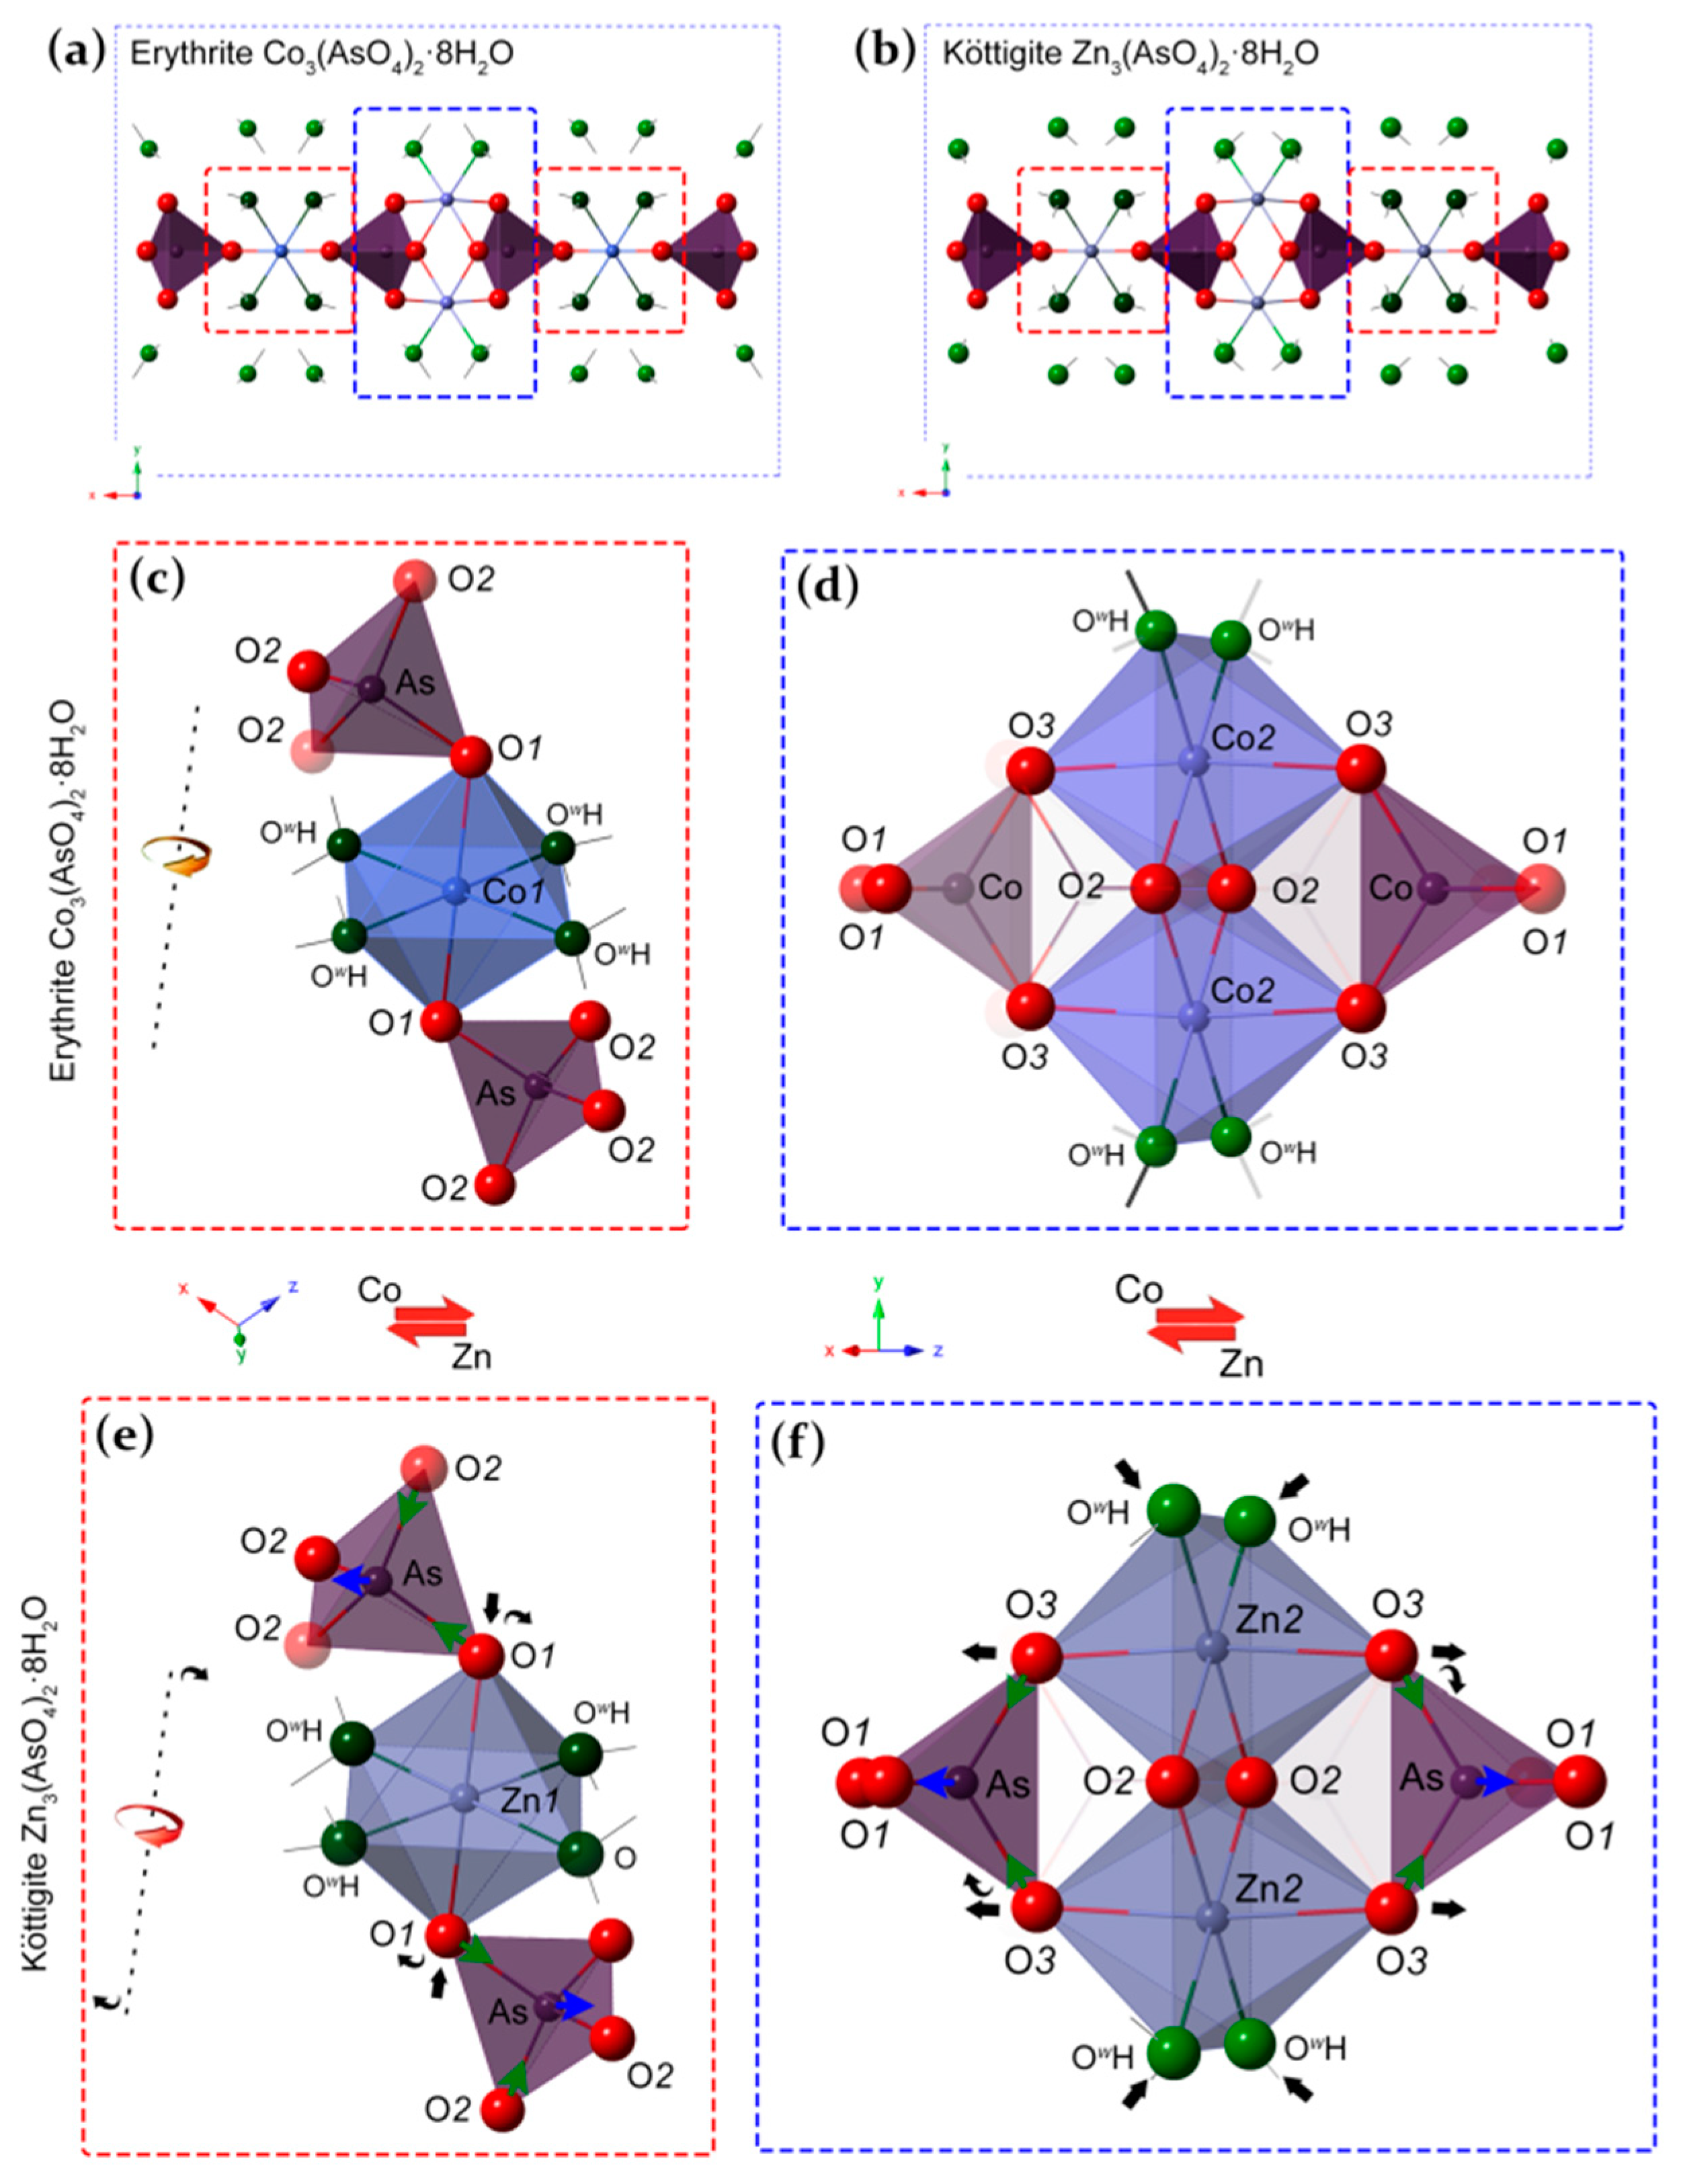
Figure 13.
Structure of erythrite (a) and köttigite (b). Close-ups (c–f) show insular M1 and double edge-sharing M2 octahedra with adjacent AsO4 tetrahedra. Black, blue, and green arrows show rotation, shortening, or lengthening of bonds. The dotted line represents the O1–M1–O1 axis.
Figure 13.
Structure of erythrite (a) and köttigite (b). Close-ups (c–f) show insular M1 and double edge-sharing M2 octahedra with adjacent AsO4 tetrahedra. Black, blue, and green arrows show rotation, shortening, or lengthening of bonds. The dotted line represents the O1–M1–O1 axis.


Table 1.
Molecular composition (mol%) of arsenate series of the vivianite-group minerals *. Members of solid-solution series constituting > 90 mol% are in bold a table.
Table 1.
Molecular composition (mol%) of arsenate series of the vivianite-group minerals *. Members of solid-solution series constituting > 90 mol% are in bold a table.
| Erythrite Co3(AsO4)2·8H2O | Annabergite Ni3(AsO4)2·8H2O | Köttigite Zn3(AsO4)2·8H2O | Hörnesite Mg3(AsO4)2·8H2O | Parasymplesite Fe3(AsO4)2·8H2O | Ref. |
|---|---|---|---|---|---|
| 93 | 2 | 4 | - | 1 | [5] |
| 89 | - | - | - | 11 | [12] |
| 84 | 3 | - | 11 | 2 | [10] |
| 81 | 5 | - | 12 | 2 | [10] |
| 75 | 5 | 1 | 19 | 1 | [10] |
| 72 | 8 | - | 20 | - | [4] |
| 71 | 5 | 1 | 22 | 1 | [10] |
| 67 | 8 | - | - | 25 | [1] |
| 67 | 10 | - | 20 | - | [11] # |
| 50 | 5 | - | 45 | - | [10] |
| 49 | 5 | - | 46 | - | [10] |
| 46 | 8 | - | 42 | - | [11] # |
| 22 | 43 | - | 30 | - | [11] # |
| 19 | 51 | - | 27 | - | [11] |
| 19 | 5 | 76 | - | - | [16] |
| 14 | 5 | 81 | - | - | [16] |
| - | 83 | - | 17 | - | [1] |
| - | 74 | - | 23 | 3 | [2] |
| - | - | 46 | - | 54 | [7] |
| - | - | 44 | - | 56 | [7] |
* excluding babánekite; # plus n mol% Ca to obtain 100 mol%.
Table 2.
Crystal data, data collection, and structure refinement.
| Crystal Data | |
|---|---|
| Chemical formula | As4Co2.16H32O32Zn3.84 |
| Mr | 1222.24 |
| Crystal system, space group | Monoclinic, C2/m |
| Temperature (K) | 293 |
| a, b, c (Å) | 10.2588 (3), 13.4200 (4), 4.76200 (14) |
| β (°) | 105.232 (3) |
| V (Å3) | 632.56 (3) |
| Z | 1 |
| F(000) | 594 |
| Radiation type | Mo Kα |
| µ (mm−1) | 10.29 |
| Crystal size (mm) | 0.18 × 0.09 × 0.07 |
| Data Collection | |
| Absorption correction | Multi-scan CrysAlis PRO 1.171.38.41q (Rigaku Oxford Diffraction, 2015) Empirical absorption correction using spherical harmonics, implemented in SCALE3 ABSPACK scaling algorithm. |
| Tmin, Tmax | 0.528, 1.000 |
| No. of measured, independent and observed [I > 2σ(I)] reflections | 2474, 676, 661 |
| Rint | 0.014 |
| Θ values (°) | Θmax = 26.4, Θmin = 3.0 |
| (sin Θ/λ)max (Å−1) | 0.625 |
| Range of h, k, l | h = −12 → 12, k = −16 → 12, l = −5 → 5 |
| Refinement | |
| R[F2 > 2σ(F2)], wR(F2), S | 0.021, 0.060, 1.15 |
| No. of reflections | 676 |
| No. of parameters | 55 |
| No. of restraints | 6 |
| H-atom treatment | H-atom parameters constrained |
| Δ > max, Δ > min (e Å−3) | 0.77, −0.75 |
Table 3.
Representative EPMA data (wt%) and number of atoms calculated based on five cations in a formula unit of erythrite–köttigite solid solution from Miedzianka, Sudetes Mts; E and K—ideal erythrite and köttigite, respectively.
Table 3.
Representative EPMA data (wt%) and number of atoms calculated based on five cations in a formula unit of erythrite–köttigite solid solution from Miedzianka, Sudetes Mts; E and K—ideal erythrite and köttigite, respectively.
| Analysis Number | CoO | ZnO | MgO | NiO | FeO | As2O5 | P2O5 | SO2 | CaO | SiO2 | Total | Co | Zn | Mg | Ni | Fe | Mn | ΣX | As | P | ΣA |
|---|---|---|---|---|---|---|---|---|---|---|---|---|---|---|---|---|---|---|---|---|---|
| E | 37.54 | - | - | - | - | 38.39 | - | - | - | - | 75.93 | 3.00 | - | - | - | - | - | 3.00 | 2.00 | - | 2.00 |
| 1 | 34.17 | 0.73 | 0.87 | 0.41 | 0.13 | 37.86 | 0.02 | 0.01 | 0.21 | 0.05 | 74.46 | 2.77 | 0.05 | 0.13 | 0.03 | 0.01 | 0.00 | 3.00 | 2.00 | 0.00 | 2.00 |
| 2 | 33.85 | 1.19 | 0.75 | 1.12 | 0.00 | 38.75 | 0.09 | 0.05 | 0.37 | 0.06 | 76.22 | 2.69 | 0.09 | 0.11 | 0.09 | 0.00 | 0.00 | 2.98 | 2.01 | 0.01 | 2.02 |
| 3 | 33.36 | 1.71 | 0.82 | 0.63 | 0.11 | 38.49 | 0.00 | 0.00 | 0.25 | 0.01 | 75.50 | 2.67 | 0.13 | 0.12 | 0.05 | 0.01 | 0.01 | 2.99 | 2.01 | 0.00 | 2.01 |
| 4 | 32.58 | 0.62 | 1.24 | 1.10 | 0.07 | 37.72 | 0.03 | 0.10 | 0.25 | 0.02 | 73.75 | 2.66 | 0.05 | 0.19 | 0.09 | 0.01 | 0.00 | 2.99 | 2.01 | 0.00 | 2.01 |
| 5 | 31.77 | 2.35 | 0.60 | 1.06 | 0.05 | 37.79 | 0.00 | 0.16 | 0.13 | 0.27 | 74.22 | 2.61 | 0.18 | 0.09 | 0.09 | 0.00 | 0.00 | 2.98 | 2.02 | 0.00 | 2.02 |
| 6 | 31.72 | 0.22 | 1.05 | 2.00 | 0.27 | 37.66 | 0.06 | 0.27 | 0.64 | 0.23 | 74.19 | 2.61 | 0.02 | 0.16 | 0.16 | 0.02 | 0.01 | 2.98 | 2.02 | 0.01 | 2.02 |
| 7 | 31.44 | 2.54 | 1.03 | 0.41 | 0.19 | 37.42 | 0.00 | 0.21 | 0.47 | 0.07 | 73.85 | 2.59 | 0.19 | 0.16 | 0.03 | 0.02 | 0.01 | 2.99 | 2.01 | 0.00 | 2.01 |
| 8 | 30.23 | 1.53 | 1.25 | 1.20 | 0.03 | 36.75 | 0.02 | 0.05 | 0.46 | 0.45 | 72.01 | 2.55 | 0.12 | 0.20 | 0.10 | 0.00 | 0.00 | 2.98 | 2.02 | 0.00 | 2.02 |
| 9 | 30.79 | 0.11 | 1.74 | 1.39 | 0.10 | 37.14 | 0.00 | 0.19 | 0.52 | 0.02 | 72.74 | 2.54 | 0.01 | 0.27 | 0.12 | 0.01 | 0.06 | 3.00 | 2.00 | 0.00 | 2.00 |
| 10 | 30.81 | 0.38 | 2.08 | 1.51 | 0.05 | 37.12 | 0.04 | 0.13 | 0.57 | 0.01 | 72.80 | 2.53 | 0.03 | 0.32 | 0.12 | 0.00 | 0.01 | 3.01 | 1.99 | 0.00 | 1.99 |
| 11 | 30.14 | 2.00 | 1.27 | 1.07 | 0.00 | 36.80 | 0.00 | 0.01 | 0.59 | 0.00 | 72.11 | 2.53 | 0.15 | 0.20 | 0.09 | 0.00 | 0.02 | 2.99 | 2.01 | 0.00 | 2.01 |
| 12 | 30.59 | 0.00 | 1.58 | 2.00 | 0.28 | 37.04 | 0.00 | 0.08 | 0.82 | 0.26 | 73.30 | 2.52 | 0.00 | 0.24 | 0.17 | 0.02 | 0.06 | 3.01 | 1.99 | 0.00 | 1.99 |
| 13 | 29.83 | 4.61 | 1.11 | 0.24 | 0.18 | 37.08 | 0.00 | 0.21 | 0.19 | 0.15 | 73.59 | 2.46 | 0.35 | 0.17 | 0.02 | 0.02 | 0.00 | 3.01 | 1.99 | 0.00 | 1.99 |
| 14 | 29.83 | 3.21 | 1.25 | 0.96 | 0.19 | 37.95 | 0.01 | 0.12 | 0.63 | 0.11 | 74.51 | 2.43 | 0.24 | 0.19 | 0.08 | 0.02 | 0.02 | 2.98 | 2.02 | 0.00 | 2.02 |
| 15 | 29.62 | 0.00 | 2.59 | 1.57 | 0.10 | 37.59 | 0.04 | 0.25 | 0.70 | 0.00 | 72.70 | 2.43 | 0.00 | 0.39 | 0.13 | 0.01 | 0.02 | 2.98 | 2.01 | 0.00 | 2.02 |
| 16 | 28.48 | 5.15 | 1.49 | 0.46 | 0.17 | 38.26 | 0.00 | 0.04 | 0.43 | 0.13 | 74.72 | 2.31 | 0.38 | 0.22 | 0.04 | 0.01 | 0.01 | 2.98 | 2.02 | 0.00 | 2.02 |
| 17 | 28.05 | 8.25 | 0.37 | 0.31 | 0.00 | 37.84 | 0.20 | 0.04 | 0.58 | 0.05 | 75.69 | 2.27 | 0.62 | 0.06 | 0.04 | 0.00 | 0.00 | 2.98 | 2.00 | 0.02 | 2.02 |
| 18 | 27.68 | 7.94 | 0.91 | 0.44 | 0.05 | 37.57 | 0.06 | 0.02 | 0.38 | 0.40 | 75.45 | 2.24 | 0.59 | 0.14 | 0.04 | 0.00 | 0.00 | 3.01 | 1.98 | 0.01 | 1.99 |
| 19 | 26.61 | 5.37 | 1.36 | 0.55 | 0.75 | 36.83 | 0.01 | 0.06 | 0.12 | 0.03 | 71.72 | 2.24 | 0.42 | 0.21 | 0.05 | 0.07 | 0.00 | 2.98 | 2.02 | 0.00 | 2.02 |
| 20 | 27.66 | 1.70 | 3.67 | 0.99 | 0.24 | 37.59 | 0.00 | 0.03 | 0.53 | 0.00 | 72.60 | 2.23 | 0.13 | 0.55 | 0.08 | 0.02 | 0.02 | 3.02 | 1.98 | 0.00 | 1.98 |
| 21 | 26.64 | 4.44 | 2.68 | 0.40 | 0.25 | 37.22 | 0.00 | 0.13 | 0.25 | 0.76 | 72.98 | 2.19 | 0.34 | 0.41 | 0.03 | 0.02 | 0.02 | 3.01 | 1.99 | 0.00 | 1.99 |
| 22 | 28.24 | 9.94 | 0.46 | 0.78 | 0.00 | 39.45 | 0.20 | 0.03 | 0.38 | 0.20 | 79.74 | 2.18 | 0.71 | 0.07 | 0.03 | 0.00 | 0.01 | 2.99 | 1.99 | 0.02 | 2.01 |
| 23 | 27.44 | 2.90 | 3.56 | 0.70 | 0.32 | 38.46 | 0.00 | 0.08 | 0.28 | 0.09 | 74.10 | 2.17 | 0.21 | 0.52 | 0.06 | 0.03 | 0.02 | 3.01 | 1.99 | 0.00 | 1.99 |
| 24 | 27.29 | 9.54 | 0.33 | 0.49 | 0.07 | 38.45 | 0.22 | 0.06 | 0.37 | 0.08 | 77.04 | 2.17 | 0.70 | 0.05 | 0.05 | 0.01 | 0.01 | 2.99 | 1.99 | 0.02 | 2.01 |
| 25 | 26.54 | 9.19 | 0.34 | 0.64 | 0.38 | 37.18 | 0.10 | 0.09 | 0.26 | 0.38 | 75.14 | 2.17 | 0.69 | 0.05 | 0.06 | 0.03 | 0.00 | 3.01 | 1.98 | 0.01 | 1.99 |
| 26 | 26.11 | 9.41 | 0.49 | 0.46 | 0.14 | 37.03 | 0.00 | 0.06 | 0.30 | 0.17 | 74.17 | 2.16 | 0.72 | 0.07 | 0.04 | 0.01 | 0.00 | 3.00 | 2.00 | 0.00 | 2.00 |
| 27 | 27.74 | 2.32 | 4.04 | 0.88 | 0.05 | 39.69 | 0.02 | 0.16 | 0.27 | 0.00 | 75.38 | 2.15 | 0.17 | 0.58 | 0.07 | 0.00 | 0.02 | 2.99 | 2.01 | 0.00 | 2.01 |
| 28 | 27.42 | 6.94 | 2.09 | 0.58 | 0.35 | 40.19 | 0.01 | 0.06 | 0.25 | 0.19 | 78.21 | 2.11 | 0.49 | 0.30 | 0.04 | 0.03 | 0.01 | 2.98 | 2.02 | 0.00 | 2.02 |
| 29 | 25.64 | 6.79 | 1.70 | 0.86 | 0.32 | 37.41 | 0.00 | 0.11 | 0.32 | 0.04 | 73.40 | 2.11 | 0.51 | 0.26 | 0.07 | 0.03 | 0.02 | 3.00 | 2.00 | 0.00 | 2.00 |
| 30 | 24.88 | 6.15 | 3.00 | 0.53 | 0.14 | 37.33 | 0.03 | 0.00 | 0.25 | 2.20 | 74.72 | 2.03 | 0.46 | 0.45 | 0.04 | 0.01 | 0.02 | 3.02 | 1.98 | 0.00 | 1.98 |
| 31 | 25.46 | 13.26 | 0.36 | 0.50 | 0.06 | 39.42 | 0.04 | 0.28 | 0.64 | 0.21 | 80.35 | 1.96 | 0.94 | 0.05 | 0.04 | 0.00 | 0.01 | 3.01 | 1.98 | 0.00 | 1.99 |
| 32 | 23.66 | 12.93 | 0.38 | 0.37 | 0.35 | 37.41 | 0.11 | 0.06 | 0.29 | 0.35 | 75.99 | 1.92 | 0.97 | 0.06 | 0.03 | 0.03 | 0.01 | 3.01 | 1.98 | 0.01 | 1.99 |
| 33 | 24.04 | 12.52 | 0.53 | 0.70 | 0.09 | 39.09 | 0.00 | 0.61 | 0.18 | 0.14 | 78.01 | 1.91 | 0.92 | 0.08 | 0.06 | 0.01 | 0.01 | 2.98 | 2.02 | 0.00 | 2.02 |
| 34 | 17.18 | 18.19 | 0.15 | 0.47 | 0.09 | 36.13 | 0.00 | 0.16 | 0.08 | 0.08 | 72.53 | 1.47 | 1.44 | 0.02 | 0.04 | 0.01 | 0.00 | 2.98 | 2.02 | 0.00 | 2.02 |
| 35 | 16.10 | 22.50 | 0.23 | 0.06 | 0.12 | 38.82 | 0.03 | 0.00 | 0.09 | 0.09 | 78.03 | 1.27 | 1.64 | 0.03 | 0.04 | 0.01 | 0.00 | 3.00 | 2.00 | 0.00 | 2.00 |
| 36 | 15.92 | 25.63 | 0.11 | 0.25 | 0.45 | 41.89 | 0.05 | 0.35 | 0.12 | 0.18 | 84.94 | 1.17 | 1.73 | 0.01 | 0.03 | 0.03 | 0.00 | 2.99 | 2.01 | 0.00 | 2.01 |
| 37 | 12.60 | 25.21 | 0.36 | 0.19 | 0.05 | 38.45 | 0.07 | 0.00 | 0.10 | 0.14 | 77.17 | 1.01 | 1.87 | 0.05 | 0.04 | 0.00 | 0.00 | 2.98 | 2.02 | 0.01 | 2.02 |
| 38 | 12.31 | 30.00 | 0.17 | 0.14 | 0.25 | 41.70 | 0.06 | 0.01 | 0.02 | 0.16 | 84.84 | 0.91 | 2.03 | 0.02 | 0.01 | 0.02 | 0.00 | 2.99 | 2.00 | 0.00 | 2.01 |
| 39 | 11.76 | 32.19 | 0.23 | 0.13 | 0.42 | 43.68 | 0.00 | 0.00 | 0.11 | 0.20 | 88.72 | 0.83 | 2.09 | 0.03 | 0.01 | 0.03 | 0.00 | 2.99 | 2.01 | 0.00 | 2.01 |
| 40 | 11.21 | 32.42 | 0.12 | 0.29 | 0.36 | 43.53 | 0.00 | 0.21 | 0.08 | 0.25 | 88.48 | 0.80 | 2.12 | 0.02 | 0.02 | 0.03 | 0.00 | 2.98 | 2.02 | 0.00 | 2.02 |
| 41 | 11.22 | 33.86 | 0.22 | 0.14 | 0.07 | 43.34 | 0.11 | 0.12 | 0.09 | 0.46 | 89.62 | 0.79 | 2.18 | 0.03 | 0.01 | 0.01 | 0.00 | 3.01 | 1.98 | 0.01 | 1.99 |
| 42 | 10.15 | 32.03 | 0.19 | 0.08 | 0.08 | 41.21 | 0.11 | 0.21 | 0.15 | 1.00 | 85.31 | 0.76 | 2.19 | 0.03 | 0.00 | 0.01 | 0.01 | 2.99 | 2.00 | 0.01 | 2.01 |
| 43 | 9.94 | 33.69 | 0.27 | 0.48 | 0.09 | 42.83 | 0.03 | 0.00 | 0.00 | 0.40 | 87.73 | 0.71 | 2.22 | 0.04 | 0.03 | 0.01 | 0.00 | 3.00 | 1.99 | 0.00 | 2.00 |
| 44 | 8.18 | 36.04 | 0.24 | 0.16 | 0.45 | 43.88 | 0.03 | 0.15 | 0.00 | 0.15 | 89.28 | 0.58 | 2.33 | 0.03 | 0.01 | 0.03 | 0.00 | 2.99 | 2.01 | 0.00 | 2.01 |
| 45 | 7.21 | 36.62 | 0.23 | 0.18 | 0.03 | 42.60 | 0.00 | 0.04 | 0.00 | 0.31 | 87.23 | 0.52 | 2.43 | 0.03 | 0.01 | 0.00 | 0.00 | 3.00 | 2.00 | 0.00 | 2.00 |
| 46 | 7.03 | 37.11 | 0.37 | 0.00 | 0.20 | 43.01 | 0.00 | 0.05 | 0.15 | 0.42 | 88.34 | 0.50 | 2.44 | 0.05 | 0.00 | 0.02 | 0.00 | 3.00 | 2.00 | 0.00 | 2.00 |
| 47 | 6.95 | 37.54 | 0.42 | 0.00 | 0.40 | 43.37 | 0.08 | 0.07 | 0.24 | 0.35 | 89.44 | 0.49 | 2.43 | 0.06 | 0.00 | 0.03 | 0.00 | 3.01 | 1.99 | 0.01 | 1.99 |
| 48 | 6.78 | 38.47 | 0.22 | 0.03 | 0.00 | 43.55 | 0.17 | 0.00 | 0.17 | 0.54 | 89.91 | 0.48 | 2.49 | 0.03 | 0.00 | 0.00 | 0.00 | 2.99 | 1.99 | 0.01 | 2.01 |
| 49 | 5.30 | 39.13 | 0.22 | 0.00 | 0.25 | 43.29 | 0.35 | 0.02 | 0.13 | 0.21 | 88.96 | 0.38 | 2.55 | 0.03 | 0.00 | 0.02 | 0.00 | 2.98 | 2.00 | 0.03 | 2.02 |
| 50 | 4.54 | 39.85 | 0.20 | 0.00 | 0.24 | 42.98 | 0.00 | 0.07 | 0.12 | 0.28 | 88.26 | 0.32 | 2.63 | 0.03 | 0.00 | 0.02 | 0.00 | 3.00 | 2.01 | 0.00 | 2.01 |
| K | - | 39.50 | - | - | - | 37.18 | - | - | - | - | 76.68 | - | 3.00 | - | - | - | - | 3.00 | 2.00 | - | 2.00 |
Table 4.
Atomic coordinates, equivalent isotropic displacement parameters, selected bond distances (Å) and angles (°) in Co-rich köttigite. The multiplicities of bond lengths and angles are given in brackets.
Table 4.
Atomic coordinates, equivalent isotropic displacement parameters, selected bond distances (Å) and angles (°) in Co-rich köttigite. The multiplicities of bond lengths and angles are given in brackets.
| x | y | z | Ueq (Å2) | |
|---|---|---|---|---|
| As | 0.31553(3) | 0 | 0.37387(7) | 0.0080(1) |
| (Zn,Co)1 | 0 | 0 | 0 | 0.0106(2) |
| (Zn,Co)2 | 0 | 0.38524(3) | 0 | 0.0104(2) |
| O1 | 0.1490(2) | 0 | 0.3751(5) | 0.0124(7) |
| O2 | 0.4051(3) | 0 | 0.7254(5) | 0.0119(7) |
| O3 | 0.34275(18) | 0.10662(13) | 0.2115(4) | 0.0121(5) |
| O4 | 0.09853(18) | 0.11482(13) | 0.8081(4) | 0.0144(5) |
| O5 | 0.39981(19) | 0.22666(15) | 0.7149(4) | 0.0186(5) |
| As–O1 | 1.710(3) | O3–As–O2(x2) | 110.08(7) | |
| As–O2 | 1.685(2) | O3i–As–O3(x2) | 116.33(12) | |
| As–O3(x2) | 1.6843(18) | O3–As–O1(x2) | 106.73(7) | |
| <As–O> | 1.691(2) | O2–As–O1 | 106.31(12) | |
| (Zn,Co)1–O1(x2) | 2.023(2) | O1– (Zn,Co)1–O1ii | 180.0 | |
| (Zn,Co)1–O4ii(x4) | 2.1718(18) | O1– (Zn,Co)1–O4ii(x4) | 87.46(7) | |
| <(Zn,Co)1–O> | 2.122(2) | O1– (Zn,Co)1–O4iv(x4) | 92.54(7) | |
| O4ii– (Zn,Co)1–O4iv(x2) | 180.00(11) | |||
| O4ii– (Zn,Co)1–O4v(x2) | 89.62(10) | |||
| O4iv– (Zn,Co)1–O4v(x2) | 90.38(10) | |||
| (Zn,Co)2–O2vi(x2) | 2.0883(17) | O2vi– (Zn,Co)2–O2ix | 84.97(10) | |
| (Zn,Co)2–O5vii(x2) | 2.1027(19) | O2vi– (Zn,Co)2–O5vii (x2) | 178.02(7) | |
| (Zn,Co)2–O3viii(x2) | 2.1171(18) | O2ix– (Zn,Co)2–O5vii (x2) | 93.10(8) | |
| <(Zn,Co)2–O> | 2.1027(18) | O5vii– (Zn,Co)2–O5vi | 88.84(11) | |
| O2vi– (Zn,Co)2–O3viii (x2) | 88.37(9) | |||
| O2ix– (Zn,Co)2–O3viii (x2) | 87.27(9) | |||
| O5vii– (Zn,Co)2–O3viii (x2) | 91.95(7) | |||
| O5vi– (Zn,Co)2–O3viii (x2) | 92.27(7) | |||
| O3viii– (Zn,Co)2–O3x | 174.08(10) | |||
Symmetry: (i) x, −y, z; (iii) −x, −y, −z + 1; (ii) −x, −y, −z; (iv) x, y, z − 1; (v) x, −y, z − 1; (vi) −x + 1/2, −y + 1/2, −z + 1; (vii) x − 1/2, −y + 1/2, z − 1; (viii) −x + 1/2, −y + 1/2, −z; (ix) x − 1/2, y + 1/2, z − 1; (x) x − 1/2, −y + 1/2, z.
Table 5.
Selected hydrogen-bond distances (Å) and angles (°) in Co-rich köttigite.
| D—H···A | D—H | H···A | D···A | D—H···A |
|---|---|---|---|---|
| O4—H41···O5 i | 0.96 | 2.56 | 3.109 (3) | 116.1 |
| O4—H41···O5 ii | 0.96 | 2.38 | 2.899 (3) | 113.7 |
| O4—H43···O1 | 0.96 | 1.84 | 2.730 (3) | 153.4 |
| O5—H53···O4 iii | 0.96 | 2.01 | 2.899 (3) | 152.3 |
| O5—H54···O3 | 0.96 | 1.90 | 2.819 (3) | 159.4 |
Symmetry: (i) −x + 1/2, −y + 1/2, −z + 2; (ii) x − 1/2, −y + 1/2, z; (iii) x + 1/2, −y + 1/2, z. D—donor; A—acceptor.
Table 6.
Average M1–O, M2–O, and As–O bond distances (Å) and O–As–O angles (°) in the erythrite–köttigite solid solution.
Table 6.
Average M1–O, M2–O, and As–O bond distances (Å) and O–As–O angles (°) in the erythrite–köttigite solid solution.
| Member of the Solid Solution | Köttigite mol% | M1-O | M2-O | As-O | O-As-O |
|---|---|---|---|---|---|
| Erythrite [4] | 4 | 2.122(1) | 2.088(1) | 1.710(1) | 109.36(3) |
| Co-köttigite | 64 | 2.122(2) | 2.103(2) | 1.691(2) | 109.41(8) |
| Köttigite [5] | 81 | 2.115(5) | 2.100(5) | 1.682(5) | 109.4(2) |
Table 7.
Unit-cell dimensions calculated from X-ray powder diffraction data for erythrite from Bou Azer, Morocco [5], köttigite from Schneeberg, Germany [6], and samples from Miedzianka.
| ER2 | Erythrite [5] | Hof | Na31 | Na27 | ER1 | Na29 | Köttigite [6] | |
|---|---|---|---|---|---|---|---|---|
| a, Å | 10.2591(6) | 10.2480 | 10.2657(9) | 10.2657(1) | 10.2669(2) | 10.2458(1) | 10.2567(1) | 10.241(3) |
| b, Å | 13.4091(6) | 13.4249 | 13.4355(8) | 13.4264(2) | 13.4240(2) | 13.4196(1) | 13.4247(2) | 13.405(3) |
| c, Å | 4.7635(6) | 4.7559 | 4.7640(6) | 4.7616(1) | 4.7626(1) | 4.7580(9) | 4.7575(1) | 4.757(2) |
| βo | 105.077(9) | 105.1116 | 105.126(2) | 105.1379(3) | 105.1372(4) | 105.162(2) | 105.1658(4) | 105.21(2) |
| V, Å3 | 632.739(7) | 631.680 | 634.305(7) | 633.519 | 633.627(3) | 631.439(2) | 632.265(2) | 630.168 |
| Co/(Co + Zn) | 1.00 | 0.96 | - | 0.71 | - | 0.60 | 0.35 | 0.15 |
| Co (apfu) | 2.72 (n = 28) | 2.78 | Co >> Zn | 2.04 (n = 75) | Co>Zn | 1.69 (n = 117) | 1.00 (n = 52) | 0.42 |
| Zn (apfu] | 0.01 (n = 28) | 0.11 | 0.83 (n = 75) | 1.11 (n = 117) | 1.87 (n = 52) | 2.44 |
Number of Co and Zn ions in samples from Miedzianka calculated as an average of n analyses. Lack of quantitative chemical data is for samples in which Co and Zn contents were qualitatively estimated from their EDS spectra.
© 2020 by the authors. Licensee MDPI, Basel, Switzerland. This article is an open access article distributed under the terms and conditions of the Creative Commons Attribution (CC BY) license (http://creativecommons.org/licenses/by/4.0/).
Share and Cite
MDPI and ACS Style
Ciesielczuk, J.; Dulski, M.; Janeczek, J.; Krzykawski, T.; Kusz, J.; Szełęg, E. Crystal Chemistry of an Erythrite-Köttigite Solid Solution (Co3–xZnx) (AsO4)2·8H2O. Minerals 2020, 10, 548. https://doi.org/10.3390/min10060548
AMA Style
Ciesielczuk J, Dulski M, Janeczek J, Krzykawski T, Kusz J, Szełęg E. Crystal Chemistry of an Erythrite-Köttigite Solid Solution (Co3–xZnx) (AsO4)2·8H2O. Minerals. 2020; 10(6):548. https://doi.org/10.3390/min10060548
Chicago/Turabian StyleCiesielczuk, Justyna, Mateusz Dulski, Janusz Janeczek, Tomasz Krzykawski, Joachim Kusz, and Eligiusz Szełęg. 2020. "Crystal Chemistry of an Erythrite-Köttigite Solid Solution (Co3–xZnx) (AsO4)2·8H2O" Minerals 10, no. 6: 548. https://doi.org/10.3390/min10060548
Note that from the first issue of 2016, this journal uses article numbers instead of page numbers. See further details here.