1. Introduction
It is crucial to measure the full three-dimensional (3-D) surface displacements caused by underground extraction, to allow for better understanding of the mechanism of mining subsidence and to accurately assess mining-related hazards (e.g., landslides and damage to surface infrastructure). The capability of interferometric synthetic aperture radar (InSAR) techniques to monitor the surface deformation associated with the Earth and/or anthropic activities has been presented in many studies (e.g., [
1,
2,
3,
4,
5,
6,
7,
8,
9,
10,
11]). However, due to the side-looking imaging geometry of the current synthetic aperture radar (SAR) sensors, InSAR observations are one-dimensional (1-D) along the radar’s line-of-sight (LOS) direction, rather than the actual 3-D displacements in the vertical, east, and north directions.
Over the past few decades, several InSAR-based approaches have been developed for measuring the 3-D surface displacements associated with geophysical activities such as earthquakes and volcanic eruptions. These approaches can be roughly divided into three categories: (i) differential InSAR (DInSAR)-based methods (e.g., [
12,
13,
14,
15]); (ii) offset tracking (OT)-based methods (e.g., [
16,
17,
18,
19,
20,
21,
22,
23]); and (iii) multi-aperture InSAR (MAI)-based methods (e.g., [
24,
25]). The strengths and weaknesses of each category have been clearly summarized by Hu et al. [
26]. However, one of the significant limitations of all of these methods is that nearly synchronous SAR images from at least two different imaging geometries (e.g., ascending and descending orbits) are needed. This problem was partially solved in [
27,
28] when looking at rapidly deforming glaciers, but two problems arise if these methods are applied to retrieve 3-D mining-related displacements. Firstly, due to the limited SAR sensors at present, it is difficult to obtain nearly synchronous SAR acquisitions from at least two different imaging geometries over the same mining area. Moreover, if only asynchronous SAR images from two different imaging geometries are available, large errors are most likely to be contained in the estimated 3-D displacements, due to the high nonlinearity of mining-related deformation [
29,
30].
Li et al. [
31] proposed a method for retrieving the 3-D displacements of mining areas from a single InSAR pair (SIP). For the sake of simplicity, we refer to this method as the SIP method hereafter. In the SIP method, two extra constraints are first constructed at each pixel of the mining area with the proportional relationship between the horizontal motion of the mining area and the gradients of the vertical subsidence in the east and north directions [
31,
32,
33]. This stabilizes the under-conditioned system for solving for the 3-D displacements from the 1-D InSAR-derived observations of LOS deformation. The SIP method effectively relaxes the strict requirements on SAR images of the traditional InSAR-based techniques for 3-D displacement retrieval in mining areas.
Nevertheless, one of the limitations of the SIP method is that it is incapable of retrieving 3-D surface displacements in those mining areas characterized by large magnitudes and/or steep gradients of surface deformation. This is primarily because the InSAR techniques that SIP is based on are quite sensitive to phase noise [
34], and require phase unwrapping to determine the actual deformation [
35]. However, large magnitudes and/or steep gradients of surface deformation often cause severe phase decorrelation [
36,
37] and increase the difficulty of accurate phase unwrapping [
35].
Offset tracking (OT) techniques are potentially able to estimate two-dimensional (2-D) large surface deformation in both the LOS and azimuth directions from a single amplitude pair of SAR [
38], due to their low sensitivity to phase noise and unambiguous deformation measurements. In view of this advantage of the OT techniques, we present a method for retrieving 3-D large mining-related displacements from a single amplitude pair (SAP) of SAR. Hereafter, we refer to this method as the OT-SAP method. The OT-SAP method is based on the core idea and procedure of the previous SIP method proposed by Li et al. [
31], but it can estimate large 3-D displacements of mining areas, which the previous SIP method cannot do. Theoretically, 3-D mining-related displacements (no matter what their magnitudes are) can potentially be retrieved using the SIP (for coherent mining areas) or OT-SAP methods (for incoherent mining areas), if the LOS deformation can be measured from the two co-registered SAR images with InSAR or OT techniques. This significantly widens the application scope of SAR in mining areas. In this paper, real SAR data from the Daliuta coal mining area in China are used to validate the OT-SAP method.
2. Methodology
2.1. Brief Summary of Offset Tracking of SAR Amplitude Images
The OT techniques are potentially capable of obtaining 2-D surface deformation in the LOS and azimuth directions by means of tracking the local position changes (i.e., offsets) of two SAR amplitude images using normalized cross-correlation optimization (see [
38,
39] for more details). Generally speaking, the OT-estimated 2-D offsets are made up of a “global” component resulting from the different imaging geometries of SAR images, and a “local” component due to surface deformation and error sources (e.g., noise, mismatching of amplitude images, and ionospheric effects) [
40,
41]. The general OT procedure first removes the global component using a bilinear equation [
42]. Different strategies (e.g., high-pass filtering [
41,
43]) can then be applied to mitigate the error offsets in the local component. Finally, the remaining offsets are transformed into surface deformation, in accordance with the spatial resolution of the SAR images.
It should be pointed out that the accurate retrieval of surface deformation from the local offsets, to a large extent, depends on the magnitude of the surface deformation itself and the spatial resolution of the used SAR data, in addition to the search parameters of the OT procedures. Once the magnitude of the surface deformation is smaller than the achievable accuracy of the OT techniques (which is usually on the order of 1/10–1/20 of the pixel size [
39]), the erroneous offsets will dominate the local offsets and completely mask the deformation offsets. In this case, the OT techniques will fail to retrieve the surface deformation from the SAR images. In other words, large errors are contained in the OT-measured surface deformation, even though the remaining local offsets after the mitigation of the error offsets are compulsorily transformed into surface deformation.
There is a high probability that erroneous offsets along the azimuth direction will dominate the local offsets in mining areas. This is quite common for SAR data with a medium spatial resolution (i.e., from several meters to dozens of meters), such as the images acquired with the Phased Array type L-band Synthetic Aperture Radar (PALSAR)-1 and Advanced Synthetic Aperture Radar (ASAR) sensors, and the StripMap or ScanSAR modes of the TerraSAR-X, COSMO-SkyMed, and PALSAR-2 sensors. The dominant error source in the azimuth direction is mainly due to the following; mining-induced surface deformation is dominated by vertical subsidence, and the components in the east and north directions are generally much smaller than the vertical component, particularly in the central portion of a mining-induced deformation basin [
32,
44]. Given that the LOS deformation is also dominated by vertical subsidence [
26], mining-related LOS deformation is usually much larger than the azimuth deformation. This causes a much higher possibility of the error offsets masking the azimuth deformation than in the LOS deformation, for SAR data with a nearly equal range and azimuth resolution. Hence, the presented OT-SAP method only applies OT-derived LOS deformation, rather than LOS and azimuth deformation together, to estimate the 3-D mining-related displacements.
2.2. Overview of the SIP Method
Due to the side-looking imaging geometry of the current SAR sensors, the deformation in the LOS
direction is actually the projection of the 3-D surface displacements in the vertical
, east
, and north
directions, according to the following equation [
26,
45]:
where
and
are the incidence and heading angles (positive with clockwise from north) of the SAR sensor, respectively.
The horizontal motions caused by underground extraction are approximately proportional to the gradients of the vertical subsidence in the corresponding direction [
32,
46]. This can offer extra constraints to stabilize the under-conditioned system for solving 3-D surface displacements from a single InSAR-derived observation of LOS deformation. For a surface point
affected by underground extraction, its 2-D horizontal motions in the east
and north directions
can be approximately expressed as follows, in accordance with the proportional relationship [
31]:
where
CE(
i,
j) =
b·
H(
i,
j)/(tan
β·
RE) and
CN(
i,
j) =
b·
H(
i,
j)/(tan
β·
RN [
31];
b and
β are the horizontal motion constant and the major influence angle of mining in the mining area; and
H is the mining depth.
RE and
RN are the spatial spacing of the InSAR-derived LOS deformation map in the east and north directions, respectively.
Substituting Equation (2) into Equation (1), we obtain:
with
C2(
i,
j) = −
CE(
i,
j)·sin
θ·sin(
α − 3
π/2),
C3(
i,
j) = −
CN(
i,
j)·sin
θ·cos(
α − 3
π/2), and
C3(
i,
j) = cos
θ −
C2(
i,
j) −
C3(
i,
j).
Mining-related deformation is dominated by the vertical component, and the pixels in the last row and column of a region of interest (ROI) (e.g., the mining area in this study) are generally beyond the mining-related deformation basin. Thus, we can safely assume that the horizontal displacements of these pixels in the last row and column of the ROI are all zeros, i.e.,
(
or
) [
31], where
and
are the size of the ROI. Thus, the observation system between the LOS deformation
and the vertical subsidence
(
) of the ROI can be constructed in a matrix notation based on Equation (3), i.e.,
with
Since the coefficient matrix of the observation system in Equation (4) is an upper triangular matrix, a back-substitution procedure is utilized to solve the vertical subsidence in the SIP method [
31], i.e.,
Having solved for the vertical subsidence
(
), the 2-D horizontal motions in the east
and north directions
can be estimated with Equation (2), i.e.,
with
2.3. Procedure of the OT-SAP Method
The OT-SAP method is based on the core idea of the previous SIP method, and thus its rationale and procedure for retrieving 3-D mining-related displacements from a single SAR amplitude image pair are nearly the same as the SIP method. There are two major differences between the methods. Firstly, the observations of large LOS deformation are measured with the OT technique in the OT-SAP method, instead of the InSAR technique in the SIP method. Secondly, OT-SAP applies a truncated singular value decomposition (SVD) algorithm [
47], rather than the inverse operation in the SIP method, to estimate the pseudoinverse matrix
of the coefficient matrix
(
) in Equation (5), to accurately solve for the vertical subsidence. That is,
(
), where
and
are two unitary matrices, and
is a rectangular diagonal matrix. We then truncate those singular values (i.e., the diagonal elements of
) that are less than a given threshold (i.e., 0.01 in this study).
Solving the vertical subsidence with the SVD-estimated pseudoinverse matrix
, instead of the inverse matrix
in the SIP method, can bring some benefits. First of all, the elements of matrix
depend on some of the geomining parameters of the mining area and the geometric parameters of the deformation maps (i.e.,
,
,
,
,
,
, and
). These parameters are fixed in each pixel of the ROI in the mining area, once the SAR images are selected and the processing parameters of the OT procedure are set. This implies that the coefficient matrix
is likely to be ill-conditioned, in some cases. Unfortunately, it can be expected that large errors will be contained in the estimates of the 3-D surface displacements, if the inverse matrix of the ill-conditioned coefficient matrix
is applied to estimate the 3-D surface displacements. However, for a well-conditioned matrix
, the pseudoinverse matrix
is nearly equivalent to the inverse matrix
, and the 3-D displacements solved with
and
should also be equivalent. Conversely, using the pseudoinverse matrix
performs much better than the unconditional inverse operation
in solving for the 3-D displacements for the ill-conditioned matrix
[
47].
It should be pointed out that the implementation of the OT-SAP and SIP methods requires some of the geomining parameters of the mining area, i.e., the horizontal motion constant , the major influence angle of the mining , and the mining depth . This, to some extent, limits the practical application of the OT-SAP and SIP methods, as these three parameters, especially the mining depth , are often unknown.
3. Study Area and SAR Data
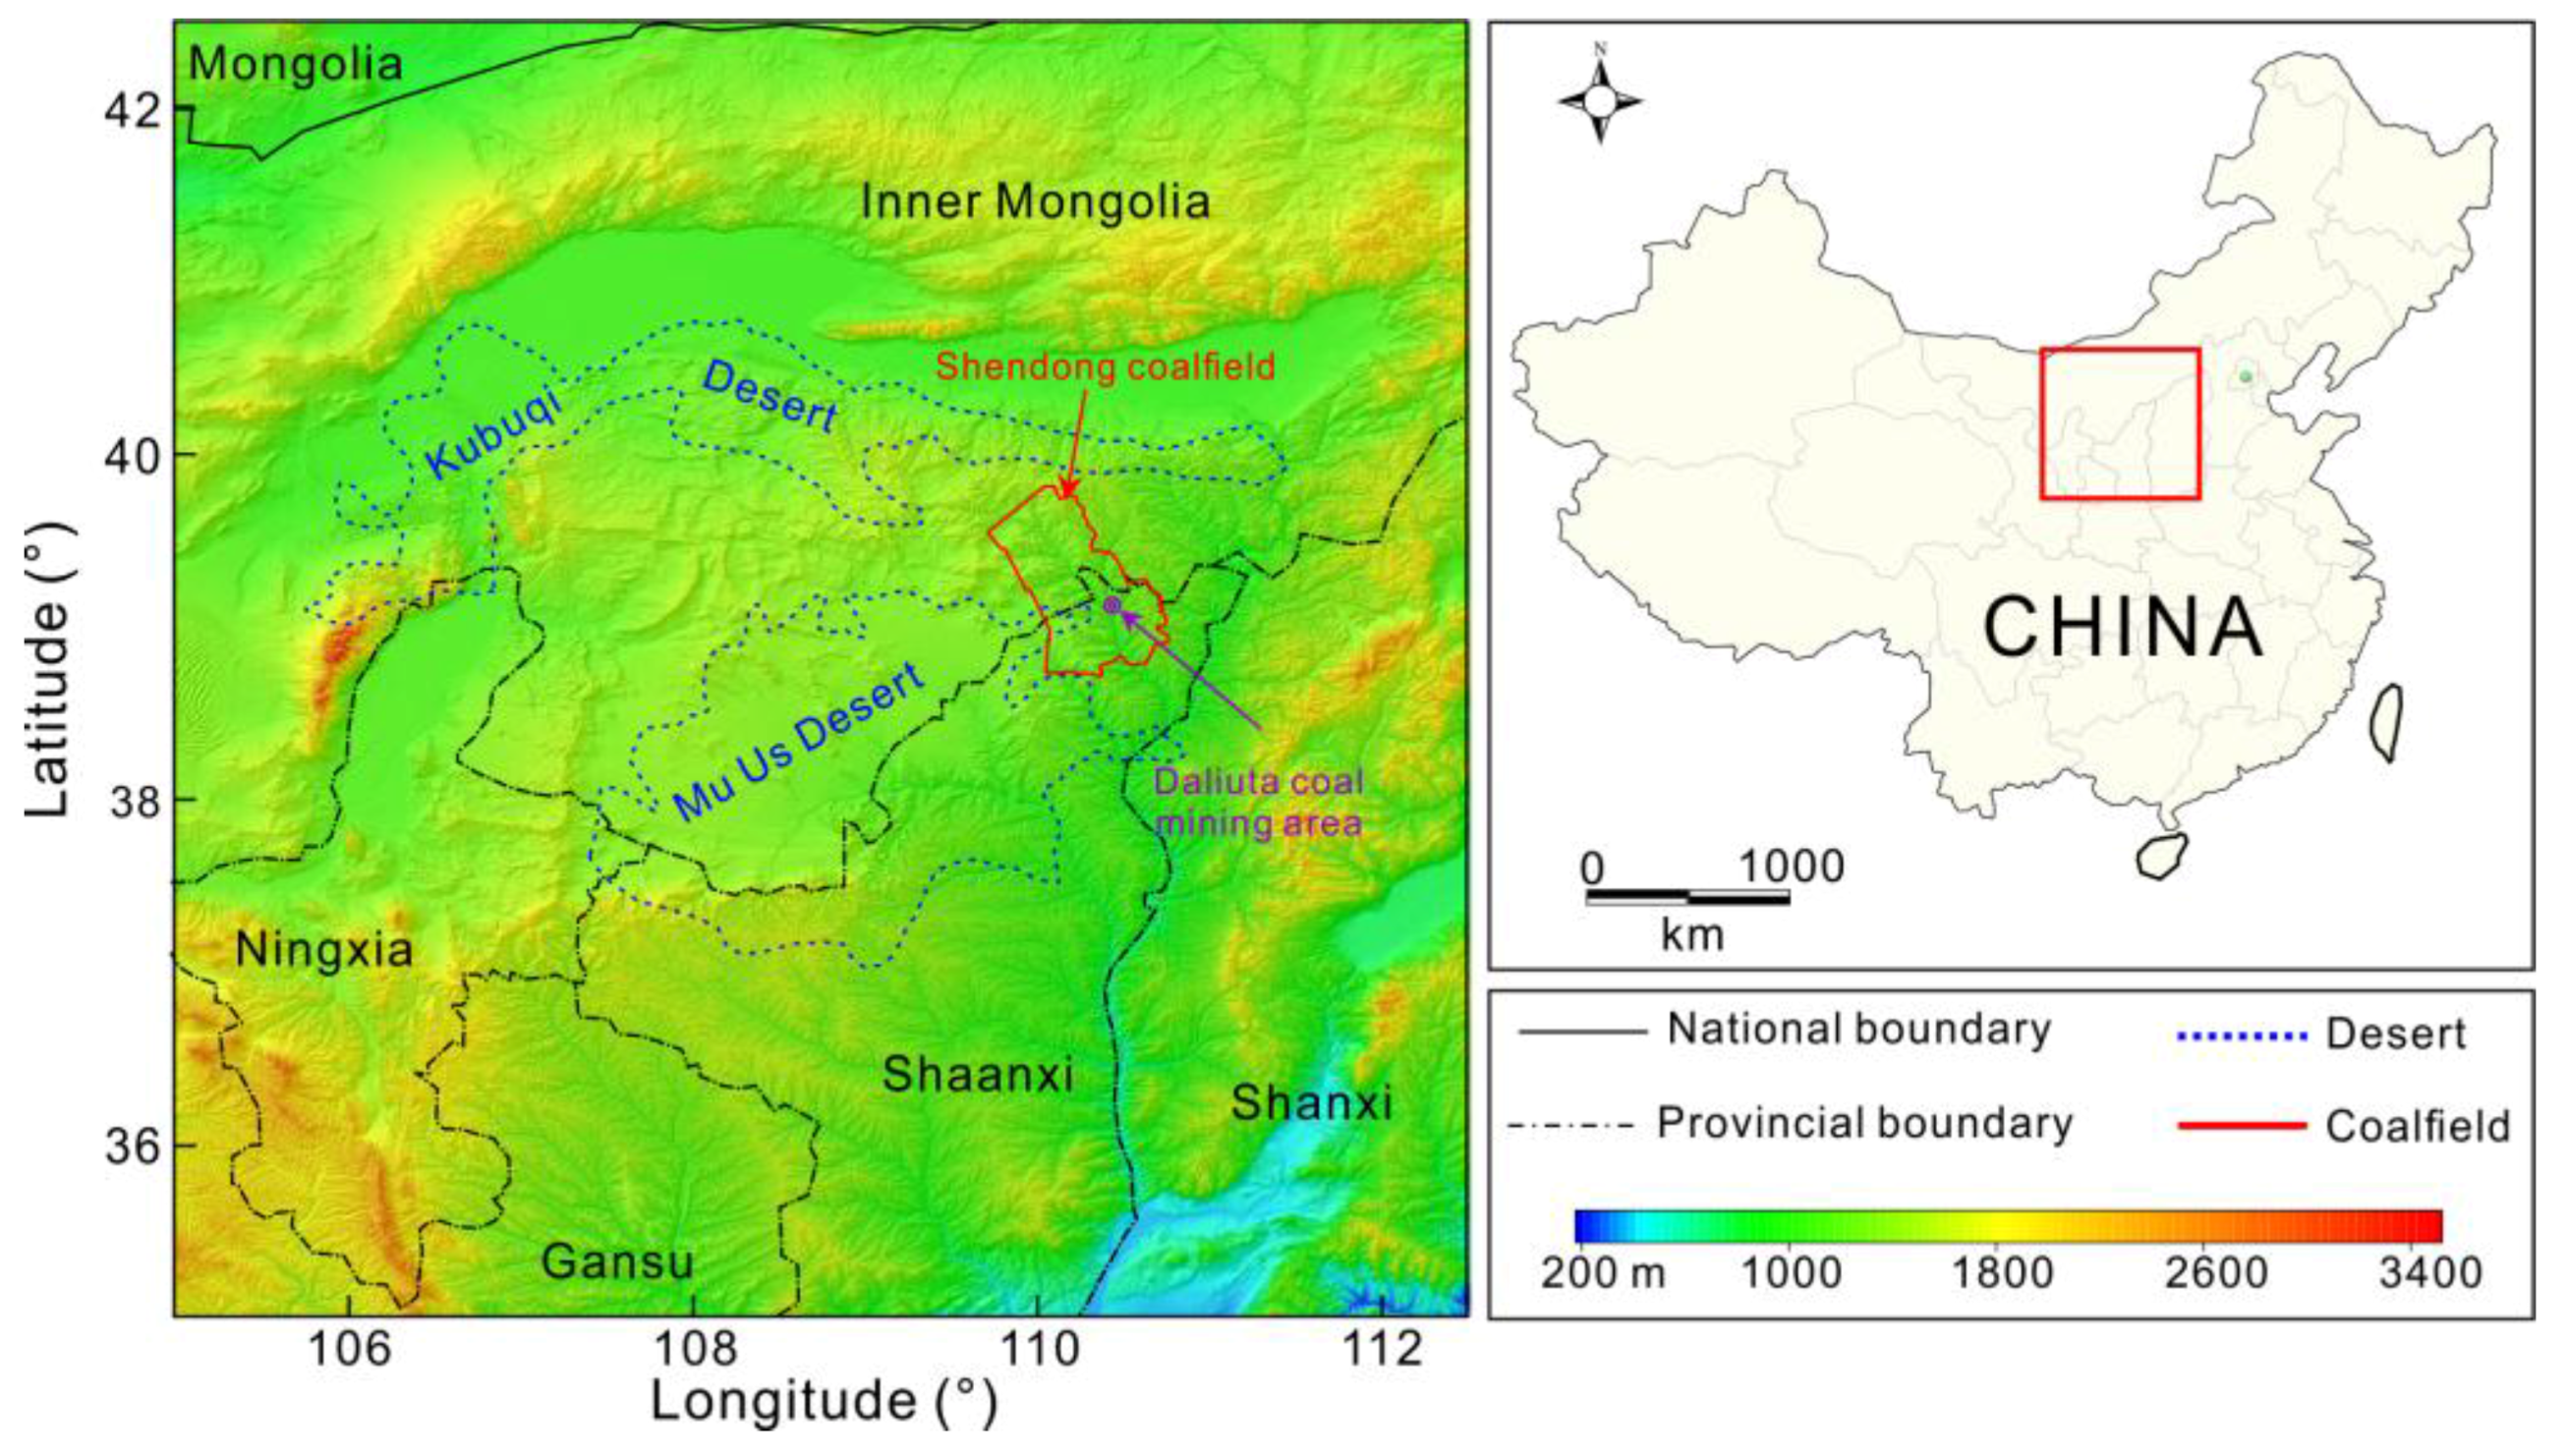
The Shendong coalfield (marked by the red line in the left panel of
Figure 1), which is one of the largest coalfields in the world, is located at the border of the Shaanxi province and the Inner Mongolia Autonomous Region in China. This coalfield is surrounded by the Hubuqi and Mu Us deserts (see the blue dashed lines in
Figure 1) and it has a semi-arid climate with an average annual precipitation of about 400 mm. As a consequence, water resources are rather scarce in this region. Additionally, most of the underground mining activities in this coalfield have taken place at shallow depths (less than 300 m mining depth) in thick (several or dozens of meters) coal seams, resulting in large deformations in the overlying rock strata and at the surface. This has given rise to some severe natural hazards and environmental problems. For example, the deformation in the overlying rock strata has damaged underground water aquifers, causing considerable water loss and ecological aggravation [
48,
49]. Moreover, ground deformation has damaged surface infrastructure and triggered landslides in this region, leading to economic loss and threatening human lives. Thus, it is crucial to retrieve the 3-D mining-related displacements, in order to accurately assess and effectively control the mining-related environmental problems and hazards in this coalfield.
Due to the large magnitude and relatively steep gradients of the surface deformation in this coalfield, the traditional InSAR techniques would often fail, especially in the central portion of the subsidence basin. The SAR amplitude OT technique is an alternative to the general InSAR technique. In 2013, Zhao et al. [
50] applied the OT procedure to generate the cumulative LOS deformation in the Bulianta and Shangwan coal mining areas of the Shendong coalfield from PALSAR-1 images. Following this, Chen et al. [
51] and Fan et al. [
52] both combined the OT procedure and the small baseline subset (SBAS)-InSAR procedure to retrieve the time-series LOS deformation in the Daliuta coal mining area (marked by the purple circle in
Figure 1) of the Shendong coalfield from high resolution TerraSAR-X data. However, only 1-D surface LOS deformation, rather than the full 3-D displacement, was detected in these studies, which significantly hampers the accurate assessment of the mining-induced hazards and mining-related damage to infrastructure [
33]. In this study, we selected the Daliuta coal mining area to test the proposed OT-SAP method.
Three TerraSAR-X images acquired in the high-resolution SpotLight mode on 21 November 2012, 6 February 2013, and 2 April 2013 were selected to generate three SAR amplitude image pairs (their parameters are listed in
Table 1), to test the reliability of the OT-SAP method. Since the OT technique is based on SAR amplitude information, temporal variations in the SAR amplitude images (e.g., resulting from changes of near-surface moisture, surface cover, and other environmental factors) decrease the accuracy of the OT-derived deformation. In this study, these three TerraSAR-X images were acquired in the winter of 2012 and the spring of 2013, respectively, and it was sunny in the weeks before the acquisition times of the three SAR images. This, to some extent, reduces the temporal changes of the SAR amplitude images. In addition, the perpendicular and parallel baselines of these three SAR amplitude image pairs vary from −11.7 m to −79.2 m (see
Table 1), decreasing the offset components associated with the topography [
53].
4. Results
4.1. LOS Deformation Measurements
The OT package of the GAMMA software [
54] was used to derive the LOS deformation maps from the three generated SAR amplitude image pairs. We set the search window size and search step of the OT procedure as 140-by-140 pixels and 2-by-3 pixels in the range and azimuth directions, respectively. In addition, an over-sampling factor of 2 and a signal-to-noise ratio (SNR) threshold of 4.0 were designated.
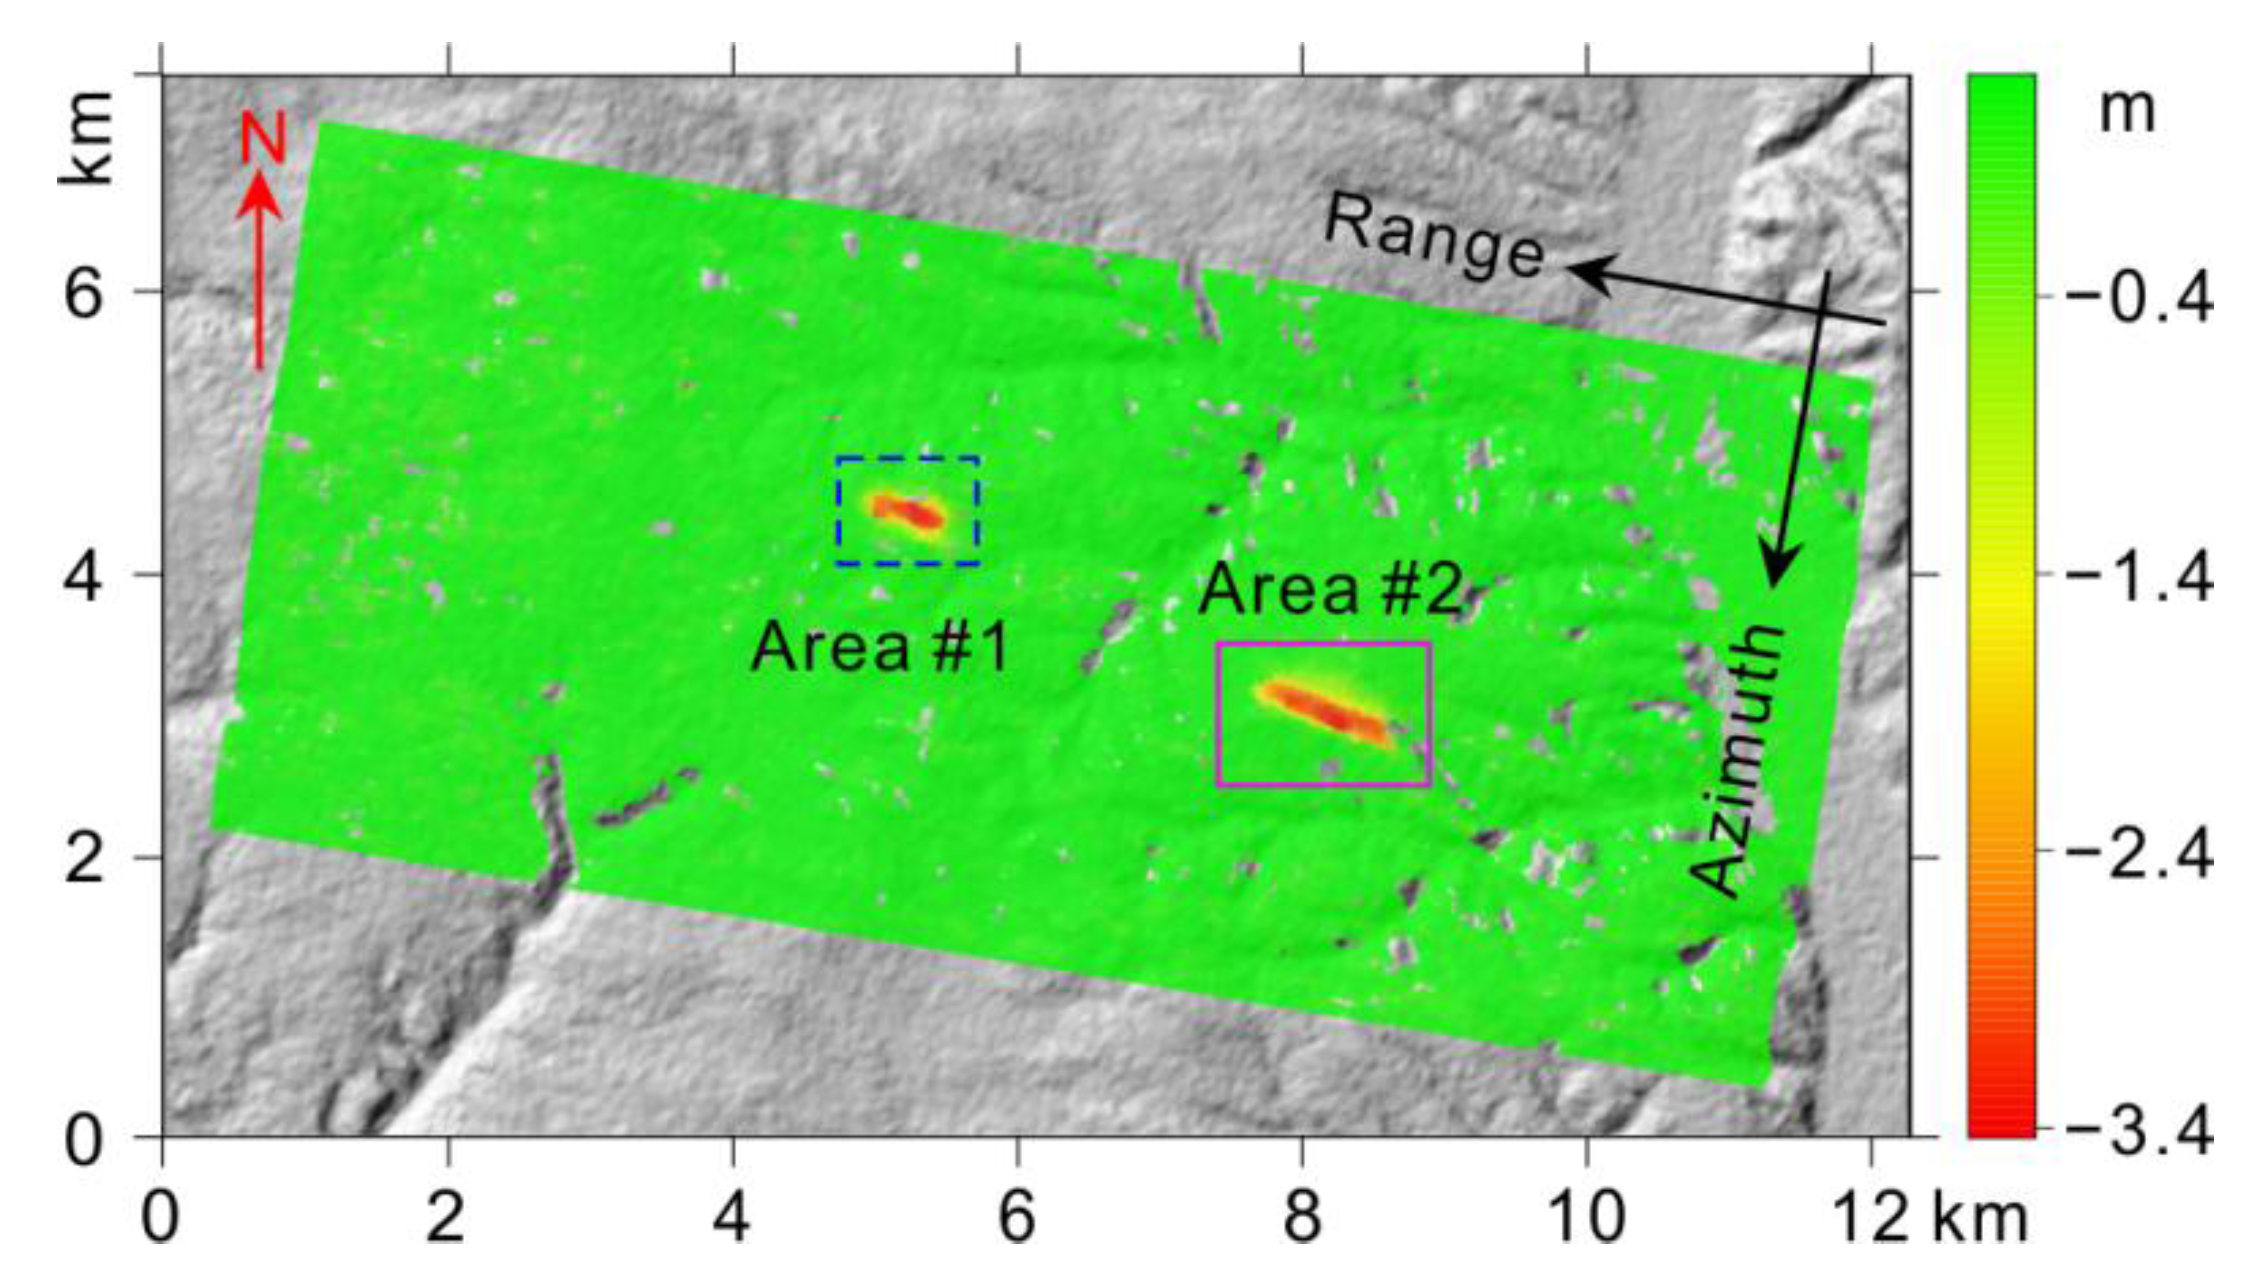
Figure 2 depicts the OT-derived LOS deformation map from SAR amplitude image pair No. 3 (i.e., 20121121–20130402, see
Table 1). About 0.5% of the total offsets are rejected (see the null values within the image in
Figure 2) by setting the SNR threshold to 4.0.
As can be seen, two obvious deformation basins caused by the underground mining occurred in Areas #1 and #2 (marked by the purple solid and blue dashed rectangles, respectively) of the Daliuta coal mining area from 21 November 2012 to 2 April 2013. Theoretically, the 3-D surface displacements in Areas #1 and #2 can both be potentially retrieved from the OT-derived LOS deformation observations using the proposed OT-SAP method. However, the absence of the underground geomining parameters in Area #2 hinders the retrieval of the 3-D mining-induced displacements. Consequently, we only set Area #1 as the ROI to test the OT-SAP method.
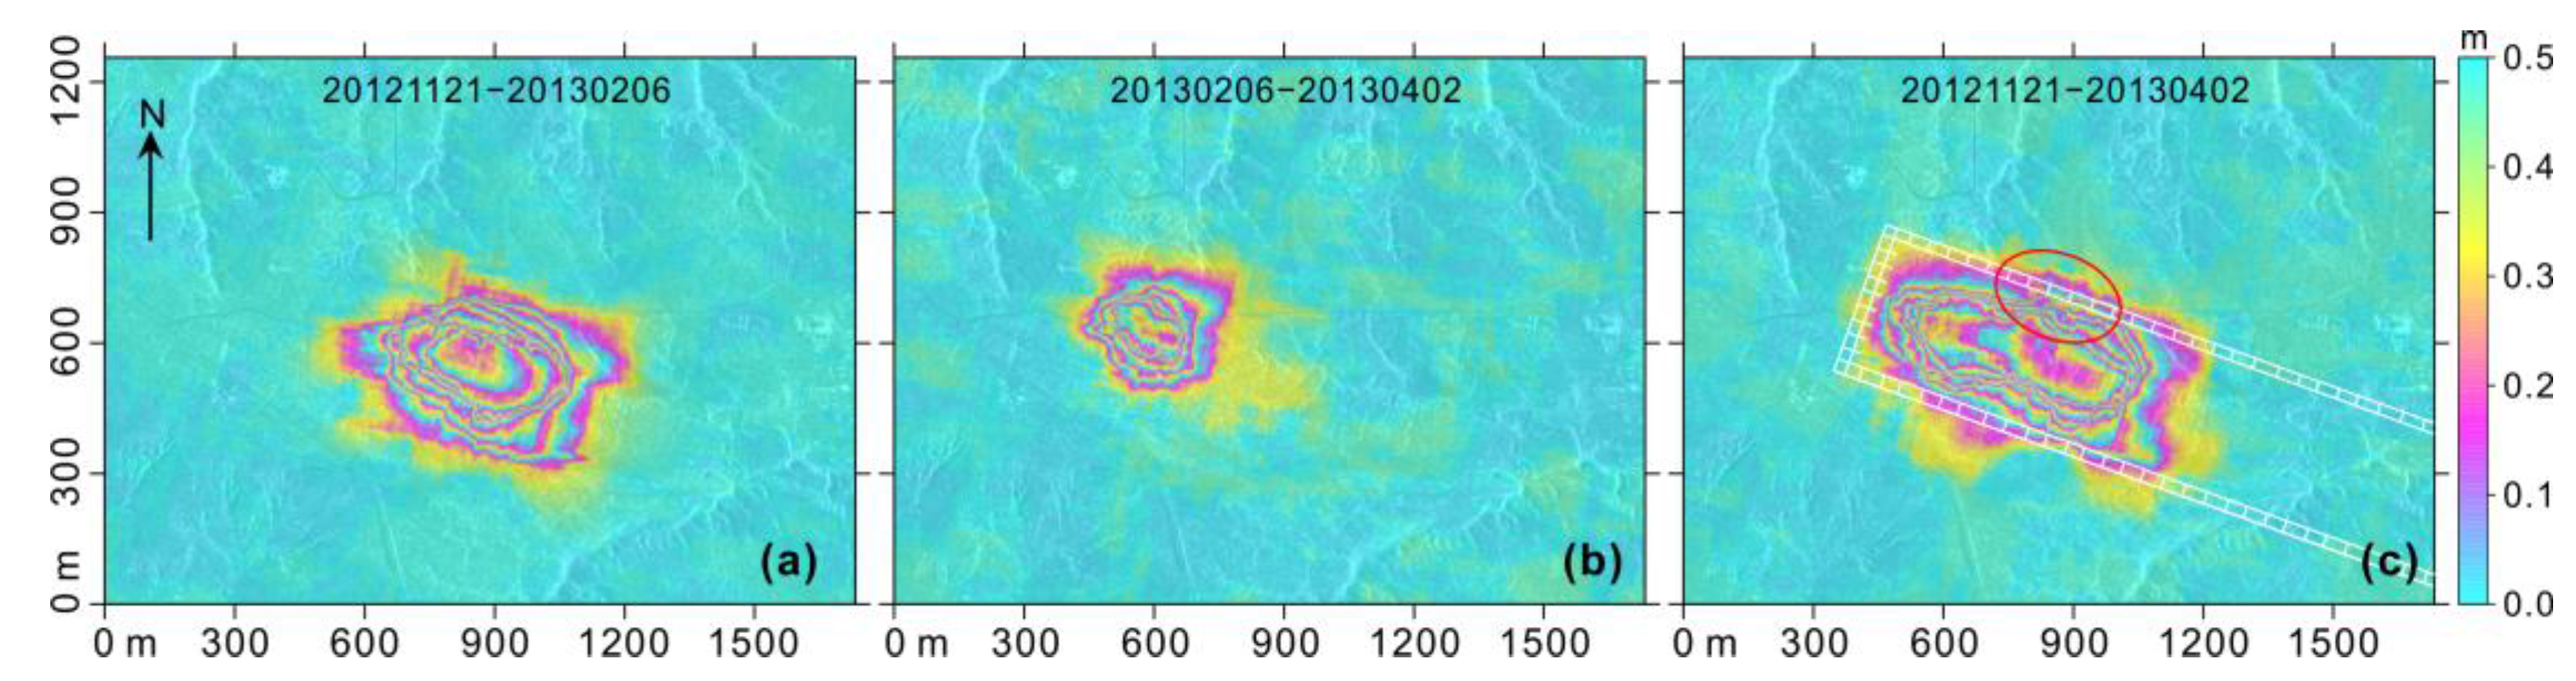
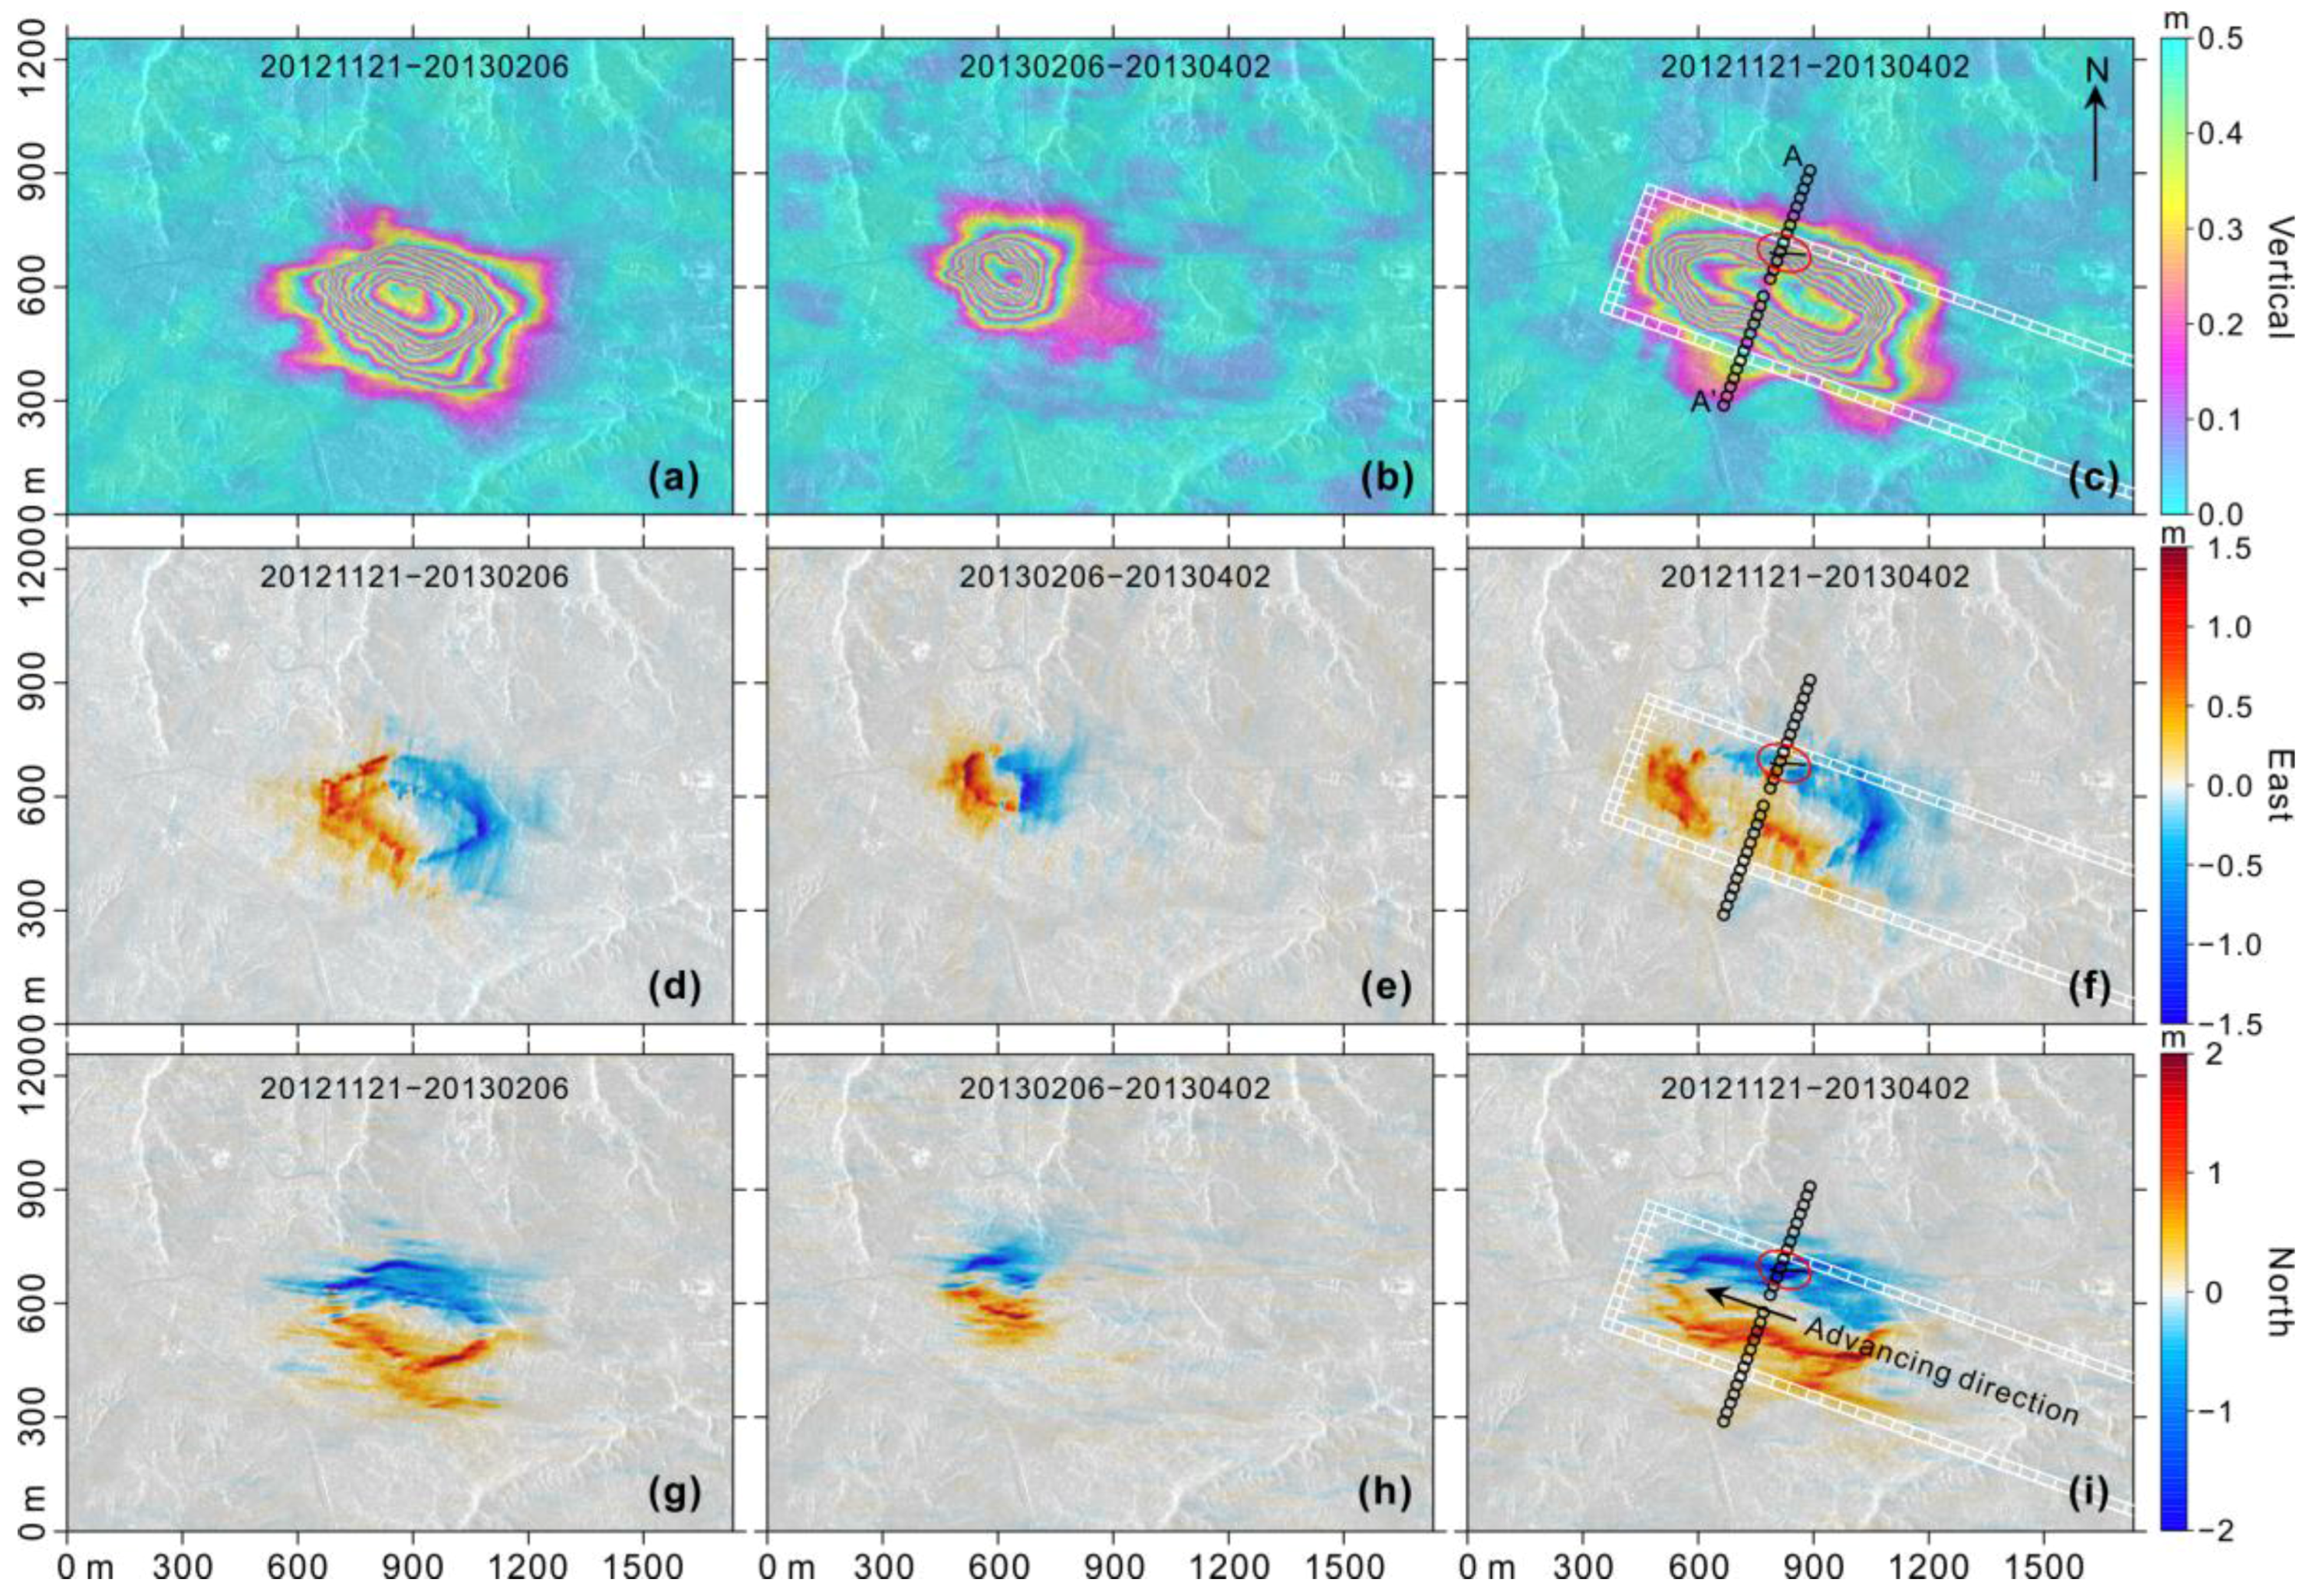
Prior to estimating the 3-D surface displacements in Area #1, the LOS deformation over those pixels with SNR values smaller than 4.0 was interpolated by the inverse distance weighting (IDW) algorithm. The interpolated LOS deformation maps of Area #1 derived from the amplitude image pairs Nos. 1–3 (see
Table 1) are shown in
Figure 3a–c, respectively.
4.2. Estimates of 3-D Surface Displacements
4.2.1. Vertical Subsidence
A nearly horizontal (mean dip angle of about 2°) working panel (see the white lines in
Figure 3c) was operated at a mining depth of about 235 m (i.e.,
) in Area #1 from 21 November 2012 to 2 April 2013, in accordance with the in-situ geomining measurements [
55]. The mean tangent of the major influence angle and the horizontal motion constant in this coal mining area are about 2.25 and 0.24, respectively, i.e.,
and
[
55]. The incidence angle and tracking angle of the used TerraSAR-X images are about 42.4° and 189.5°, i.e.,
and
. The spatial spacing of the geocoded LOS deformation maps is 2.59 m and 2.16 m in the north and east directions, respectively, i.e.,
and
.
Having obtained these parameters and the measurements of the LOS deformation of the ROI, the observation system for solving the vertical subsidence can be constructed based on Equation (4). In the established observation system, the condition number of matrix
is about
. This means that matrix
is singular, which can be expected to result in wrongly estimated 3-D displacements or the failure to obtain a displacement solution when the standard inverse operation of the SIP method is applied. Therefore, truncated SVD was applied to solve for the vertical subsidence of the ROI in this study, based on the established observation system (see
Section 2.3).
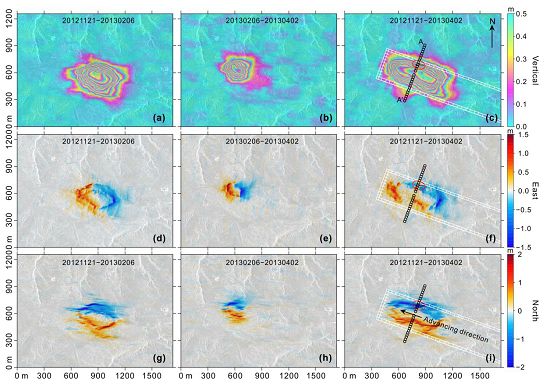
Figure 4a–c show the solved vertical subsidence of the ROI from the three generated SAR amplitude image pairs, respectively. As can be seen, the maximum vertical subsidence caused by the underground extraction in this mining area reached 4.31 m from 21 November 2012 to 2 April 2013.
4.2.2. Horizontal Motions in the East and North Directions
Having solved the vertical subsidence in Area #1, the 2-D horizontal motions in the north and east directions were estimated based on Equation (6). The results are shown in
Figure 4d–i, respectively. As can be seen, the maximum horizontal motions in the east and north directions were over 1.5 m and 2 m, respectively. However, abnormally high horizontal motions were estimated in the area with a known ground fissure (marked by the red ellipse in
Figure 4c) [
55]. Due to the errors in the LOS deformation observations and the unreliability of the processing scheme in treating ground fissures, it is believed that large errors are likely to be contained in the estimated 3-D displacements in the area marked by the red ellipse in
Figure 4c. We clarify this issue in
Section 5. If we reject these unreliable horizontal displacements, the maximum deformation in the east and north directions reached about 1.1 m and 1.3 m, respectively.
4.3. Accuracy Evaluation
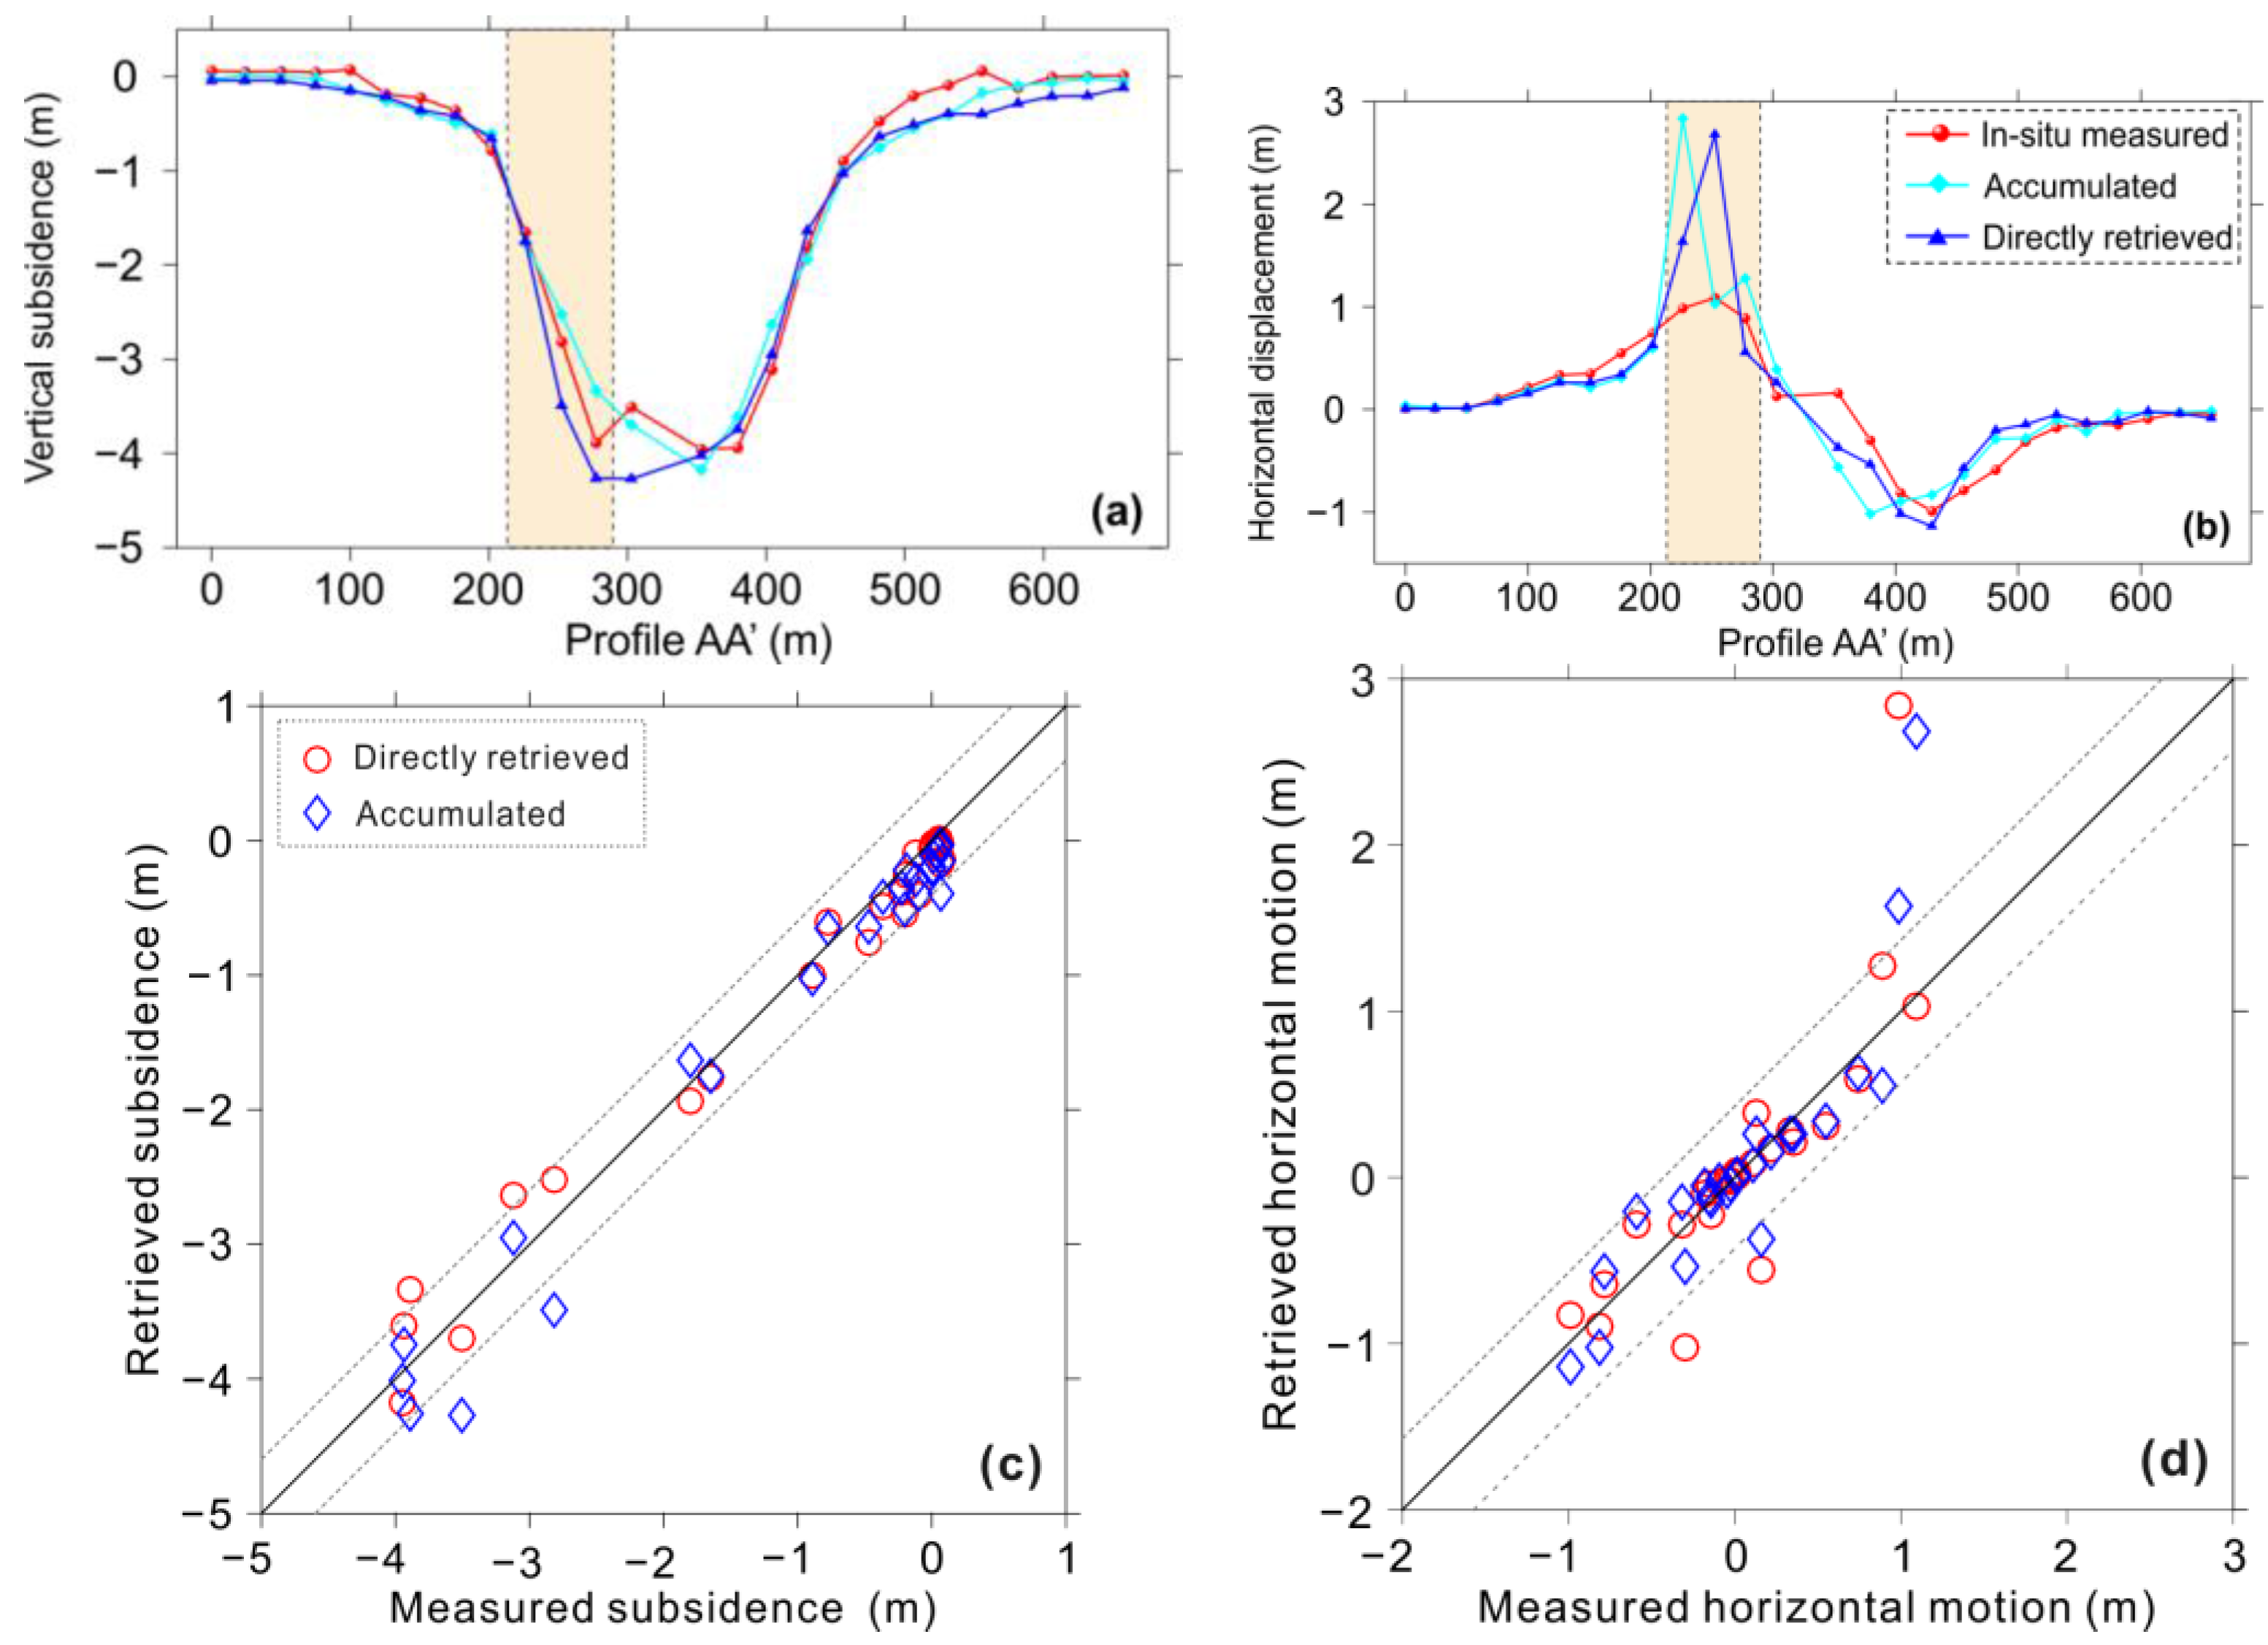
The in-situ GPS measurements of the mining-induced vertical subsidence and horizontal motions at 26 surface observation points (see the black circles in
Figure 4) from 21 November 2012 to 1 April 2013 were presented by Liu [
55] and Zhao [
56]. In these measurements, the observations of the horizontal motions were generated by synthesizing the 2-D horizontal motions in the east and north directions. This allows us to quantitatively evaluate the accuracies of the estimated 3-D displacements, because the in-situ GPS measurements are nearly synchronous with the estimated ones (by less than one day). To this end, we first gathered the 3-D displacements derived from the SAR amplitude image pairs No. 1 (i.e., 20121221–20130206, see
Figure 4a,d,g) and 2 (i.e., 20130206–20130402, see
Figure 4b,e,h). (For the sake of simplicity, we refer to the generated 3-D displacements as the
accumulated 3-D displacements hereafter.) We then synthesized the accumulated 2-D horizontal motions in the east and north directions. Finally, we compared the accumulated vertical subsidence and horizontal motions with the in-situ GPS measurements. The results are plotted in
Figure 5. Similarly, the 3-D horizontal motions directly retrieved from SAR amplitude image pair No. 3 (i.e., 20121221–20130402, see
Figure 4c,f,i) (called
directly retrieved 3-D displacements hereafter) were also compared with the in-situ GPS measurements. The results are also plotted in
Figure 5, to allow for a comparison.
As can be seen, the accumulated (cyan diamonds) and the directly retrieved (blue line) vertical subsidence are roughly consistent with the in-situ measured values (red circles), with a mean root-mean-square error (RMSE) of about 0.227 m. In addition, the accumulated and the directly retrieved horizontal motions are also in approximate agreement with the in-situ GPS measurements, except for the three observation points marked by the yellow shaded box in
Figure 5b. The mean RMSE of the estimated horizontal motions over all of the observation points is approximately 0.415 m.
It can also be seen in
Figure 4 that the three observation points with large discrepancies (over 1.5 m) are all located in the area where a significant ground fissure is found (see the black line in
Figure 4c). As stated previously, two factors may have caused these large discrepancies at these three observation points. Firstly, the errors of the OT-derived LOS deformation observations caused by the error sources of the OT procedure and/or the interpolation operation of the LOS deformation will propagate to the estimated 3-D displacements. Secondly, ground fissures can lead to unreliability of the proportional relationship (i.e., Equation (2)) [
31,
57], causing large errors in the estimated 3-D displacements. We clarify the influences of these two factors on the estimated 3-D displacements in
Section 5. If we do not take these three observation points marked by the yellow box in
Figure 5 into account, the RMSEs of the estimated displacements in the vertical and horizontal directions are about 0.201 m and 0.214 m, respectively.
We also estimated the 3-D displacements from the three SAR amplitude image pairs using the matrix inversion of the previous SIP method (see
Section 2.1), in order to demonstrate the improvement achieved by SVD for the ill-conditioned coefficient matrices. The comparison with the in-situ GPS measurements shows that the RMSEs of the 3-D displacements estimated by the matrix inversion are about 1.5 × 10
94 m and 3.3 × 10
95 m in the horizontal and vertical directions, respectively. These values are much larger than the accuracies estimated by SVD in OT-SAP (about 0.201 m and 0.214 m, respectively). These results indicate that SVD performs much better than matrix inversion for ill-conditioned coefficient matrices.
5. Error Analysis of the OT-SAP Method
The core idea behind the proposed OT-SAP method is constructing two extra constraints with the proportional relationship, thereby stabilizing the under-conditioned system for fully solving for the 3-D displacements from the OT-derived 1-D LOS deformation. Theoretically, the accuracies of the 3-D displacements estimated by the OT-SAP method primarily depend on two factors, i.e., the accuracy of the OT-derived LOS deformation observations and the reliability (or model error) of the proportional relationship. In this section, we analyze the effects of these two factors on the estimated 3-D displacements.
5.1. Error Influence of the LOS Deformation Observations
5.1.1. Theoretical Error Propagation
Assuming that the OT-derived observations of the LOS deformation are mutually independent, then the errors of the estimated 3-D displacements due to the inaccuracies in the LOS deformation observations can be theoretically deduced in accordance with the principle of error propagation, i.e.,
where
,
,
, and
are the variances of the LOS deformation measurements and the estimated 3-D displacements at the
kth row of the ROI (
).
5.1.2. Simulation-Based Impact Analysis
A simulated experiment was carried out to intuitively demonstrate the error propagation of the OT-derived LOS deformation to the estimated 3-D displacements. To this end, we first simulated the error of the OT-derived LOS deformation based on its corresponding SNR value. According to Bamler and Eineder [
58], the theoretical standard deviation (STD) of the offset measurements derived by the coherent cross-correlation methods is given by:
where
N is the number of pixels within the search window, and
γ is the coherence value. The OT package of the GAMMA software provides SNR values as indicators of the estimated offset measurements. Actually, the relationship between the GAMMA-provided SNR value and the coherence is not straightforward [
59]. However, we can simply scale the SNR to coherence, as done by Raucoules, de Michele, Malet, and Ulrich [
59], because we just focus on the error propagation of the LOS deformation to the estimated 3-D displacements in this section, instead of the error magnitude of the LOS deformation.
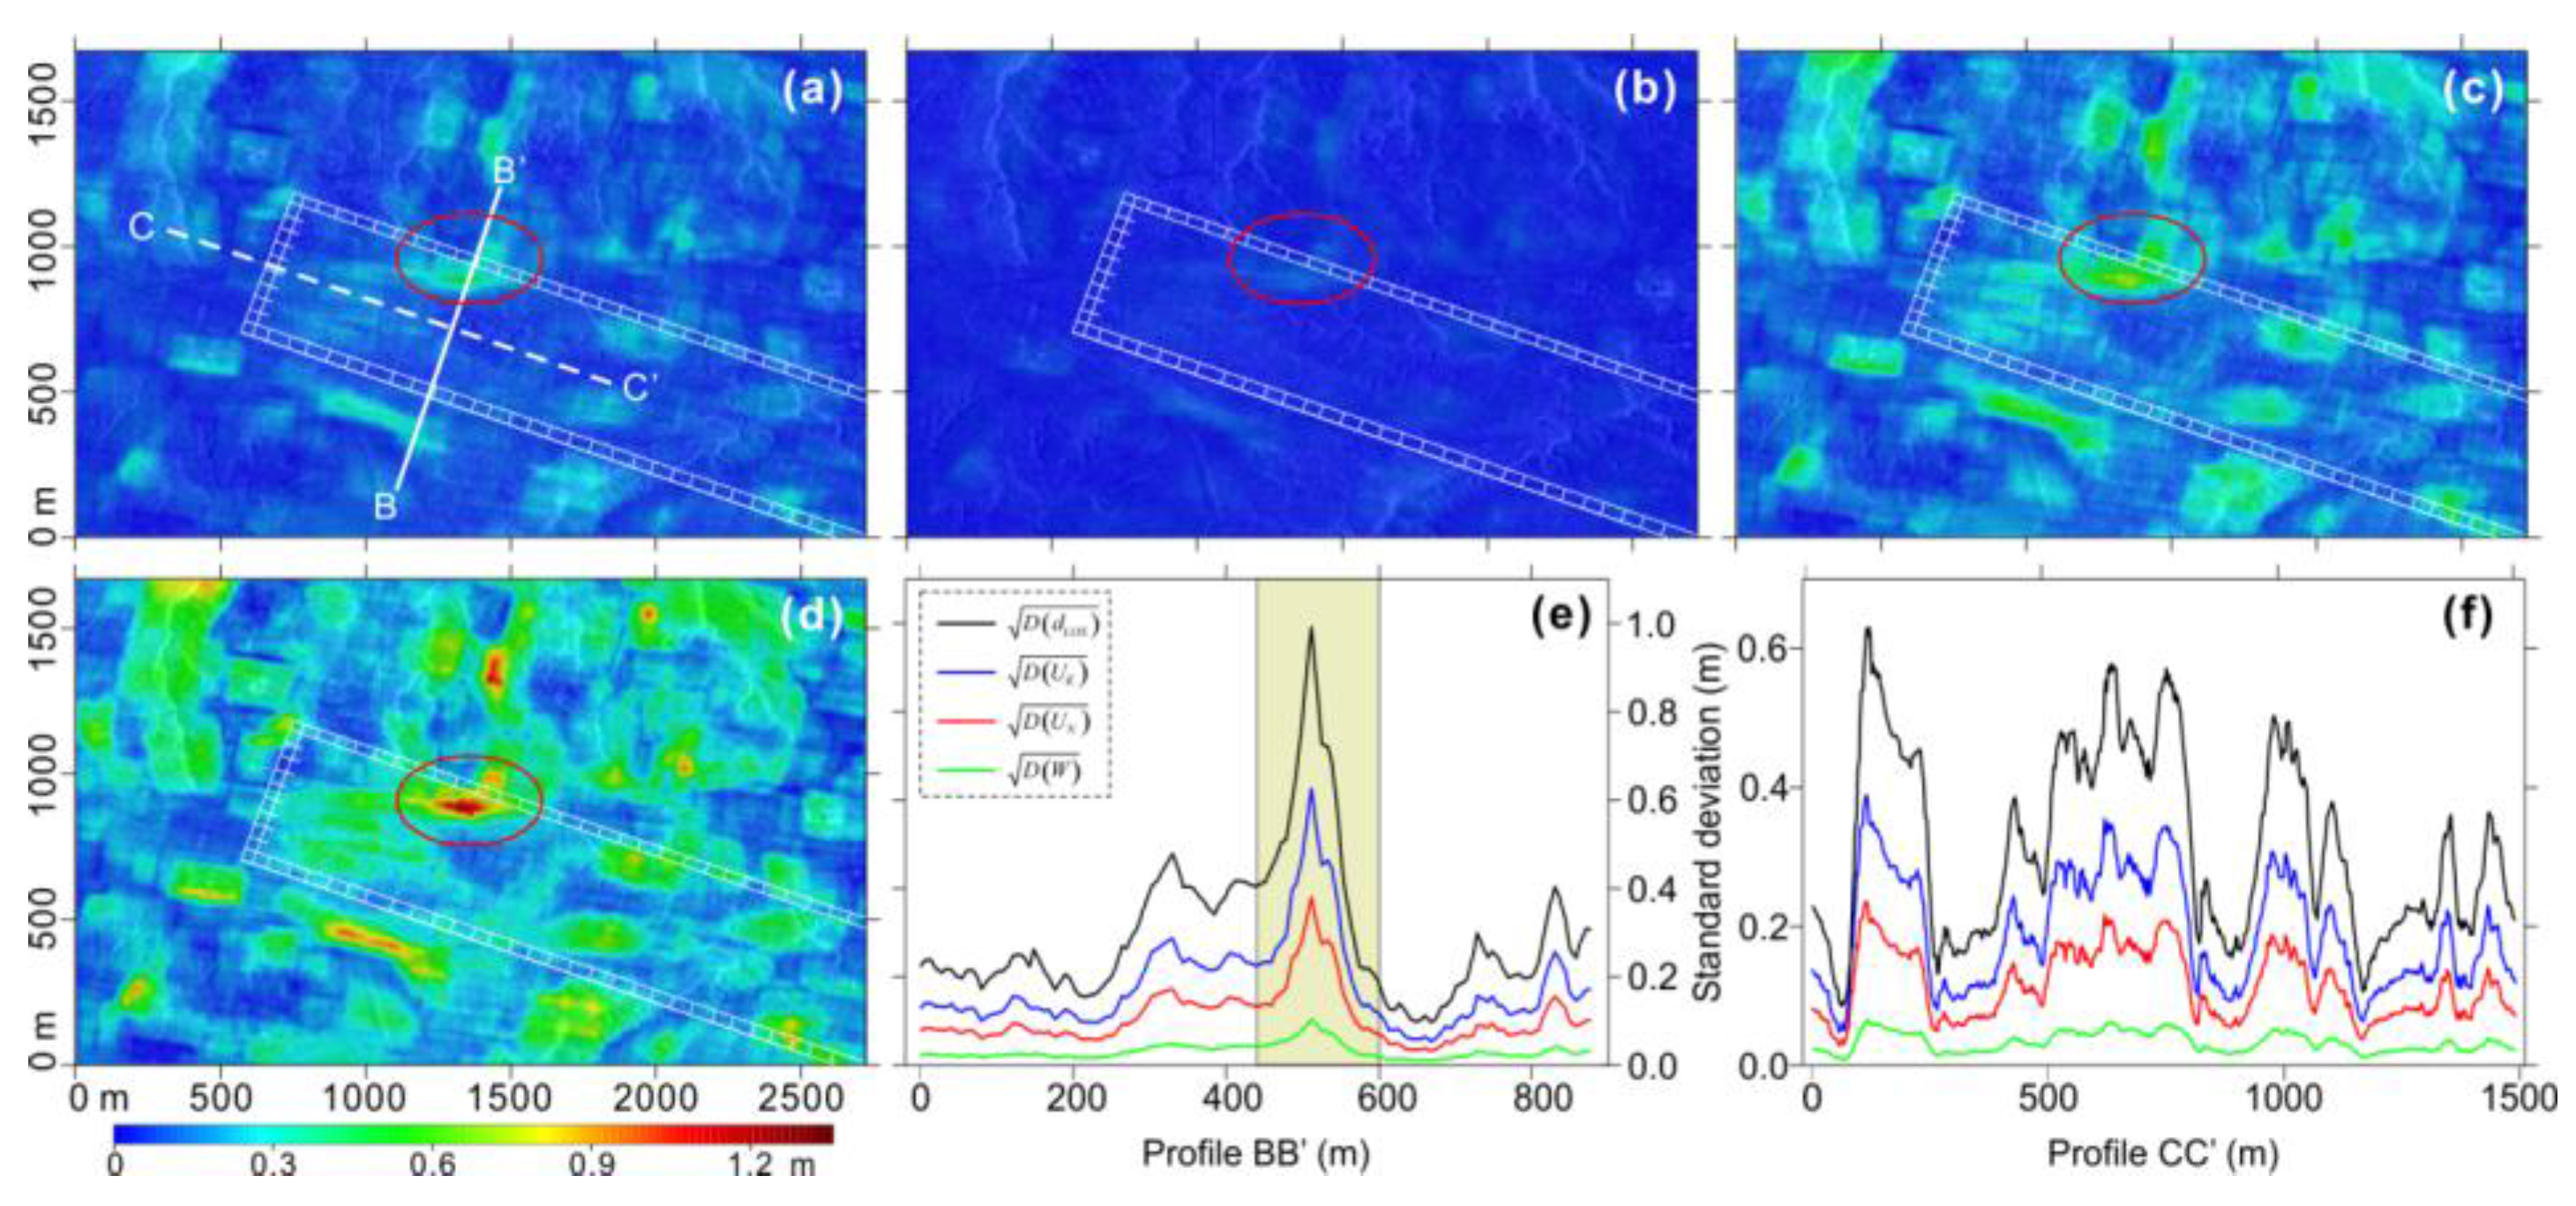
Taking the SNR map of the SAR amplitude image pair No. 1 (i.e., 20121221–20130206) as the SNR source, we found that the mean STD of the OT-derived LOS deformation calculated with Equation (9) is only about 8.69 × 10
−5, which is much smaller than the accuracy generally admitted for the OT technique (which is in the order of 1/10th to 1/30th of a pixel). Therefore, we assumed that the mean accuracy of the OT-derived LOS deformation was 0.1 m (about 1/10th of a pixel of the used SAR data in this study). Afterwards, amplifying the calculated STDs based on Equation (9) by 1150 times (i.e., 0.1/8.69 × 10
−5), we obtained the simulated variance map of the OT-derived LOS deformation observations (see
Figure 5a).
We designated the parameters in Equations (7) and (8) to be the same as the corresponding ones in the real data experiment (see
Section 4.2), and thus the errors of the 3-D displacements retrieved by the OT-SAP method due to the simulated errors of the OT-derived LOS deformation were estimated based on Equations (7) and (8), and the results are shown in
Figure 6b–d. To further check the error propagation, we selected profiles BB’ and CC’ (solid and dashed white lines in
Figure 6a) and further compared the STDs for the OT-derived LOS deformation and the estimated 3-D displacements along these two profiles (see
Figure 6e,f).
Figure 6 shows that the errors of the OT-derived LOS deformation are linearly propagated into the estimated 3-D displacement. These errors are significantly reduced when propagated to the vertical subsidence, whereas they are drastically magnified when propagated to the horizontal displacements in the north and east directions for the real data experiment. Taking the pixels in the area marked by the red ellipse in
Figure 6 as an example, we can see that the maximum error of 0.523 m in the OT-derived LOS deformation gives rise to maximum inaccuracies of nearly 0.142 m (0.27 times), 0.856 m (around 1.6 times), and 1.355 m (about 2.6 times) in the estimated 3-D displacements in the vertical, east, and north directions, respectively. This is one of the factors causing the large discrepancies of the estimated 3-D displacements in the area marked by the red ellipses (see
Figure 5). Methods to reduce the errors in the 3-D displacements estimated by the OT-SAP method due to the inaccuracy of the LOS deformation measurements will be one of our future research topics.
5.2. Error Amplification and Limitation of the Proportional Relationship
5.2.1. Theoretical Analysis
We let
and
be the errors over a surface point
caused by the unreliability of the proportional relationship, and thus the 2-D horizontal motions in the east
and north directions
can be expressed as:
Substituting Equation (10) into Equation (1), we obtain:
with
Equation (11) suggests that the errors of the expressed 2-D horizontal motions (i.e., and ) are first propagated to the error term of by Equation (12). The error term is then further propagated to the estimated 3-D displacements based on Equations (7) and (8).
5.2.2. Influence of Ground Fissures
The proportional relationship between the mining-induced horizontal motion and the gradients of the vertical subsidence (i.e., Equation (2)) is deduced from the stochastic medium model [
31,
57]. An essential assumption behind the stochastic medium model is that surface subsidence is continuous, i.e., no large ground fissures occur. Otherwise, the proportional relationship will be unreliable over those pixels with ground fissures. Therefore, ground fissures are an important factor causing the unreliability of the proportional relationship.
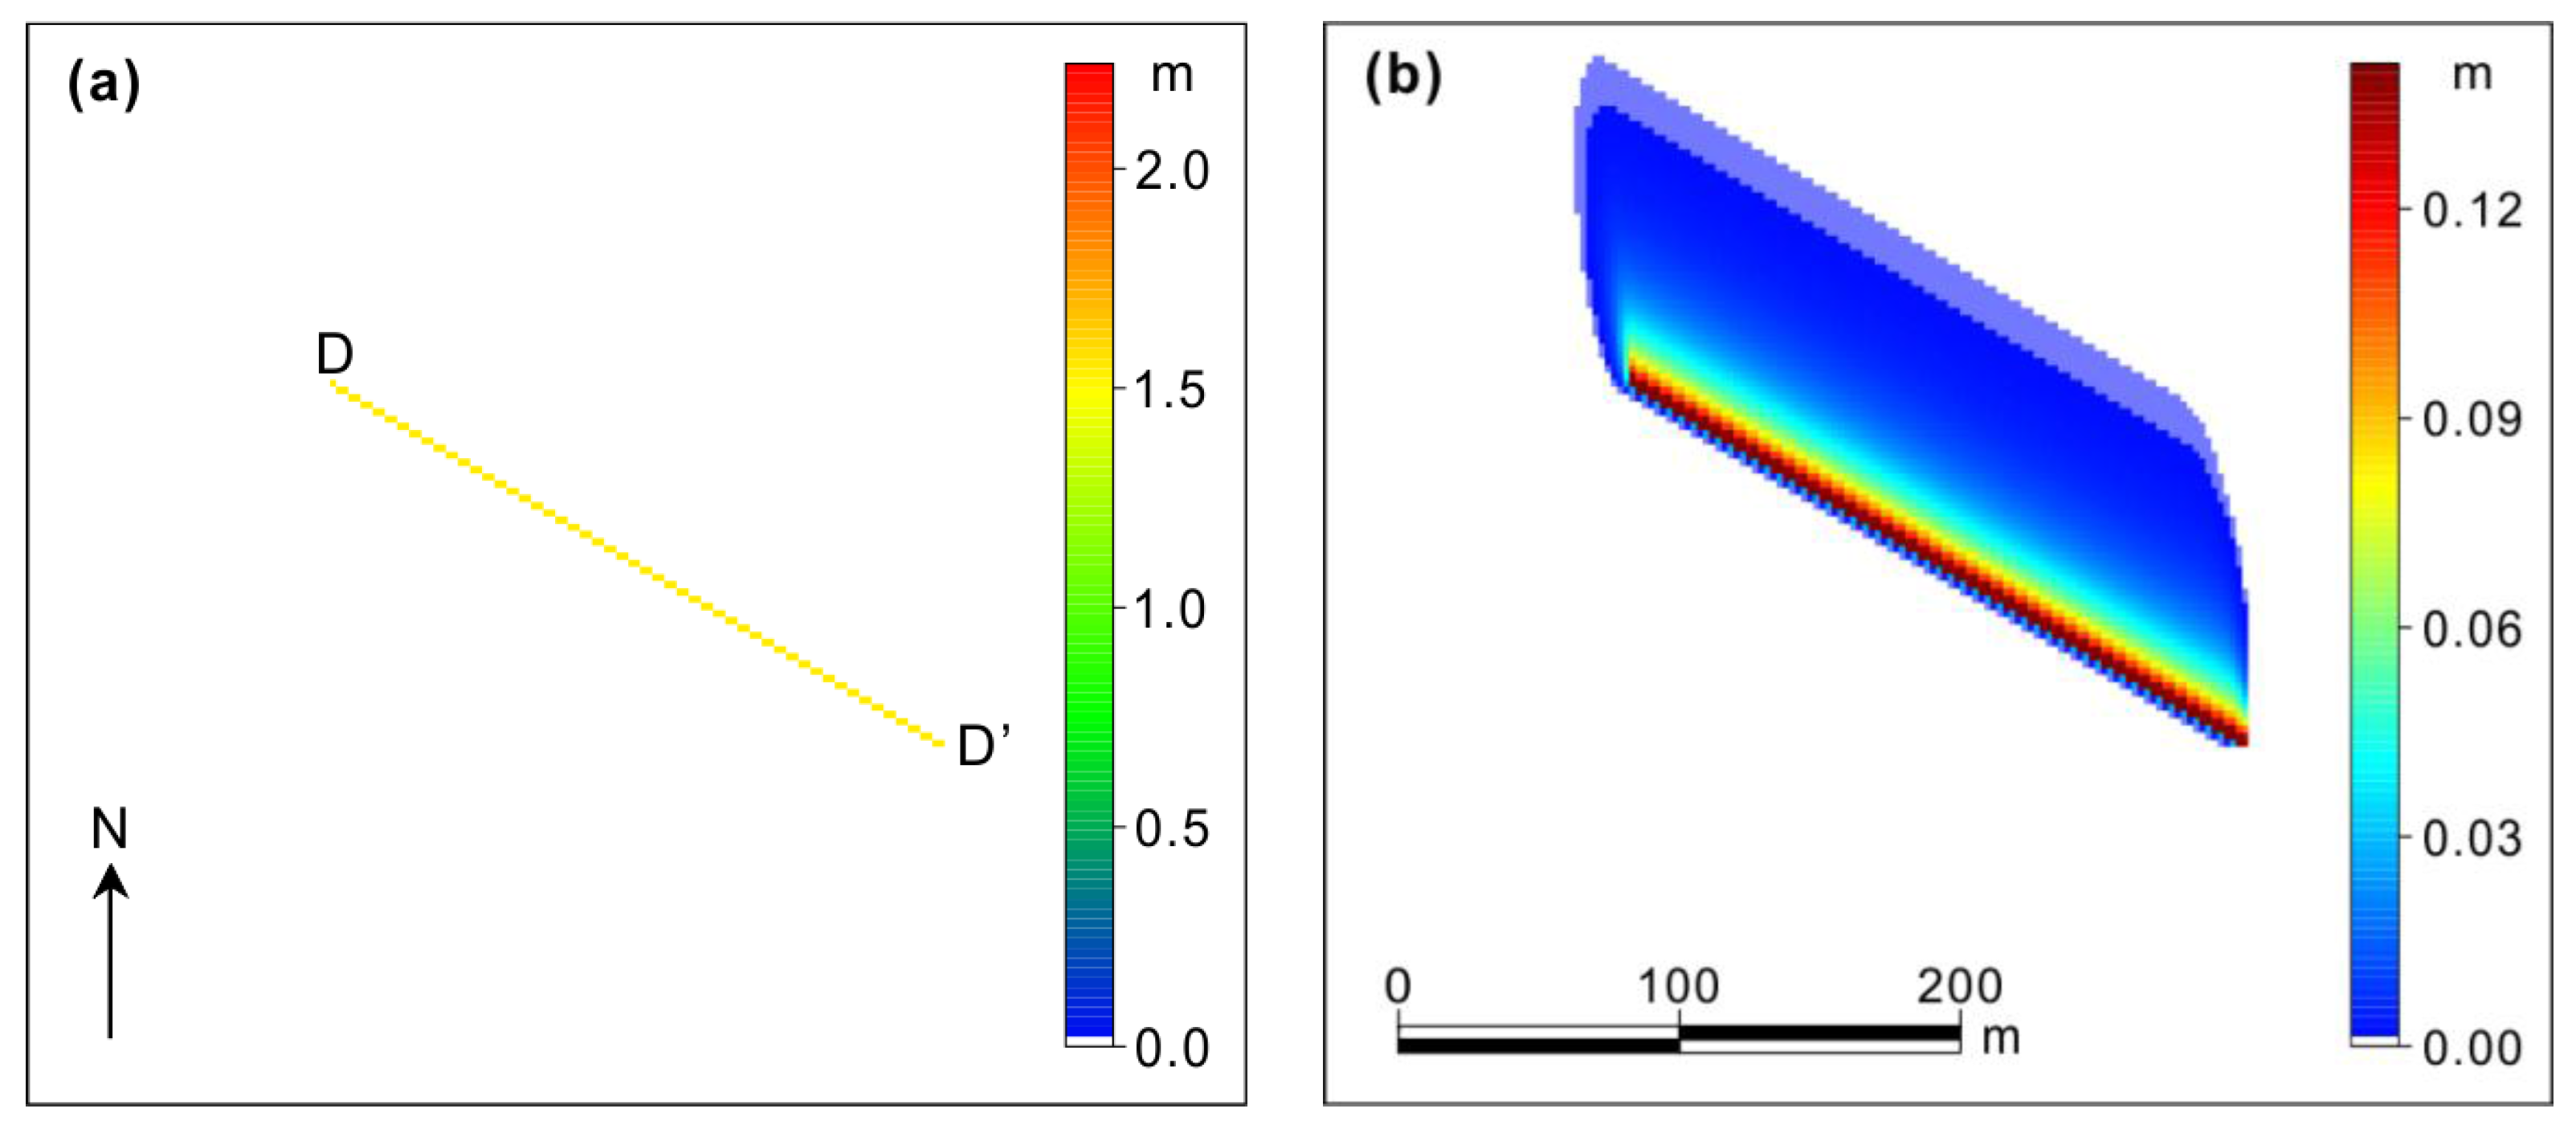
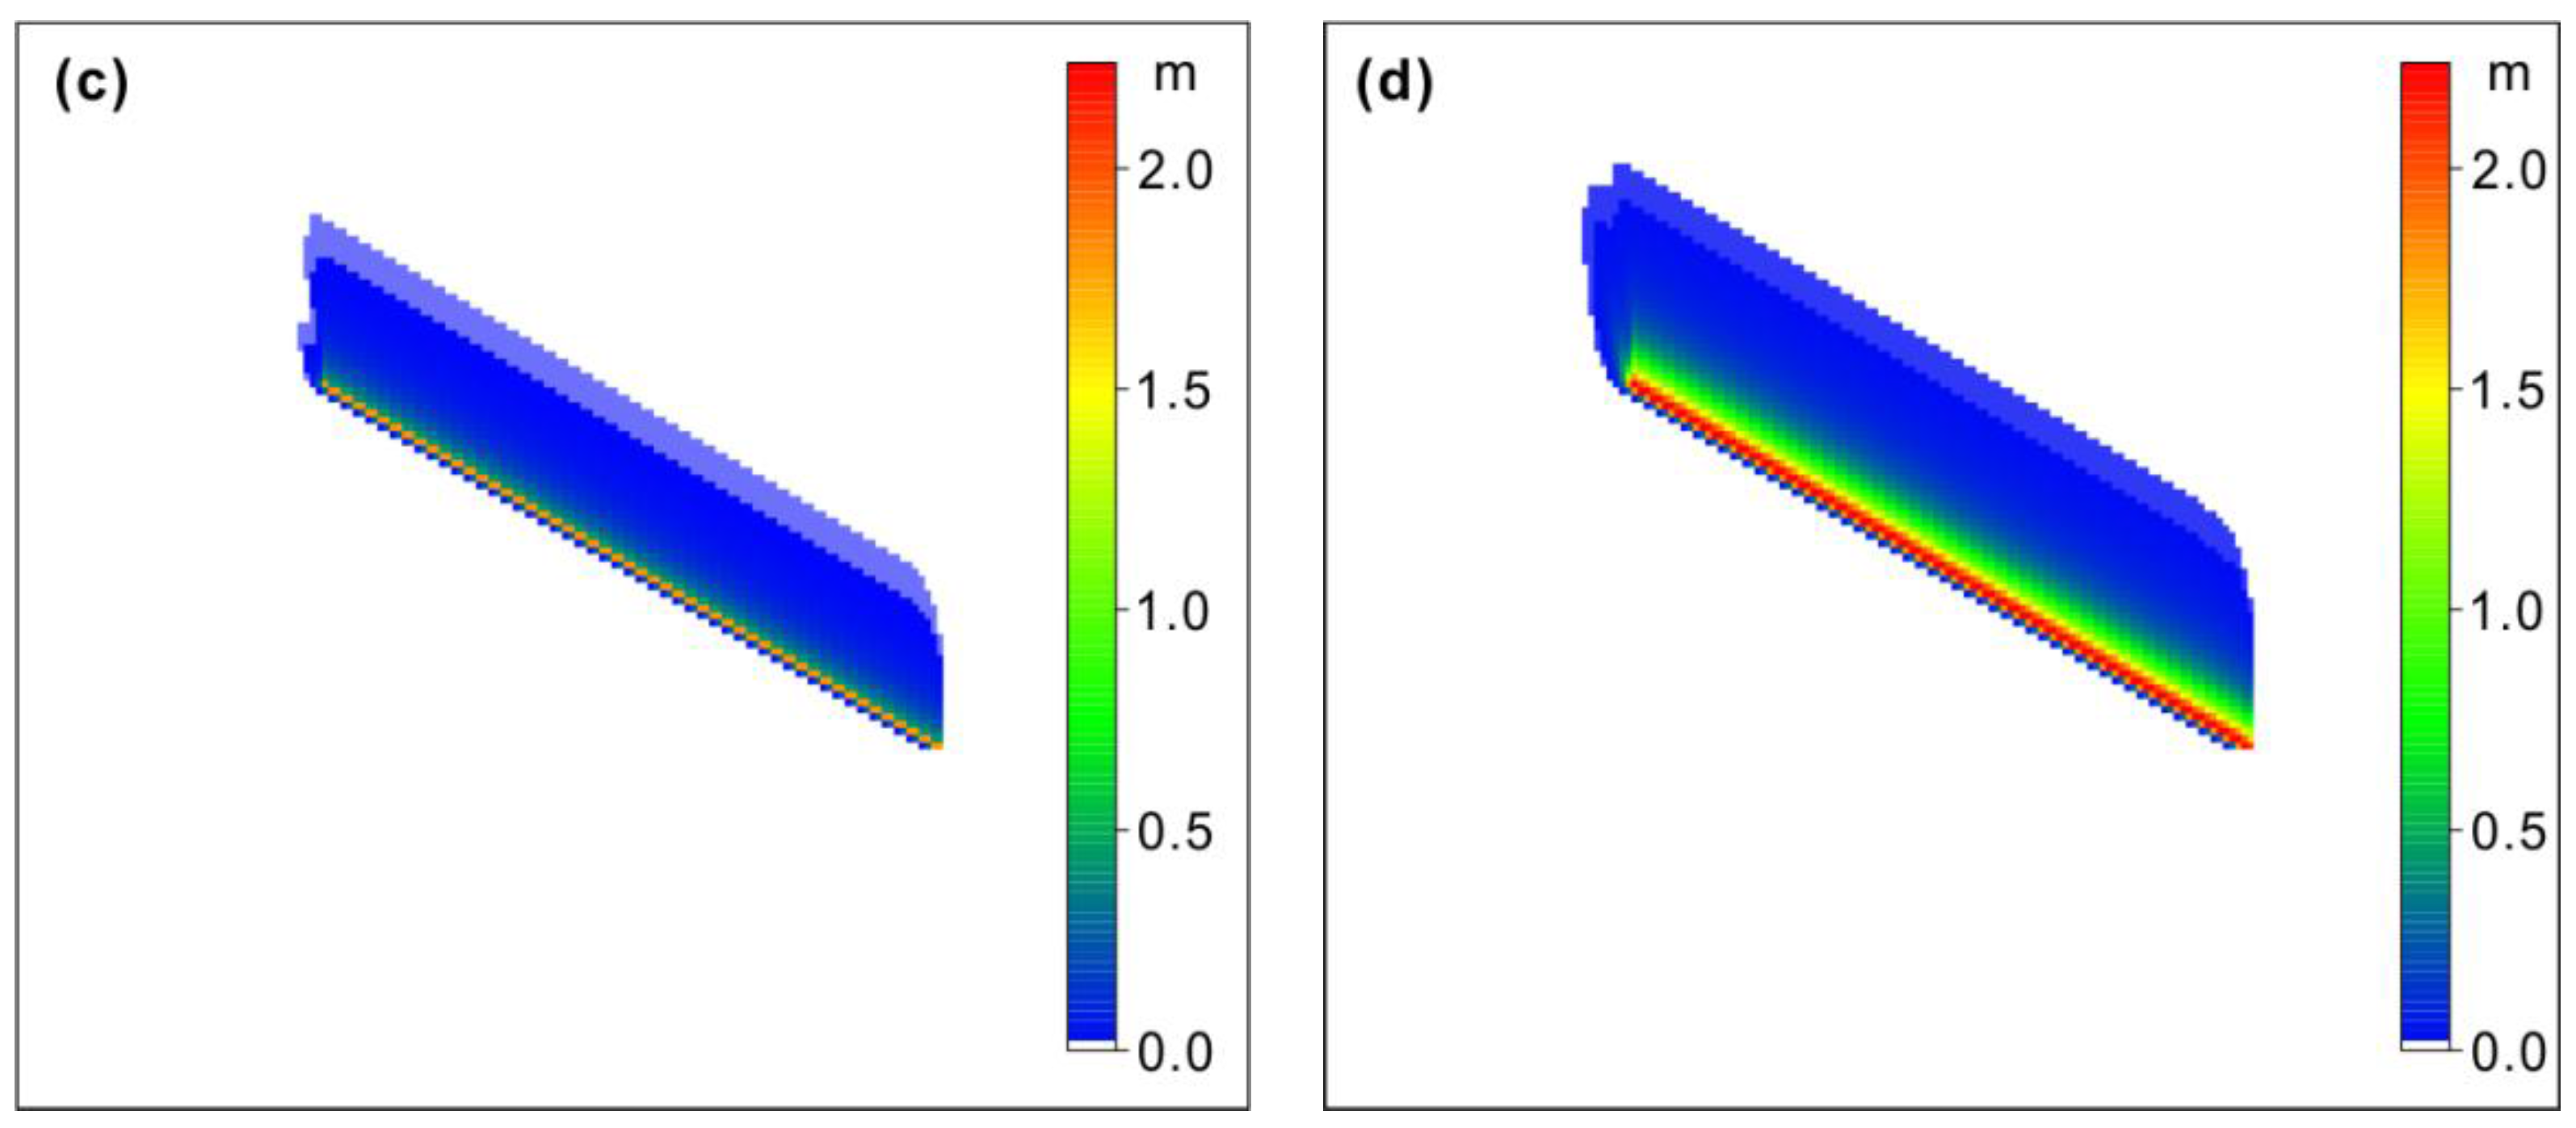
To intuitively demonstrate the errors in the estimated 3-D displacements due to ground fissures, a simulated experiment was carried out. We assumed that a mining-induced ground fissure occurred along profile DD’, resulting in inaccuracies of 2 m in both the expressed 2-D horizontal motions over those ground points along fissure DD’. Subsequently, we designated the parameters in Equations (11) and (12) to be the same as those used in the real data experiment (see
Section 4.2), and thus the error term of
could be estimated with Equation (11) (see
Figure 7a). Finally, the errors in the estimated 3-D displacements arising from the assumed ground fissure were estimated based on Equations (7) and (8). The results are depicted in
Figure 7b–d.
As can be seen from
Figure 7, the inaccuracies of about 2 m of the 2-D horizontal motions in the east
and north directions
along profile DD’ first result in an error of about 1.554 m in the error term
. The errors of
are then dramatically reduced to the solved vertical subsidence (whose maximum error is about 0.176 m), but sharply magnified to the estimated 2-D horizontal motions in the east and north directions (whose maximum error is around 1.834 m and 2.792 m, respectively). This indicates that the mining-related ground fissures can trigger large errors in the estimated 3-D displacements. Therefore, in addition to the errors of the LOS deformation observations, ground fissures may be another factor causing the large discrepancies over the three observation points marked by the yellow box in
Figure 5. How to reduce the adverse influence of mining-related ground fissures will be addressed in our future research.
6. Conclusions
This paper has presented a method for fully retrieving 3-D mining-induced displacements from a single SAR amplitude image pair. The real data experiment based on the Daliuta coal mining area in China showed that the maximum 3-D mining-induced displacements were about 4.3 m, 1.1 m, and 1.3 m in the vertical, east, and north directions, respectively, from 21 November 2012 to 4 February 2013. Additionally, the comparison between the in-situ GPS measurements and the estimated 3-D displacements demonstrated that the accuracies of the estimated displacements in the vertical and horizontal directions were about 0.201 m and 0.214 m, respectively. With regards to the magnitude of the deformation, such an accuracy level should satisfy the general requirement of mining-induced 3-D displacement monitoring. The OT-SAP method reduces the strict requirements on SAR data of the traditional OT-based techniques for 3-D displacement retrieval, significantly extending the application scope of SAR in mining areas. Furthermore, the OT-SAP method is based on SAR amplitude information and has a lower sensitivity to phase noise than the SIP method. As a result, it can be used to retrieve 3-D large mining-induced displacements that cannot be obtained by the SIP method. Therefore, we believe that the OT-SAP method will be a promising technique for retrieving 3-D mining-induced displacements and assessing mining-related hazards (e.g., landslides and structural damage).
However, the theoretical and experimental analyses showed that errors in the LOS deformation observations significantly affect the estimated 3-D displacements, especially in the 2-D horizontal motions. Given the fact that the accuracy of the OT-derived LOS deformation is often much worse than the InSAR-derived deformation for coherent areas, the SIP method is recommended for mining areas with good coherence. In contrast, if large deformation is found in the mining area, where intensive phase decorrelation occurs as a result, and the OT-SAP method will be more suitable. Additionally, ground fissures can give rise to large errors in the estimated 3-D displacements over those points along the ground fissures. Therefore, special attention should be paid to mining-related ground fissures, and finding an effective solution to this problem will be one of our future research topics.
Admittedly, there are now a few modes of space-borne SAR satellites (e.g., the SpotLight mode of TerraSAR-X and the SpotLight-2 mode of COSMO-SkyMed) that enable us to acquire SAR images with a spatial resolution of better than 1 m. Such a high resolution will contribute to accurately retrieving mining-related surface deformation in both the LOS and azimuth directions. Theoretically, the use of both LOS and azimuth deformations (if they can be accurately retrieved) will improve the accuracy of 3-D mining-related displacement estimation, because more observations will be available than using the LOS deformation alone, as in the presented OT-SAP method. We will test and validate this idea in our future research.
Acknowledgments
This work was partly supported by the National Natural Science Foundation of China (nos. 41474008, 41474007, and 41404013), the Hunan Provincial Natural Science Foundation of China (no. 13JJ1006), the Primary Research & Developement Plan of Hunan Province (no. 2016SK2002), the NASG Key Laboratory of Land Environment and Disaster Monitoring (no. LEDM2014B07), and the China Scholarship Council (no. 201506370139). The authors are very grateful to the in-situ measurements of surface deformation presented in the references [
55,
56]. The authors would also like to thank the German Aerospace Center (DLR) for providing the TerraSAR-X images of the study area (no. MTH3273).
Author Contributions
Zefa Yang conceived the concept of the presented study, designed and performed the experiments, and wrote the paper; Zhiwei Li contributed to the interpolation of the experimental results, the analysis of the error influence, and the revision of this paper; Jianjun Zhu, Axel Preusse, Huiwei Yi, Jun Hu, Guangcai Feng, and Markus Papst contributed to the discussion of the results.
Conflicts of Interest
The authors declare no conflict of interest.
References
- Amelung, F.; Galloway, D.L.; Bell, J.W.; Zebker, H.A.; Laczniak, R.J. Sensing the ups and downs of las vegas: InSAR reveals structural control of land subsidence and aquifer-system deformation. Geology 1999, 27, 483–486. [Google Scholar] [CrossRef]
- Du, Y.; Zhang, L.; Feng, G.; Lu, Z.; Sun, Q. On the accuracy of topographic residuals retrieved by MTInSAR. IEEE Trans. Geosci. Remote Sens. 2017, 55, 1053–1065. [Google Scholar] [CrossRef]
- Feng, G.; Li, Z.; Shan, X.; Zhang, L.; Zhang, G.; Zhu, J. Geodetic model of the 2015 April 25 Mw 7.8 Gorkha Nepal earthquake and Mw 7.3 aftershock estimated from InSAR and GPS data. Geophys. J. Int. 2015, 203, 896–900. [Google Scholar] [CrossRef]
- Lei, M.; Wang, Q.; Liu, X.; Xu, B.; Zhang, H. Influence of ocean tidal loading on InSAR offshore areas deformation monitoring. Geodesy Geodyn. 2017, 8, 70–76. [Google Scholar] [CrossRef]
- Milillo, P.; Bürgmann, R.; Lundgren, P.; Salzer, J.; Perissin, D.; Fielding, E.; Biondi, F.; Milillo, G. Space geodetic monitoring of engineered structures: The ongoing destabilization of the Mosul dam, Iraq. Sci. Rep. 2016, 6, 37408. [Google Scholar] [CrossRef] [PubMed]
- Milillo, P.; Perissin, D.; Salzer, J.T.; Lundgren, P.; Lacava, G.; Milillo, G.; Serio, C. Monitoring dam structural health from space: Insights from novel InSAR techniques and multi-parametric modeling applied to the Pertusillo dam Basilicata, Italy. Int. J. Appl. Earth Obs. 2016, 52, 221–229. [Google Scholar] [CrossRef]
- Qiao, X.; Wang, Q.; Yang, S.; Li, J.; Zou, R.; Ding, K. The 2008 Nura Mw 6. 7 earthquake: A shallow rupture on the Main Pamir Thrust revealed by GPS and InSAR. Geodesy Geodyn. 2015, 6, 91–100. [Google Scholar] [CrossRef]
- Xu, B.; Li, Z.; Feng, G.; Zhang, Z.; Wang, Q.; Hu, J.; Chen, X. Continent-wide 2-D co-seismic deformation of the 2015 Mw 8.3 illapel, Chile earthquake derived from Sentinel-1A data: Correction of azimuth co-registration error. Remote Sens. 2016, 8, 376. [Google Scholar] [CrossRef]
- Xu, W.; Buergmann, R.; Li, Z. An improved geodetic source model for the 1999 Mw 6.3 Chamoli earthquake, India. Geophys. J. Int. 2016, 205, 236–242. [Google Scholar] [CrossRef]
- Yang, Z.; Li, Z.; Zhu, J.; Preusse, A.; Yi, H.; Wang, Y.; Papst, M. An extension of the InSAR-based probability integral method and its application for predicting 3-D mining-induced displacements under different extraction conditions. IEEE Trans. Geosci. Remote Sens. 2017. [Google Scholar] [CrossRef]
- Zhao, R.; Li, Z.W.; Feng, G.C.; Wang, Q.J.; Hu, J. Monitoring surface deformation over permafrost with an improved SBAS-InSAR algorithm: With emphasis on climatic factors modeling. Remote Sens. Environ. 2016, 184, 276–287. [Google Scholar] [CrossRef]
- Gray, L. Using multiple RADARSAT InSAR pairs to estimate a full three-dimensional solution for glacial ice movement. Geophys. Res. Lett. 2011, 38, L05502. [Google Scholar] [CrossRef]
- Joughin, I.R.; Kwok, R.; Fahnestock, M.A. Interferometric estimation of three-dimensional ice-flow using ascending and descending passes. IEEE Trans. Geosci. Remote Sens. 1998, 36, 25–37. [Google Scholar] [CrossRef]
- Samsonov, S.; d’Oreye, N. Multidimensional time-series analysis of ground deformation from multiple InSAR data sets applied to virunga volcanic province. Geophys. J. Int. 2012, 191, 1095–1108. [Google Scholar]
- Wright, T.J.; Parsons, B.E.; Lu, Z. Toward mapping surface deformation in three dimensions using InSAR. Geophys. Res. Lett. 2004, 31, L01607. [Google Scholar] [CrossRef]
- Casu, F.; Manconi, A. Four-dimensional surface evolution of active rifting from spaceborne SAR data. Geosphere 2016, 12, 697–705. [Google Scholar] [CrossRef]
- De Michele, M.; Raucoules, D.; de Sigoyer, J.; Pubellier, M.; Chamot-Rooke, N. Three-dimensional surface displacement of the 2008 May 12 sichuan earthquake (China) derived from synthetic aperture radar: Evidence for rupture on a blind thrust. Geophys. J. Int. 2010, 183, 1097–1103. [Google Scholar] [CrossRef]
- Feng, G.; Jónsson, S.; Klinger, Y. Which fault segments ruptured in the 2008 wenchuan earthquake and which did not? New evidence from near-fault 3D surface displacements derived from SAR image offsets. Bull. Seismol. Soc. Am. 2017. [Google Scholar] [CrossRef]
- Pathier, E.; Fielding, E.; Wright, T.; Walker, R.; Parsons, B.; Hensley, S. Displacement field and slip distribution of the 2005 Kashmir earthquake from SAR imagery. Geophys. Res. Lett. 2006, 33, L20310. [Google Scholar] [CrossRef]
- Raspini, F.; Ciampalini, A.; Del Conte, S.; Lombardi, L.; Nocentini, M.; Gigli, G.; Ferretti, A.; Casagli, N. Exploitation of amplitude and phase of satellite SAR images for landslide mapping: The case of Montescaglioso (South Italy). Remote Sens. 2015, 7, 14576–14596. [Google Scholar] [CrossRef]
- Ruch, J.; Wang, T.; Xu, W.; Hensch, M.; Jónsson, S. Oblique rift opening revealed by reoccurring magma injection in central iceland. Nat. Commun. 2016, 7, 12352. [Google Scholar] [CrossRef] [PubMed]
- Schaefer, L.; Wang, T.; Escobar-Wolf, R.; Oommen, T.; Lu, Z.; Kim, J.; Lundgren, P.; Waite, G. Three-dimensional displacements of a large volcano flank movement during the may 2010 eruptions at Pacaya Volcano, Guatemala. Geophys. Res. Lett. 2017, 44, 135–142. [Google Scholar] [CrossRef]
- Wang, T.; Jónsson, S. Improved SAR amplitude image offset measurements for deriving three-dimensional coseismic displacements. IEEE J. Sel. Top. Appl. Earth Observ. 2015, 8, 3271–3278. [Google Scholar] [CrossRef]
- Hu, J.; Li, Z.; Ding, X.; Zhu, J.; Zhang, L.; Sun, Q. 3D coseismic displacement of 2010 Darfield, New Zealand earthquake estimated from multi-aperture InSAR and D-InSAR measurements. J. Geodesy 2012, 86, 1029–1041. [Google Scholar] [CrossRef]
- Jung, H.-S.; Lu, Z.; Won, J.-S.; Poland, M.P.; Miklius, A. Mapping three-dimensional surface deformation by combining multiple-aperture interferometry and conventional interferometry: Application to the june 2007 eruption of Kilauea volcano, Hawaii. IEEE Geosci. Remote Sens. Lett. 2011, 8, 34–38. [Google Scholar] [CrossRef]
- Hu, J.; Li, Z.; Ding, X.; Zhu, J.; Zhang, L.; Sun, Q. Resolving three-dimensional surface displacements from InSAR measurements: A review. Earth-Sci. Rev. 2014, 133, 1–17. [Google Scholar] [CrossRef]
- Milillo, P.; Minchew, B.; Agram, P.; Riel, B.; Simons, M. 3D velocity field time series using synthetic aperture radar: Application to tidal-timescale ice-flow variability in Rutford Ice Stream, West Antarctica. In SPIE Remote Sensing, 2016; International Society for Optics and Photonics: Edinburgh, UK, 2016; pp. 1000309–1000309–7. [Google Scholar]
- Minchew, B.; Simons, M.; Riel, B.; Milillo, P. Tidally induced variations in vertical and horizontal motion on Rutford Ice Stream, West Antarctica, inferred from remotely sensed observations. J. Geophys. Res. Earth Surface 2017, 122, 167–190. [Google Scholar] [CrossRef]
- Jarosz, A.; Karmis, M.; Sroka, A. Subsidence development with time-experiences from longwall operations in the appalachian coalfield. Int. J. Min. Geol. Eng. 1990, 8, 261–273. [Google Scholar] [CrossRef]
- Yang, Z.; Li, Z.; Zhu, J.; Yi, H.; Hu, J.; Feng, G. Deriving dynamic subsidence of coal mining areas using InSAR and logistic model. Remote Sens. 2017, 9, 125. [Google Scholar] [CrossRef]
- Li, Z.W.; Yang, Z.F.; Zhu, J.J.; Hu, J.; Wang, Y.J.; Li, P.X.; Chen, G.L. Retrieving three-dimensional displacement fields of mining areas from a single InSAR pair. J. Geodesy 2015, 89, 17–32. [Google Scholar] [CrossRef]
- Peng, S.S.; Ma, W.; Zhong, W. Surface Subsidence Engineering; Society for Mining, Metallurgy, and Exploration: Littleton, CO, USA, 1992. [Google Scholar]
- Yang, Z.F.; Li, Z.W.; Zhu, J.J.; Hu, J.; Wang, Y.J.; Chen, G.L. InSAR-based model parameter estimation of probability integral method and its application for predicting mining-induced horizontal and vertical displacements. IEEE Trans. Geosci. Remote Sens. 2016, 54, 4818–4832. [Google Scholar] [CrossRef]
- Zebker, H.A.; Villasenor, J. Decorrelation in interferometric radar echoes. IEEE Trans. Geosci. Remote Sens. 1992, 30, 950–959. [Google Scholar] [CrossRef]
- Chen, C.W.; Zebker, H.A. Two-dimensional phase unwrapping with use of statistical models for cost functions in nonlinear optimization. J. Opt. Soc. Am. A. 2001, 18, 338–351. [Google Scholar] [CrossRef]
- Baran, I.; Stewart, M.; Claessens, S. A new functional model for determining minimum and maximum detectable deformation gradient resolved by satellite radar interferometry. IEEE Trans. Geosci. Remote Sens. 2005, 43, 675–682. [Google Scholar] [CrossRef]
- Jiang, M.; Li, Z.W.; Ding, X.L.; Zhu, J.J.; Feng, G.C. Modeling minimum and maximum detectable deformation gradients of interferometric SAR measurements. Int. J. Appl. Earth Obs. 2011, 13, 766–777. [Google Scholar] [CrossRef]
- Michel, R.; Avouac, J.P.; Taboury, J. Measuring ground displacements from SAR amplitude images: Application to the landers earthquake. Geophys. Res. Lett. 1999, 26, 875–878. [Google Scholar] [CrossRef]
- Strozzi, T.; Luckman, A.; Murray, T.; Wegmuller, U.; Werner, C.L. Glacier motion estimation using SAR offset-tracking procedures. IEEE Trans. Geosci. Remote Sens. 2002, 40, 2384–2391. [Google Scholar] [CrossRef]
- Eineder, M.; Minet, C.; Steigenberger, P.; Cong, X.; Fritz, T. Imaging geodesy—Toward centimeter-level ranging accuracy with TerraSAR-X. IEEE Trans. Geosci. Remote Sens. 2011, 49, 661–671. [Google Scholar] [CrossRef]
- Pritchard, H.; Murray, T.; Luckman, A.; Strozzi, T.; Barr, S. Glacier surge dynamics of Sortebræ, east Greenland, from synthetic aperture radar feature tracking. J. Geophys. Res. Earth Surface 2005, 110, F03005. [Google Scholar] [CrossRef]
- Casu, F.; Manconi, A.; Pepe, A.; Lanari, R. Deformation time-series generation in areas characterized by large displacement dynamics: The SAR amplitude pixel-offset SBAS technique. IEEE Trans. Geosci. Remote Sens. 2011, 49, 2752–2763. [Google Scholar] [CrossRef]
- Yun, S.H.; Zebker, H.; Segall, P.; Hooper, A.; Poland, M. Interferogram formation in the presence of complex and large deformation. Geophys. Res. Lett. 2007, 34, L12305. [Google Scholar] [CrossRef]
- Yang, Z.; Li, Z.; Zhu, J.; Preusse, A.; Yi, H.; Wang, Y.; Papst, M. An extension of the insar-based probability integral method and its application for predicting 3-d mining-induced displacements under different extraction conditions. IEEE Trans. Geosci. Remote Sens. 2017. [Google Scholar] [CrossRef]
- Hanssen, R.F. Radar Interferometry: Data Interpretation and Error Analysis; Springer: Berlin, Germany, 2001. [Google Scholar]
- Reddish, D.; Whittaker, B. Subsidence: Occurrence, Prediction and Control; Elsevier: Amsterdam, The Netherlands, 2012. [Google Scholar]
- Hansen, P.C. Truncated singular value decomposition solutions to discrete ill-posed problems with ill-determined numerical rank. SIAM J. Sci. Stat. Comput. 1990, 11, 503–518. [Google Scholar] [CrossRef]
- Ma, C.; Tian, S.; Xie, S.; Zhao, N.; Yang, Y. A comparative study of NDVI change in Shendong coalfield based on gimms dataset. Environmental Protection and Sustainable Ecological Development. In Proceedings of the 2014 International Conference on Environmental Protection and Sustainable Ecological Development (EPSED 2014), Wuhan, Hubei, China, 24–26 October 2014. [Google Scholar]
- Zhang, D.S.; Fan, G.W.; Ma, L.Q.; Wang, X.F. Aquifer protection during longwall mining of shallow coal seams: A case study in the shendong coalfield of china. Int. J. Coal Geol. 2011, 86, 190–196. [Google Scholar] [CrossRef]
- Zhao, C.Y.; Lu, Z.; Zhang, Q. Time-series deformation monitoring over mining regions with SAR intensity-based offset measurements. Remote Sens. Lett. 2013, 4, 436–445. [Google Scholar] [CrossRef]
- Chen, B.; Deng, K.; Fan, H.; Yu, Y. Combining SAR interferometric phase and intensity information for monitoring of large gradient deformation in coal mining area. Eur. J. Remote Sens. 2015, 48, 701–717. [Google Scholar] [CrossRef]
- Fan, H.; Gao, X.; Yang, J.; Deng, K.; Yu, Y. Monitoring mining subsidence using a combination of phase-stacking and offset-tracking methods. Remote Sens. 2015, 7, 9166–9183. [Google Scholar] [CrossRef]
- Sansosti, E.; Berardino, P.; Manunta, M.; Serafino, F.; Fornaro, G. Geometrical SAR image registration. IEEE Trans. Geosci. Remote Sens. 2006, 44, 2861–2870. [Google Scholar] [CrossRef]
- Werner, C.; Wegmüller, U.; Strozzi, T.; Wiesmann, A. Gamma SAR and interferometric processing software. In Proceedings of the ERS-Envisat Symposium, Gothenburg, Sweden, 16–20 October 2000. [Google Scholar]
- Liu, H. The Development Law and Treatment Technology of Ground Fissures Due to Underground Mining in Loess Hilly Area of Western China; China University of Mining and Technology: Xuzhou, China, 2014. (In chinese) [Google Scholar]
- Zhao, W. InSAR Monitoring Techniques Application Oriented Research on Mining Subsidence; China University of Mining and Technology: Xuzhou, China, 2015. (In chinese) [Google Scholar]
- Liu, B.; Liao, G. Basic Law of Ground Surface Movement Due to Coal Mining; The Industrial Press of China: Beijing, China, 1965. (In chinese) [Google Scholar]
- Bamler, R.; Eineder, M. Accuracy of differential shift estimation by correlation and split-bandwidth interferometry for wideband and delta-k SAR systems. IEEE Geosci. Remote Sens. Lett. 2005, 2, 151–155. [Google Scholar] [CrossRef]
- Raucoules, D.; de Michele, M.; Malet, J.P.; Ulrich, P. Time-variable 3D ground displacements from high-resolution synthetic aperture radar (SAR). Application to la valette landslide (South French Alps). Remote Sens. Environ. 2013, 139, 198–204. [Google Scholar] [CrossRef]
© 2017 by the authors. Licensee MDPI, Basel, Switzerland. This article is an open access article distributed under the terms and conditions of the Creative Commons Attribution (CC BY) license (http://creativecommons.org/licenses/by/4.0/).


 ,
, 


