Regime Shift Identification of Runoff and Sediment Loads in the Yellow River Basin, China


Abstract
:1. Introduction
2. Study Area and Data
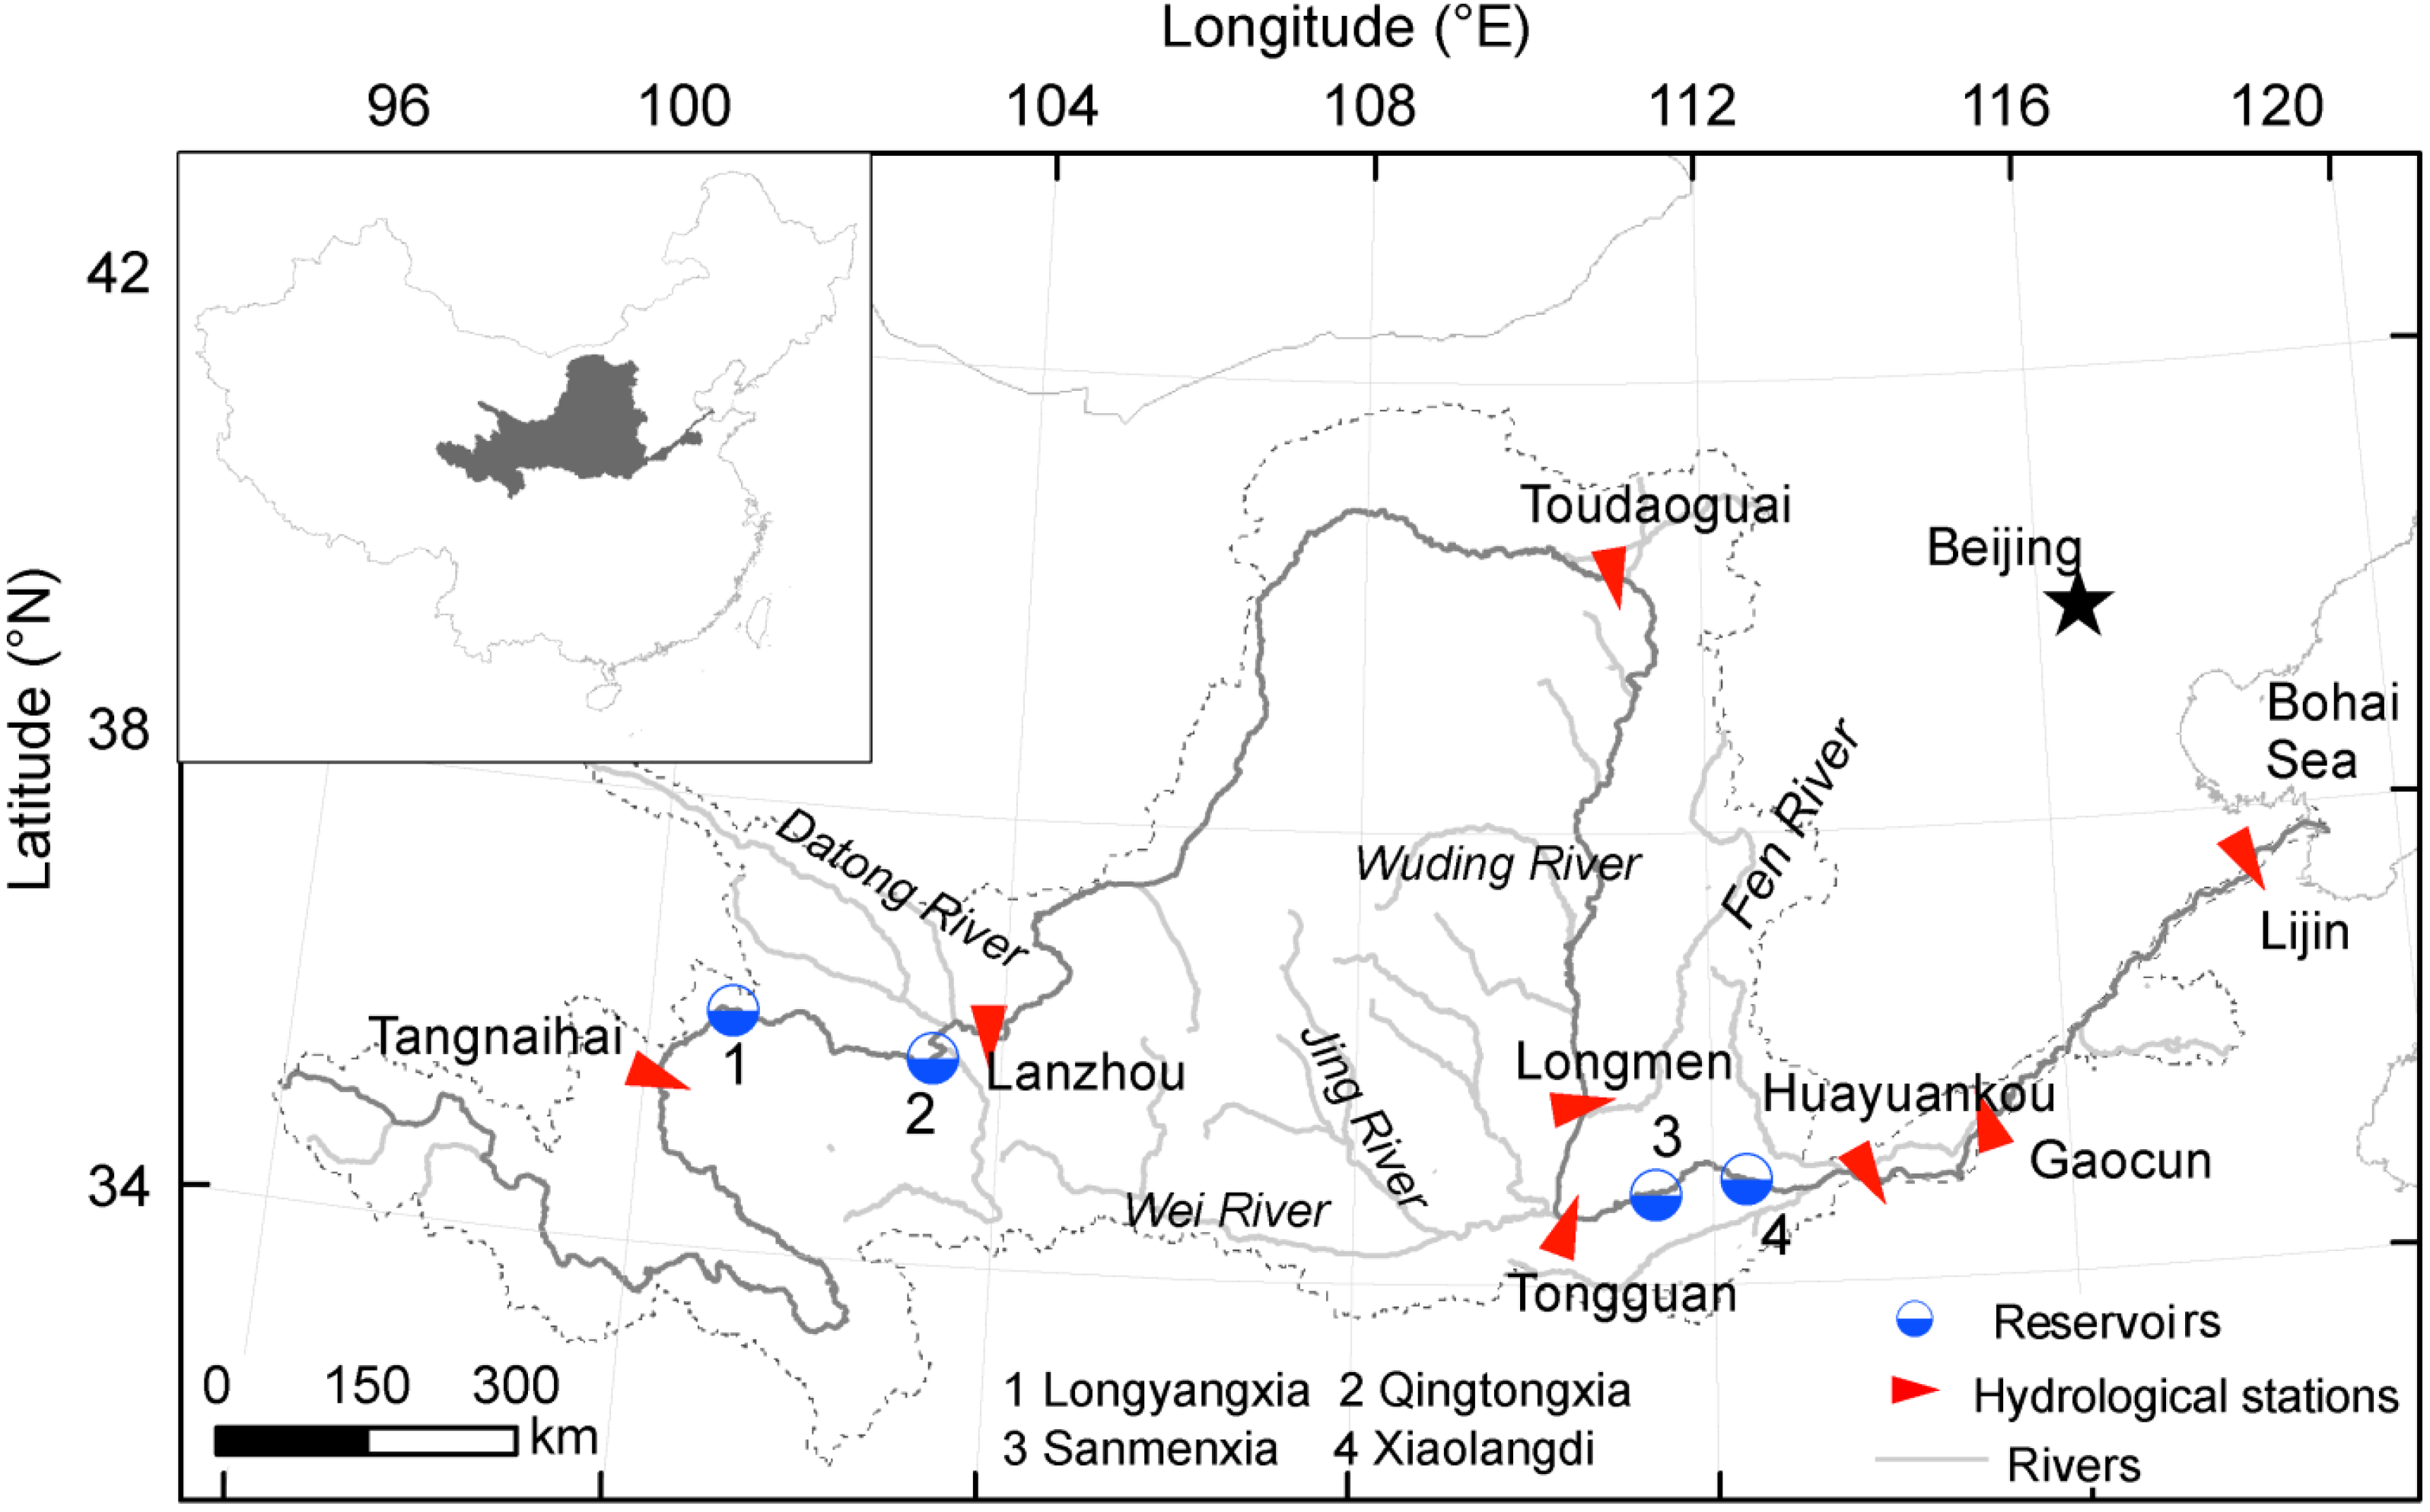
2.1. Study Area

2.2. Dataset

| Stations | Time Interval | Annual Runoff (mm) | Annual Sediment Load (108 t) | Drainage Area (km2) | Location |
|---|---|---|---|---|---|
| Tangnaihai * | 1950–2012 | 164.87 | 0.12 | 121,972 | Upper drainage basin |
| Lanzhou | 1950–2012 | 139.07 | 0.66 | 222,551 | |
| Toudaoguai | 1950–2012 | 58.55 | 1.03 | 367,898 | Middle drainage basin |
| Longmen | 1950–2012 | 52.78 | 6.97 | 497,552 | |
| Tongguan | 1952–2012 | 49.67 | 10.06 | 682,166 | |
| Huayuankou | 1950–2012 | 51.46 | 8.72 | 730,036 | Lower drainage basin |
| Gaocun | 1952–2012 | 47.64 | 7.82 | 734,146 | |
| Lijin | 1952–2012 | 39.79 | 7.03 | 751,869 |
3. Methodology
3.1. Regime Shift Detection Using a Sequential Approach
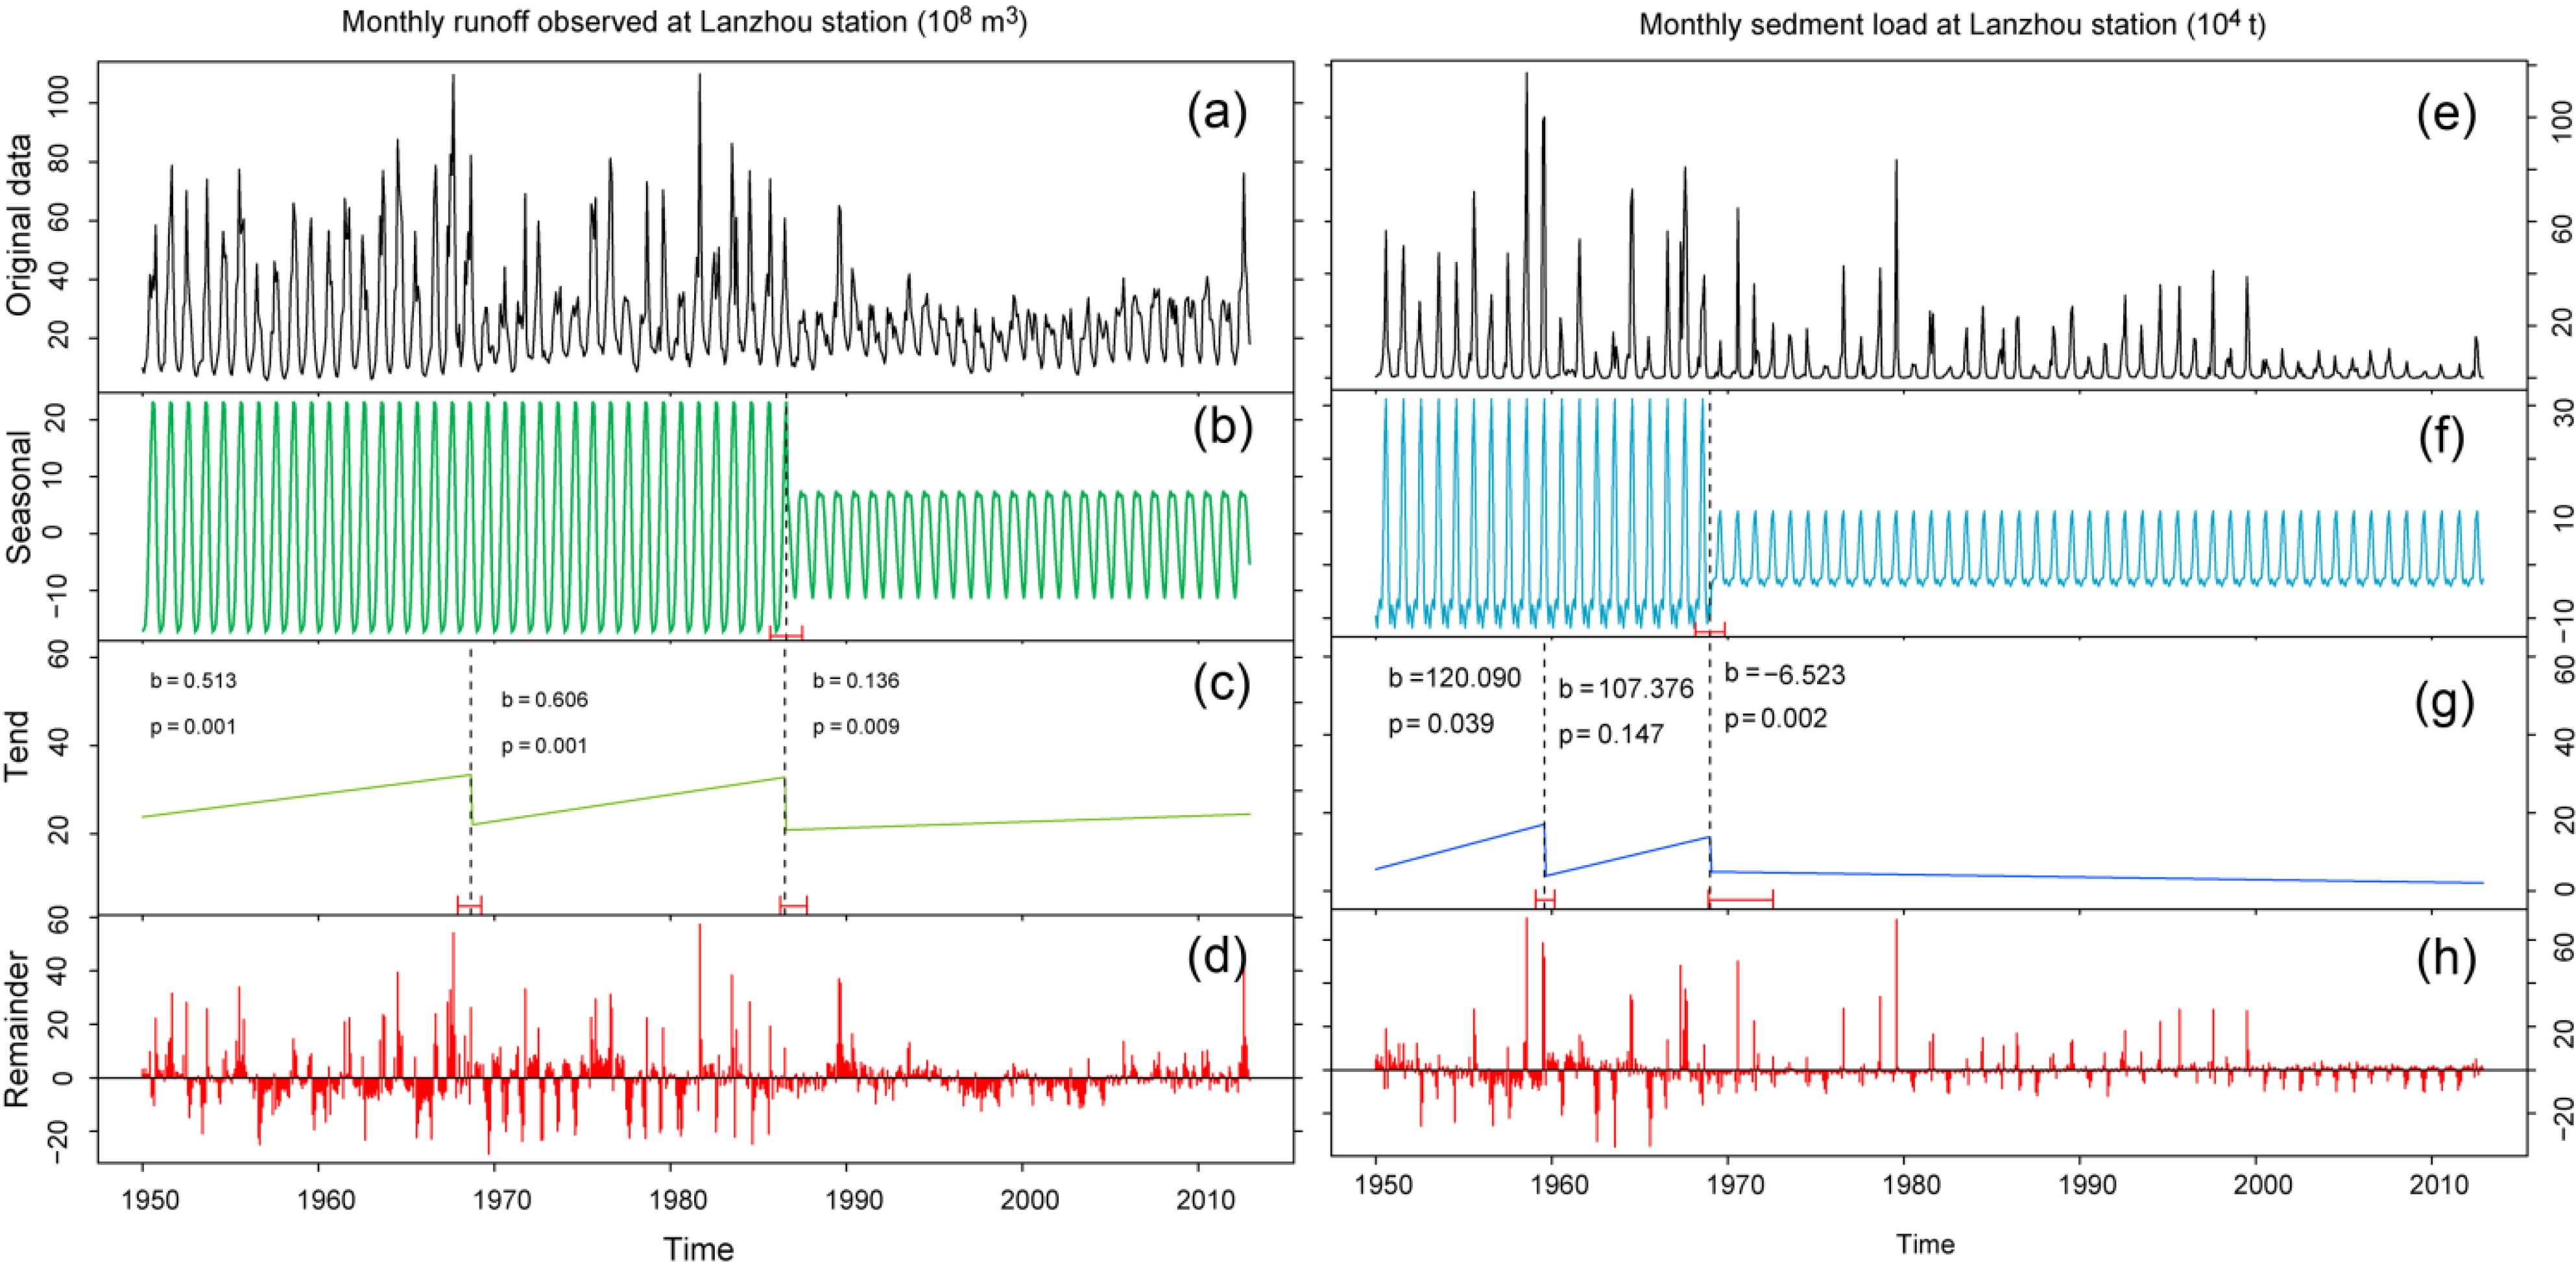
3.2. Time Series Decomposition
4. Results
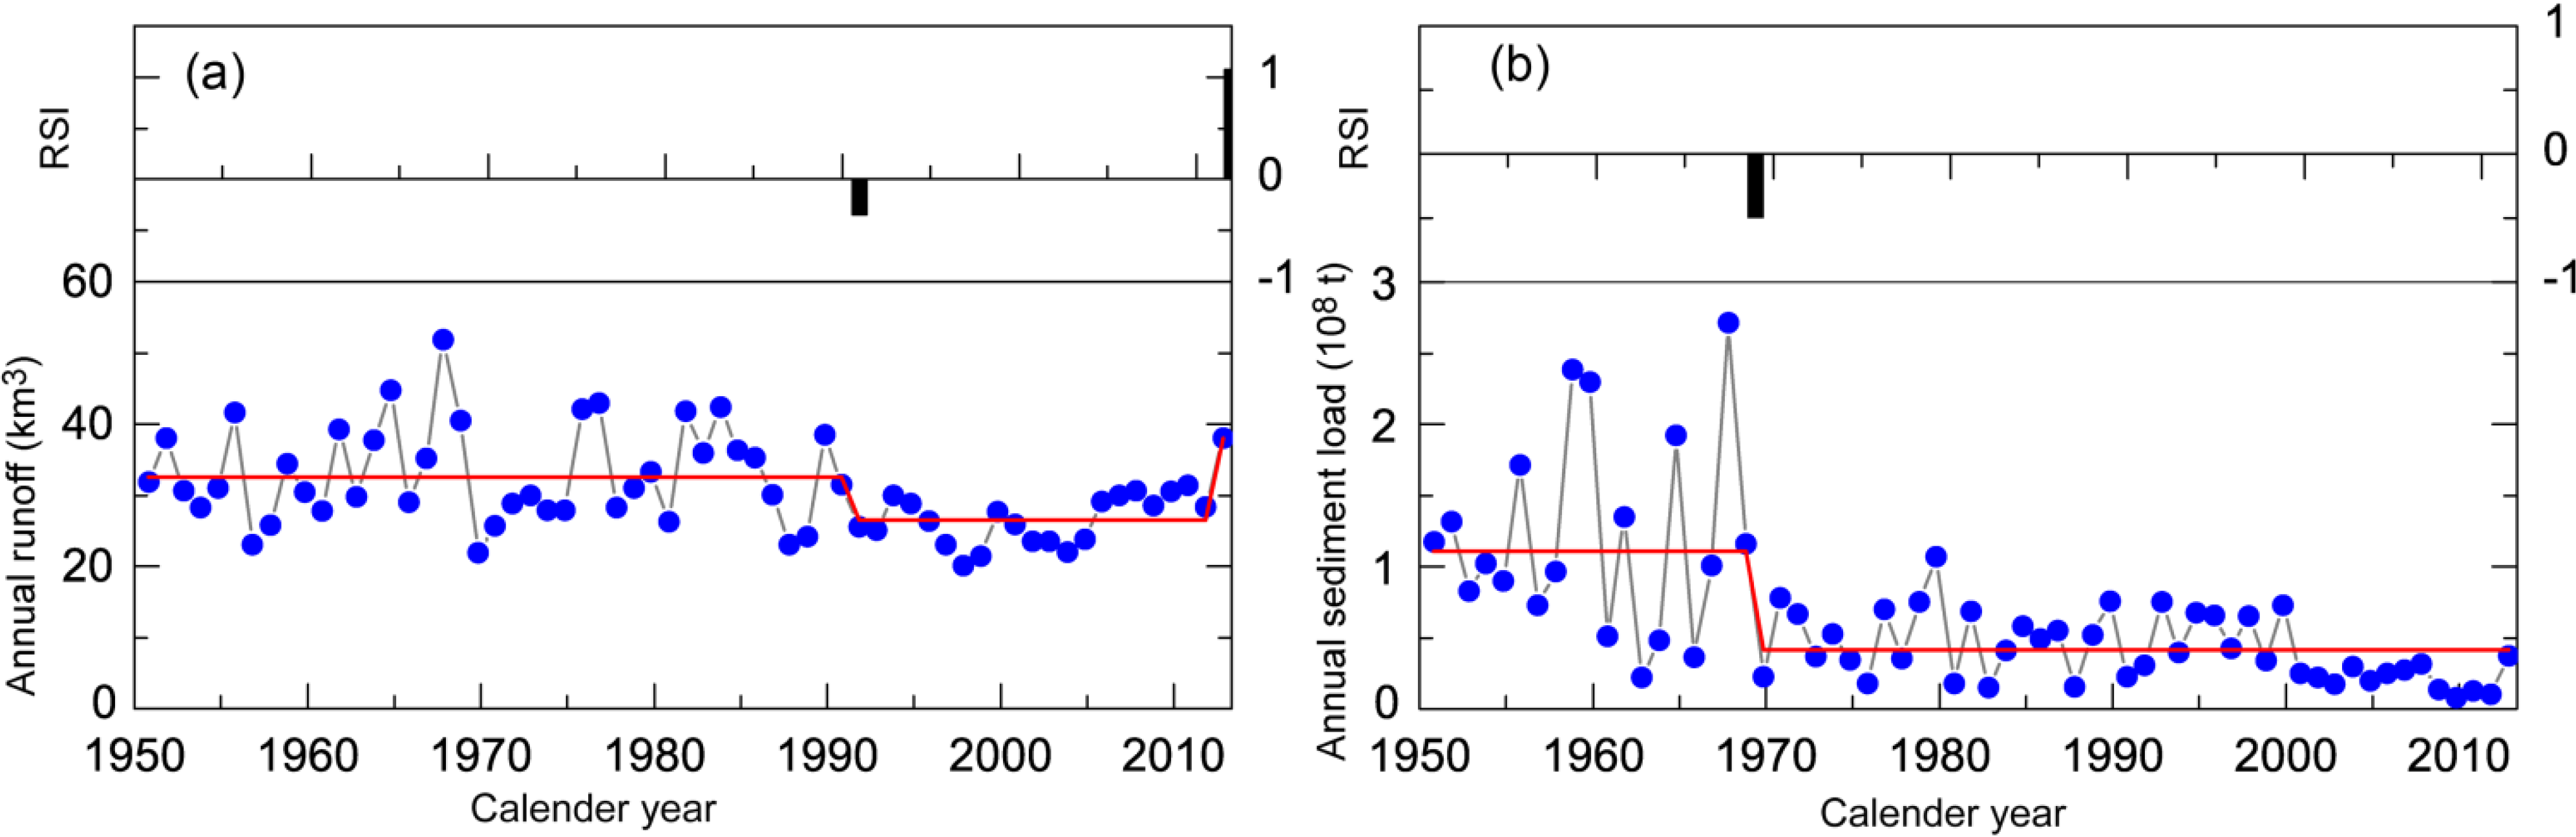
4.1. Upper Drainage Basin

| Stations | Items | RSA | Seasonal Components | Trends (Time/Trends) |
|---|---|---|---|---|
| Tangnaihai | Runoff | 1981 | - | 1950–1981↑,1982–2003↓,2004–2012↑ |
| Sediment | 1981,1990 | - | 1950–1989↑,1990–2012↓ | |
| Lanzhou | Runoff | 1991 | 1986 | 1950–1968↑,1969–1985↑,1986–2012↑ |
| Sediment | 1969 | 1969 | 1950–1960↑,1961–1968↑,1969–2012↓ | |
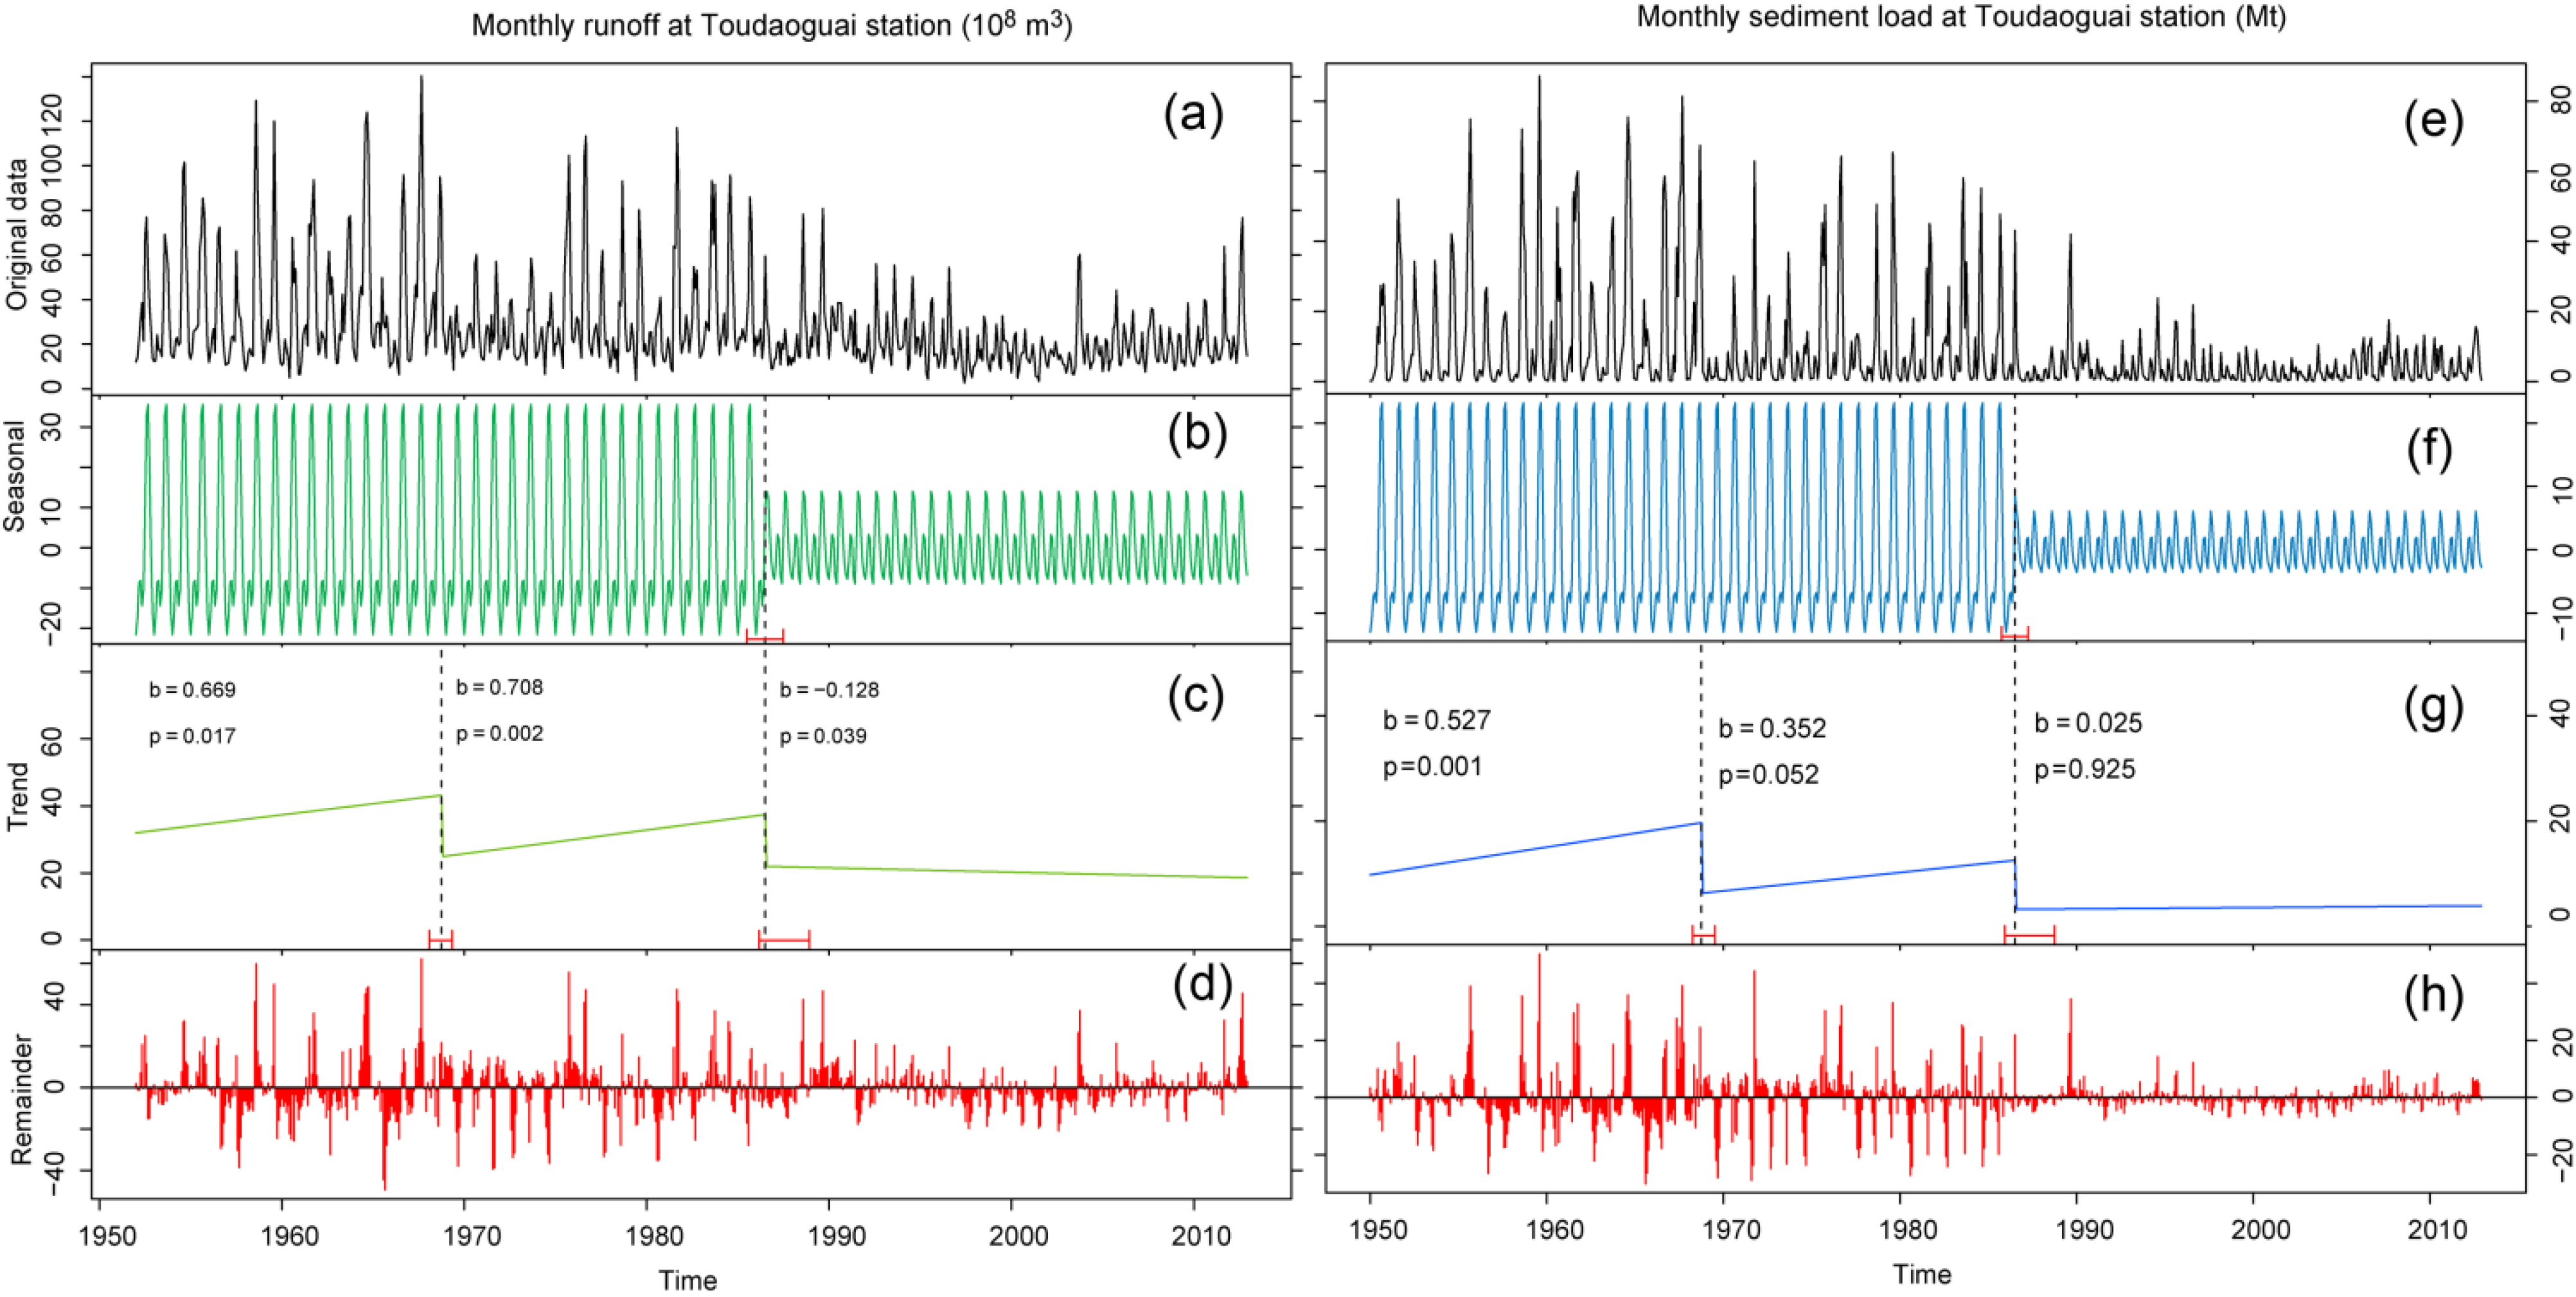
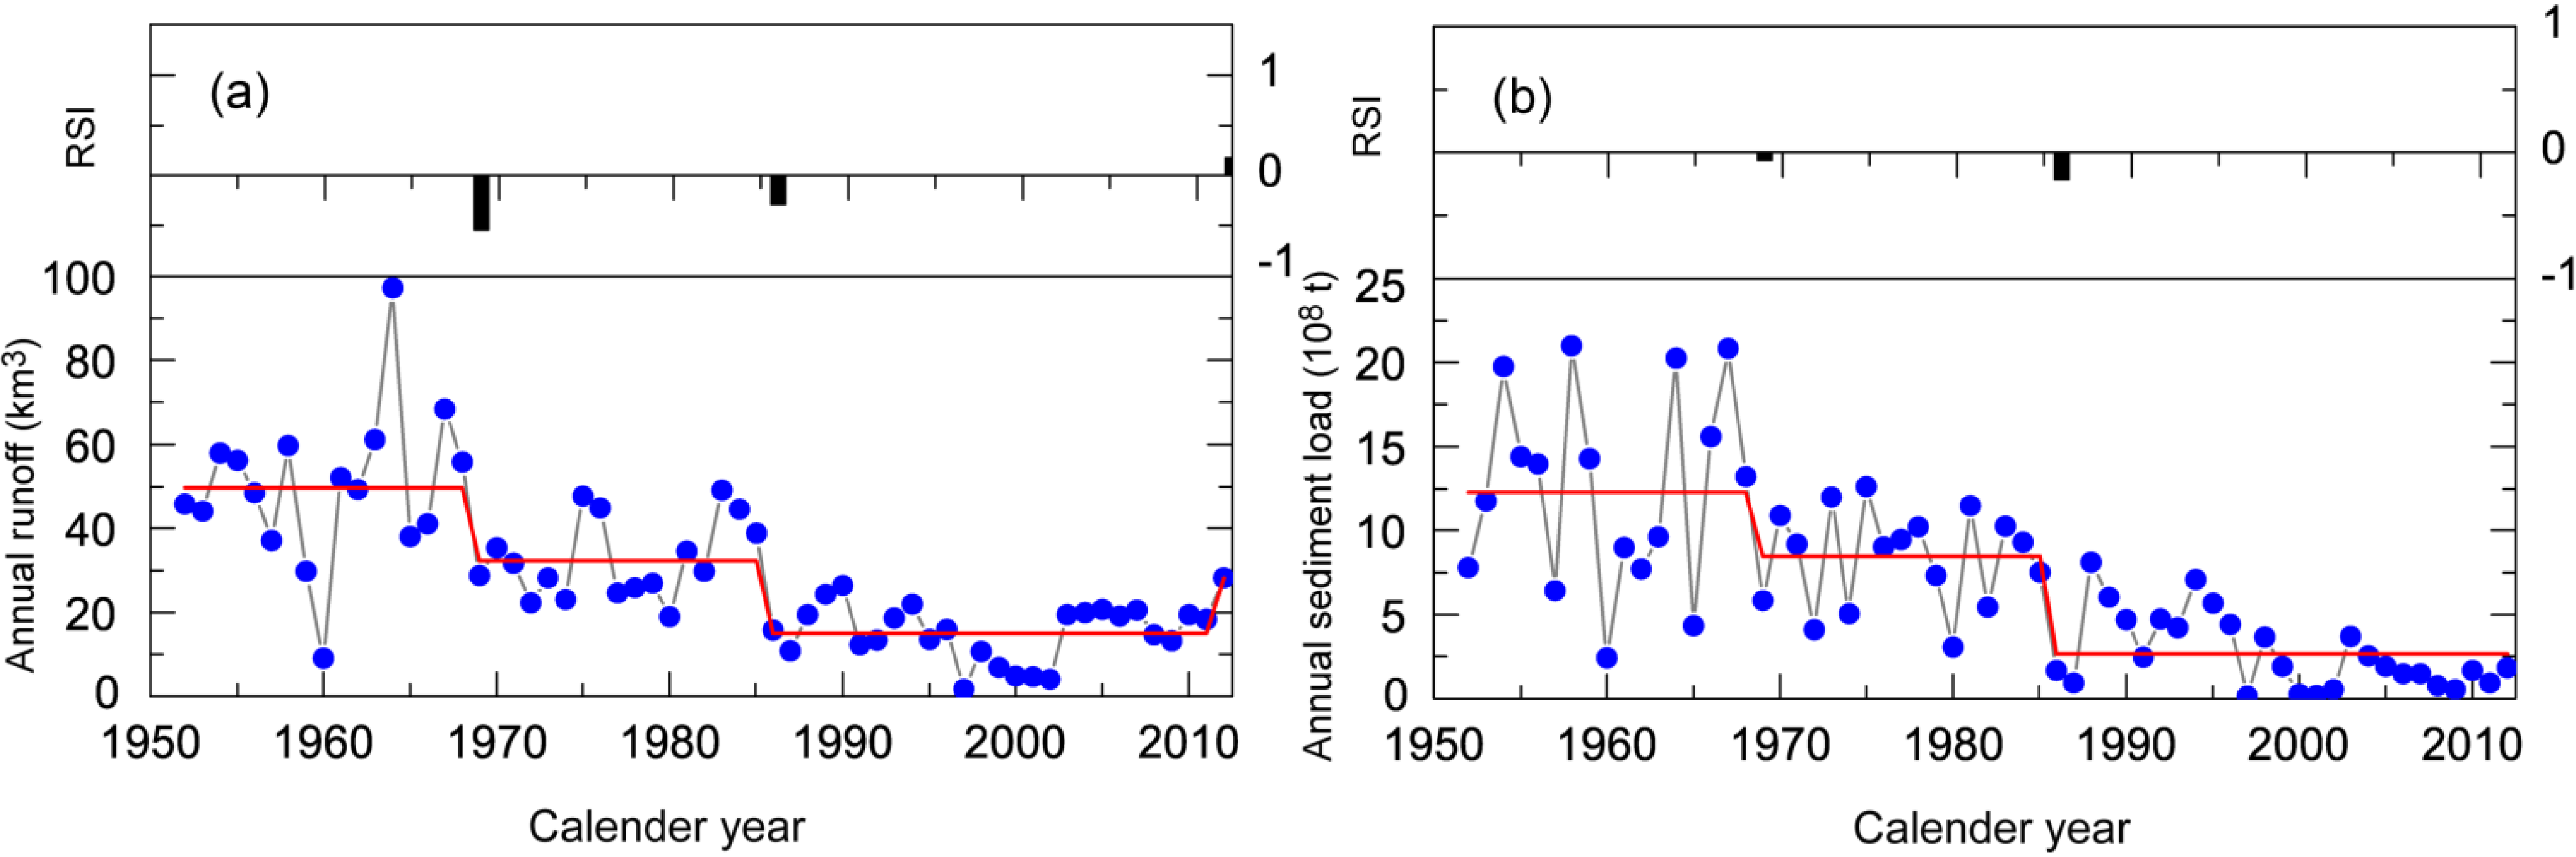
| Toudaoguai | Runoff | 1969,1987 | 1986 | 1950–1968↑,1969–1985↑,1986–2012↓ |
| Sediment | 1969,1988 | 1986 | 1950–1968↑,1969–1985↑,1986–2012↑ | |
| Longmen | Runoff | 1969,1987 | 1986 | 1950–1969↑,1970–1986↑,1987–2012↓ |
| Sediment | 1972,2005 | 1979 | - | |
| Tongguan | Runoff | 1969,1991 | 1986 | 1950–1969↑,1970–1986↑,1987–2012↓ |
| Sediment | 1980, 2004 | 1979 | - | |
| Huayuankou | Runoff | 1969,1991 | 1986 | 1950–1969↑,1970–1986↑,1987–2012↓ |
| Sediment | 1960,1979,2000 | 1996 | 1950–1960↑,1961–1970↑,1971–2012↓ | |
| Gaocun | Runoff | 1969,1991 | 1986 | 1950–1961↓,1961–1981↓,1982–2003↓, 2003–2012↓ |
| Sediment | 1980, 2000 | 1961,1986 | - | |
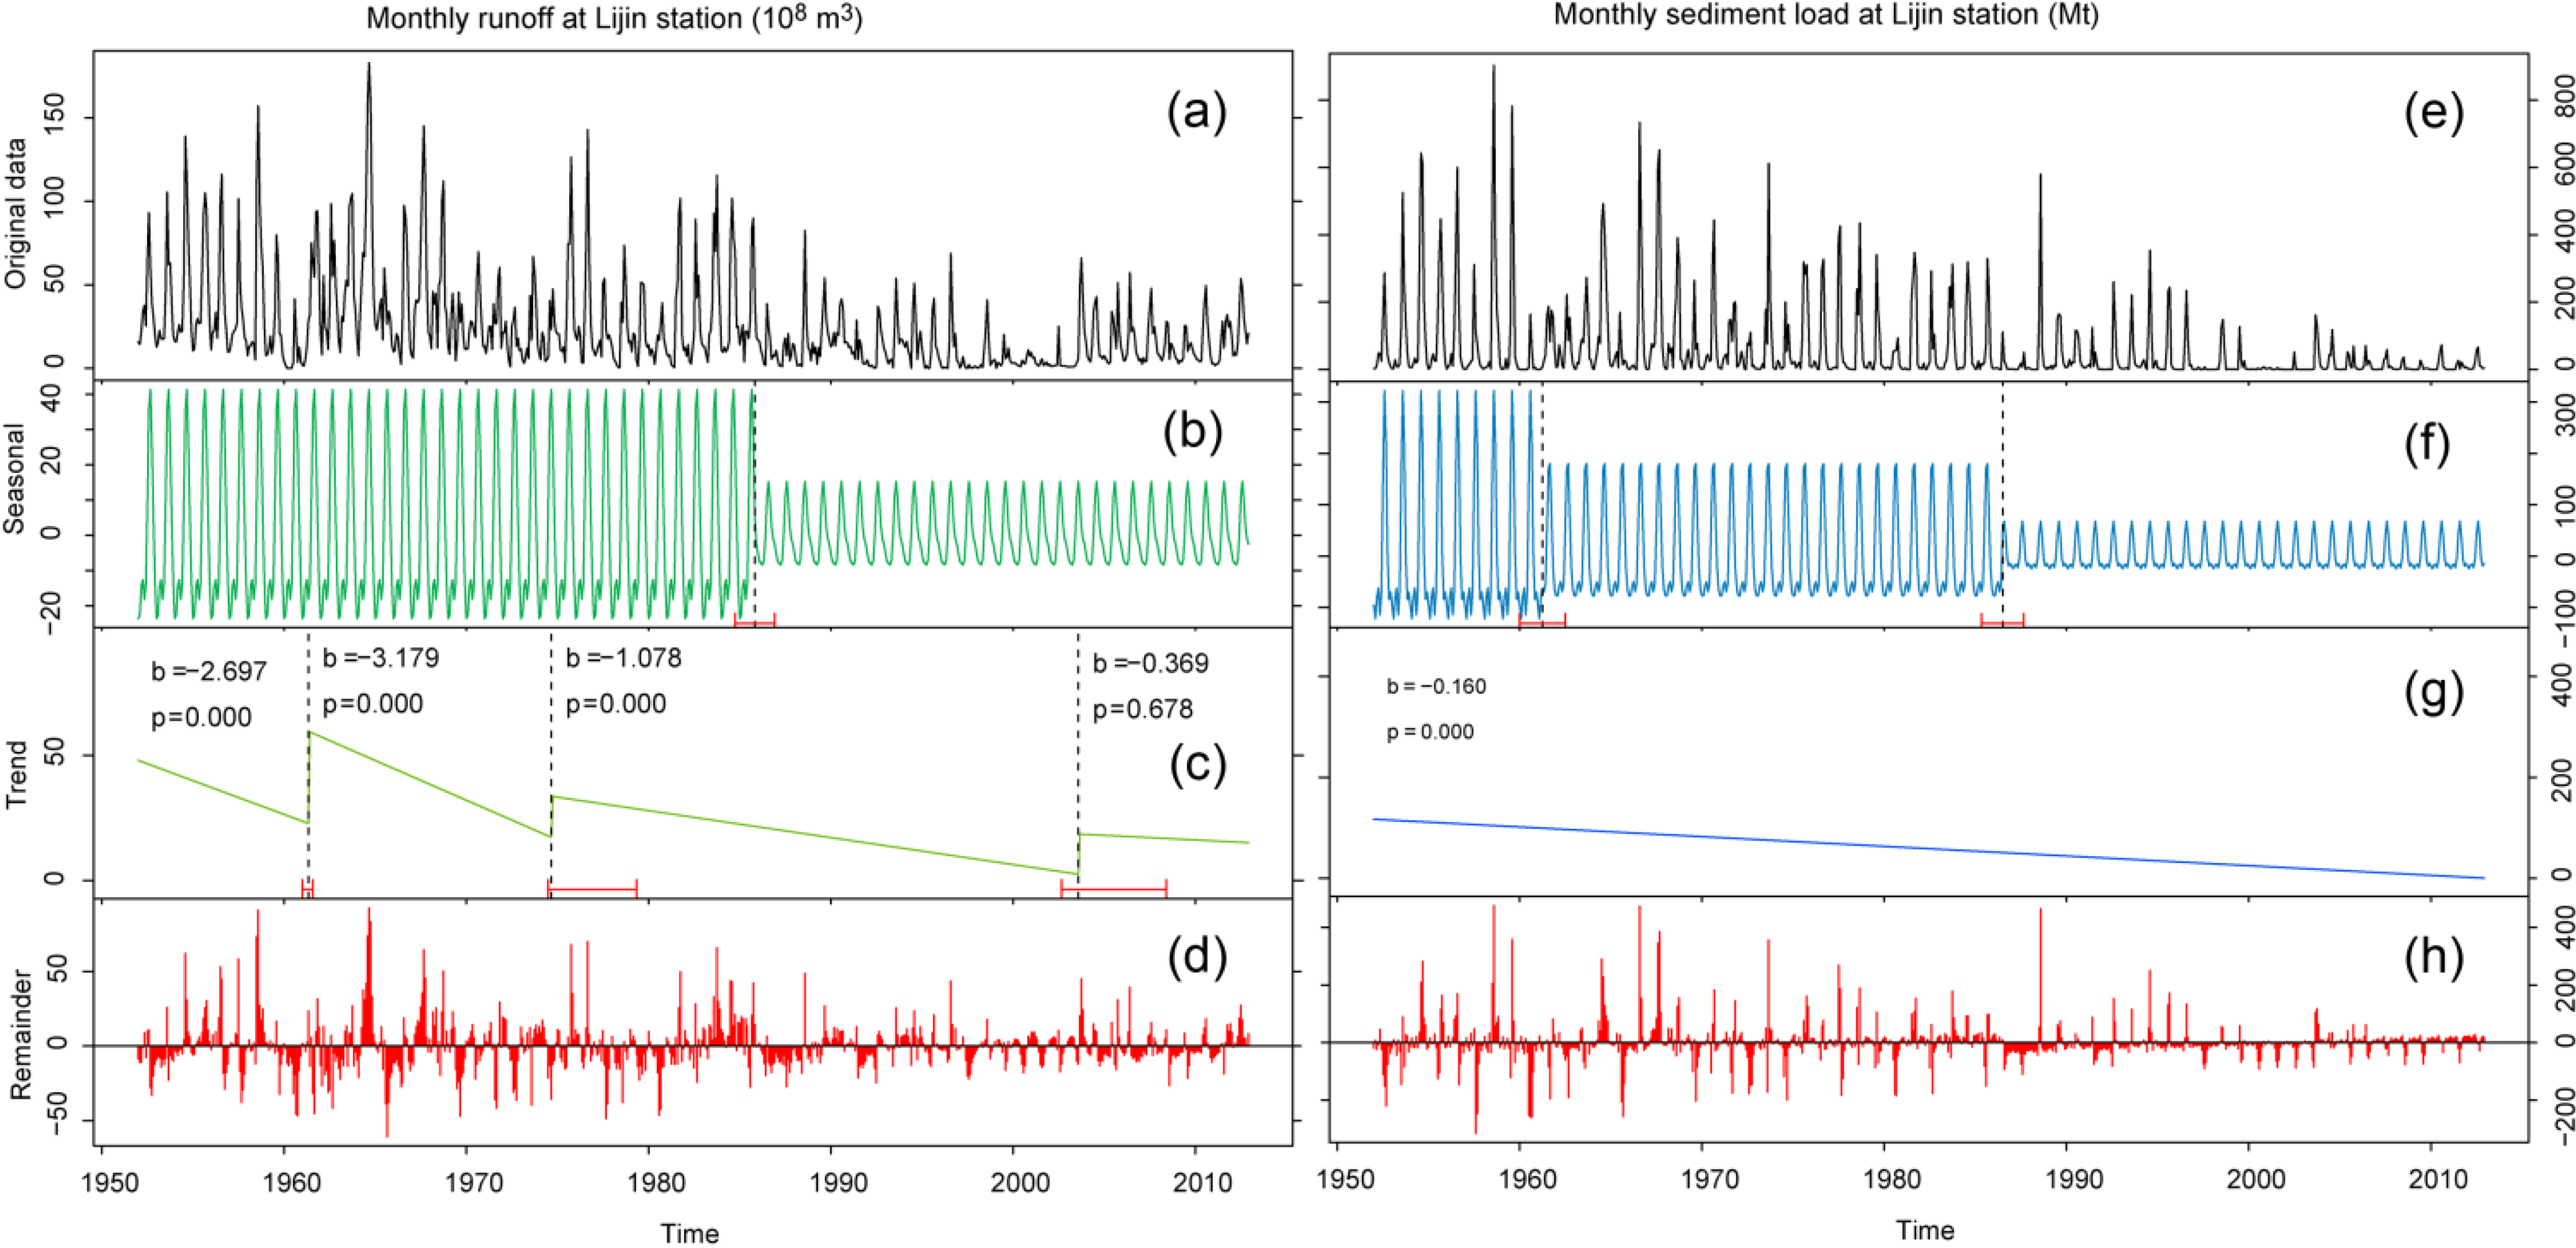
| Lijin | Runoff | 1969,1986 | 1986 | 1950–1961↓,1962–1975↓,1975–2003↓, 2003–2012↓ |
| Sediment | 1969,1986 | 1960,1986 | - |

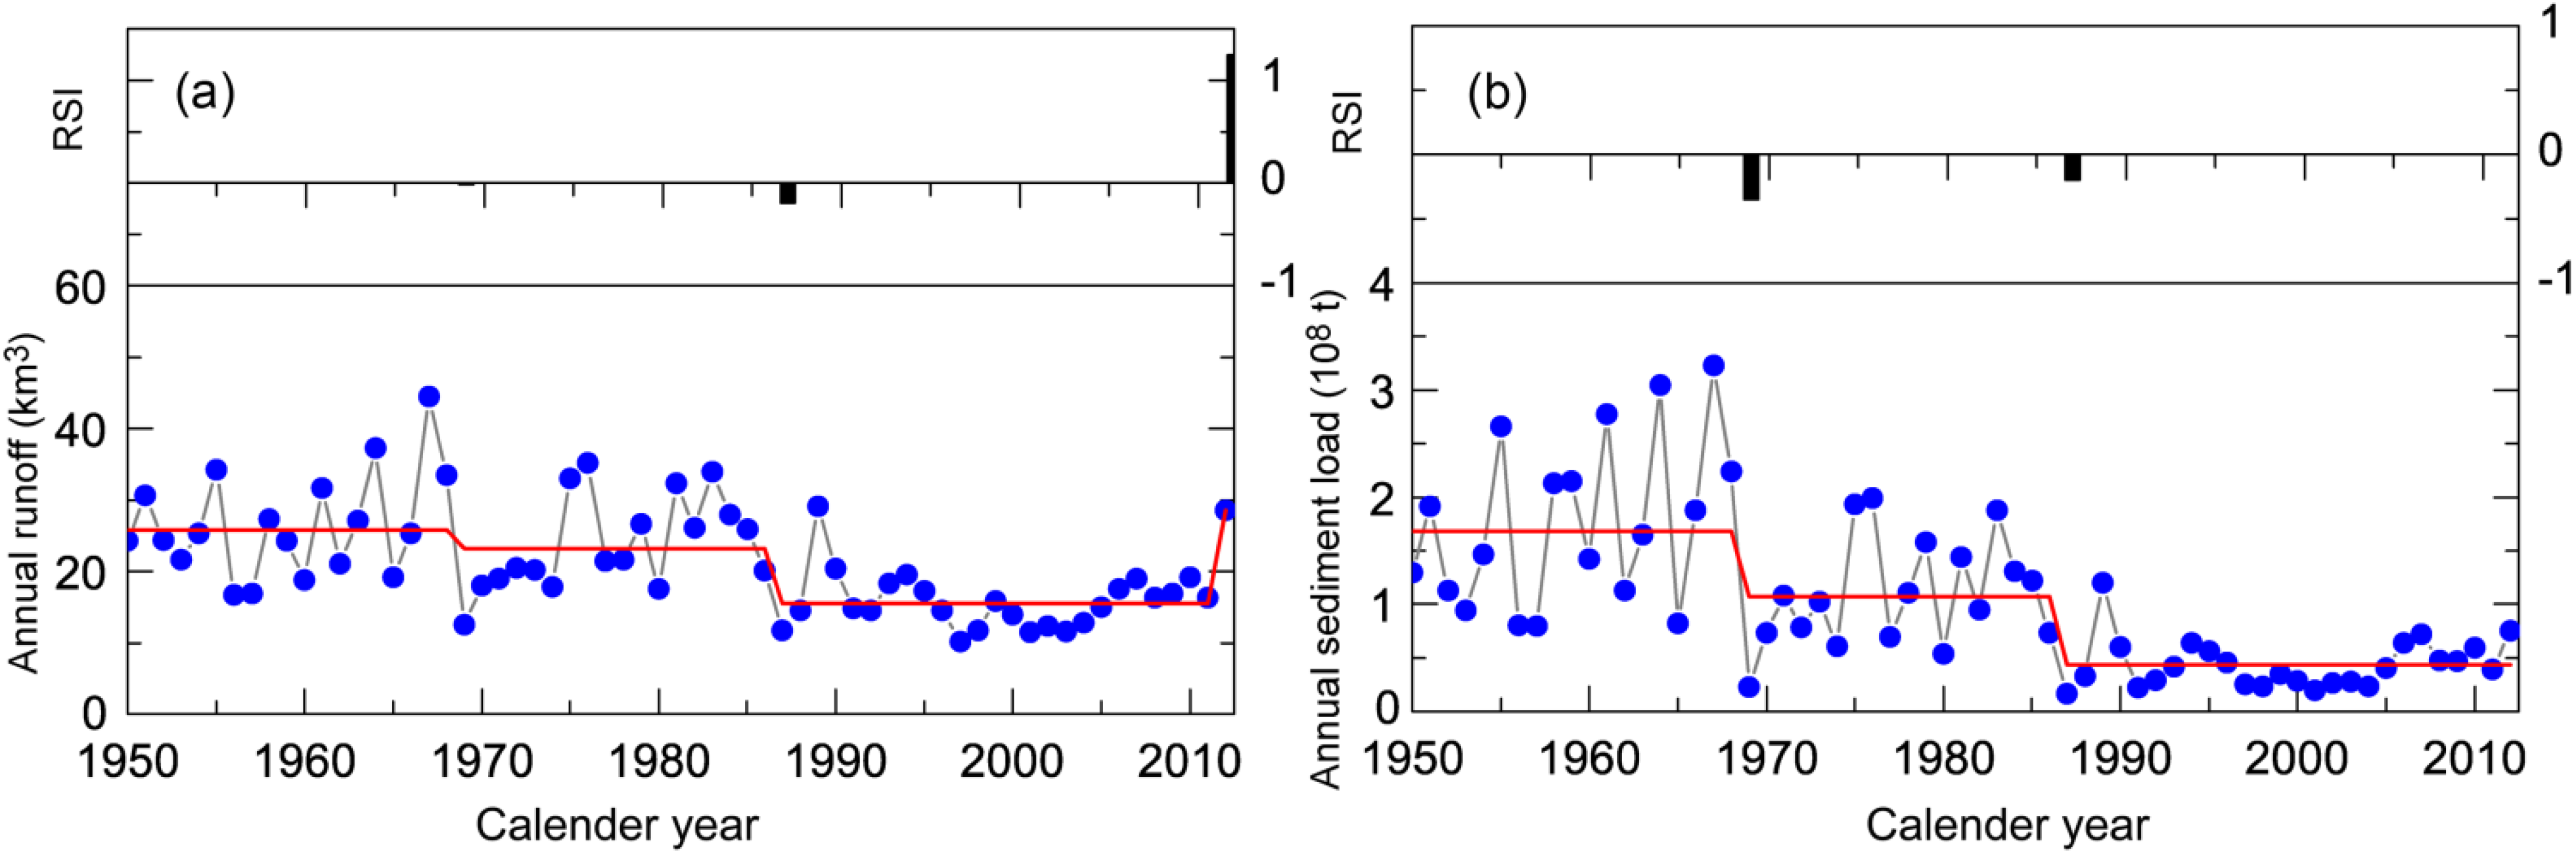
4.2. Middle Drainage Basin


4.3. Lower Drainage Basin


5. Discussion
5.1. Break Points in River Flow and Sediment Regime
5.1.1. Anthropogenic Factors
| Reservoirs | Construction Complete | Total Storage (km3) | Controlled Area (km2) |
|---|---|---|---|
| Longyangxia | 1986 | 24.7 | 13.14 |
| Liujiaxia | 1968 | 5.7 | 18.18 |
| Xiaolangdi | 1999 | 12.7 | 69.42 |
| Sanmenxia | 1960 | 9.6 | 68.88 |
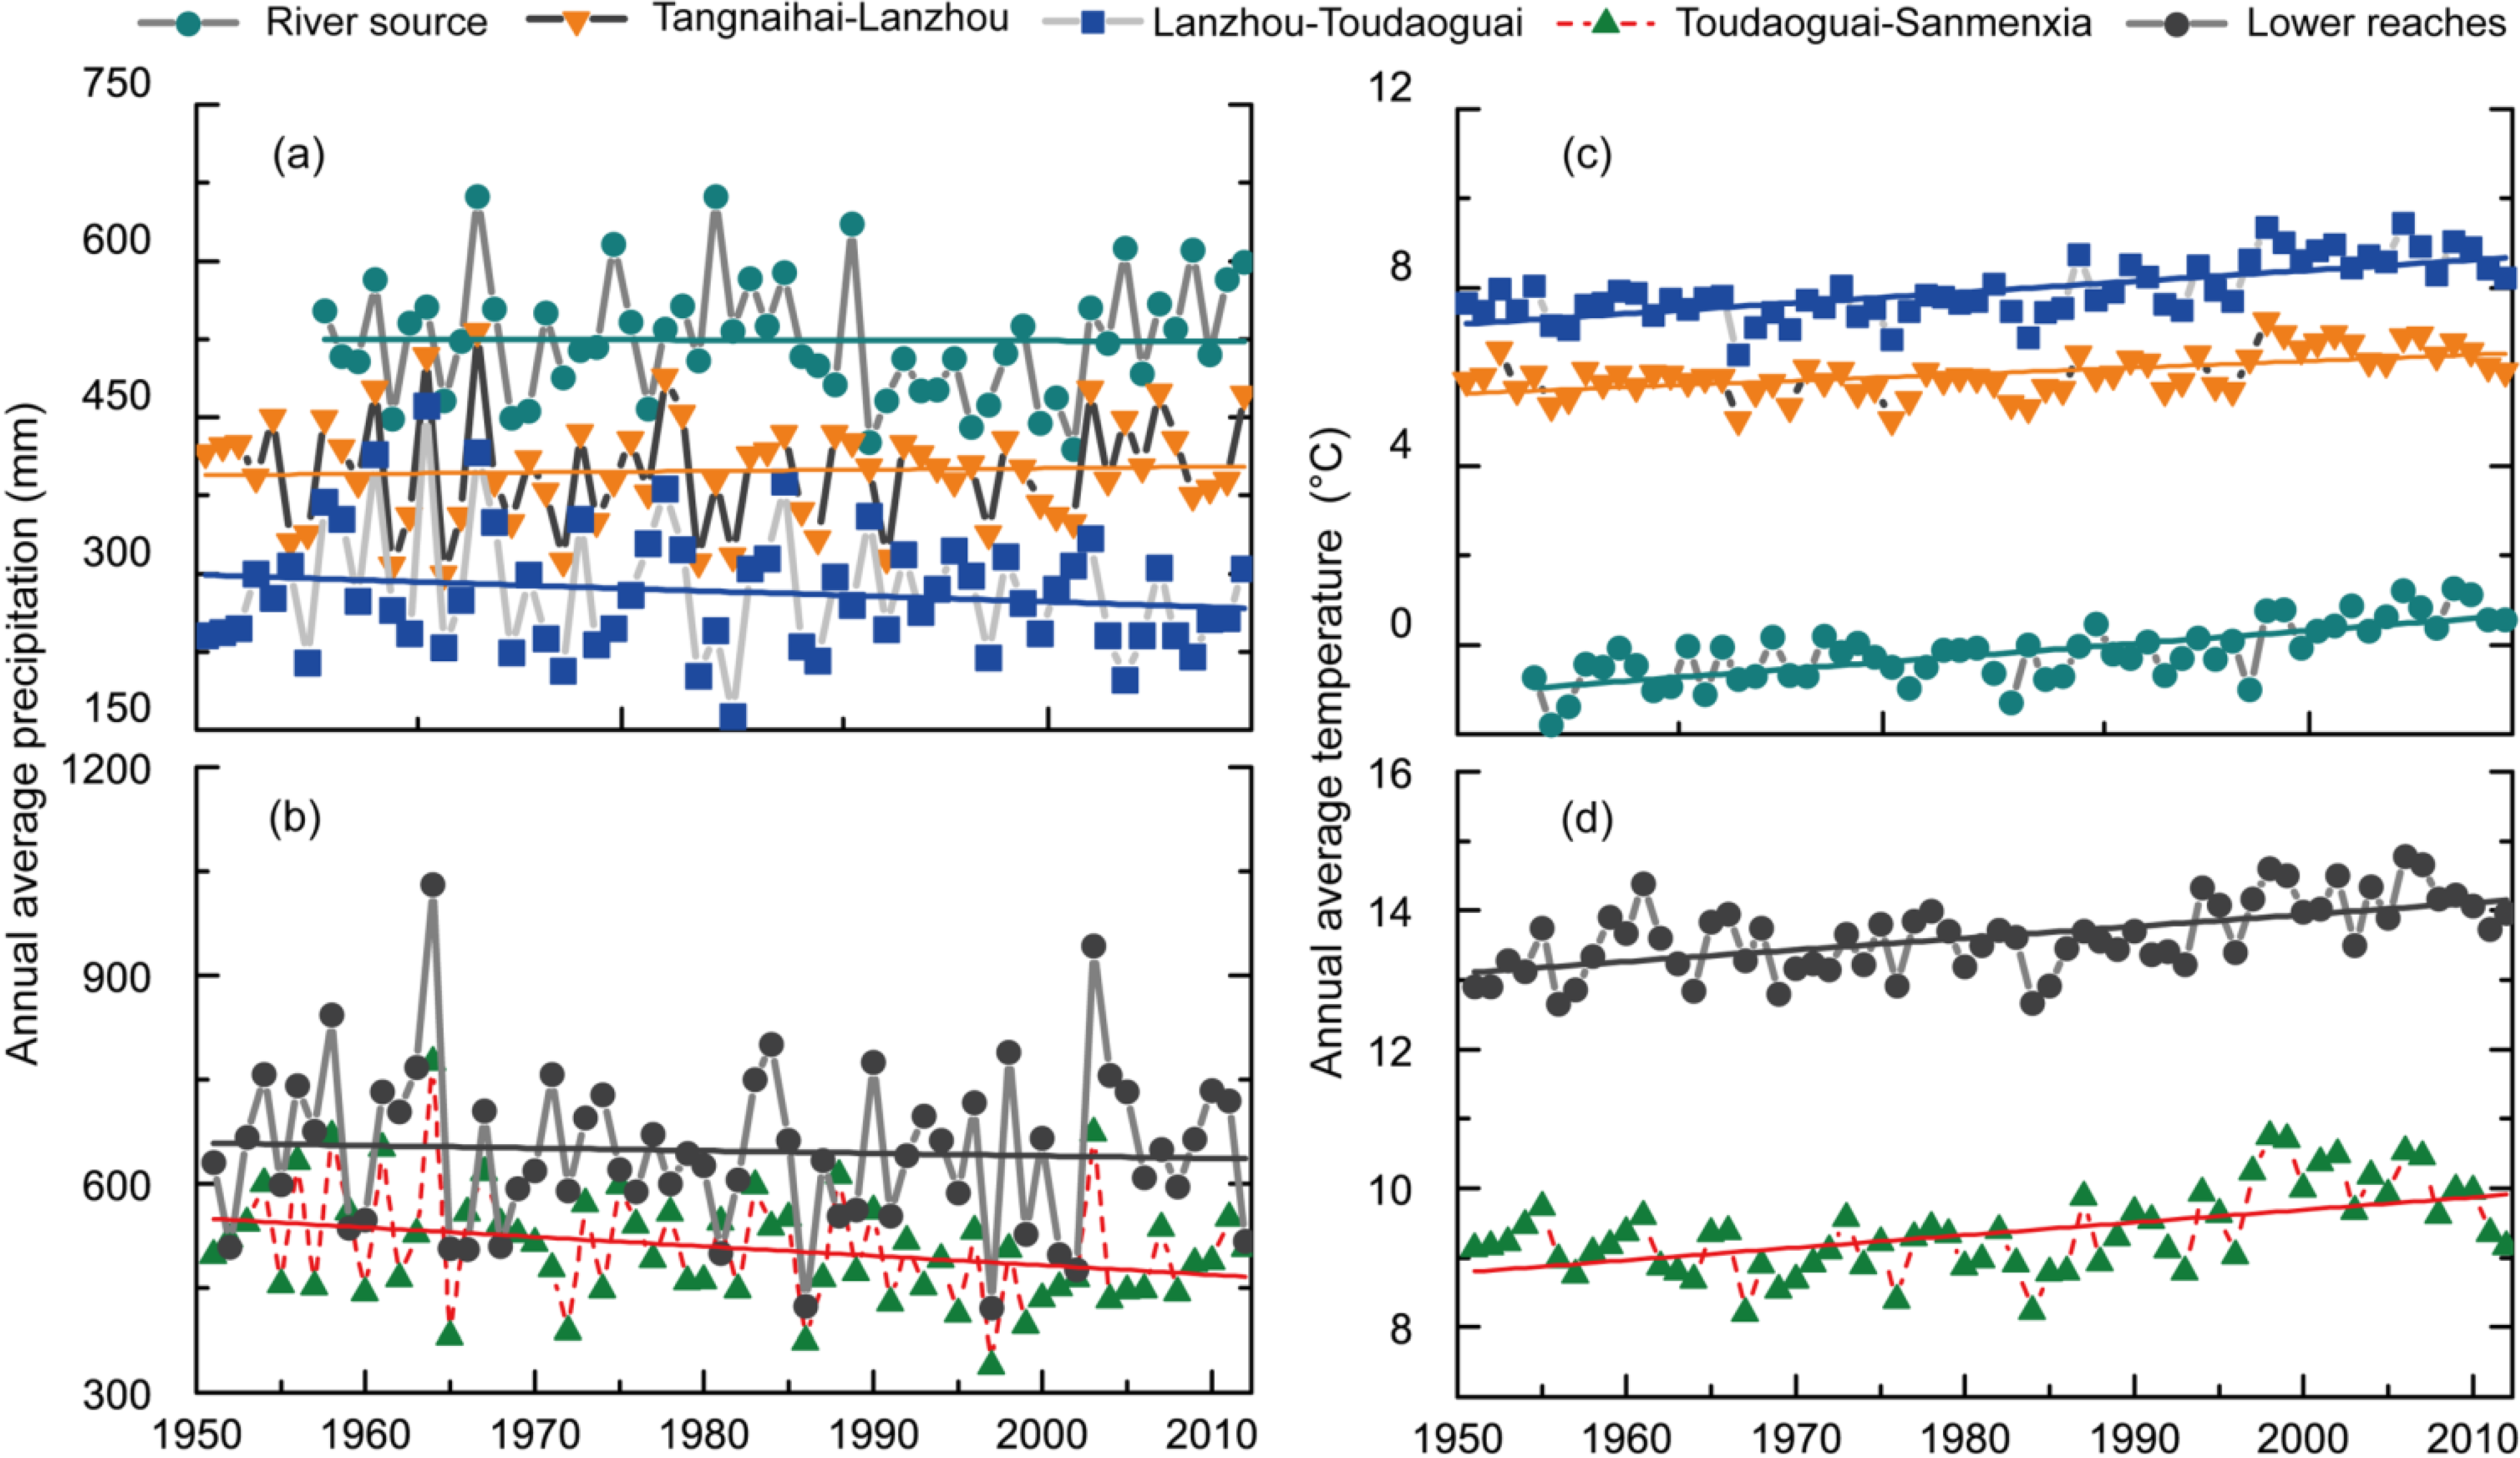
5.1.2. Climate Factors
| Stations | RSA | Linear Trends | ||
|---|---|---|---|---|
| Precipitation | Temperature | Precipitation mm/a | Temperature °C/a | |
| River source | 1988, 2001 | 1998 | −0.043 | 0.028 |
| Tangnaihai-Lanzhou | -- | 1997 | 0.134 | 0.042 |
| Lanzhou-Toudaoguai | -- | 1987, 1997 | −0.516 | 0.057 |
| Toudaoguai-Sanmenxia | 1997 | 1997 | −1.363 | 0.042 |
| Lower reaches | -- | 1959, 1994 | −0.371 | 0.032 |
5.2. Trends in River Flow and Sediment Regime
5.2.1. Anthropogenic Factors
| Annual Mean (1998–2011) (km3/a) | Total | Agriculture | Industry | Other |
|---|---|---|---|---|
| Surface water withdrawal | 35.7 | 28.7 | 3.4 | 3.6 |
| Surface water consumption | 28.6 | 22.9 | 3.9 | 1.7 |
| Ground water withdrawal | 13.2 | 6.7 | 2.5 | 4.0 |
| Ground water consumption | 8.7 | 4.5 | 1.5 | 2.7 |
5.2.2. Climate Factors

5.3. Comparison with Other Large Rivers
6. Conclusions
Acknowledgments
Author Contributions
Conflicts of Interest
References
- McVicar, T.R.; Li, L.; van Niel, T.G.; Zhang, L.; Li, R.; Yang, Q.; Zhang, X.; Mu, X.; Wen, Z.; Liu, W.; et al. Developing a decision support tool for china’s re-vegetation program: Simulating regional impacts of afforestation on average annual streamflow in the loess plateau. For. Ecol. Manag. 2007, 251, 65–81. [Google Scholar] [CrossRef]
- Zhang, L.; Dawes, W.R.; Walker, G.R. Response of mean annual evapotranspiration to vegetation changes at catchment scale. Water Resour. Res. 2001, 37, 701–708. [Google Scholar] [CrossRef]
- Oki, T.; Kanae, S. Global hydrological cycles and world water resources. Science 2006, 313, 1068–1072. [Google Scholar] [CrossRef] [PubMed]
- Liu, Q.; Yang, Z.F. Quantitative estimation of the impact of climate change on actual evapotranspiration in the Yellow River Basin, China. J. Hydrol. 2010, 395, 226–234. [Google Scholar] [CrossRef]
- Xu, Z.X.; Takeuchi, K.; Ishidaira, H.; Zhang, X.W. Sustainability analysis for yellow river water resources using the system dynamics approach. Water Resour. Manag. 2002, 16, 239–261. [Google Scholar] [CrossRef]
- Barnett, T.P.; Pierce, D.W.; Hidalgo, H.G.; Bonfils, C.; Santer, B.D.; Das, T.; Bala, G.; Wood, A.W.; Nozawa, T.; Mirin, A.A.; et al. Human-induced changes in the hydrology of the western united states. Science 2008, 319, 1080–1083. [Google Scholar] [CrossRef]
- Birsan, M.V.; Molnar, P.; Burlando, P.; Pfaundler, M. Streamflow trends in Switzerland. J. Hydrol. 2005, 314, 312–329. [Google Scholar] [CrossRef]
- Jiang, T.; Su, B.; Hartmann, H. Temporal and spatial trends of precipitation and river flow in the Yangtze River Basin, 1961–2000. Geomorphology 2007, 85, 143–154. [Google Scholar] [CrossRef]
- Ye, B.S.; Yang, D.Q.; Kane, D.L. Changes in lena river streamflow hydrology: Human impacts versus natural variations. Water Resour. Res. 2003, 39, 1200. [Google Scholar]
- Nijssen, B.; O’Donnell, G.M.; Hamlet, A.F.; Lettenmaier, D.P. Hydrologic sensitivity of global rivers to climate change. Clim. Chang. 2001, 50, 143–175. [Google Scholar] [CrossRef]
- Wang, H.J.; Yang, Z.S.; Saito, Y.; Liu, J.P.; Sun, X.X.; Wang, Y. Stepwise decreases of the huanghe (Yellow River) sediment load (1950–2005): Impacts of climate change and human activities. Glob. Planet Chang. 2007, 57, 331–354. [Google Scholar] [CrossRef]
- Milly, P.C.D.; Betancourt, J.; Falkenmark, M.; Hirsch, R.M.; Kundzewicz, Z.W.; Lettenmaier, D.P.; Stouffer, R.J. Climate change—Stationarity is dead: Whither water management? Science 2008, 319, 573–574. [Google Scholar] [CrossRef]
- Syvitski, J.P.M.; Vorosmarty, C.J.; Kettner, A.J.; Green, P. Impact of humans on the flux of terrestrial sediment to the global coastal ocean. Science 2005, 308, 376–380. [Google Scholar] [CrossRef] [PubMed]
- Nilsson, C.; Reidy, C.A.; Dynesius, M.; Revenga, C. Fragmentation and flow regulation of the world’s large river systems. Science 2005, 308, 405–408. [Google Scholar] [CrossRef] [PubMed]
- Giordano, M.; Zhu, Z.P.; Cai, X.M.; Hong, S.Q.; Zhang, X.C.; Xue, Y.P. Water Management in the Yellow River Basin: Background, Current Critical Issues and Future Research Needs; Comprehensive Assessment of Water Management in Agriculture Research Report 3; International Water Management Institute (IWMI): Colombo, Sri Lanka, 2004; p. 48. [Google Scholar]
- Xu, J.X. The water fluxes of the Yellow River to the sea in the past 50 years, in response to climate change and human activities. Environ. Manag. 2005, 35, 620–631. [Google Scholar] [CrossRef]
- Zhao, G.; Mu, X.; Wen, Z.; Wang, F.; Gao, P. Soil erosion, conservation, and eco-environment changes in the loess plateau of China. Land Degrad. Dev. 2013, 24, 499–510. [Google Scholar]
- Zhao, G.J.; Mu, X.M.; Tian, P.; Jiao, J.Y.; Wang, F. Have conservation measures improved Yellow River health? J. Soil Water Conserv. 2013, 68, 159A–161A. [Google Scholar] [CrossRef]
- Yang, D.W.; Li, C.; Hu, H.P.; Lei, Z.D.; Yang, S.X.; Kusuda, T.; Koike, T.; Musiake, K. Analysis of water resources variability in the Yellow River of china during the last half century using historical data. Water Resour. Res. 2004, 40, W06502. [Google Scholar]
- Yao, W.Y.; Xu, J.H.; Ran, D.C. Assessment of Changing Trends in Streamflow and Sediment Fluxes in the Yellow River Basin; Yellow River Conservancy Press: Zhengzhou, China, 2011. (In Chinese) [Google Scholar]
- Zheng, H.X.; Zhang, L.; Liu, C.M.; Shao, Q.X.; Fukushima, Y. Changes in stream flow regime in headwater catchments of the Yellow River Basin since the 1950s. Hydrol. Process. 2007, 21, 886–893. [Google Scholar] [CrossRef]
- Fu, G.B.; Charles, S.P.; Chiew, F.H.S. A two-parameter climate elasticity of streamflow index to assess climate change effects on annual streamflow. Water Resour. Res. 2007, 43, W11419. [Google Scholar]
- Mu, X.M.; Zhang, X.Q.; Shao, H.B.; Gao, P.; Wang, F.; Jiao, J.Y.; Zhu, J.L. Dynamic changes of sediment discharge and the influencing factors in the Yellow River, China, for the recent 90 years. Clean-Soil Air Water 2012, 40, 303–309. [Google Scholar] [CrossRef]
- Wang, Y.; Ding, Y.J.; Ye, B.S.; Wang, J.; Wang, J. Contributions of climate and human activities to changes in runoff of the yellow and Yangtze Rivers from 1950 to 2008. Sci. China 2013, 56, 1398–1412. [Google Scholar] [CrossRef]
- Xu, J.X.; Ma, Y.X. Response of the hydrological regime of the Yellow River to the changing monsoon intensity and human activity. Hydrol. Sci. J. 2009, 54, 90–100. [Google Scholar] [CrossRef]
- Sato, Y.; Ma, X.Y.; Xu, J.Q.; Matsuoka, M.; Zheng, H.X.; Liu, C.M.; Fukushima, Y. Analysis of long-term water balance in the source area of the Yellow River Basin. Hydrol. Process. 2008, 22, 1618–1629. [Google Scholar] [CrossRef]
- Xia, C.; Pahl-Wostl, C. The development of water allocation management in the Yellow River Basin. Water Resour. Manag. 2012, 26, 3395–3414. [Google Scholar] [CrossRef]
- Liu, Y.B.; Wu, G.P.; Zhao, X.S. Recent declines in China’s largest freshwater lake: Trend or regime shift? Environ. Res. Lett. 2013, 8, 014010. [Google Scholar] [CrossRef]
- YRCC (Yellow River Conservancy Committee). Hydrologic Year Books of the Yellow River; Yellow River Conservancy Press: Zhengzhou, China, 1997. [Google Scholar]
- Ministry of Water Resources of P.R. China (CMWR). Programming for Check Dams in the Loess Plateau; CMWR: Beijing, China, 2003; pp. 47–48. [Google Scholar]
- Rodionov, S.N. Use of prewhitening in climate regime shift detection. Geophys. Res. Lett. 2006, 33. [Google Scholar] [CrossRef]
- Verbesselt, J.; Hyndman, R.; Newnham, G.; Culvenor, D. Detecting trend and seasonal changes in satellite image time series. Remote Sens. Environ. 2010, 114, 106–115. [Google Scholar] [CrossRef]
- Verbesselt, J.; Hyndman, R.; Zeileis, A.; Culvenor, D. Phenological change detection while accounting for abrupt and gradual trends in satellite image time series. Remote Sens. Environ. 2010, 114, 2970–2980. [Google Scholar] [CrossRef]
- Zeileis, A. A unified approach to structural change tests based on ML scores, F statistics, and OLS residuals. Econom. Rev. 2005, 24, 445–466. [Google Scholar] [CrossRef]
- Bai, J.S.; Perron, P. Estimating and testing linear models with multiple structural changes. Econometrica 1998, 66, 47–78. [Google Scholar] [CrossRef]
- Andersen, T.; Carstensen, J.; Hernandez-Garcia, E.; Duarte, C.M. Ecological thresholds and regime shifts: Approaches to identification. Trends Ecol. Evol. 2009, 24, 49–57. [Google Scholar] [CrossRef] [PubMed]
- Zhang, J.J.; Ji, W.H.; Feng, X.D. Study of Runoff and Sediment Load Changes in Wuding River Basin: Present, Causes and Future Trends. In Study of Changes in Runoff and Sediment Load in the Yellow River; Wang, G., Fan, Z., Eds.; Yellow River Water Conservancy Press: Zhengzhou, China, 2002; Volume 2, pp. 393–429. [Google Scholar]
- Zhang, X.P.; Zhang, L.; Zhao, J.; Rustomji, P.; Hairsine, P. Responses of streamflow to changes in climate and land use/cover in the loess plateau, China. Water Resour. Res. 2008, 44. [Google Scholar] [CrossRef]
- Liu, Q.; Yang, Z.F.; Cui, B.S. Spatial and temporal variability of annual precipitation during 1961–2006 in Yellow River Basin, China. J. Hydrol. 2008, 361, 330–338. [Google Scholar] [CrossRef]
- He, B.; Miao, C.Y.; Shi, W. Trend, abrupt change, and periodicity of streamflow in the mainstream of yellow river. Environ. Monit. Assess. 2013, 185, 6187–6199. [Google Scholar] [CrossRef] [PubMed]
- Liu, C.M.; Zhang, X.C. Causal analysis on actual water flow reduction in the mainstream of the Yellow River. Acta Geogr. Sin. 2004, 59, 323–330. [Google Scholar]
- Yellow River Conservancy Commission (YRCC). Yellow River Water Resources Bulletin. Available online: http://www.Yellowriver.Gov.Cn/other/hhgb/ (accessed on 3 November 2013).
- Zhao, F.F.; Xu, Z.X.; Zhang, L.; Zuo, D.P. Streamflow response to climate variability and human activities in the upper catchment of the Yellow River Basin. Sci. China Ser. E 2009, 52, 3249–3256. [Google Scholar] [CrossRef]
- Zhang, S.; Wang, Y.; Zhao, Y.; Huang, Y. Permafrost degradation and its environmental sequent in the source regions of the yellow river. J. Glaciol. Geocryol. 2004, 26, 1–6. [Google Scholar]
- Mu, X.M.; Zhang, L.; McVicar, T.R.; Chille, B.S.; Gau, P. Analysis of the impact of conservation measures on stream flow regime in catchments of the loess plateau, China. Hydrol. Process. 2007, 21, 2124–2134. [Google Scholar] [CrossRef]
- Yang, Z.F.; Liu, Q. Response of streamflow to climate changes in the Yellow River Basin, China. J. Hydrometeorol. 2011, 12, 1113–1126. [Google Scholar] [CrossRef]
- Zhao, G.J.; Mu, X.M.; Alex, S.; Tian, P. Temporal variation of streamflow, sediment load and their relationship in the Yellow River Basin, China. PLoS ONE 2014, 9, e91048. [Google Scholar] [CrossRef] [PubMed]
- Liu, C.; Sui, J.Y.; Wang, Z.Y. Sediment load reduction in Chinese Rivers. Int. J. Sediment. Res. 2008, 23, 44–55. [Google Scholar] [CrossRef]
- Wang, H.J.; Saito, Y.; Zhang, Y.; Bi, N.S.; Sun, X.X.; Yang, Z.S. Recent changes of sediment flux to the western pacific ocean from major rivers in east and southeast asia. Earth-Sci. Rev. 2011, 108, 80–100. [Google Scholar] [CrossRef]
- Meade, R.H.; Moody, J.A. Causes for the decline of suspended-sediment discharge in the Mississippi River system, 1940–2007. Hydrol. Process. 2010, 24, 35–49. [Google Scholar]
- Horowitz, A.J. A quarter century of declining suspended sediment fluxes in the Mississippi River and the effect of the 1993 flood. Hydrol. Process. 2010, 24, 13–34. [Google Scholar]
© 2014 by the authors; licensee MDPI, Basel, Switzerland. This article is an open access article distributed under the terms and conditions of the Creative Commons Attribution license (http://creativecommons.org/licenses/by/4.0/).
Share and Cite
Wang, F.; Zhao, G.; Mu, X.; Gao, P.; Sun, W. Regime Shift Identification of Runoff and Sediment Loads in the Yellow River Basin, China. Water 2014, 6, 3012-3032. https://doi.org/10.3390/w6103012
Wang F, Zhao G, Mu X, Gao P, Sun W. Regime Shift Identification of Runoff and Sediment Loads in the Yellow River Basin, China. Water. 2014; 6(10):3012-3032. https://doi.org/10.3390/w6103012
Chicago/Turabian StyleWang, Fei, Guangju Zhao, Xingmin Mu, Peng Gao, and Wenyi Sun. 2014. "Regime Shift Identification of Runoff and Sediment Loads in the Yellow River Basin, China" Water 6, no. 10: 3012-3032. https://doi.org/10.3390/w6103012