the Creative Commons Attribution 4.0 License.
the Creative Commons Attribution 4.0 License.
 | 22 Apr 2020
GreenhousePeat: a model linking CO2 emissions from subsiding peatlands to changing groundwater levels
Arnoud Frumau
Jan Stafleu
Joris Dijkstra
Arjan Hensen
Ilona Velzeboer
Joana Esteves Martins
Willem Jan Zaadnoordijk
Oxidation of organic matter in peat above the phreatic groundwater table causes subsidence and carbon dioxide (CO2) emissions. Because 25 % of the Netherlands has shallow peat layers in its subsurface, it is essential for Dutch policy makers and stakeholders to have reliable information on present day and near future CO2 emissions under changes in groundwater levels. Furthermore, it is important to reduce greenhouse gas emissions in view of international agreements.
We are developing GreenhousePeat: a nationwide model that synthesizes information on peat organic carbon content, land subsidence, and CO2 emission monitoring to model present-day and future CO2 emissions from subsiding peatlands.
Here, we discuss the approach and input data of GreenhousePeat. GreenhousePeat is based on a UNFCCC approved model to predict CO2 emissions, albeit based on new input data: 3-D organic matter maps, nationwide subsidence rates, and ranges in oxidation fraction. We validate model outcomes with previously documented CO2 emissions measured at four different locations. We found that for one site the upper bound of the model reproduces the measured CO2 emissions. The modelled emissions at two sites have a relative deviation of approximately 73 % to 29 % from the measured emissions. Whereas one site is a net CO2 sink, although low emissions were modelled. Finally, we conclude on the suitability of the model for CO2 emission forecasting and suggest improvements by incorporating groundwater level information and land use type.


Many peatlands in densely populated areas are drained to enable agriculture and to prevent residential areas from inundating (Gambolati et al., 2006; Hooijer et al., 2012). Drainage results in oxidation of organic matter. Consequently, peatlands have been strong net sources of carbon dioxide (CO2) with subsidence accompanying the process (Deverel et al., 2016). Subsidence and CO2 emissions became continuous processes, because water management maintains phreatic groundwater levels below the progressively lowering surface.
The Netherlands is a prime example of an area with substantial peat oxidation, where the shallow subsurface contains about 15 km3 of peat, covering 25 % of the surface area (TNO-GSN, 2019) (Fig. 1). Previous studies estimate that peat oxidation is responsible for 2 % of all CO2 emissions in the Netherlands (Van den Akker et al., 2008; Arets et al., 2019). The National Inventory Report (NIR, 2019) for greenhouse gas (GHG) emissions has adopted Dutch specific CO2 emission factors for drained organic soils due to peat oxidation of 19 and 13 t CO2 ha−1 yr−1 (Arets et al., 2019), depending on organic matter content and subsidence rates. The annual CO2 emission reported for the estimated 223 kha of surficial peat in the Netherlands is 4.246 Mton yr−1 with an average CO2 emission for each mm of subsidence of 2.26 t CO2 ha−1 yr−1 (Kuikman et al., 2005; Arets et al., 2019).
Reducing CO2 emissions is a major challenge for our society. The Dutch government committed itself to the COP21 – CPM11 Paris climate agreement, in which it is stated that CO2 emission has to be reduced with 49 % in 2030 and 95 % in 2050 (UNTC, 2016). In light of this agreement, Dutch policymakers should have a strong focus on reducing CO2 emissions from peatlands. If the Netherlands is not drastically changing its groundwater policy, subsidence and CO2 emissions by peat oxidation will sustain and may become a hazard.
We are developing GreenhousePeat: a nationwide model for the Netherlands to forecast CO2 emissions from subsiding peatlands. The output of GreenhousePeat consists of CO2 emission forecasts under selected changes in groundwater levels and climate, for example as a result of extreme droughts. At present, the model is based on an existing UNFCCC approved model to predict CO2 emissions. GreenhousePeat is beneficial for policymakers, water managers, agricultural organizations, and spatial planners because the results are implementable in decision-making strategies to mitigate future CO2 emissions. These strategies will also be vital to meet international agreements.
Here, we introduce the approach and input data of GreenhousePeat, provide a brief overview of CO2 emission measurements in the Netherlands, and report on the ability of GreenhousePeat to reproduce CO2 emissions previously measured at four sites using new datasets on peat organic matter and subsidence rates.
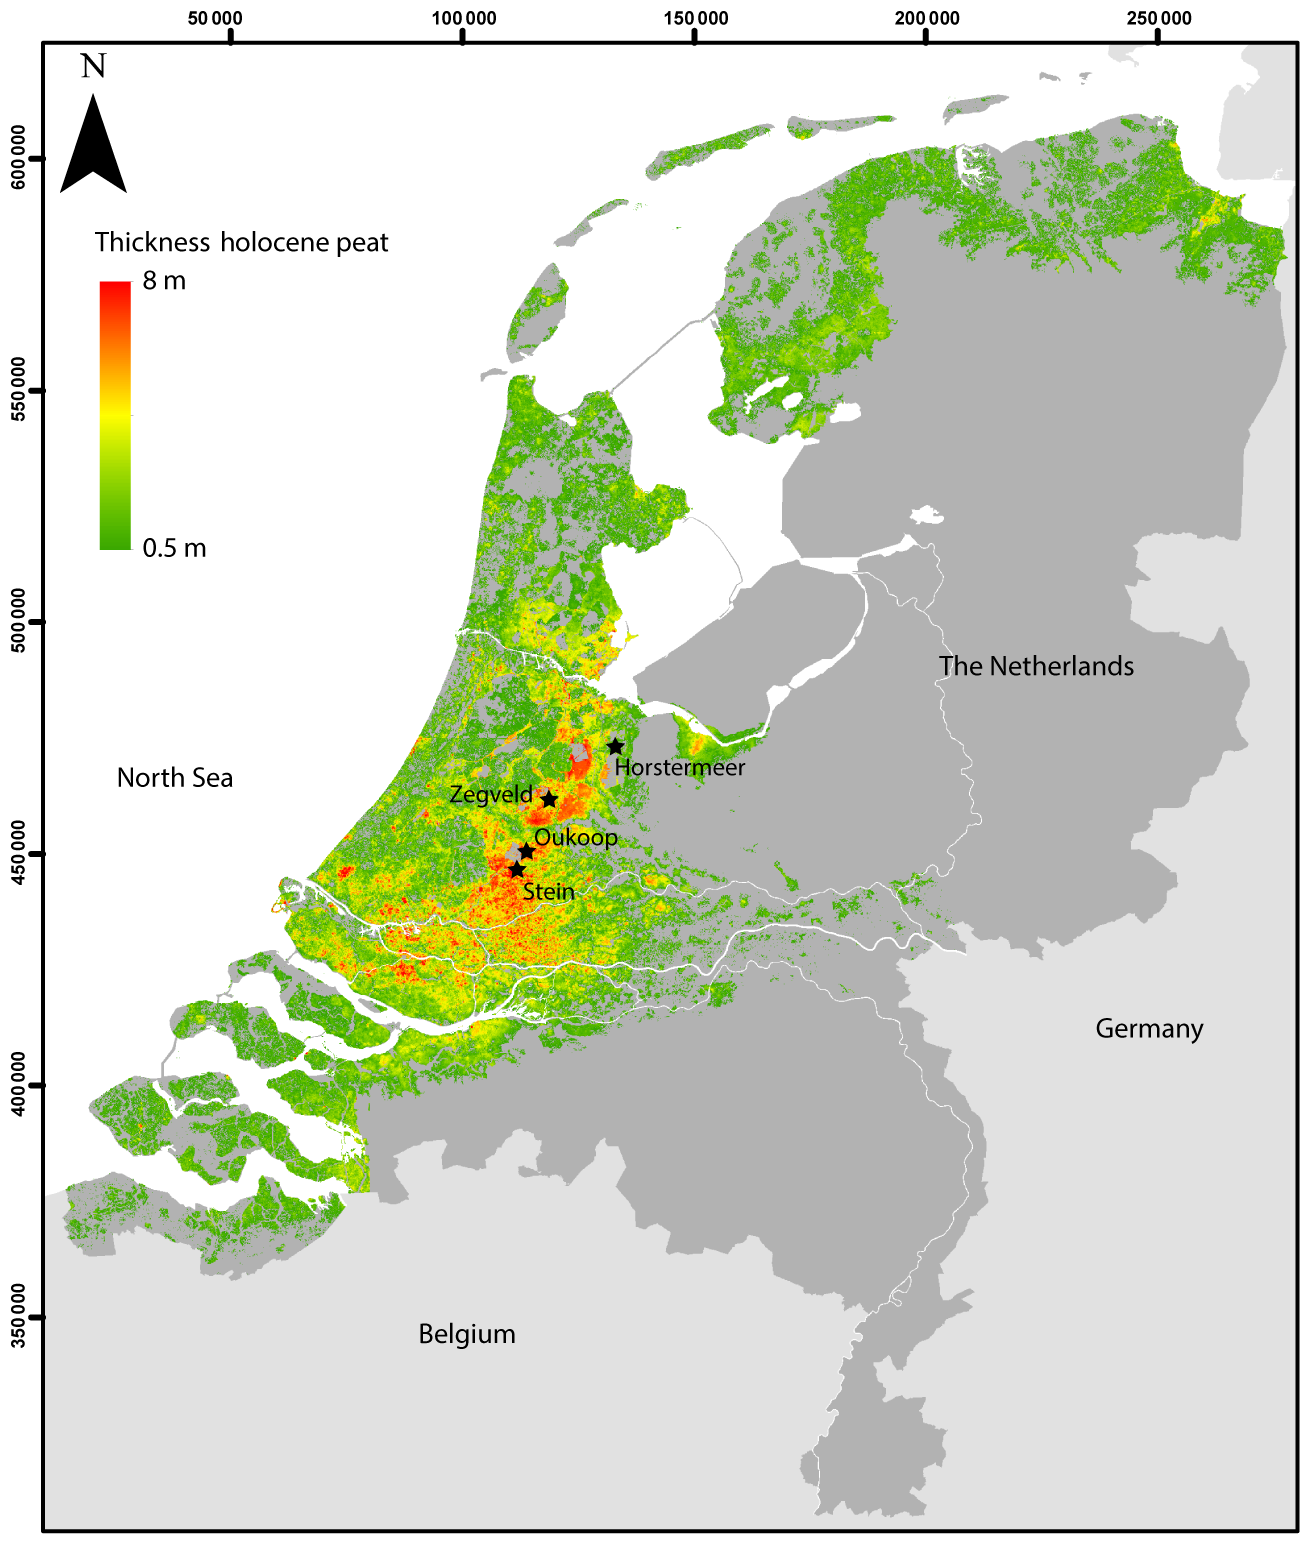
Figure 1Map of the Netherlands showing accumulated thickness of Holocene peat from the GeoTOP model (TNO-GSN, 2019). The stars indicates the locations of the four monitoring sites. Coordinates are expressed in meters using the RD (Rijksdriehoek) local coordinate system. © TNO Geological Survey of the Netherlands
The Dutch emission factors (NIR, 2019) are higher than the 2006 default IPCC emission factors for temperate grassland on organic soils of 10 t CO2 ha−1 yr−1 (IPCC, 2006). However, they are in line with the IPCC wetlands supplement (IPCC, 2013) that updated the default emission factors and included the impact of drainage depth using a combination of subsidence and flux data found in literature. These updated default emission factors for organic soils range from 13 to 22 t CO2 ha−1 yr−1 for respectively shallow and deep drained nutrient-rich temperate grassland, classified as having a mean annual water table depth of less or more than 30 cm below the surface. Rewetted organic soils were given a separate emission factor of −1 and +2 t CO2 ha−1 yr−1 for nutrient-poor and nutrient-rich areas, respectively.
A large set of Dutch studies is used for the updated default IPCC emission factors, amongst others Schothorst (1977), Langeveld et al. (1997), Jacobs et al. (2003), Hendriks et al. (2007), Veenendaal et al. (2007), and Schrier-Uijl et al. (2010). Apart from Schothorst (1977), these studies are based on flux data. The fluxes have been measured with chamber-based techniques or eddy covariance as a measure for the net ecosystem exchange (NEE) of CO2 with the atmosphere. This NEE is the difference between carbon assimilation by photosynthesis and release by respiration. Heterotrophic decomposition of soil organic matter and autotrophic emissions from the living biomass are taken into account for the respiration. Therefore, when using such flux data, changes in the biomass and litter stock have to be taken into consideration, allowing annual emission estimates from peat decomposition. Thus, agricultural practices, land-use and management have to be considered. The NEE of CO2 using the eddy covariance method reflects the exchange for an upwind area typically in the order of hundreds of square meters, whereas the chamber method reflects that for the location of the chamber.
The innovative aspect of GreenhousePeat is that it integrates information derived from different disciplines: geology, soil chemistry, hydrology, geodesy, and environmental chemistry. The model combines CO2 emission measurements with nationwide 3-D peat layer mappings, peat organic carbon content, and subsidence rates. The first step in developing GreenhousePeat is to link present-day measured to modelled CO2 emissions at single site locations.
3.1 CO2 emissions sites
We use documented information of multi-annual studies on GHG balances for three peatland sites reported by Moors et al. (2012): Oukoop, Stein, and Horstermeer, and one site reported in earlier work: Zegveld (Hensen et al., 1995) (see Fig. 1 for locations). Oukoop and Stein concern two managed drained grass-on-peat areas, and Horstermeer is a shallow drained former agricultural peatland that has been restored since 1998. Oukoop is a drained intensively managed area with the application of fertilizer and biomass export and Stein is a drained extensively managed area with biomass export (Hendriks et al., 2007; Veenendaal et al., 2007; Kroon, 2010; and Schrier-Uijl et al., 2010). Based on these studies, Schrier-Uijl et al. (2014) published results setting the system boundaries at the landscape level with (grass) biomass C import and export, fertilizer and manure use as well as the export of milk and meat and loss of dissolved organic carbon through drainage ditches.
An average release of 1.1 t CO2-C ha−1 yr−1 was found for the net ecosystem exchange (NEE) excluding management related fluxes for the two managed drained sites Oukoop and Stein, and uptake of 3.8 t CO2-C ha−1 yr−1 for the restored site Horstermeer (Schrier-Uijl et al., 2014). A year to year variation of −0.5 to 1.9 t and −0.2 to 2.2 t CO2-C ha−1 yr−1 was found for Oukoop and Stein respectively, and −2.7 to −5.2 t CO2-C ha−1 yr−1 for the Horstermeer (Schrier-Uijl et al., 2014). A total farm-based CO2 release for Oukoop is estimated as 1.9 t CO2-C ha−1 yr−1 based on biomass removal of 4 t CO2-C ha−1 yr−1, assimilation rate of cattle (7 %), manure application of 1.4 t CO2-C ha−1 yr−1 and a farm-based CH4 balance of 0.6 CO2-C ha−1 yr−1. The total carbon release to the atmosphere (CO2 and CH4) for the two managed drained sites in Oukoop and Stein is 5.2 and 6.3 t C ha−1 yr−1 respectively and a total uptake in Horstermeer of 3.5 t C ha−1 yr−1 (Schrier-Uijl et al., 2014).
Langeveld et al. (1997), taking a similar approach, derived an emission of 11 t CO2 ha−1 yr−1 for Zegveld grassland on peat, based on eddy covariance measurements of Hensen et al. (1995). The uptake, manure excretion and milk production were estimated to emit 10 t CO2 ha−1 yr−1, because the cattle largely fed on the grass.
3.2 Modelling CO2 emissions
For modelling present-day CO2 emissions at the four selected sites (CO2,em kg CO2 ha−1 yr−1), we use an internationally acclaimed robust empirical approach proposed by Kasimir-Klemedtsson et al. (1997). It was expressed as a function for the Netherlands by Kuikman et al. (2005) and Van den Akker et al. (2008, 2012), and approved by the UNFCCC to quantify CO2 emissions from peatlands (Arets et al., 2019) (Eq. 1). For a fraction of subsidence attributed to oxidation (F), we use documented minimum and maximum values for the central peat area of the Netherlands: 0.25–0.71 (Schothorst, 1977; Van Asselen et al., 2018). Schothorst (1977) presented an oxidation fraction for the situation in the 1970s, whereas Van Asselen et al. (2018) provided a range of average oxidation fractions for centuries-long subsidence. Information on present-day oxidation fractions lack in the literature. For the local subsidence rates (S in m yr−1) we deploy a nationwide subsidence map based on InSAR, gravity, and GNSS data that provides an estimated and averaged (2×2 km grid cells) shallow subsidence rates between 2015 and 2018 (Bodemdalingskaart, 2018). The distribution of peat, organic matter fraction (frp), and carbon fraction organic matter (frc) are derived from the 3-D geological subsurface voxel model GeoTOP (resolution: m) (Stafleu et al., 2011; Koster et al., 2018). For peat organic matter density (ρp in kg m−3), we apply documented minimum and maximum values for the Netherlands: 1470 and 1560 kg m3 (cf. De Glopper, 1973). We use the raster resolution of GeoTOP and calculate for each cell a range of annual CO2 emission based on minimum and maximum values of F and peat organic matter density with the following equation (cf. Kuikman et al., 2005; Van den Akker et al., 2008):
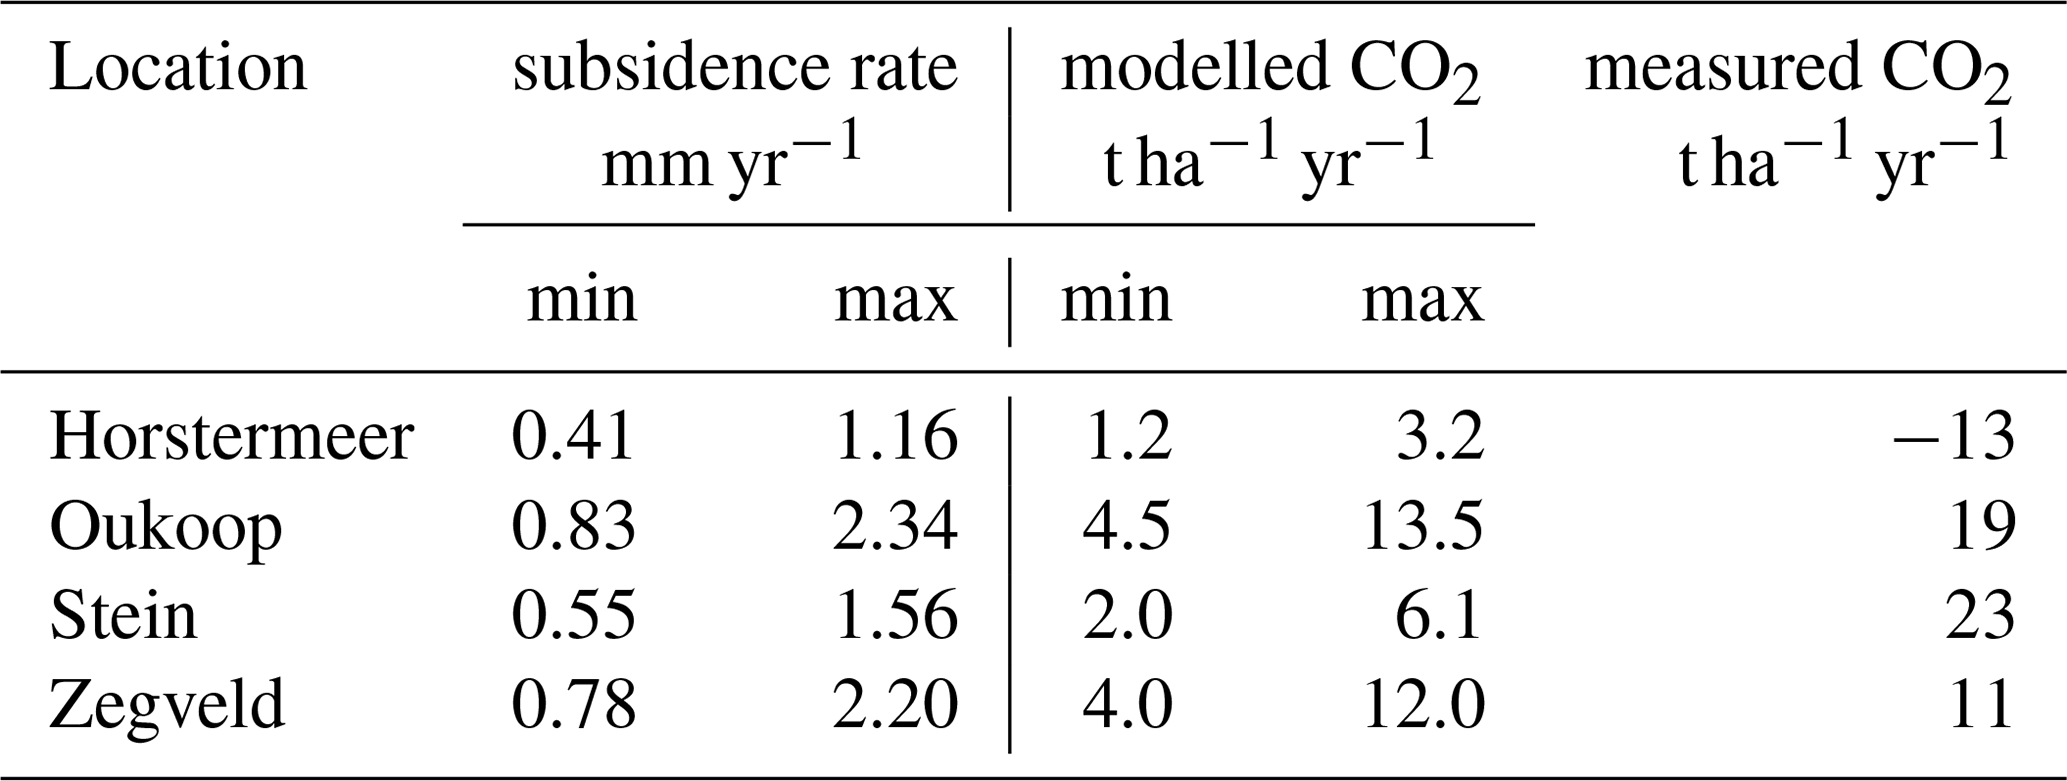
Previously measured and newly modelled CO2 emitted by peat oxidation for the four locations are summarized in Table 1. The results show that the measured CO2 at Zegveld is just below the upper bound of the modeled values. However, the modelled CO2 emissions at Stein and Oukoop are in the order of 10 to 20 t CO2 ha−1 yr−1 less than the measurements. The Horstermeer measurements reveals that the site is a net sink, although GreenhousePeat predicts net emissions.
Table 1Summary of the modelled and measured CO2 emissions at four locations. Min. and max. values are the results of the min. and max. values of the oxidation fractions and organic matter densities.
We aim with GreenhousePeat to predict CO2 emissions from peatlands for variable groundwater management and climate change scenarios for the first time on a national scale. To accomplish this, we foresee that the following steps are needed:
-
Implementing information on phreatic groundwater levels. The Netherlands has several online portals of freely available groundwater level information, comprising monthly information on phreatic groundwater level changes (BISNederland; NHI; Grondwatertools; TNO-GSN). Available information regards individual monitoring wells, as well as spatial interpolations that yield estimations of spatiotemporal varying groundwater levels. Ignoring the groundwater level elevation and changes could partly explain the strong discrepancy between measured and modelled CO2 at site Horstermeer. The site is characterized by high phreatic groundwater levels that minimize oxidation.
-
Geodetic data. Part of the mismatches between the modelled and the measured CO2 emissions may also be due to the used subsidence measurements (S in Eq. 1). We used data for grid cells of 2 by 2 km, which are averages of dozens to hundreds of deformation points. These values may not be appropriate for the simulated sites. A higher resolution deformation map, or a measure of the expected variance of such measurements would be of added value.
-
Implementing land use maps. According to Moors et al. (2012), agricultural practices, land-use, and management largely determine the emissions of CO2 from Dutch (agro)ecosystems. Jacobs et al. (2003), reports that peatlands are a source if drained substantially, and a sink if not. Therefore, land- use maps which differentiate between agricultural lands and wetlands complement information on phreatic groundwater levels. This identifies areas such as site Horstermeer which are a net CO2 sink that experiences minimal subsidence.
-
Drought events. Peat oxidation is exacerbated during periods of extreme drought (Van Dam, 1988; Reiche et al., 2009). For instance, the drought in the summer of 2018 caused a rainfall deficit of 250 to 350 mm in the peat areas of the Netherlands (Sluijter et al., 2018). Such drought events are known to cause a temporal drop in groundwater levels and accelerate CO2 emissions from peat layers (Reiche et al., 2009). Even under moderate IPCC projections (RCP4.5) drought will most probably become more frequent and severe in Northwestern Europe (Klein Tank et al., 2015; Spinoni et al., 2018). We will use observed drops in phreatic levels from the summer of 2018 as base levels for near future lowest phreatic level (Fig. 2) (TNO-GSN, 2019).
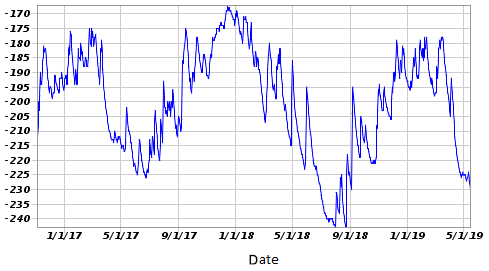
Figure 2Example of a phreatic groundwater level monitoring well located in the peat area near Stein (TNO-GSN, 2019). The y-axis indicates elevation in cm + MSL; the surface elevation is 1.66 m − MSL. Low phreatic level during the summer of 2017 was ca. −2.25 m + MSL, whereas the phreatic level dropped during the 2018 extreme summer to −2.42 m.
At present, GreenhousePeat uses an UNFCCC model to simulate CO2 emissions from peat lands, which accounts for the fraction of subsidence attributed to peat oxidation, rate of total subsidence, and properties of peat organic matter. We showed that for the Zegveld site, model and measurements agree. The three other sites revealed discrepancies between the modelled and measured values, meaning that either the process descriptions or the input data should be improved.
Research data on peat distribution and groundwater level changes are accessible via the online data portal of TNO – Geological Survey of the Netherlands: https://www.dinoloket.nl/en (TNO-GSN, 2019). Research data on CO2 emissions and land subsidence are available in the publications cited.
KK and AF collected data. JS conducted selections on GeoTOP. All the authors contributed to interpretation of the results and writing of the manuscript.
The authors declare that they have no conflict of interest.
This article is part of the special issue “TISOLS: the Tenth International Symposium On Land Subsidence – living with subsidence”. It is a result of the Tenth International Symposium on Land Subsidence, Delft, the Netherlands, 17–21 May 2021.
We would like to thank an anonymous reviewer for critically reading the manuscript.
Arets, E. J. M. M., van der Kolk, J. W. H., Hengeveld, G. M., Lesschen, J. P., Kramer, H., Kuikman, P. J., and Schelhaas, M. J.: Greenhouse gas reporting of the LULUCF sector in the Netherlands. Methodological background, update 2019, Wettelijke Onderzoekstaken Natuur & Milieu, WOt-technical report 146, 113 pp., 2019.
BISNederland: Online soil and groundwater information of the Netherlands, WEnR, available at: http://maps.bodemdata.nl/, last access: November 2019.
Bodemdalingskaart: Online nationwide subsidence map of the Netherlands, 2018, available at: https://bodemdalingskaart.nl/, last access: November 2019.
De Glopper, R. J.: Subsidence after drainage of the deposits in the former Zuyder Zee and in the brackish and marine forelands in The Netherlands, Van Zee tot Land, 205 pp., 1973.
Deverel, S. J., Ingrum, T., and Leigthon, D. A.: Present-day oxidative subsidence of organic soils and mitigation in the Sacramento-San Joaquin delta, California, USA, Hydrogeology, 24, 569–586, 2016.
Gambolati, G., Putti, M., Teatini, P., and Gasparetto Stori, G.: Subsidence due to peat oxidation and impact on drainage infrastructures in a farmland catchment south of the Venice Lagoon, Env. Geol., 46, 814–820, 2006.
Grondwatertools: Online portal for timeseries of groundwater wells, 2019, available at: https://www.grondwatertools.nl/grondwatertools-viewer, last access: November 2019.
Hendriks, D. M. D., van Huissteden, J., Dolman, A. J., and van der Molen, M. K.: The full greenhouse gas balance of an abandoned peat meadow, Biogeosciences, 4, 411–424, https://doi.org/10.5194/bg-4-411-2007, 2007.
Hensen, A., Kieskamp, W. M., Vermeulen, A. T., Van den Bulk, W. G. M., Bakker, D. F., Beemsterboer, B., Möls, J. J., Veltkamp, A. C., and Wyers, G. P.: Determination of the relative importance of sources and sinks of carbon dioxide, Report ECN-G-95-035, ECN, 68 pp., 1995.
Hooijer, A., Page, S., Jauhiainen, J., Lee, W. A., Lu, X. X., Idris, A., and Anshari, G.: Subsidence and carbon loss in drained tropical peatlands, Biogeosciences, 9, 1053–1071, https://doi.org/10.5194/bg-9-1053-2012, 2012.
IPCC: 2006 IPCC Guidelines for National Greenhouse Gas Inventories, Volume 4, Agriculture, Forestry and Other Land Use, IPCC National Greenhouse Gas Inventories Programme, published by the Institute for Global Environmental Strategies (IGES), Kanagawa, Japan, 2006.
IPCC: 2013 Supplement to the 2006 IPCC Guidelines for National Greenhouse Gas Inventories: Wetlands, edited by: Hiraishi, T., Krug, T., Tanabe, K., Srivastava, N., Baasansuren, J., Fukuda, M., and Troxler, T. G., IPCC, Switzerland, 354 pp., 2013.
Jacobs, C. M. J., Moors, E. J., and van der Bolt, F. J. E.: Invloed van waterbeheer op gekoppelde broeikasgasemissies in het veenweidegebied bij ROC Zegveld, Alterra-rapport 840, Alterra, Wageningen, The Netherlands, 2003 (in Dutch).
Kasimir-Klemedtsson, A., Klemedtsson, L., Berglund, K., Martikainen, P., Silvola, J., and Oenema, O.: Greenhouse gas emissions from farmed organic soils: a review, Soil Use and Man., 13, 245–250, 1997.
Klein Tank, A., Beersma, J., Besseminder, J., Van de Hurk, B., and Lenderik, G.: KNMI'14 klimaatscenario's voor Nederland; leidraad voor professionals in klimaatadaptatie, KNMI, De Bilt, 36 pp., 2015 (in Dutch).
Koster, K., Stafleu, J., Cohen, K. M., Stouthamer, E., Busschers, F. S., and Middelkoop, H.: Three-dimensional distribution of organic matter in coastal-deltaic peat: Implications for subsidence and carbon dioxide emissions by human-induced peat oxidation, Anthropocene, 22, 1–9, 2018.
Kroon, P. S.: Thesis: Eddy covariance observations of methane and nitrous oxide emissions – towards more accurate estimates from ecosystems, Technische Universiteit Delft, ISBN 978-90-9025388-6, 2010.
Kuikman, P. J., van den Akker, J. J. H., and de Vries, F.: Emission of N2O and CO2 from organic agricultural soils, Alterra-report 1035.2, Alterra Wageningen UR, Wageningen, The Netherlands, 2005.
Langeveld, C. A., Segers, R., Dirks, B. O. M., van den Pol-van Dasselaar, A., Velthof, G. L., and Hensen, A.: Emissions of CO2, CH4 and N2O from pasture on drained peat soils in the Netherlands, Eur. J. Agr., 7, 35–42, 1997.
Moors, E., Dolman, H., Elbers, J., Hensen, A., Duyzer, J., Kroon, P., Veenendaal, E., van Huissteden, K., Bosveld, F. C., Jacobs, C., Jans, W., Kuikman, P., Nol, L., and van Beek, C.: Integrated observations and modelling of greenhouse gas budgets at the ecosystem level in the Netherlands, KvR report number KvR 055/12, 2012.
NHI: Online portal of hydrological data of the Netherlands, available at: http://www.nhi.nu/ (last access: November 2019), 2019.
NIR (Ruyssenaars, P. G., Coenen, P. W. H. G., Zijlema, P. J., Arets, E. J. M. M., Baas, K., Dröge, R., Geilenkirchen, G., `t Hoen, M., Honig, E., van Huet, B., Huis, E. P., Koch, W. W. R., Lagerwerf, L., te Molder, R., Montfoort, J. A., Peek, C. J., Vonk, J., and van Zanten, M.): Greenhouse Gas Emissions in the Netherlands 1990–2017: National Inventory Report 2019, https://doi.org/10.21945/RIVM-2019-0020 (also available at: https://www.rivm.nl/bibliotheek/rapporten/2019-0020.pdf), 2019.
Schothorst, C. J.: Subsidence of low moor peat soils in the western Netherlands, Geoderma, 17, 265–291, 1977.
Schrier-Uijl, A. P., Kroon, P. S., Hensen, A., Leffelaar, P. A., Berendse, F., and Veenendaal, E. M.: Comparison of chamber and eddy covariance based CO2 and CH4 emission estimates in a heterogeneous grass ecosystem on peat, Agr. Forest Meteorol., 150, 825–831, 2010.
Schrier-Uijl, A. P., Kroon, P. S., Hendriks, D. M. D., Hensen, A., Van Huissteden, J., Berendse, F., and Veenendaal, E. M.: Agricultural peatlands: towards a greenhouse gas sink – a synthesis of a Dutch landscape study, Biogeosciences, 11, 4559–4576, https://doi.org/10.5194/bg-11-4559-2014, 2014.
Reiche, M., Hädrich, A., Lischeid, G., and Küsel, K.: Impact of manipulated drought and heavy rainfall events on peat mineralization processes and source-sink functions on an acidic fen, J. Geophys. Res.-Biosc., 114, 1–13, 2009.
Sluijter, R., Plieger, M., Van oldenborgh, G. J., Beersma, J., and De Vries, H.: De droogte van 2018, Een analyse op basis van het potentiële neerslagtekort, KNMI, De Bilt, 39 pp., 2018 (in Dutch).
Spinoni, J., Vogt, J. V., Naumann, G., Barbosa, P., and Dosio, A.: Will drought events become more frequent and severe in Europe?, Int. J. Climatol., 38, 1718–1736, 2018.
Stafleu, J., Maljers, D., Gunnink, J. L., Menkovic, A., and Busschers, F. S.: 3D modeling of the shallow subsurface of Zeeland, the Netherlands, Neth. J. Geosc., 90, 293–310, 2011.
TNO-GSN: Online portal for digital geo-information, Geological Survey of the Netherlands, available at: https://www.dinoloket.nl/en (last access: November 2019), 2019.
UNTC (United Nations Treaty Collection): “Paris Agreement”, 2016.
Van Asselen, S., Erkens, G., Stouthamer, S., Woolderink, H. A. G., Geeraert, R. E. E., and Hefting, M. M.: The relative contribution of peat compaction and oxidation to subsidence in built-up areas in the Rhine-Meuse delta, The Netherlands, Sci. Total Environ., 636, 177–191, 2018.
Van Dam, H.: Acidication of three moorland polls in The Netherlands by acid precipitation and extreme drought periods over seven decades, Freshwater Biol., 20, 157–176, 1988.
Van den Akker, J. J. H., Kuikman, P. J., de Vries, F., Hoving, I., Pleijter, M., Hendriks, R. F. A., Wolleswinkel, R. J., Simões, R. T. L., and Kwakernaak, C.: Emission of CO2 from agricultural peat soils in the Netherlands and ways to limit this emission, in: Proceedings of the 13th International Peat Congress After Wise Use – The Future of Peatlands, edited by: Farrell, C. and Feehan, J., Vol. 1 Oral Presentations, Tullamore, Ireland, 8–13 June 2008, International Peat Society, Jyväskylä, Finland, 645–648, 2008.
Van den Akker, J. J. H., Hendriks, R. F. A., and Pleijter, M.: CO2 emissions of peat soils in agricultural use: calculation and prevention, Agrociencia Uruguay, 16, 43–50, 2012.
Veenendaal, E. M., Kolle, O., Leffelaar, P. A., Schrier-Uijl, A. P., Van Huissteden, J., Van Walsem, J., Möller, F., and Berendse, F.: CO2 exchange and carbon balance in two grassland sites on eutrophic drained peat soils, Biogeosciences, 4, 1027–1040, https://doi.org/10.5194/bg-4-1027-2007, 2007.