

Abstract
The grey matter is a central target of pathological processes in neurodegenerative disorders such as Parkinson’s and Alzheimer’s diseases. The grey matter is often also affected in multiple sclerosis, an autoimmune disease of the central nervous system. The mechanisms that underlie grey matter inflammation and degeneration in multiple sclerosis are not well understood. Here we show that, in Lewis rats, T cells directed against the neuronal protein β-synuclein specifically invade the grey matter and that this is accompanied by the presentation of multifaceted clinical disease. The expression pattern of β-synuclein induces the local activation of these T cells and, therefore, determined inflammatory priming of the tissue and targeted recruitment of immune cells. The resulting inflammation led to significant changes in the grey matter, which ranged from gliosis and neuronal destruction to brain atrophy. In humans, β-synuclein-specific T cells were enriched in patients with chronic-progressive multiple sclerosis. These findings reveal a previously unrecognized role of β-synuclein in provoking T-cell-mediated pathology of the central nervous system.
Main
The complex neuronal networks of the grey matter in the central nervous system (CNS) constitute the site at which the signals for body control are received, processed and distributed. Consequently, any damage to this neuronal fulcrum has a most severe and enduring impact on the integrity and function of the CNS, as is seen in chronic neurodegeneration of the brain in disorders such as Parkinson’s and Alzheimer’s diseases. In multiple sclerosis (MS), an autoimmune disease of the CNS, it is not only the myelinated white matter that is affected by the autoimmune attack, as previously thought1,2,3, but also the grey matter. In fact, it is the destruction of the grey matter that is primarily responsible for the brain atrophy and disease progression observed in MS4. An important gap in our understanding of the pathogenesis of MS results from the fact that the currently available experimental models—in particular, experimental autoimmune encephalomyelitis (EAE)—do not reproduce this critical hallmark of the human disease. The target autoantigens of classical EAE models are generally myelin proteins, such as myelin basic protein (MBP), myelin oligodendrocyte glycoprotein or proteolipid protein5. These proteins are predominantly expressed in CNS white matter, in which the EAE lesions are also located.
β-Synuclein-specific T cells induce grey matter disease
Here we studied T cells specific for β-synuclein, which is abundantly present within neuronal synapses6 and has previously been proposed to be a potential CNS autoimmune target antigen7. T cell lines specific for β-synuclein and for MBP were established and labelled with fluorescent proteins by retroviral gene transfer (Tβ-syn and TMBP cells, respectively) (Extended Data Fig. 1a–c). After intravenous transfer into healthy recipient rats, TMBP cells infiltrated the white matter of the spinal cord and the brain, as expected, and evoked the typical monophasic EAE characterized by ascending paresis and weight loss8,9. Tβ-syn cells were also highly pathogenic. However, in notable contrast to TMBP cells, the Tβ-syn cells almost exclusively invaded the grey matter, and in particular the cerebral cortex, an area that is almost devoid of TMBP cells in EAE (Fig. 1a and Extended Data Fig. 1d). Clinically, the rats developed a very heterogeneous disease phenotype that included atypical signs such as paresis of individual limbs, head tilting and ataxia (Extended Data Fig. 1e, f).
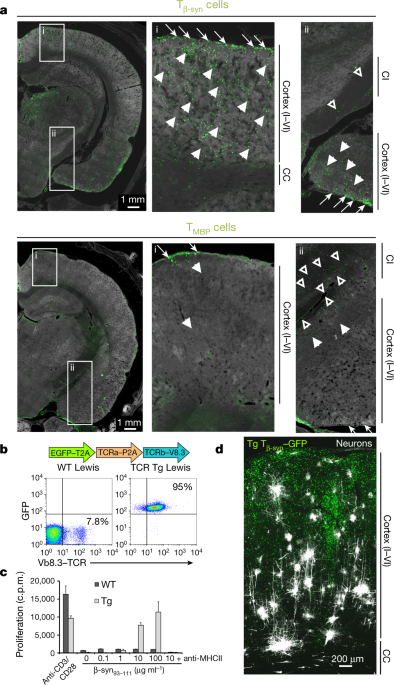
a, Brain infiltration patterns of Tβ-syn–GFP cells (top) or TMBP–GFP cells (bottom). Fluorescence images of coronal brain sections at the peak of T cell invasion. Arrows, closed arrowheads and open arrowheads point to T cells (green) that accumulate in the meninges, grey matter and white matter, respectively. CC, corpus callosum; CI, capsula interna. b, TCR transgene construct (top) and the abundance of Vβ8.3 chain and GFP expression (bottom) in TCR transgenic compared to wild-type lymph node T cells. c, Proliferative response of lymph node cells of wild-type (WT) and transgenic (Tg) rats to β-synuclein93–111.Thymidine incorporation. c.p.m., counts per min. Data are mean + s.d. Treatments with anti-CD3/CD28 and anti-MHC class II (MHCII) monoclonal antibodies were used for unspecific stimulation and to block antigen presentation, respectively. d, Cortical brain lesions induced by transfer of transgenic Tβ-syn cells (green). Representative confocal image of a coronal brain slice with DiI-labelled neurons (white).
Our T cell lines consist of polyclonal populations with potentially distinct T cell receptor (TCR) reactivity (Extended Data Fig. 1g). To ascertain whether β-synuclein acted as the target autoantigen for the observed grey matter disease, we generated a TCR-transgenic rat, which had an immune repertoire that mainly (over 95%) contained T cells that were reactive against β-synuclein (Fig. 1b, c and Extended Data Fig. 1h, i). T cell lines from these TCR-transgenic rats (Extended Data Fig. 1j–o) induced massive grey matter lesions similar to wild-type Tβ-syn cells, and the majority of rats (more than 80%) displayed an atypical disease characterized by paroxysmal bouts of monotonous scratching movements, jerks, pareses and ataxic and/or rotational movements (Fig. 1d, Extended Data Fig. 1p and Supplementary Video 1).
Migratory paths and cues of Tβ-syn cells
Disease signs induced by Tβ-syn cells started, similarly to EAE induced by TMBP cells, after a preclinical phase of two to three days after T cell transfer (Extended Data Fig. 1q). During this prodromal phase, Tβ-syn cells—as do TMBP cells8,10—travelled along a defined route through the lung, mediastinal lymph nodes, spleen and blood before they arrived at the CNS. On their way, the Tβ-syn cells assumed a migratory mode; that is, they showed downregulation of activation markers and concurrent upregulation of chemokine receptors and adhesion molecules that are required for crossing the blood–brain barrier (BBB)10 (Extended Data Fig. 2a, b). Intravital two-photon laser-scanning microscopy recordings revealed that the Tβ-syn cells accumulated at the leptomeninges before disease onset (Fig. 2a and Extended Data Fig. 2a). At the same time as the start of clinical signs, Tβ-syn cells invaded deep into the adjacent cortical grey matter (Fig. 1d, Extended Data Fig. 1p and Supplementary Video 2). The peak of Tβ-syn cell infiltration was reached shortly after the manifestation of clinical signs. Thereafter, Tβ-syn cell numbers rapidly declined (Extended Data Fig. 2a). TMBP cells also used the CNS-encasing leptomeninges as the point of entry; however, they were substantially confined to the spinal cord (Fig. 2a, Extended Data Fig. 2a and Supplementary Video 2).

a, Leptomeninges represent entry points for Tβ-syn and TMBP cells into the CNS tissues. Left and middle, Tβ-syn but not TMBP cells accumulate in the leptomeninges of the brain before invading the adjacent cortical grey matter. Right, TMBP cells use leptomeninges of the spinal cord (SC) to invade the white matter parenchyma. Representative two-photon laser-scanning microscopy recordings at the onset (day 3 post transfer (p.t.)) and peak (day 4 p.t.) of T cell infiltration. Green, antigen-specific T cells; red, blood vessels and meningeal macrophages. Arrows indicate areas of dye leakage. b, Transcriptional profiles of Tβ-syn and TMBP cells from blood 3 days p.t. Heat map shows hierarchically clustered expression values (log10-transformed RPKM (reads per kilobase per million mapped reads) of genes related to cell migration. Each line represents a biological replicate with n = 3–5 rats. c, Effects of blocking integrins and cytokines on entry of Tβ-syn cells into the brain. Flow cytometry analysis of the absolute number of Tβ-syn cells in blood, brain meninges (Men.) or parenchyma (Par.) at the onset of invasion in rats treated with anti-VLA-4, anti-LFA-1 or isotype-control monoclonal antibodies. Data are mean mean + s.e.m., n = 9 rats per group from 3 experiments. For anti-IL-17A and anti-IFNγ monoclonal antibody and PBS (control) treatment, analysis was performed at the peak of T cell infiltration. Data are mean + s.e.m., n = 6 rats per group from 2 experiments. Unpaired two-tailed t-test. *P < 0.05, ***P < 0.001.
The intravascular motility pattern did not explain the different migratory targets of Tβ-syn and TMBP cells: both types of T cells rolled along or interacted more tightly with the vascular walls of brain and spinal cord vessels—that is, after fixed adherence, the cells crawled with comparable velocity along the endothelium11 (Extended Data Fig. 2c, d and Supplementary Video 3). Even CNS-ignorant ovalbumin-specific T cells (TOVA cells) had similar intravascular locomotion behaviour (Supplementary Video 4).
Previous reports have suggested that different cytokine and integrin profiles could direct T cells into different CNS regions. T helper 17 (TH17) cells invaded the brain using LFA-1, whereas TH1 cells entered the spinal cord through VLA-4 integrin12,13,14,15. Transcriptome analyses revealed that Tβ-syn and TMBP cells had almost identical expression patterns of master transcription factors, cytokines, cytokine and chemokine receptors, and adhesion molecules (Fig. 2b and Extended Data Fig. 2e). The cells expressed IFNγ and IL-17 (Extended Data Fig. 1o), LFA-1 and VLA-4, and CCR6 and CXCR3, indicating a mixed TH1/TH17 cell type. Their chemotactic responsiveness was almost identical (Extended Data Fig. 2f). As in TMBP cells11, VLA-4 but not LFA-1 was crucial for Tβ-syn cell invasion of the CNS. VLA-4 monoclonal antibodies almost completely abolished Tβ-syn cell rolling and crawling along brain vessels, as well as subsequent grey matter invasion and disease progression (Fig. 2c, Extended Data Fig. 2g–m and Supplementary Video 5). Interference with IFNγ and, to a lesser extent, IL-17 signalling reduced the entry of Tβ-syn cells into CNS tissue and ameliorated the disease (Fig. 2c and Extended Data Fig. 2n, o).
T cell activation drives grey matter inflammation
Because the differences in the migratory properties or adhesion molecule and cytokine profiles of the T cells could not explain the preferential targeting of the grey or white matter, we next investigated whether the distribution of CNS antigens regulates invasion. Whereas MBP is predominantly expressed within highly myelinated white matter, β-synuclein is mainly expressed in grey matter with its high density of neuronal processes and synapses16. Tβ-syn cells accumulated mainly in areas of high β-synuclein expression (Extended Data Fig. 3a–c). Thus, antigen expression could lead to preferential T cell activation within distinct brain regions. Indeed, Tβ-syn cells isolated from the leptomeninges and, in particular, from the brain parenchyma displayed an activatory gene profile. Vice versa, TMBP cells were activated mainly within the spinal cord white matter and significantly less so within the grey matter (Extended Data Fig. 4a–g). Using nuclear translocation of the fluorescently labelled nuclear factor of activated T cells (NFAT) as an activation-dependent biosensor17,18, we could confirm Tβ-syn cell activation within the meninges and deep within the grey matter (Fig. 3a, b, Extended Data Fig. 4h–k and Supplementary Video 6).

a, Nuclear translocation of NFAT in Tβ-syn–NFAT–YFP cells in situ. Representative confocal image showing T cells within the cortical parenchyma in contact with MHC class II+ cells. Filled and open arrows, Tβ-syn cells with nuclear (that is, activated) and cytosolic (that is, not activated) NFAT, respectively. b, Quantification of activated T cells in the meningeal and cortical grey matter. Data are mean ± s.d. of a total 4,400 cells from 2 different experiments. c, Grey-matter-derived microglia function as APCs for Tβ-syn cells. IFNγ production by Tβ-syn cells stimulated by microglia from total brain or cortical grey matter with or without the presence of cognate antigen analysed by enzyme-linked immunosorbent assay. Antigen presentation was blocked by addition of anti-MHC class II monoclonal antibodies. GM, cortical grey matter. Data are mean + s.e.m., n = 3. One-way ANOVA. *P < 0.05, **P < 0.01. d, Interference with Tβ-syn cell activation prevents clinical disease. Disease course of rats that received Tβ-syn cells treated at the indicated time points (arrows) with either anti-MHC class II monoclonal antibodies (top) or FK506 (bottom). Vehicle-treated rats were used as control. Data are mean + s.e.m., n = 10 rats for anti-MHCII antibody and n = 8 rats for FK506 experiments. Unpaired two-tailed t-test. *P < 0.05, **P < 0.01, ***P < 0.001.
The dominant pattern of activation of Tβ-syn cells within the grey matter indicates that β-synuclein is preferentially presented in grey matter tissue. In fact, grey-matter-derived microglia induced a stronger activation response in Tβ-syn cells than did microglia from whole-brain tissue, the latter of which also contained microglial cells from the white matter of the brain. In the presence of the appropriate neuronal or myelin antigen, microglia from the grey matter or whole-brain tissue equally stimulated both Tβ-syn and TMBP cells. As expected, TOVA cells were not activated by the CNS antigen-presenting cells (APCs). Blockade of the interaction between TCRs and MHC class II by monoclonal antibodies prevented the activation of Tβ-syn cells (Fig. 3c and Extended Data Fig. 5a).
The relevance of in situ activation of Tβ-syn cells was supported by the following findings. Intrathecal application of anti-MHC class II monoclonal antibodies decreased Tβ-syn cell activation in the CNS, Tβ-syn cell recruitment and clinical disease (Fig. 3d and Extended Data Fig. 5b–d). Interference with the Tβ-syn cell-signalling cascade through treatment with FK506, which prevents nuclear NFAT translocation, resulted in very similar effects (Fig. 3d and Extended Data Fig. 5e–g). By contrast, promotion of T cell activation had the opposite effect. Even brain antigen-irrelevant T cells could be guided into the brain tissue. To achieve this, we used TOVA cells, which carried a chimeric antigen receptor (Extended Data Fig. 6a, b), that were stimulated by local application of CAR crosslinking monoclonal antibodies—thus avoiding the need for the local antigen presentation machinery. Involving CNS APCs in the T cell activation process by local ovalbumin application uniformly triggered increased invasion of TOVA cells (Extended Data Fig. 6c). Furthermore, local application of MBP redirected white matter-affine TMBP cells into the brain cortex (Extended Data Fig. 6d). Additionally, invasion of Tβ-syn cells could be enhanced by increasing the availability of the autoantigen by neuronal overexpression of β-synuclein using viral gene transfer (Extended Data Fig. 6e–g).
The activation of Tβ-syn cells triggered an inflammatory reaction of endothelial cells and the grey matter parenchyma with significant upregulation of adhesion molecules and chemokines (Fig. 4a, b). As a consequence, strong recruitment of host T cells and myeloid cells was observed (Extended Data Fig. 7a). The correlations between effector T cell activation, local tissue response and subsequent cell recruitment also became evident in studies in which Tβ-syn and TOVA cells were transferred together. When transferred alone, very few TOVA cells entered the leptomeninges. After transfer with Tβ-syn cells, however, numerous TOVA cells were recruited to the cortical leptomeninges and parenchyma. Their location, migratory properties and kinetics in the grey matter resembled those of Tβ-syn cells, although their activation state remained low (Extended Data Fig. 7b–d and Supplementary Video 7). Interfering with Tβ-syn cell activation efficiently reduced tissue inflammation and TOVA cell recruitment (Extended Data Figs. 5d, 7e, f).

Upregulation of chemokines and integrins was determined by quantitative PCR. a, Expression of the indicated chemokine and integrin ligands in endothelial cells sorted from naive and diseased brain tissue at the peak of disease. b, Expression of the indicated chemokines in whole-brain tissue or from dissected cortex (grey matter) and corpus callosum (white matter (WM)). Data are mean + s.e.m., n = 3 rats, representative data of 2 independent experiments are shown.
Tβ-syn cells induce permanent neurodegeneration
We next analysed the consequences of Tβ-syn-cell-driven autoimmune attacks for the grey matter, which in its healthy state is almost devoid of any peripheral immune cells. Gadolinium (Gd)-enhanced magnetic resonance imaging (MRI) revealed marked signal increases in the meninges and within the cortex during disease onset, which indicates a substantial leakiness of the BBB. Intravital two-photon laser-scanning microscopy analyses after MRI confirmed these findings. Furthermore, subsequent histological analysis revealed a strong inflammatory response in the regions with Gd leakage (Fig. 5a, Extended Data Fig. 8a–d and Supplementary Video 8).

a, Quantification of Gd-enhanced MRI signals. Each line represents an individual rat. Representative data of two independent experiments are shown. n = 5 rats per group per experiment. Two-way ANOVA with Bonferroni’s multiple comparison correction. b, c, Tβ-syn cells in close contact with neurons. b, Left, 3D-rendered confocal images depicting a Tβ-syn cell (green) in intimate contact with dendritic spines (white). Right, 3D reconstruction of Tβ-syn cells in contact (green) or partially or entirely engulfed (yellow and red, respectively) by a neuron (white). c, Electron microscopy image of a T cell (T) inside a neuron (N) with a fragmented and partly dissolved nucleus (asterisk). Arrow, synaptic terminal. d, e, Tβ-syn cell attacks induce persistent activation of microglia and astrogliosis. d, IBA1+ microglia in the cortical grey matter after four consecutive transfers (4×) of TOVA or Tβ-syn cells. Samples were collected three weeks after recovery from the last disease bout. Greyscale images, 3D reconstructions. Plots, quantification of process length and segments (unpaired two-tailed t-test) and number of intersections (two-way ANOVA with Sidak correction for multiple comparisons). Data are mean ± s.d. In total, 12 (4× TOVA) and 18 (4× Tβ-syn) cells per group were analysed obtained from 2 different rats from 2 sets of experiments per group. e, Representative confocal images and 3D reconstructions of GFAP+ astrocytes. Plot, corresponding quantification of the morphological changes, pixels per area covered by GFAP staining. Data are mean + s.e.m., n = 3 rats per group, unpaired two-tailed t-test. f, g, Tβ-syn cell attacks induce cortical atrophy. f, Histological quantification of cortical thickness in control (age-matched naive and 4× TOVA-cell-transferred rats) and 4× Tβ-syn-cell-transferred rats. Mean cortical thickness of all controls over the entire anterior–posterior interval was set to 100%. Each dot represents mean thickness for a single rat at the indicated distance to bregma. Lines represent fitting curves (shading, 95% confidence interval) for the respective group of rats. n = 9 rats from 3 experiments for control, n = 4 rats from 4 experiments for 4× Tβ-syn cells. Unpaired two-tailed t-test. g, Longitudinal MRI measurements of the cortical thickness after 4× TOVA or Tβ-syn cell transfer. Representative data of two independent experiments. n = 5 rats per group per experiment. Two-way ANOVA with Bonferroni’s multiple comparison correction. a–h, *P < 0.05, **P < 0.01, ***P < 0.001, ****P < 0.0001.
Tβ-syn cells within the grey matter crawled at high speed (around 10 μm min−1) through the dense parenchyma (Extended Data Fig. 8e–h and Supplementary Video 2) and were regularly found to be in close association with neuronal structures. Some cells were even located within neurons (emperipolesis), which suggests neuronal damage19,20 (Fig. 5b, c and Supplementary Video 9). In fact, in addition to significant glial activation—upregulation of IBA1 associated with significant morphological changes in microglia—we found signs of neuronal damage, such as a significant reduction in synaptic spines and the emergence of apoptotic neurons (Fig. 5c and Extended Data Fig. 8i–m). Most of the inflammatory changes disappeared after recovery from the acute autoimmune attack (Fig. 5a and Extended Data Fig. 8l, m).
Patients with MS generally develop multiple disease bouts with clinical remissions between relapses. This could faithfully be reproduced in our rat model by performing consecutive transfers of effector T cells in the TCR-transgenic hosts (Extended Data Fig. 9a–d). Morphological analyses three weeks after the peak from a fourth Tβ-syn-cell-induced disease bout showed that—similarly to the recovery state after an acute lesion—the strong inflammation of the grey matter had almost completely vanished. Only single groups of T cells remained around vessels or within the leptomeninges and the adjacent parenchyma (Extended Data Fig. 9e). However, in contrast to the recovery state after a single inflammatory bout, we found significant persisting gliosis with activated microglia and astrocytes after repeated bouts (Fig. 5d, e and Extended Data Fig. 9f). Moreover, clear signs of structural neuronal damage, such as destruction of the regular architecture of neurons and their processes, could be observed (Extended Data Fig. 9g). In fact, quantitative analyses revealed significant atrophy of the cortical tissue (Fig. 5f and Extended Data Fig. 9h). This permanent damage of the grey matter was confirmed using longitudinal MRI studies that demonstrated significant thinning of the brain cortex and enlargement of the ventricles. MRI analyses also revealed the dynamics of the atrophic process that had already started after the first bout, but which were significantly increased after consecutive attacks (Fig. 5g and Extended Data Fig. 9i–k).
β-Synuclein reactivity in patients with MS
Myelin-reactive T cells are known to be part of the immune repertoire of healthy people and are increased in patients with MS21,22,23,24. Studying the blood of healthy subjects, we found both MBP- and β-synuclein-reactive T cells. In patients with MS, the frequency of both cell specificities was higher (Fig. 6 and Extended Data Fig. 10a). As described previously for potentially auto-aggressive T cells25,26,27, MBP- and β-synuclein-reactive T cells upregulated ICOS and CD25, expressed the CXCR3 and CCR6 chemokine receptors and produced proinflammatory cytokines, such as IFNγ and, to a lesser extent, IL-17 (Extended Data Fig. 10b–e). Notably, the frequency of β-synuclein-specific T cells was especially increased in patients with chronic-progressive MS, whereas the frequency of MBP-specific T cells was mainly increased in patients with relapsing-remitting MS (Fig. 6). The frequency of β-synuclein-specific T cells correlated with disease severity and duration (Extended Data Fig. 10f, g). Recently, α-synuclein-reactive T cells have been reported to be increased in patients with Parkinson’s disease28. We confirmed the increased frequency of α-synuclein-reactive T cells in patients with Parkinson’s disease, whereas β-synuclein-reactive T cells were not overrepresented in the blood of these patients. In patients with MS, the numbers of not only β-synuclein-specific T cells but also α-synuclein-specific T cells were increased (Fig. 6).

Left, percentage of proliferating CD3+CD4+ T cells of healthy subjects (control), patients with MS and patients with Parkinson’s disease (PD) upon stimulation with the indicated antigens or SEB (Staphylococcus enterotoxin B). Right, T cell reactivity to β-synuclein is increased in patients with chronic MS. Percentages of proliferating CD3+CD4+ T cells in healthy subjects, patients with relapsing remitting MS (RRMS), secondary progressive MS (SPMS), primary progressive MS (PPMS) and patients with Parkinson’s disease upon stimulation with the indicated antigens. Data are mean + s.e.m. One-way ANOVA with Dunnett’s correction for multiple comparisons. *P < 0.05, **P < 0.01, ***P < 0.001.
Our β-synuclein model makes it possible to study autoimmune processes that are directed against the complex and vulnerable grey matter, which distinguishes it from classic EAE models that affect only the ‘wiring’ and therefore the transmission of signals. The inability of EAE models to reflect grey matter pathology has generated speculation that alternative pathological mechanisms such as hypoxia or currently undefined soluble toxic factors initiate the degenerative grey matter process in MS29. Our data show that inflammation not only in white matter but also in grey matter can be induced by a targeted T-cell-driven attack. Antigen expression within the CNS and the specificity of T cells were crucial factors that determined the CNS target structures—not, as previously hypothesized, a special set of cytokines or adhesion molecules, or gravity12,13,14,15,30. Activation-induced release of cytokines by the T cells triggered a glial and vascular reaction that resulted in the formation of inflammatory lesions in the grey matter. It remains to be further clarified why it is that immunity against β-synuclein but not any of the other previously tested neuronal antigens, such as neurofilament or contactin-231,32, induces this overt, severe grey matter disease. Apart from a genetically encoded susceptibility—for example, the presence of certain MHC haplotypes that regulate the presentation capacity of antigenic peptides—the high expression levels of β-synuclein might have a conducing role. Furthermore, the association of β-synuclein with synapses and released vesicles—structures that have a high turnover within the CNS and as a consequence are in the reach of brain resident APCs—should render this neuronal autoantigen particularly recognizable by autoreactive T cells33. The tendency of synucleins to form aggregates34 may be another contributing factor. Notably, β-synuclein-specific T cells not only cause inflammation but also induce significant chronic glial activation and neurodegeneration, particularly after repeated inflammatory bouts. The extent to which glial activation and/or inflammatory factors, such as cytokines, or the disruption of the BBB participate in the neurodegenerative process remains to be elucidated1,35,36,37. The neurodestructive component of our model reflects well the situation in MS, in which destruction of the grey matter is a hallmark of the disease—in particular, in the case of longstanding disabling MS4. Indeed, we found that β-synuclein-specific T cells were mainly increased in patients with chronic-progressive MS. Myelin-reactive T cells were predominant in patients with relapsing-remitting MS. This distinct chronological preponderance of the cell specificities could indicate that the β-synuclein-reactive T cells arise secondarily to the myelin-reactive T cells (for example, in the process of epitope spreading)38. However, β-synuclein-specific T cells were also detectable early in the disease process of cases with relapsing-remitting MS. Furthermore, inflammatory grey matter lesions were also observed early in MS2. A grey matter attack by neuronal antigen-reactive T cells might therefore be present from the very beginning of the autoimmune process and the accumulating irreversible neurological deficits of patients with chronic MS might be due to an exhaustion of the functional reserve, not necessarily because of epitope spreading. Clearly, future studies are needed to provide more insights into when β-synuclein-specific T cells expand, the functional role of these cells and how different treatments influence their functionality. In summary, our autoimmune grey matter inflammation model lends itself to the study of autoimmunity-mediated neurodegeneration and may open new avenues for the development of individual prognostic profiles and therapeutic measures for patients with MS.
Methods
Wild-type rats
Lewis rats on a LEW/Crl background (Rattus norvegicus) were bred at the animal facility of the University Medical Center Göttingen (Germany). The rats were kept under standardized conditions on a 12-h light–dark cycle. They were provided with food and drink ad libitum. All experiments were performed according to the local animal welfare regulations. Both male and female rats were used in the EAE experiments. No differences were noted between the sexes.
Generation of transgenic rats
Wild-type Lewis rats were immunized with rat β-synuclein protein (Creative BioMart). After 10 days, lymph node cells were isolated and amplified by exposing them to β-synuclein (10 μg ml−1). Seven days later, lymphocytes were rechallenged using a β-synuclein peptide library covering the entire protein sequence. The peptides β-syn79–98 and β-syn93–111 gave the most pronounced proliferative response (Extended Data Fig. 1a). β-Syn93–111 was then selected for further testing and for the generation of transgenic rats. The generation of β-synuclein-specific TCR-transgenic Lewis rats and their detailed characterization will be described elsewhere (L.D., manuscript in preparation). In brief, clonal effector T cell lines established from immunized Lewis rats were used to determine the sequence of rearranged α and β TCR chains that confer specificity to rat β-syn93–111. These sequences were fused as a tricistronic eGFP-T2A-TCRα-P2A-TCRβ cassette, which was cloned into the self-inactivating lentiviral vector FUGW by replacing the GFP insert. Gene transfer was performed by microinjection of concentrated viral particles into the perivitelline space of fertilized Lewis oocytes (donors obtained from Charles River) as previously described39. Founder rats were identified by genomic PCR of skin biopsies and flow cytometry analysis of blood samples. Rats were bred to homozygosity and maintained for several generations under standard conditions.
Antigens
MBP was extracted from guinea pig brain as described40, OVA was purchased from Sigma, recombinant rat β-synuclein was purchased from Creative BioMart or purified in-house from bacterial E. coli lysates expressing recombinant protein with C-terminal 6×His tag using a Ni-agarose column. All peptides were synthetized by the peptide facility of the Charité (Berlin).
Generation and culturing of T cells
CD4+ T cells retrovirally engineered to express fluorescent proteins (eGFP, mCherry, TdTomato, Turquoise2 or LifeAct-Turquoise2) or NFAT reporter (NFAT–YFP or NFAT–YFP/Cherry-H2B) and reactive against β-syn93–111, MBP or OVA (Tβ-syn, TMBP or TOVA cells) were established as reported17,41. For the generation of chimeric antigen receptor-expressing T cell lines (CAR T cells), the sequence encoding SCA431scFv-mIgG1-CD4tm-CD3ζ CAR specific for carcinoembryonic antigen42 (courtesy of H. Abken, University of Cologne) was excised from the pBullet vector and cloned into a pMSCV-Puro-P2A vector, which was then used to establish a stable retroviral packaging cell line. The mouse single-chain antibody domain of CAR was used to activate CAR T cells in situ by application of crosslinking anti-IgG1 monoclonal antibodies.
In brief, 6–8-week-old female Lewis rats were immunized subcutaneously with 150 μl of emulsion prepared from β-syn93–111, MBP or OVA (stock concentration: 1 mg ml−1) and an equal volume of complete Freund’s adjuvant containing Mycobacterium tuberculosis extract (Difco) at a concentration of 2 mg ml−1. The cell suspension isolated from the draining lymph nodes 9–10 days after immunization was co-cultured with GP+E86 packaging cell lines producing replication-deficient retroviruses in the presence of 10 μg ml−1 MBP or OVA or 8 μg ml−1 of β-syn93–111. After 48 h, medium containing horse serum (10%, Biochrom AG) and mouse IL-2 was added to the culture for T cell expansion. Starting from day 4 after antigen stimulation, transduced T cells were selected by the addition of G418 (400 mg ml−1, Thermo Fisher) for two weeks or puromycin (1 μg ml−1, Carl Roth) for one week. Seven days after primary stimulation, T cells were rechallenged with the cognate antigen in the presence of 30-Gy-irradiated thymic APCs. The primary cell lines underwent at least three cycles of stimulation in culture before being used for transfer experiments. For the derivation of transgenic T cell lines, lymph node cells were explanted six days after immunization and antigen restimulation was performed every six days. All established T cell lines were CD4+CD8−αβTCR+. They displayed an effector memory phenotype (L-selectin−CD45RClowCD44high) and upon stimulation produced IFNγ and IL-17. Phenotype, cytokine profile, antigen specificity, pathogenicity and the absence of mycoplasma contamination were verified in each cell line.
In vitro activation assays were performed in 96-well plates by co-culturing 5 × 10⁴ T cells and 106 30-Gy-irradiated thymocytes per well. For unspecific stimulation, T cells were added onto plates coated with anti-CD3 (1 μg ml−1, clone G4.18, BD Biosciences) and anti-CD28 (2 μg ml−1, clone JJ316, BD Biosciences) monoclonal antibodies or treated with 2 μg ml−1 concanavalin A (Sigma). For blocking MHC class II-mediated antigen presentation, APCs were pretreated with 1 μg ml−1 anti-RT1b monoclonal antibodies (clone OX-6, Biolegend) before being added to T cells.
Transfer EAE
Adoptive transfer EAE was induced by intravenous injection of T cell blasts (day 2 after stimulation). Unless stated differently, the following number of T cells were injected: 7–8 × 10⁶ wild-type Tβ-syn cells, 2–3 × 10⁶ transgenic Tβ-syn cells or 5 × 10⁶ TMBP cells. For TOVA-cell transfer, 5 × 10⁶ cells were injected. In cotransfer experiments, equal numbers (3–4×10⁶) of TOVA–Tomato and Tβ-syn–Turquoise cells were injected intravenously into naive recipients.
Relapsing-remitting EAE was induced by repeated transfer of 2.5 × 10⁶ transgenic Tβ-syn or TMBP cell blasts into TCR-transgenic rats. After each transfer, the rats developed a severe monophasic disease with comparable severity of disease symptoms. β-Synuclein transgenic animals repeatedly injected with TOVA cells (5 × 10⁶ cells per rat) were used as control. As expected, upon repeated transfer of transgenic Tβ-syn cell blasts, wild-type rats became completely resistant to disease induction33.
Weight and clinical scores were recorded daily. Classical signs of EAE were scored as follows: 0, no disease; 1, flaccid tail; 2, gait disturbance; 3, complete hindlimb paralysis; 4, tetraparesis; 5, death. For atypical symptoms, the following classification was used: 0, no disease; 1, occasional twitches and scratching with or without flaccid tail; 2, frequent twitches and scratching, ataxia; 3, severe tonic and myoclonic movements, severe gait impairment; 4, tetraparesis; 5, death.
No statistical method was used to predetermine sample size. Rats from different cages but within the same experimental group were selected to assure randomization. Experimenters were blinded to the identity of experimental group in the experiments as follows: clinical effect of cytokine blockers; morphological analysis; acquisition and analysis of the human samples.
Cell isolation, flow cytometry and fluorescence-activated cell sorting
Fluorescently labelled T cells were isolated from the tissues as previously described8,10. In brief, mononuclear cells were isolated from EDTA-treated blood by density gradient. Single-cell suspensions were obtained from parenchymal organs, grinding the tissues through a mesh. The isolated cells underwent different procedures: spleen-derived single-cell suspensions were treated with ACK buffer for erythrocyte lysis. Immune cells were extracted from the different CNS compartments by a two-phase Percoll-density gradient. Isolation of CD11b+ microglial cells was performed as described43. In brief, rats were perfused with saline, meninges were removed and grey matter was isolated under a stereotactic microscope. CD11b+ microglial cells were then isolated with a three-phase Percoll-density gradient. Of note, no enzymatic digestion of the tissue was performed.
For the isolation of endothelial cells, euthanized rats were transcardially perfused with ice-cold PBS. Brain tissue was dissected and meninges were removed. The parenchyma was homogenized in a Dounce tissue grinder before the tissue was digested for 1 h in digestion buffer (HEPES-buffered DMEM medium supplemented with 0.4 U ml−1 liberase (Roche), 120 U ml−1 DNase I (Roche)) at 37 °C. Digestion was stopped by adding ice-cold buffer with 2 mM EDTA and samples were passed through a 20G syringe and filtered through a 70-μm cell strainer. Myelin debris was removed by 30% Percoll gradient centrifugation for 20 min at 700g. Cells were stained in staining buffer (PBS with 2 mM EDTA and 0.5% BSA) with anti-CD31–PE antibodies (Bio-Rad, clone TLD-3A12, dilution 1:100), anti-CD45–AF647 (Biolegend, clone OX-1, dilution 1:100) and anti-CD11b–AF647 (Biolegend, clone OX-42, dilution 1:100) for 30 min at 4 °C, washed twice with staining buffer then resuspended in HEPES-buffered DMEM with 2 mM EDTA for fluorescence-activated cell sorting (FACS). Labelled cell populations were sorted by a FACSAria 4L SORP cell sorter (Becton Dickinson). Sorted cells were pelleted for 5 min at 300g and taken up in QIAzol Lysis Reagent (Qiagen) for RNA isolation.
Flow cytometry analysis was performed with a FACSCalibur operated by Cell Quest software (Becton Dickinson) or by a CytoFLEX flow cytometer operated by CytExpert software (v.2.3, Beckmann Coulter). All procedures were performed at 4 °C. For surface staining, the following mouse anti-rat monoclonal antibodies were used: CD134–biotin (clone OX-40, Serotec), CD25–PE (clone OX-39, Biolegend), CD11b/c–AF647 (clone OX-42, Biolegend), αβTCR–AF647 or αβTCR–PE (clone R73, Biolegend), TCR Vβ8.2 (clone R78, Santa Cruz Biotechnology), TCR Vβ8.3 (clone B73, Serotec, described to recognize Vβ8.544, but it actually recognized Vβ8.3 as described45), TCR Vβ10 (clone G101, Serotec), TCR Vβ16.1 (clone His42, Serotec), γδTCR–PE (clone V65, Biolegend), CD45–PE (clone OX-1, Biolegend), CD45RA–PE (clone OX-33, Biolegend), CD8α–PE (OX-8, Biolegend), CD8β-PE (clone eBio341, eBioscience), CD3–AlexaFluor647 (clone 1F4, Biolegend), CD4–PECy5 (clone W3/25, BD Biosciences), CD4–PE–Cy7 (clone OX-35, BD Biosciences), CD28–APC (clone JJ319, Biolegend), CD62L–PE (clone OX-85, Biolegend), CD45RC–PerCP–Cy5.5 (clone OX-22, Abcam). Mouse IgG1κ (MOPC 31C, Sigma-Aldrich) served as isotype control; APC-labelled anti-mouse antibody (Dianova) was used as secondary antibody. For intracellular staining, mouse anti-rat IFNγ (DB-1, conjugated to AF647, Biolegend), rat anti-mouse IL-17–BV421 (clone TC11-8H4, Biolegend) and anti-Ki-67–AF647 (clone B56, BD Biosciences) antibodies were used. Before staining, cells were fixed and permeabilized using a BD Cytofix/Cytoperm kit (BD Biosciences) as recommended by the manufacturer. Mouse IgG1κ–AF647 (clone MOPC21, Biolegend) and rat IgG1κ–BV421 (clone RTK2071, Biolegend) antibodies were used as control. For the analysis of human peripheral blood mononuclear cell (PBMC) cultures the following antibodies were used: CD3–APC or CD3–APCFire750 (clone UCHT1, Biolegend), CD4–PE (clone RPA-T4, Biolegend), CD8–PECy5 (clone RPA-T8, Biolegend), CD25–PE–Cy5 (clone BC96, Biolegend), ICOS–PacificBlue (clone C398.4A, Biolegend). Cytofluorometric quantification of T cells was performed by relating the number of cells to a known absolute amount of fluorescent beads (BD Biosciences). Data analysis was performed using FlowJo software (FlowJo).
Cell proliferation analysis using BrdU incorporation assay
BrdU incorporation was measured as previously reported11. In brief, for ex vivo analysis BrdU (120 mg kg−1 body weight, Sigma-Aldrich) was injected intraperitoneally 2 h before organ collection. This time interval between BrdU injection and sample collection was chosen to minimize cell trafficking and to allow BrdU to enter the CNS parenchyma. For in vitro labelling, T cells were incubated with 10 μM BrdU for 2 h. Intracellular staining for BrdU was then performed using the BrdU APC Flow kit (BD Biosciences) according to the manufacturer’s instructions. The T cells were then analysed by flow cytometry.
Intravital two-photon laser-scanning microscopy
Surgical procedures
Two-photon laser-scanning microscopy (TPLSM) was used for imaging fluorescently labelled T cells in the brain of living rats. Imaging was performed in the preclinical phase and at the onset and peak of the disease. For this purpose, rats were pre-anaesthetized by intramuscular injection of 10 mg kg−1 xylazine combined with 50 mg kg−1 ketamine and then intubated via a small incision of the trachea and immediately ventilated with 1.5–2% isoflurane. During imaging, rats were stabilized in a custom-made microscope stage and their body temperature regulated and maintained (36–37 °C) via a heated pad connected to a custom-built thermocontroller. Fluid supply during imaging sessions was maintained using a perfusing device (Ismatec) set to a 0.6 ml h−1 flow rate. To access the parietal cortex, an open-skull window preparation was performed. In brief, a midline scalp incision was performed to expose the parietal, interparietal and frontal bones. The skull was then stereotactically fixed with dental paste to a head holder. Subsequently, a microdrill was used to cut an ellipsoid area of around 0.5 cm2 in the parietal bone (coordinates from bregma: x = +1.5 mm, y = −1 mm). The dura mater was carefully removed. For all preparations, tissue was immediately covered with sodium chloride solution to prevent dehydration.
Technical equipment and labelling procedures
TPLSM imaging was performed as previously described46, using two different systems: (1) a Zeiss Laser Scanning Microscope 710 (Carl Zeiss) combined with a Coherent 10 W Ti:Sapphire chameleon laser (Coherent), controlled by Zeiss ZEN 2012 software; and (2) an Olympus FVMPE-RS TPLSM equipped with a Spectra-Physics Mai Tai Ti:Sapphire oscillator and a Mai Tai DeepSee Ti:Sapphire oscillator. The excitation wavelength was tuned to 880 nm or 1,010 nm and routed through a 20× water 1.0 NA immersion objective W Plan Apochromat (Carl Zeiss) and a 25× water 1.05 NA immersion objective Olympus Scaleview in the Zeiss and in the Olympus TPLSM, respectively. Farred fluorescent proteins (for example, TdTomato) were excited at 1,100 nm either using a Ti:Sapphire laser pumped OPO in the Zeiss TPLSM or a Mai Tai DeepSee Ti:Sapphire oscillator in the Olympus TPLSM. Emitted fluorescence was detected using non-descanned detectors equipped with 442/46 nm, 550/49 nm and 624/40 nm band-pass filters. Typically, areas of 424.27 μm × 424.27 μm (512 × 512 pixels) width were scanned and 50–100-μm z-stacks were acquired. The acquisition rate during bidirectional scanning was approximately 1.3 s per z-plane including 2 times line-averaging. For reproducible motility analyses, the interval time was kept to 30 s. Blood vessels were labelled by intravenous injection of 2,000,000 Da dextran tetramethylrhodamine (Fischer Scientific) during the imaging session. Meningeal phagocytes were labelled by intrathecal injection of 3,000 Da dextran Texas red (Fischer Scientific) 24 h before imaging. To label myeloid cells, a monoclonal antibody against CD11b (OX-42) labelled in-house with SeTau647 (SETA BioMedicals) was injected intrathecally immediately before imaging. For evaluating BBB permeability, 70,000 Da dextran Texas red (Fischer Scientific) was injected before imaging.
Analysis of time-lapse videos
Acquired 3D time-lapse videos were analysed using Imaris 8.0.1 software (Bitplane AG). Cells were tracked using the automated Imaris Track module with subsequent manual revision. Motility parameters including T cell velocity (instantaneous speed average), crawling duration and meandering index (total T cell path length/single-cell displacement sum) were calculated as described46 within a 30-min recording interval. Rolling T cells were defined as cells appearing as single or several round-shaped dots with >50 μm min−1 instantaneous velocity. Owing to limitations in temporal resolution of the TPLSM, fast rolling events may have escaped our analysis.
In vivo integrin signal blockade
Integrin-mediated binding was blocked as previously described11 using mouse anti-rat monoclonal antibodies directed either against VLA-4 (anti-CD49d, clone TA-2; courtesy of T. Issekutz, Dalhousie University, Canada) or against CD11a (integrin αL, anti-LFA-1, clone WT.1, Serotec). For intravital TPLSM recordings in the intravascular phase, monoclonal antibodies were injected intravenously at a single dose of 1 mg kg−1 during the imaging session. After recording, ex vivo isolated T cells were tested by flow cytometry for antibody saturation. For assessing the clinical effects monoclonal antibodies were administered intrathecally twice (40 μg per rat per injection), namely on day 2.5 and 3.5 after T cell transfer.
In vivo inflammatory cytokine blockade
IFNγ and IL-17 were blocked by anti-rat IFNγ (provided by W. van der Meide) and anti-rat IL-17A (provided by Novartis) monoclonal antibodies, respectively. Antibodies were injected intrathecally (80 μg per rat per injection) on day 1.5, 2.5 and 3.5 after T cell transfer. In a preliminary experiment, mouse IgG1 or PBS were used as control. Given that results were identical between the IgG1 and PBS groups, in all subsequent experiments, PBS was used as control.
In vitro antigen presentation
Microglial cells (5 × 10⁴ per 100 μl) isolated as described above were cocultured with Tβ-syn, TMBP or TOVA cells (3 × 10⁴ per 100 μl for each cell line) in 96-well plates with or without the cognate antigen (10 μg ml−1) and in the presence or absence of MHC-II blocking monoclonal antibodies (10 μg ml−1). After 48 h, the cell culture supernatant was collected. Enzyme-linked immunosorbent assay (ELISA) assays were used to detect the concentrations of IFNγ and were carried out according to the manufacturer’s protocol (PeproTech).
Chemotactic assays
A trans-well migration assay was used to test the chemotactic capacity of blood-isolated antigen-specific cells towards CCL5 (0.1 ng ml−1), CCL19 (0.1 ng ml−1), CCL20 (0.1 ng ml−1), CXCL11 (0.1 ng ml−1), CXCL12 (0.1 ng ml−1) as described47. All chemokine ligands were purchased from Peprotech. The number of effector T cells migrating in response to the chemokine ligands was counted by flow cytometry and quantified in relation to the basic migration in the absence of chemokine ligands.
In vivo MHC class II blockade
MHC class II-mediated antigen presentation was blocked by intrathecal injection of anti-rat MHC class II monoclonal antibodies (80 μg per rat per injection) performed on days 1.5, 2.5 and 3.5 after T cell transfer.
FK506 treatment
FK506 (Sigma-Aldrich) was administered as previously described17. The drug was dissolved in DMSO (Carl Roth) to a concentration of 2 mg ml−1 and injected intraperitoneally at a dose of 2 mg kg−1 once per day. Control rats received an intraperitoneal injection of an equal volume of DMSO.
Activation of TOVA–CAR cells
In vitro activation of resting TOVA–CAR cells (day 6 after antigen challenge) was achieved by two different methods: (1) stimulation with increasing doses (0.5, 5, 50 μg ml−1) of biotinylated anti-mouse IgG1 monoclonal antibodies (clone RMG1-1, BioLegend) with or without crosslinking streptavidin (0.5 μg ml−1, Biolegend); and (2) stimulation with anti-rat CD3 (0.1 mg ml−1, clone G4.18, BD Biosciences) and CD28 (0.5 mg ml−1, clone JJ316, BD Biosciences) monoclonal antibodies, which had been coated on the culture plate before adding the T cells.
For in vivo activation, rats were injected with 10 μl anti-mouse IgG1 monoclonal antibody (50 μg ml−1) 3 days after TOVA–CAR cell transfer. The monoclonal antibody was injected with a stereotactic devise (Narishige) either in the cisterna magna (intrathecally) or in the right ventricle (intracerebroventricular (i.c.v.); coordinates from bregma: x = +1.5 mm; y = −1.0 mm, z = −4.3 mm). The solution was injected at a rate of 10 μl in 5 min to limit increase in intracranial pressure. After 5 min, the needle was slowly retracted (1 mm every 5 min) to avoid reflow through the injection route. The two injection modes gave equivalent results and therefore the results were pooled.
In vivo delivery of soluble antigen
To boost antigen presentation, 3 days after transfer of TMBP cells or TOVA cells, rats were injected with MBP or OVA (10 μg per rat), respectively. The antigens were injected either intrathecally or i.c.v. as described above. The two injection modes gave equivalent results and therefore the results were pooled. TPLSM or FACS quantification was performed 12 h later.
Neuronal overexpression of β-synuclein
AAV vectors were constructed to express β-syn–eGFP, γ-syn–eGFP, or eGFP under the human synapsin promoter as previously described48. An AAV2 serotype was selected, because of its higher selectivity for neuronal cells. AAV vectors were injected intracranially into neonatal rats 24–48 h after birth. Each rat received 2 μl of solution containing 1.5 × 10⁸ transducing units. Six weeks later, the rats were intravenously transferred with 2.5 × 10⁶ Tβ-syn cells.
RNA extraction, cDNA library preparation and RNA sequencing
RNA extraction, cDNA library preparation and RNA sequencing (RNA-seq) was performed as described47. For T cell sequencing, total RNA from wild-type or transgenic Tβ-syn cells was isolated either from in vitro Tβ-syn cell blasts (20 h after antigen encounter) or ex vivo from blood, brain leptomeninges and brain parenchyma 3 days post transfer (p.t.). Between 200,000–400,000 Tβ-syn cells were sorted from each sample achieving more than 98% purity. Three different biological replicates were prepared for each sample. Four to five rats were pooled for each replicate. Library preparation for RNA-seq was performed using the TruSeq RNA Sample Preparation Kit (Illumina, RS–122–2002) starting from 500 ng of total RNA. Single-read (45-bp) sequencing was conducted using a HiSeq 2000 (Illumina). Sequences were aligned to the genome reference sequence of R. norvegicus allowing for 2 mismatches within 45 bases. Gene annotation was performed using R. norvegicus entries from Ensembl v.78. Data of gene expression profiles of TMBP cells were obtained from a previously published dataset47.
Quantitative PCR
Quantitative PCR was performed on a StepOnePlus Real-Time PCR System (Applied Biosystems) using FAM-TAMRA-labelled probes as described10,47. ACTB was used as house-keeping gene. For detecting cytokine and chemokine expression on human samples the following primers/probe combination was used with RPL13A as house-keeping gene: IFNG: forward, TCTCTCGGAAACGATGAAATATACAA; reverse, TTTTACATATGGGTCC TGGCAGTA; probe, ATCTTGGCTTTTCAGCTCTGCATCGTTTTG. IL17: forward, TGTGATCTGGGAGGCAAAGT; reverse, CCCACGGACACCAGTA TCTT; probe, AGCCTCCCTGCGCAGGACCA. IL4: forward, GCCTGG CGGGCTTGA; reverse, AGCCTTTCCAAGAAGTTTTCCA; probe, CCTGTCCTGTGAAGGAAGCCAACCA. CXCR3: forward, CTATGACTA TGGAGAAAACGAGAGTGA; reverse, GGCCCGGTCGAAGTTCA; probe, TCGTGCTGTACCTCCCCGCCC. CCR6: forward, TTGTACAGGCGACTA AGTCATTCC; reverse, CCCACACAACAAGGCAGATG; probe, CTCCGA TCCAGAACACTACCGCGC. RPL13A: forward, CTGTGAAGGCATCAACA TTTCTG; reverse, TCGGGAAGGGTTGGTGTTC; probe, TTGAAGTACCTGG CTTTCCTCCGCAA
Magnetic resonance imaging
MRI was performed at 9.4 T. Radiofrequency excitation and signal reception were accomplished by a birdcage resonator and a four-channel phased-array surface coil, respectively (both from Bruker Biospin MRI). Multislice fast spin-echo MRI was used to perform T2-weighted axial MRI with repetition time (TR) of 9,286 ms, echo time (TE) of 11 ms, RARE factor of 12, 60 slices, in-plane resolution of 120 μm × 120 μm, slice thickness of 480 μm and a total acquisition time (TA) of 195 s. In addition sagittal MRI (TR/TE = 4,333/11 ms, RARE factor = 12, 28 slices, in-plane resolution = 120 μm × 60 μm, slice thickness of 480 μm and TA = 182 s) was performed. T1-weighted fat-suppressed gradient-echo MRI (3D FLASH, TR/TE = 14.8/4.2 ms, flip angle = 25° and TA = 16 min) was performed at an isotropic resolution of 120 μm before and after intravenous injection of 30 μl gadobutrol, a Gd-based contrast agent (stock concentration: 1 mM, Gadovist, Bayer). The analysis followed a strategy previously developed for intra-individual comparisons of MR images49. For quantifying Gd enhancement, MRI signal intensities were evaluated. For this purpose, regions of interest (ROIs) were selected in a standardized manner: the signal intensity in the meninges was calculated using mid-sagittal T1-weighted planes; for the analysis of signal intensities in parietal cortex, corpus callosum and thalamus, T1-weighted images 0.5 mm lateral from the mid-sagittal plane were used. The mean signal intensity was measured for all ROIs and normalized to the signal intensity of the thalamus. Subsequently, the ratio between normalized signal intensity before and after Gd injection was calculated. For measuring its thickness, the corpus callosum was marked in T2-weighted planes 0.5 mm lateral from the mid-sagittal section by two parallel lines. The distance between those lines was measured at both endpoints. For measuring cortical thickness, the distance between corpus callosum and meninges was measured at three points. The measurements were taken in both hemispheres and subsequently averaged. Ventricular size was assessed by 3D reconstruction of the third and lateral ventricles from T2-weighted images. All analyses were performed with Fiji software.
Analysis of neuronal synaptic spine density
Rats were transcardially perfused with ice-cold 1× PBS (2 min) and 4% PFA (10 min) at the peak of T cell infiltration. Hemispheres were then separated and post-fixed in 4% PFA for 30 min. One hemisphere was set aside for histology, the other embedded in 2–3% low-melt agarose (Roth) and cut into 300-μm thick slices on a vibratome (Leica VT1200S). Slices were washed three times 15 min in 1× PBS. Cortical neurons were analysed using DiOlistic labelling on acute slices as described50. In brief, DiI-coated tungsten particles (0.7 and 1.7 μm in diameter; Bio-Rad) were delivered to the slices using a hand-held gene gun (Helios Gene Gun System, Bio-Rad). After 48 h, images were acquired by confocal microscopy. Synaptic spines in apical dendrites from DiI-stained L2/3 pyramidal neurons were counted on deconvoluted images using Fiji software. The number of spines was normalized per micrometre of dendritic length.
Confocal microscopy
Confocal microscopy was performed using a Zeiss Laser Scanning Microscope 710 (Carl Zeiss) controlled by Zeiss ZEN 2012 software (Carl Zeiss) and a custom-made microscope that combines two-photon, confocal and stimulated emission depletion microscopy (Abberior instruments). Fluorophores were excited using 405-nm UV-diode for DAPI, 488-nm Argon laser for GFP, a 561-nm DPSS laser for mCherry or DiI and a 633-nm HeNe laser for Cy5 dyes. Accordingly, filters were set from 415 to 470 nm for DAPI acquisition, 498 to 546 nm for GFP and 571 to 660 nm for mCherry/DiI/Cy5. A 40× oil/1.3 NA immersion objective Plan Apochromat objective (Carl Zeiss) was used. Images were acquired using a pinhole size of 50 μm. A z-step size of 0.5 μm was chosen to guarantee optimal z-resolution. T cell quantification was performed on single z-stack using the cell-counter plug-in in ImageJ with manual corrections.
Histology and immunohistochemistry
Rats were intracardially perfused with saline (10 min) followed by a fixative containing 4% PFA (15 min). Samples were post-fixed in the same fixative for 24 h and then transferred in 30% sucrose. Histological analysis was performed according to established procedures on paraffin and frozen sections. The following antibodies were used: mouse anti-rat RT1B-MHC class II antigen (clone OX-6, Serotec), rabbit anti-IBA1 (Wako), mouse anti-rat CD68 (clone ED1, Serotec), mouse anti-neurofilament marker (Biolegend), mouse anti-GFAP (Thermo Fisher), mouse anti-rat CD43 (clone W3/13, Biolegend), rabbit anti-β-synuclein (AB 5086, Millipore), rabbit anti-tyrosine hydroxylase (Millipore) and goat anti-mouse or goat anti-rabbit IgG antibodies labelled with Alexa Fluor 488, Alexa Fluor 555 or Alexa Fluor 647 (Invitrogen) as secondary antibodies. Images were acquired using either a VS120 Virtual Slide Microscope (Olympus) equipped with a 10× objective or with a Zeiss LSM700 confocal microscope equipped with a 40× Zeiss objective. For morphological quantification, images of brain sections cut coronally in series were acquired with a BZ-9000 Keyance microscope. The total length of the cortex ranging from the corpus callosum to the meningeal surface was measured along the orientation of the neuronal processes (dendrites) in the motor region M1 using the BZ-9000 Keyance software. In addition, the corpus callosum was measured at its thickest site close to the midline. Morphological analysis and 3D reconstruction of microglia stained with anti-rat IBA1 and astrocytes stained with anti-rat GFAP were done using Imaris 8.0.1 software (Bitplane AG) as previously described51. Confocal z-stacks with 0.5-μm step size were opened in Imaris and smoothed with both median and Gaussian filters. Single cells were rendered by first using the filament tool to reconstruct the processes and subsequently the surface tool to render the cell body. Process length and number of segments (segments between branch points or branch and endpoints) were analysed.
Electron microscopy
Rats were intracardially perfused with saline followed by a fixative containing 4% PFA and 1% glutaraldehyde. After postfixation in Ito’s solution and washing in cacodylate buffer, brain tissue was cut into 2 mm × 2 mm specimens. After postfixation in 1% osmium tetroxide, the specimens were dehydrated with graded alcohols and embedded in Epon (Roth). Then, 1-μm semi-thin sections were cut by a microtome (Reichert-Jung) and stained with Richardson’s staining. Ultrathin sections were cut with an Ultracut E microtome (Reichert-Jung), contrasted with lead citrate and uranyl acetate and imaged with a Zeiss EM 109.
Patients and control donors
T cell assays were performed using PBMCs prepared from 29 healthy controls, 40 patients with MS and 20 patients with Parkinson’s disease. Detailed clinical information is included in Extended Data Fig. 10a. This study was approved by the local ethical committee, and all patients gave their informed consent for the study.
Isolation of PBMCs, proliferation assay and CD3 stimulation
PBMCs isolated from human peripheral blood by Ficoll gradient were labelled with 5-chloromethylfluorescein diacetate (CFSE, Invitrogen) at a density of 1 × 10⁶ cells per ml using 0.5 μM CFSE and cultured for 7 days in the presence of the following antigens: human β-synuclein (50 μg ml−1, Abcam), human α-synuclein (50 μg ml−1, provided by M. Zweckstetter, MPIBC, Germany), MBP (50 μg ml−1), OVA (50 μg ml−1, Sigma-Aldrich) or staphylococcal enterotoxin B (10 μg ml−1, Sigma-Aldrich). Before measurements, cells were stained with a mix of anti-CD3–AF647 (clone UCTH1, Biolegend), anti-CD4–PE (clone RPA-T4, Biolegend) and anti-CD8–PECy5 (clone RPA-T8, Biolegend) antibodies. Dilution of fluorescent labels was measured in CD3+CD4+ T cells on FACSCalibur or FACSAria 4L SORP cell sorter flow cytometers (BD Biosciences). The percentage of proliferating CD3+CD4+ T cells was used as a read-out.
For unspecific stimulation of cytokine production, CFSE-labelled PBMC cultures after 7 days of incubation with specific antigens were added onto plates coated with anti-human CD3 monoclonal antibody (5 μg ml−1 in PBS, clone OKT3, Biolegend). After 12 h, brefeldin A (Sigma-Aldrich) was added to a concentration of 5 μg ml−1 for 3 h incubation at 37 °C, and then cells were stained with anti-CD3 and anti-CD4 antibodies (described above) for 30 min on ice. Intracellular staining was performed using a BD Cytofix/Cytoperm staining kit (BD Biosciences) according to the manufacturer’s protocol. The following antibodies were used: anti-human IL-17A monoclonal antibody (clone BL168, labelled with AlexaFluor647, Biolegend, dilution 1:50), anti-human IFNγ monoclonal antibody (clone B27; labelled PacificBlue, dilution 1: 50) and isotype control antibodies (mouse IgG1k–PB and IgG1k–AF647, both from Biolegend).
ELISA for IFNγ and IL-17
PBMCs were cultured as described above the in presence of either human β-synuclein or MBP. After seven days in culture, supernatants were collected. An ELISA assay for detecting IFNγ and IL-17 concentrations was performed according to the manufacturer’s protocol (R&D).
Statistical analysis
Statistical analysis was performed using GraphPad Prism 7.03 software (GraphPad Software). The tests performed and confidence intervals are indicated in the figure legends.
Reporting summary
Further information on research design is available in the Nature Research Reporting Summary linked to this article.
Data availability
The datasets generated during and/or analysed during the current study are available from the corresponding authors on reasonable request.
Additional information
Publisher’s note: Springer Nature remains neutral with regard to jurisdictional claims in published maps and institutional affiliations.
Change history
13 March 2019
In this Article, owing to an error during the production process, the y-axis label of Fig. 2c should read “Number of Tβ-syn cells” rather than “Number of T1β-syn cells” and the left and right panels of Fig. 4 should be labelled ‘a’ and ‘b’, respectively. These errors have been corrected online.
References
- 1.
Peterson, J. W., Bö, L., Mörk, S., Chang, A. & Trapp, B. D. Transected neurites, apoptotic neurons, and reduced inflammation in cortical multiple sclerosis lesions. Ann. Neurol. 50, 389–400 (2001).
- 2.
Lucchinetti, C. F. et al. Inflammatory cortical demyelination in early multiple sclerosis. N. Engl. J. Med. 365, 2188–2197 (2011).
- 3.
Trapp, B. D. et al. Cortical neuronal densities and cerebral white matter demyelination in multiple sclerosis: a retrospective study. Lancet Neurol. 17, 870–884 (2018).
- 4.
Calabrese, M. et al. Exploring the origins of grey matter damage in multiple sclerosis. Nat. Rev. Neurosci. 16, 147–158 (2015).
- 5.
Wekerle, H., Kojima, K., Lannes-Vieira, J., Lassmann, H. & Linington, C. Animal models. Ann. Neurol. 36, S47–S53 (1994).
- 6.
George, J. M. The synucleins. Genome Biol. 3, reviews3002.1 (2002).
- 7.
Mor, F., Quintana, F., Mimran, A. & Cohen, I. R. Autoimmune encephalomyelitis and uveitis induced by T cell immunity to self β-synuclein. J. Immunol. 170, 628–634 (2003).
- 8.
Flügel, A. et al. Migratory activity and functional changes of green fluorescent effector cells before and during experimental autoimmune encephalomyelitis. Immunity 14, 547–560 (2001).
- 9.
Ben-Nun, A., Wekerle, H. & Cohen, I. R. The rapid isolation of clonable antigen-specific T lymphocyte lines capable of mediating autoimmune encephalomyelitis. Eur. J. Immunol. 11, 195–199 (1981).
- 10.
Odoardi, F. et al. T cells become licensed in the lung to enter the central nervous system. Nature 488, 675–679 (2012).
- 11.
Bartholomäus, I. et al. Effector T cell interactions with meningeal vascular structures in nascent autoimmune CNS lesions. Nature 462, 94–98 (2009).
- 12.
Reboldi, A. et al. C-C chemokine receptor 6-regulated entry of TH-17 cells into the CNS through the choroid plexus is required for the initiation of EAE. Nat. Immunol. 10, 514–523 (2009).
- 13.
Rothhammer, V. et al. Th17 lymphocytes traffic to the central nervous system independently of α4 integrin expression during EAE. J. Exp. Med. 208, 2465–2476 (2011).
- 14.
Stromnes, I. M., Cerretti, L. M., Liggitt, D., Harris, R. A. & Goverman, J. M. Differential regulation of central nervous system autoimmunity by TH1 and TH17 cells. Nat. Med. 14, 337–342 (2008).
- 15.
Kroenke, M. A., Carlson, T. J., Andjelkovic, A. V. & Segal, B. M. IL-12- and IL-23-modulated T cells induce distinct types of EAE based on histology, CNS chemokine profile, and response to cytokine inhibition. J. Exp. Med. 205, 1535–1541 (2008).
- 16.
Li, J.-Y., Henning Jensen, P. & Dahlström, A. Differential localization of α-, β- and γ-synucleins in the rat CNS. Neuroscience 113, 463–478 (2002).
- 17.
Lodygin, D. et al. A combination of fluorescent NFAT and H2B sensors uncovers dynamics of T cell activation in real time during CNS autoimmunity. Nat. Med. 19, 784–790 (2013).
- 18.
Macian, F. NFAT proteins: key regulators of T-cell development and function. Nat. Rev. Immunol. 5, 472–484 (2005).
- 19.
Flügel, A. et al. Neuronal FasL induces cell death of encephalitogenic T lymphocytes. Brain Pathol. 10, 353–364 (2000).
- 20.
Ng, Y.-K. & Ling, E.-A. Emperipolesis of lymphoid cells in vagal efferent neurons following an intraneural injection of ricin into the vagus nerve in rats. Neurosci. Lett. 270, 153–156 (1999).
- 21.
Pette, M. et al. Myelin autoreactivity in multiple sclerosis: recognition of myelin basic protein in the context of HLA-DR2 products by T lymphocytes of multiple-sclerosis patients and healthy donors. Proc. Natl Acad. Sci. USA 87, 7968–7972 (1990).
- 22.
Ota, K. et al. T-cell recognition of an immunodominant myelin basic protein epitope in multiple sclerosis. Nature 346, 183–187 (1990).
- 23.
Bahbouhi, B. et al. T cell recognition of self-antigen presenting cells by protein transfer assay reveals a high frequency of anti-myelin T cells in multiple sclerosis. Brain 133, 1622–1636 (2010).
- 24.
Elong Ngono, A. et al. Frequency of circulating autoreactive T cells committed to myelin determinants in relapsing-remitting multiple sclerosis patients. Clin. Immunol. 144, 117–126 (2012).
- 25.
Latorre, D. et al. T cells in patients with narcolepsy target self-antigens of hypocretin neurons. Nature 562, 63–68 (2018).
- 26.
Cao, Y. et al. Functional inflammatory profiles distinguish myelin-reactive T cells from patients with multiple sclerosis. Sci. Transl. Med. 7, 287ra74 (2015).
- 27.
Jelcic, I. et al. Memory B cells activate brain-homing, autoreactive CD4+ T cells in multiple sclerosis. Cell 175, 85–100 (2018).
- 28.
Sulzer, D. et al. T cells from patients with Parkinson’s disease recognize α-synuclein peptides. Nature 546, 656–661 (2017).
- 29.
Lassmann, H. Multiple sclerosis pathology. Cold Spring Harb. Perspect. Med. 8, a028936 (2018).
- 30.
Arima, Y. et al. Regional neural activation defines a gateway for autoreactive T cells to cross the blood–brain barrier. Cell 148, 447–457 (2012).
- 31.
Krishnamoorthy, G. et al. Myelin-specific T cells also recognize neuronal autoantigen in a transgenic mouse model of multiple sclerosis. Nat. Med. 15, 626–632 (2009).
- 32.
Derfuss, T. et al. Contactin-2/TAG-1-directed autoimmunity is identified in multiple sclerosis patients and mediates gray matter pathology in animals. Proc. Natl Acad. Sci. USA 106, 8302–8307 (2009).
- 33.
Shibayama-Imazu, T. et al. Cell and tissue distribution and developmental change of neuron specific 14 kDa protein (phosphoneuroprotein 14). Brain Res. 622, 17–25 (1993).
- 34.
Taschenberger, G. et al. β-Synuclein aggregates and induces neurodegeneration in dopaminergic neurons. Ann. Neurol. 74, 109–118 (2013).
- 35.
Liddelow, S. A. et al. Neurotoxic reactive astrocytes are induced by activated microglia. Nature 541, 481–487 (2017).
- 36.
Petersen, M. A., Ryu, J. K. & Akassoglou, K. Fibrinogen in neurological diseases: mechanisms, imaging and therapeutics. Nat. Rev. Neurosci. 19, 283–301 (2018).
- 37.
Di Liberto, G. et al. Neurons under T cell attack coordinate phagocyte-mediated synaptic stripping. Cell 175, 458–471 (2018).
- 38.
Tuohy, V. K., Yu, M., Weinstock-Guttman, B. & Kinkel, R. P. Diversity and plasticity of self recognition during the development of multiple sclerosis. J. Clin. Invest. 99, 1682–1690 (1997).
- 39.
Lois, C., Hong, E. J., Pease, S., Brown, E. J. & Baltimore, D. Germline transmission and tissue-specific expression of transgenes delivered by lentiviral vectors. Science 295, 868–872 (2002).
- 40.
Määttä, J. A., Coffey, E. T., Hermonen, J. A., Salmi, A. A. & Hinkkanen, A. E. Detection of myelin basic protein isoforms by organic concentration. Biochem. Biophys. Res. Commun. 238, 498–502 (1997).
- 41.
Flügel, A., Willem, M., Berkowicz, T. & Wekerle, H. Gene transfer into CD4+ T lymphocytes: green fluorescent protein-engineered, encephalitogenic T cells illuminate brain autoimmune responses. Nat. Med. 5, 843–847 (1999).
- 42.
Chmielewski, M. et al. T cells that target carcinoembryonic antigen eradicate orthotopic pancreatic carcinomas without inducing autoimmune colitis in mice. Gastroenterology 143, 1095–107 (2012).
- 43.
Doorn, K. J. et al. Brain region-specific gene expression profiles in freshly isolated rat microglia. Front. Cell. Neurosci. 9, 84 (2015).
- 44.
Torres-Nagel, N. E., Gold, D. P. & Hünig, T. Identification of rat Tcrb-V8.2, 8.5, and 10 gene products by monoclonal antibodies. Immunogenetics 37, 305–308 (1993).
- 45.
Smith, L. R., Kono, D. H. & Theofilopoulos, A. N. Complexity and sequence identification of 24 rat V beta genes. J. Immunol. 147, 375–379 (1991).
- 46.
Schläger, C., Litke, T., Flügel, A. & Odoardi, F. In vivo visualization of (auto)immune processes in the central nervous system of rodents. Methods Mol. Biol. 1304, 117–129 (2014).
- 47.
Schläger, C. et al. Effector T-cell trafficking between the leptomeninges and the cerebrospinal fluid. Nature 530, 349–353 (2016).
- 48.
Shevtsova, Z., Malik, J. M., Michel, U., Bähr, M. & Kügler, S. Promoters and serotypes: targeting of adeno-associated virus vectors for gene transfer in the rat central nervous system in vitro and in vivo. Exp. Physiol. 90, 53–59 (2005).
- 49.
Watanabe, T. et al. In vivo 3D MRI staining of the mouse hippocampal system using intracerebral injection of MnCl2. Neuroimage 22, 860–867 (2004).
- 50.
Rauskolb, S. et al. Global deprivation of brain-derived neurotrophic factor in the CNS reveals an area-specific requirement for dendritic growth. J. Neurosci. 30, 1739–1749 (2010).
- 51.
Erny, D. et al. Host microbiota constantly control maturation and function of microglia in the CNS. Nat. Neurosci. 18, 965–977 (2015).
Acknowledgements
We thank A. Stas, S. Mole, A. Mönnich, S. Hamann, M. Weig and H. Nguyen for technical assistance, C. Ludwig for text editing, G. Salinas-Riester for her support in performing the transcriptome analyses, K. Raithatha for her help in analysing the transcriptome data, H. Abken, S. Brioschi, L. Flügel, T. Issekutz, P. and W. von der Meide, M. Simons, T. Michaelis and M. Korte for providing reagents and/or technical, scientific or clinical advice and M. Gößwein for help with the artwork. This work was supported by the German Research Foundation (RK-Grant FL 377/3-1, FL 377/2-2; SFB 1328/1 A01, OD 87/1-1), the Federal Ministry for Education and Research (Competence Network Multiple Sclerosis, KKNMS), ERANET consortium MELTRA-BBB and the Ministry of Science and Culture of Lower Saxony (Niedersachsen-Research Network on Neuroinfectiology, N-RENNT).
Author information
Author notes
These authors contributed equally: Dmitri Lodygin, Moritz Hermann
These authors jointly supervised this work: Francesca Odoardi, Alexander Flügel
Affiliations
Institute for Neuroimmunology and Multiple Sclerosis Research, University Medical Center Göttingen, Göttingen, Germany
- Dmitri Lodygin
- , Moritz Hermann
- , Nils Schweingruber
- , Corinna Schlosser
- , Arianna Merlini
- , Henrike Körner
- , Hsin-Fang Chang
- , Henrike J. Fischer
- , Michael Haberl
- , Francesca Odoardi
- & Alexander Flügel
Institute of Functional and Clinical Anatomy, Friedrich-Alexander-University Erlangen-Nürnberg, Erlangen, Germany
- Cassandra Flügel-Koch
Biomedizinische NMR, Max-Planck-Institut für biophysikalische Chemie, Göttingen, Germany
- Takashi Watanabe
- & Jens Frahm
Institute for Cellular and Molecular Immunology, University Medical Center Göttingen, Göttingen, Germany
- Holger M. Reichardt
Zoological Institute, Division of Cellular Neurobiology, Technical University Braunschweig, Braunschweig, Germany
- Marta Zagrebelsky
Paracelsus-Elena-Klinik Kassel, Kassel, Germany
- Brit Mollenhauer
Institute for Neurology, University Medical Center Göttingen, Göttingen, Germany
- Brit Mollenhauer
- , Sebastian Kügler
- & Dirk Fitzner
Institute for Neuropathology, University Medical Center Göttingen, Göttingen, Germany
- Christine Stadelmann
Center for Biostructural Imaging of Neurodegeneration, Göttingen, Germany
- Francesca Odoardi
Authors
Search for Dmitri Lodygin in:
Search for Moritz Hermann in:
Search for Nils Schweingruber in:
Search for Cassandra Flügel-Koch in:
Search for Takashi Watanabe in:
Search for Corinna Schlosser in:
Search for Arianna Merlini in:
Search for Henrike Körner in:
Search for Hsin-Fang Chang in:
Search for Henrike J. Fischer in:
Search for Holger M. Reichardt in:
Search for Marta Zagrebelsky in:
Search for Brit Mollenhauer in:
Search for Sebastian Kügler in:
Search for Dirk Fitzner in:
Search for Jens Frahm in:
Search for Christine Stadelmann in:
Search for Michael Haberl in:
Search for Francesca Odoardi in:
Search for Alexander Flügel in:
Contributions
D.L. designed and cloned the TCR genes for the TCR transgenic rat and analysed the transgenic model. M. Hermann performed most two-photon laser-scanning microscopy experiments and, together with T.W., performed MRI. N.S. collected and analysed the human samples. C.F.-K. with the support of H.K. performed most of the morphological analyses. C. Schlosser analysed the initial grey matter disease model. A.M. performed transcriptome and functional analyses. H.-F.C. established the CAR system. H.J.F. performed oocyte injections. H.M.R. contributed his expertise in rat transgenesis, M.Z. helped to analyse neurodegeneration and B.M. recruited patients with PD. S.K. provided the AAVs. D.F. collected samples from patients with MS. J.F. helped with providing and optimizing MRI technology, C. Stadelmann provided advice on CNS pathology and M. Haberl helped to analyse the NGS data. F.O. performed most of the ex vivo T cell and APC analyses. A.F. together with F.O. designed the study, coordinated the experimental work and wrote the manuscript with inputs from co-authors.
Competing interests
The authors declare no competing interests.
Corresponding authors
Correspondence to Francesca Odoardi or Alexander Flügel.
Extended data figures and tables
Extended Data Fig. 1 Characterization of wild-type and TCR-transgenic Tβ-syn cells in vitro and in vivo.
a, Identification of the immunogenic β-synuclein peptides in Lewis rats. Screening of a β-synuclein peptide library covering the full-length protein for identification of immunogenic peptides. OVA, MBP, concanavalin A (ConA) and a mix of all peptides were used as control. The proliferation of αβTCR+CD4+ T cells isolated from β-synuclein-immunized wild-type rats was measured by flow cytometry. Data are mean + s.e.m. from two independent experiments. b, Antigen response of established effector T cell lines. Wild-type Tβ-syn or TMBP cell lines were cultured in the absence of antigen (No) or stimulated with ConA or the indicated antigens for 72 h. Proliferation was determined by 3H-thymidine incorporation. Data are mean + s.e.m. Representative data of at least four independent experiments. c, Phenotype of Tβ-syn and TMBP cell lines. Expression of αβTCR, CD4, CD8 and of surface activation markers CD134 and CD25 in cultured wild-type Tβ-syn and TMBP cells. Flow cytometry was performed two days (blast T cells) and seven days (resting T cells) after antigen stimulation. IgG, isotype control. d, Histological quantification of Tβ-syn and TMBP cells in cortical grey matter and corpus callosum (white matter) at the peak of T cell infiltration. Data are mean + s.e.m., n = 5 from 2 independent experiments. Unpaired two-tailed t-test. ***P < 0.001. e, Wild-type Tβ-syn cells induce clinical disease. Representative disease course upon intravenous transfer of wild-type Tβ-syn or TMBP cells. Data are mean + s.d., n = 6–8 per group. Representative data of at least six independent experiments. f, Photographs illustrating frontlimb paralysis induced by Tβ-syn cells and classical EAE hindlimb paralysis induced by TMBP cells. g, Expression of Trbv genes in wild-type Tβ-syn cells isolated ex vivo at the onset of Tβ-syn cell brain infiltration. Relative frequency was calculated in Tβ-syn cells from blood and CNS and expressed as ratio of reads mapping to a particular Trbv genomic segment to the number of reads mapping to the constant region of the TCR β chain encoded by Trbc1 and Trbc2 (RNA-seq analysis, n = 3 per group). Data are mean + s.d. h, Production of IFNγ by lymph node cells isolated from naive wild-type and TCR-transgenic (Tg) donors in response to β-syn93–111 measured by ELISA. Data are mean ± s.d. i, Immunization of TCR-transgenic rats with β-syn93–111 results in a monophasic clinical disease. Bars and lines indicate clinical score and relative weight change, respectively (mean ± s.d.). Representative data from two independent experiments (n = 10). j, Expression of surface markers on wild-type Tβ-syn (blue) and transgenic Tβ-syn (green) cell lines. k, TCR repertoire in transgenic Tβ-syn cell lines is dominated by transgenic TCR Vβ8.3 chain expression. j, k, Flow cytometry data. l, Expression of Trbv genes in transgenic Tβ-syn cell lines determined by RNA-seq analysis. Analysis and normalization of data as in g. n = 3 per group. m, n, Proliferative response measured by 3H-thymidine incorporation (m) and IFNγ secretion measured by ELISA (n) in wild-type Tβ-syn (blue) and transgenic Tβ-syn (green) cell lines stimulated with the indicated amount of cognate (β-syn) or non-cognate (MBP, OVA) antigens. Data are mean ± s.d. o, Intracellular staining for IFNγ and IL-17 in TMBP and Tβ-syn cell lines stimulated with anti-CD3 monoclonal antibodies. Representative data from at least three independently established T cell lines. p, Quantification of transgenic Tβ-syn cells infiltrating the cortical grey matter or the corpus callosum (white matter) measured by flow cytometry at the peak of T cell infiltration (n = 5). q, Clinical disease induced by transgenic Tβ-syn effector cells (n = 15). p, q, Data are mean + s.e.m.
Extended Data Fig. 2 Migration properties and differentiation phenotype of Tβ-syn cells.
a, Tβ-syn and TMBP cells follow similar migratory routes before invading the CNS. Numbers of Tβ-syn and TMBP cells in the indicated organs quantified every 24 h p.t. by flow cytometry. Data are mean + s.e.m. Representative data of three independent experiments including at least three rats per group per time point. b, Tβ-syn and TMBP cells switch from an activated state to a migratory mode. Gene expression changes between migratory T cells (isolated from blood at the onset of CNS infiltration, that is, at day 3 p.t.) and in vitro T cells (24 h after antigen challenge) as measured by RNA-seq analysis. The ratio between the expression in migratory and in vitro activated T cells for the indicated genes is displayed. Data are mean + s.e.m., n = 9–15 per group from 3 independent experiments. c, d, Tβ-syn and TMBP cells display very similar intravascular migration behaviour. Intravital TPLSM recordings were performed upon first arrival of Tβ-syn or TMBP cells in the leptomeningeal brain vessels. c, Representative migratory path of Tβ-syn or TMBP cells over a 30-min recording time. Rolling cells appear as multiple dots. Green, T cell tracks projected over time; red, blood vessels and leptomeningeal phagocytes. Representative data of at least four independent experiments (obtained from individual rats). d, Crawling velocity and track duration of Tβ-syn and TMBP cells. Data are mean ± s.e.m. The number of analysed T cells is indicated. e, f, Tβ-syn and TMBP cells are similar in integrin and cytokine expression and chemokine responsiveness. e, Relative expression (normalized to Actb) of the indicated integrins, chemokine receptors and cytokines as measured by quantitative PCR in Tβ-syn and TMBP cells isolated from the blood at the onset of T cell CNS infiltration. Data are mean + s.d., n = 3 rats per group. f, Chemotactic response to the indicated chemokines of ex vivo-isolated Tβ-syn and TMBP cells. Data are mean + s.d., n = 2 per group. g–i, VLA-4 crucially determines Tβ-syn cell invasion into the brain. g, h, Tβ-syn cell motility was recorded by intravital TPLSM upon first arrival of Tβ-syn cells in the leptomeningeal brain vessels before and immediately after intravenous injection of blocking anti-VLA-4 monoclonal antibody. g, Representative 30-min time-lapse recordings of Tβ-syn cell migratory paths. Green, 30-min Tβ-syn cell track projections; red, Texas red dextran-labelled vessels. Representative data of at least four independent experiments (obtained from individual rats). h, Percentage of crawling or rolling Tβ-syn cells before and after anti-VLA-4 monoclonal antibody treatment (arrow) relative to time point 0. Data are mean ± s.e.m. of n = 3. i, Clinical disease after applications of anti-VLA-4 or isotype monoclonal antibodies (control). Arrows indicate the time point of treatment. Data are mean + s.e.m. of n = 4 per group. Representative data of three independent experiments. j–l, LFA-1 integrin does not contribute to Tβ-syn cell invasion in the brain. Intravital TPLSM recordings were performed as in g before and after anti-LFA-1 monoclonal antibody administration. j, Representative 30-min time-lapse recordings of Tβ-syn cell migratory paths. Green, Tβ-syn cell tracks projected over time; red, Texas red dextran-labelled vessels. Representative data of at least four independent experiments (obtained from individual rats). k, Percentage of crawling or rolling Tβ-syn cells before and after monoclonal antibody treatment quantified as in h. Data are mean ± s.e.m. of n = 3. l, Disease course in Tβ-syn cell recipient rats treated either with anti-LFA-1 or isotype monoclonal antibodies (control) at the indicated time points (arrows). Data are mean + s.e.m. of n = 4 per group. Representative data of three independent experiments. m, Saturation of monoclonal antibody binding (in g–i and j–l experiments) was controlled by staining of blood-derived Tβ-syn cells with anti-VLA-4 or anti-LFA-1 primary monoclonal antibodies followed by secondary detection antibody (red) or with secondary antibody only (black). n, o, IL-17 or IFNγ blockade partially interferes with Tβ-syn cell entry into the brain. n, Disease course in Tβ-syn-cell-transferred rats intrathecally treated at the indicate time points (arrows) with PBS (control), anti-IL-17 or anti-IFNγ monoclonal antibodies. Data are mean + s.e.m. of n = 4 per group. Representative data of three independent experiments. o, Quantification of macrophages (MΦ, CD11b+CD45high), CD4+ and CD8+ T cells infiltrating the brain leptomeninges and the brain parenchyma at the peak of clinical disease. Data are mean + s.e.m. of four rats per group. Representative data of two independent experiments. n, o, Unpaired two-tailed t-test. *P < 0.05, **P < 0.01, ***P < 0.001.
Extended Data Fig. 3 Tβ-syn cell infiltration into CNS tissue correlates with β-synuclein expression.
a, Coronal section of naive rat brain. Left, immunostaining for β-synuclein (red) and tyrosine hydroxylase (TH, green). Middle, colour-coded intensity of β-synuclein expression. Right, inflamed brain at the peak of Tβ-syn cell (red) infiltration. Green, TH. Co, cortex; HC, hippocampus; cc, corpus callosum; SN, substantia nigra; CS, colliculus superior; dhc, dorsal hippocampal commissure; cp, cerebral peduncle; dcw, deep cerebral white matter; Ac, aqueduct; MM, mammillary nucleus; pc, posterior commissure. b, Enlarged view of selected regions (i–iii) indicated by frames in a. c, Inflammatory infiltration of the eye. Left, cross-section at the peak of Tβ-syn cell (red) infiltration. Green, CD68+ cells (activated microglia and macrophages). Enlarged view of a selected area (i) is shown in the middle panel. Right, β-synuclein expression within the eye (naive rat). Asterisks indicate the autofluorescent inner and outer segments of the photoreceptor cells. R, retina; CH, choroid; GCL, ganglion cell layer; IPL, inner plexiform layer; OPL, outer plexiform layer; INL, inner nuclear layer; ONL, outer nuclear layer; S, sclera.
Extended Data Fig. 4 Tβ-syn cells are reactivated in the brain.
a–e, Tβ-syn cells isolated from their target organ display an activated phenotype. a, Expression of selected sets of genes (grouped in functional classes) determined by RNA-seq analysis of Tβ-syn cells isolated from blood, brain meninges and brain parenchyma at the onset of Tβ-syn cell CNS infiltration. RPKM, reads per kilobase per million mapped reads. Data are mean + s.e.m., n = 9–15 per group from 3 independent experiments. Genes for which the expression in Tβ-syn cells from brain was significantly different from the expression in Tβ-syn cells from blood are highlighted by a red overlay colour. Unpaired two-tailed t-test. b, IFNγ and IL-17 expression (intracellular staining) in Tβ-syn cells isolated from blood and brain at the peak of T cell infiltration. Representative data of three independent experiments. c, Surface membrane activation marker (CD25 and CD134) expression in Tβ-syn cells isolated from the indicated compartments at the onset of Tβ-syn cell CNS infiltration determined by flow cytometry. d, Expression of Ifng and Il17a mRNA in Tβ-syn cells isolated from brain meninges, brain parenchyma, cortical grey matter and corpus callosum (white matter) measured by quantitative PCR (normalized to Actb). Data are mean + s.e.m. Representative data from two independent experiments. Unpaired two-tailed t-test. *P < 0.05, **P < 0.01. e, Top 50 differentially expressed genes in Tβ-syn cells isolated from blood, brain meninges and parenchyma at day 3 p.t. determined by RNA-seq. Heat map shows z-transformed relative expression values. Each column represents a gene, each row represents a biological replicate. Genes known to be regulated by TCR-driven activation are indicated. f, Tβ-syn cells, in contrast to TMBP cells, are strongly activated in the brain. Left, Ifng and Il17a relative expression (normalized to Actb) in Tβ-syn or TMBP cells isolated from blood or from the indicated CNS compartments at the indicated time points p.t. determined by quantitative PCR. Right, expression of the cytokines in the corresponding total CNS tissues. Data are mean + s.d. of three independent experiments. g, Tβ-syn cells do not proliferate in the brain. Histogram plots, Ki-67 expression of in vitro-cultured Tβ-syn cells (two and six days after antigenic stimulation) or of Tβ-syn cells isolated ex vivo from blood and brain at the peak of T cell infiltration. Grey, isotype control. Dot plots, corresponding quantification of BrdU incorporation. Representative data of three independent experiments. h, Kinetics of NFAT translocations in activated Tβ-syn–NFAT cells in vitro. Plot, quantification of T cells with nuclear or cytoplasmic NFAT reporter over the period of 36 h after stimulation. Numbers of counted Tβ-syn–NFAT cells are indicated. Representative fluorescent images showing Tβ-syn–NFAT cells with nuclear (closed arrowheads) or cytoplasmic (open arrowheads) NFAT reporter are shown. i–k, Detection of NFAT translocations in situ. i, Histologic analysis of brain tissue at the onset of disease. Top, fluorescent overview images of a coronal brain section with magnified views. bottom, selected region acquired at higher magnification. Green, Tβ-syn–NFAT cells; red, MHC class II+ cells; blue, DAPI (not depicted in the top panel). Filled and open arrowheads indicate T cells with nuclear and cytoplasmic localization of the NFAT–YFP reporter, respectively. Dashed line indicates the position of an area presented in Fig. 3a. j, Confocal images showing representative Tβ-syn–NFAT cells with nuclear NFAT reporter in the parenchyma and meninges of the cortex. Individual z planes. k, In vivo visualization of de novo NFAT reporter translocation. Top, intravital TPLSM recording of NFAT translocation from the cytoplasm (open arrowhead) to the nucleus (closed arrowhead). Bottom, single z planes (shown as single colours and merged channels), maximum intensity projections (MIP) and 3D-rendered images depict the same Tβ-syn–NFAT-CherryH2B cell before (0 min) and after (30 min) NFAT translocation. Histogram profile shows YFP and mCherry fluorescence intensities along the line indicated on the adjacent image.
Extended Data Fig. 5 Activation of Tβ-syn cells within the brain is critical for their infiltration and for secondary immune cell recruitment and clinical disease.
a, Microglia from CNS grey matter is inefficient to present antigen to TMBP cells. Microglial cells isolated from brain parenchyma (total brain) or from cortical grey matter were cocultured for 48 h with TMBP cells (left) or TOVA cells (right) with or without addition of cognate antigen. Anti-MHC class II blocking monoclonal antibodies or PBS were added for each condition. IFNγ production was measured by ELISA. Representative data from three independent experiments per cell type. Data are mean + s.e.m., n = 3. b–d, Blocking antigen presentation in vivo by intrathecal injection of anti-MHC class II monoclonal antibody prevents Tβ-syn cell entry into the brain and local reactivation. b, Number of Tβ-syn cells in blood, brain meninges and brain parenchyma in rats treated with PBS (control) or anti-MHC-II monoclonal antibodies quantified at the onset of disease and the corresponding rate of infiltration in the brain compartments normalized to blood. Flow cytometry data. c, Quantification of the number of macrophages (CD11b+CD45high cells), CD4+ and CD8+ T cells recruited to the indicated brain compartments. b, c, Representative data of two independent experiments including at least three rats per group. d, Relative expression of inflammatory cytokines (normalized to Actb) either in Tβ-syn cells isolated from the indicated brain compartments (left) or in brain tissues (right) assessed by quantitative PCR. Data are mean + s.e.m. of n = 3. Representative data of two independent experiments. e–g, Effect of FK506 treatment on the infiltration of Tβ-syn cells into the grey matter of the brain. e, Coronal brain sections (fluorescence overview images and magnified views of selected areas) from control (clinical score 1.5) or FK506-treated (clinical score 0) rats. Red, Tβ-syn cells; green/yellow, tissue autofluorescence. f, Numbers of T β-syn cells and recruited myeloid cells (CD11bhigh) in the indicated compartments determined by flow cytometry. Data are mean + s.e.m., n = 3 per group. g, Expression of CD25 and CD134 on Tβ-syn cells. a, One-way ANOVA with Dunnet’s correction for multiple comparison. b–d, f, Unpaired two-tailed t-test. *P < 0.05, **P < 0.01, ***P < 0.001.
Extended Data Fig. 6 Antigen availability determines T cell infiltration into the brain.
a, In vitro activation of TOVA–CAR cells. Relative expression of IFNγ in TOVA–CAR cells challenged in vitro with biotin anti-mouse IgG at the indicated doses in the presence or absence of streptavidin. Quantitative PCR performed at the indicated time points after challenge. Stimulation of TOVA–CAR cells at the matching time points with anti-CD3/CD28 is shown as comparison (right plot) (normalized to β-actin). b, In vivo activation prompts TOVA–CAR and myeloid-cell entry into the brain. Plot, number of TOVA–CAR cells in brain meninges and brain parenchyma quantified by flow cytometry 3 days p.t. Rats were injected intrathecally or i.c.v. with biotin anti-mouse IgG (anti-CAR) 6 h before analysis, to trigger T cell activation. Control, PBS-treated animals. Data are mean + s.e.m. Cumulative data of three independent experiments including two animals per group. Intravital TPLSM images of the brain cortex three days p.t. are shown. TOVA–CAR cells show infiltration of CD11b+ cells labelled by intrathecal injection of SeTau647-conjugated anti-CD11b monoclonal antibodies (magenta). Recordings were performed 6 h after i.c.v. injection of PBS (control) or anti-mouse IgG1 (anti-CAR). c, d, Effector T cell entry into the brain is boosted by increased antigen availability. Plots, quantification of TOVA cells (c) or TMBP cells (d) in the indicated brain compartments 3 days p.t. Rats were injected i.c.v. with the cognate antigen 12 h before analysis. n = 2 per T cell specificity. Corresponding intravital TPLSM images are shown. Green, antigen-specific T cells; red, blood vessels and macrophages. e–g, Neuronal overexpression of β-synuclein strongly increases Tβ-syn cell invasion into the brain. e, Fluorescence overview images and magnified views of selected areas of coronal brain sections depicting the pattern of Tβ-syn cell infiltration at the peak of the T cell grey matter infiltration. The rats had been neonatally injected with AAVs expressing GFP or β-syn–GFP under the synapsin promoter. Representative data of three independent experiments. Red, Tβ-syn cells; Grey (false colour), GFP- or β-synuclein-expressing neurons. f, Quantitative analyses of Tβ-syn cells by intravital TPLSM in AAV-β-syn-GFP or AAV-GFP rats. Number of grey-matter-infiltrating Tβ-syn cells (left) and their velocity over a 30-min period (right). Note the decreased speed of Tβ-syn cells in rats overexpressing β-synuclein, indicating local T cell activation. n = 2 from 2 independent experiments. g, Neuronal overexpression of β- but not γ-synuclein increases Tβ-syn cell entry into the brain. Fluorescence overview pictures and magnified cortical areas at the peak of Tβ-syn cell infiltration depicting the infiltration pattern of Tβ-syn cells into the brain of rats overexpressing β- or γ-synuclein in neurons. Red, Tβ-syn cells; grey (false colour), neurons overexpressing β- or γ-synuclein. Representative data of two independent experiments. b–d, Unpaired two-tailed t-test. f, Mann–Whitney U-test. *P < 0.05, **P < 0.01, ***P < 0.001, ****P < 0.001.
Extended Data Fig. 7 Tβ-syn cell activation drives immune cell recruitment.
a, Recruitment of host T cells and myeloid cells determined by flow cytometry at the peak of disease induced by Tβ-syn cell transfer. Data are mean + s.e.m., n = 3. b–d, Tβ-syn cell invasion in the CNS drives recruitment of CNS-ignorant TOVA cells. b, TOVA cell recruitment to the grey matter cortex after transfer of TOVA–Tomato cells alone (top) or after cotransfer with Tβ-syn–Turquoise cells (bottom). Left, fluorescence overview images and magnified views of selected areas of coronal brain sections. Right, TPLSM individual stacks and corresponding migratory paths of Tβ-syn and/or TOVA cells over a 30-min recording time. Data were acquired 3.5 days after T cell transfer. Arrows point to representative TOVA cells. Red, TOVA cells; turquoise, Tβ-syn cells, green, blood vessels (labelled by FITC-conjugated dextran). Representative data of at least three independent experiments (obtained from individual rats). c, Time course of T cell infiltration in the indicated compartments upon single transfer of TOVA–Tomato cells or cotransfer of Tβ-syn–Turquoise and TOVA–Tomato cells, determined by flow cytometry. Data are mean + s.e.m., n = 3 per time point. Representative data of two independent experiments. d, TOVA cells are not reactivated in the brain. Expression level of the indicated cytokines measured by quantitative PCR in Tβ-syn and TOVA cells isolated from the indicated compartments upon cotransfer. Data are mean + s.e.m., n = 3. Representative data of two independent experiments. e, FK506 treatment prevents TOVA-cell recruitment to the grey matter tissue. Fluorescence overview images as in b from control (clinical score 2) or FK506-treated (clinical score 0) rats 3.5 days after cotransfer. Representative images of two independent experiments including three rats per group. f, Blockade of antigen presentation by intrathecal administration of anti-MHCII monoclonal antibodies effectively reduces immune cell recruitment to the brain in the cotransfer experiment. Left, ratio of the numbers of Tβ-syn or TOVA cells in brain tissue to the number of Tβ-syn or TOVA cells in blood. Data are mean + s.e.m., n = 3. Middle and right, absolute number of myeloid cells or T cells in the brain tissue measured by flow cytometry 3.5 days after cotransfer of Tβ-syn and TOVA cells. Data are mean + s.e.m., n = 3. f, Unpaired two-tailed t-test. *P < 0.05.
Extended Data Fig. 8 Inflammatory changes to the brain tissue during acute disease induced by transfer of Tβ-syn cells.
a–d, Tβ-syn cell infiltration into the brain leptomeninges is associated with BBB leakage. a, Representative T1-weighted MRI images highlighting the areas of Gd leakage in meninges and parietal cortex over an EAE course induced by Tβ-syn or TMBP cell transfer. b–d, MRI, intravital TPLSM and immunohistochemistry were performed in the same rat at the onset of Tβ-syn-cell-induced disease. b, T1-weighted MRI images before and after Gd administration. c, TPLSM images. Left, infiltration pattern of Tβ-syn cells (green) into the leptomeninges. Red, Texas red dextran-labelled vessels, macrophages. Right, colour-coded (HiLo LUT) images highlighting the areas of dye leakage (arrows). Saturated signal, red; no signal, blue; circles, meningeal phagocytes that took up the dye during the recording time. Shown are tile-scan overview images (top) and magnified views of selected areas (bottom). d, Overview fluorescence image of a sagittal brain section (top) and magnified view of a selected cortical area (bottom) stained for ED1. Note the presence of high numbers of recruited ED1+ myeloid cells (purple) in meninges and adjacent cortex. e–h, Migration behaviour of Tβ-syn cells in the cortical grey matter. Intravital TPLSM recording performed at the peak of Tβ-syn cell cortical infiltration reveals a vigorous migratory activity of the Tβ-syn cells within the compact grey matter. e, The 30-min time-lapse trajectories. f, Number of infiltrating Tβ-syn cells. Data are mean + s.e.m., n = 3. g, Tβ-syn cell velocity (n = 340 cells). h, Superimposed trajectories over a 30-min time span recording. Σ, sum of all cell trajectory vectors divided by the number of cells (n = 30 cells, each line represents a cell). i–k, Tβ-syn cell infiltration induces neuronal damage. Histological and electron microscope analyses at the peak of Tβ-syn cell infiltration. i, Relative changes in spine density on apical dendrites (cortical layer 2/3) measured by confocal microscopy in brain slices of rats transferred with the indicated antigen-specific T cells. Each dot represents a separate rat. Data are mean + s.e.m. j, Electron micrograph of an apoptotic neuron (highlighted in red, magnified view shown on the right) with a pyknotic and fragmented nucleus (asterisks) next to an intact neuron (green) with euchromatic nucleus. k, Apoptotic pyramidal neuron (N) with numerous apoptotic bodies (i) and pyknotic nucleus (ii) shown at higher magnification. Note the dendritic process (D) that emerges from the strongly altered cell body. l, m, Tβ-syn cell infiltration induces microglial activation. l, Anti-IBA1 staining of cortical tissue performed at the indicated time points after Tβ-syn cell transfer. Overviews pictures with magnified areas and representative 3D-reconstructed images of IBA1+ microglial cells (shown in greyscale). m, Quantification of the morphological parameters of IBA1+ microglial cells. Data are mean + s.d. i, Mann–Whitney U-test. m, One-way ANOVA with Dunnett’s multiple comparison correction for process length and segments and two-way ANOVA with Sidak correction for multiple comparisons for number of intersections. **P < 0.01, ***P < 0.001, ****P < 0.0001.
Extended Data Fig. 9 Consecutive Tβ-syn cell attacks result in cortical grey matter degeneration.
a, Relapsing-remitting clinical disease bouts induced by repeated Tβ-syn cell transfer. Clinical score (bars) and relative weight changes (lines) in transgenic rats transferred four consecutive times with Tβ-syn or TOVA cells. Data are mean ± s.e.m. Representative data of four independent experiments. b, Consecutive Tβ-syn-cell-mediated grey matter inflammation induces reiterated episodes of BBB leakage. Quantification of Gd enhancement in the indicated brain compartments performed on T1-weighted MRI images acquired at the onset of disease after the first and fourth T cell transfer. Each line represents one individual rat. Representative data of 2 independent experiments (n = 5 per group per experiment). c, Relapsing-remitting clinical disease bouts induced by repeated TMBP cell transfer. Clinical score (bars) and relative weight changes (lines) in transgenic rats transferred four consecutive times with TMBP cells. Data are mean ± s.e.m. d, TMBP-cell-induced disease bouts do not cause BBB leakage. Quantification of Gd enhancement in the indicated brain compartments performed as in b. e–i, Repeated Tβ-syn-cell-induced autoimmune inflammation induces long-term damage in the cortical grey matter. Rats were transferred four times with Tβ-syn or TOVA cells. Histological analysis of the cerebral cortex was performed three weeks after the peak of the fourth disease bout. e, Very few residual immune infiltrates are detectable in the recovery stage of relapsing grey matter disease. Top, representative haematoxylin and eosin (HE)-stained coronal paraffin sections of brain cortex showing the presence of very limited infiltrates in the leptomeninges (arrows) of a 4× Tβ-syn cell-transferred rat. Note, however, the thickened leptomeninges, increased vascularization (V) in the cortical layer I (I) and enrichment of cells with small nuclei, representing microglia (examples shown by arrowheads). Bottom, representative CD43 (W3/13) staining on frozen sections of 4× TOVA and 4× Tβ-syn cell-transferred rats. The latter shows few CD43+ lymphocytes within the leptomeninges (arrows) and around cortical vessels (arrowheads). f, Persistent grey matter gliosis induced by 4× Tβ-syn cell transfer. Confocal images of cortical tissue stained with anti-IBA1 (left) or anti-GFAP antibodies (right). g, Rarefaction and disarrangement of neuronal processes. Representative neurofilament stainings of cortical grey matter on 4× Tβ-syn or 4× TOVA-cell-transferred rats. In corresponding regions of the motor cortex, the thickness, length and number of straight filaments (arrowheads) are reduced in rats that have received 4× Tβ-syn cells. h, i, Repeated episodes of grey matter inflammation do not affect white matter thickness. h, Histological analysis of corpus callosum thickness. Mean corpus callosum thickness across all control samples for the analysed anterior–posterior interval was set to 100%. Each data point represents relative corpus callosum thickness for one individual rat measured at the indicated distance to bregma. Lines represent fitting curves (shading, 95% confidence interval) for the respective group of rats. n = 8 for control, n = 6 for 4× Tβ-syn group from 4 independent experiments. Unpaired two-tailed t-test. i, Corpus callosum thickness determined by longitudinal MRI analysis at the indicated time over the disease course. Each line represents one individual rat. Representative data of 2 independent experiments (n = 5 per group per experiment). j, k, Enlargement of the ventricle size induced by relapsing autoimmune grey matter disease. j, Representative z projection of MRI images at the indicated time points after the first and fourth transfer of Tβ-syn or TOVA cells. k, Quantification of changes in ventricular volume over time. Representative data of 2 independent experiments (n = 5 per group per experiment). b, i, k, Two-way ANOVA with Bonferroni’s multiple comparison correction. *P < 0.05, **P < 0.01, ***P < 0.001, ****P < 0.0001.
Extended Data Fig. 10 Cytokine and chemokine receptor expression of myelin-reactive and neuronal-antigen-reactive T cells.
a, Characteristics of the donor cohort. b, Correlation between cytokine production (ELISA) and CD4+ T cell proliferation. PBMCs were stimulated with the indicated antigens. Each dot represents one patient. c, IFNγ and IL-17 production in the proliferating CD4+ T cells (n = 3). d, CD25 and ICOS expression in proliferating (CFSElow) and non-proliferating (CFSEhigh) CD4+ T cells. Flow cytometry seven days after antigenic stimulation. Representative density plots (numbers indicate frequencies as mean + s.d. percentages, n = 3) and quantification of mean fluorescence intensities (MFI, n = 4). e, Gene expression levels of IFNG, IL17A, IL4, CXCR3 and CCR6, determined by quantitative PCR (normalized to RPL13A). PBMCs isolated from patients with MS were stimulated with MBP or β-synuclein. After seven days, cytokine expression was determined in proliferating (CFSElow) and non-proliferating (CFSEhigh) CD3+CD4+ T cells before and after stimulation with CD3 antibodies. Chemokine expression was determined just before CD3 stimulation. Analyses were performed with PBMCs of patients with MS who had a proliferative response to both MBP and β-synuclein. Numbers of analysed patients are indicated. Data are mean + s.e.m. f, Correlation between percentage of CD4+ T cells proliferating in response to the indicated antigens and the grade of disability in patients with MS and Parkinson’s disease. Disability was measured by the expanded disability status scale (EDSS) or the Hoehn and Yahr score for patients with MS and Parkinson’s disease, respectively. g, Correlation between percentage of CD3+CD4+ T cells proliferating in response to the indicated antigens and the disease duration. b, Linear regression analysis. c–e, Paired two-tailed t-test. f, g, Pearson’s r2. *P < 0.05, **P < 0.01, ***P < 0.001; ns, not significant.
Supplementary information
Reporting Summary
Video 1
Clinical disease induced by TbSYN or TMBP cells. Video showing differences in clinical symptoms after transfer of TbSYN (first part of video) or TMBP cells (second part of video).
Video 2
Invasion of TbSYN cells from leptomeninges into the adjacent brain GM and of TMBP cells from leptomeninges into the adjacent SC WM parenchyma. Intravital TPLSM recordings of TbSYN (first part of video) or TMBP cells (second part of video) performed on brain cortex and thoracic SC 4 days p.t. 30 min time-lapse recordings and corresponding time-projections. Green: antigen-specific T cells; red: blood vessels and meningeal phagocytes. Scale bar: 100 µm. Time interval: 30 sec. Representative recordings of five independent experiments.
Video 3
Locomotion behaviour of TbSYN and TMBP cells in the leptomeningeal vessels of brain and SC. Intravital TPLSM recordings of brain cortex (first part of video) and thoracic SC (second part of video) performed 2.5 days p.t. of TbSYN or TMBP cells. 30 min time-lapse videos and corresponding time-projections. During the recording time several T cells of both specificities crawled or rolled (appearing as single dots) on the leptomeningeal vessels of both brain and SC. Green: antigen specific T cells; red: blood vessels and meningeal phagocytes (labelled by i.t. injection of 70 kD Texas red dextran 24 h before imaging). Scale bar: 100 µm. Time interval: 30 sec. Representative recordings of three independent experiments.
Video 4
Locomotion behaviour of CNS-ignorant TOVA cells in the leptomeningeal vessels of brain and SC. Intravital TPLSM recordings of brain cortex and thoracic SC performed 2.5 days p.t. of TOVA cells. 30 min time-lapse recordings and corresponding time-projections. Scale bar: 100 µm. Time interval: 30 sec. Green: TOVA cells; red: blood vessels. Representative recordings of three independent experiments.
Video 5
Effect of VLA-4 and LFA-1 blockade on the adhesion of TbSYN cells to brain leptomeningeal vessels. Intravital TPLSM recordings depicting the intravascular motility behaviour of TbSYN cells 2.5 days p.t. before and after injection of the indicated integrin-blocking mAbs. 30 min time-lapse recordings and corresponding time-projections. Scale bar: 100 µm. Time interval: 30 sec. Green: TbSYN cells; red: blood vessels. Representative recordings of three independent experiments.
Video 6
Real-time detection of TbSYN-cell activation in the cerebral cortex. Intravital TPLSM recording performed on brain cortex 4 days p.t. of β-synuclein specific T cells expressing NFAT biosensor. 30 min time-lapse recordings and corresponding 3D reconstruction. Scale bar: 10 µm. Time intervals: 30 sec. Arrow: NFAT translocation from the cytosol to nucleus, indicated by the red nucleus turning yellow.
Video 7
Locomotion behaviour of CNS-ignorant TOVA cells in the cerebral cortex in absence or presence of pathogenic TbSYN cells Intravital TPLSM recording performed on brain cortex 4 days p.t. of TOVA cells alone or of TOVA together with TbSYN cells. 30 min time-lapse recordings and corresponding time-projections. Scale bar: 50 µm. Time interval: 60 sec. Red: TOVA cells; turquoise: TbSYN cells; green: blood vessels. Representative recordings of two independent experiments.
Video 8
Loss of BBB integrity during TbSYN-mediated GM disease. Intravital TPLSM recordings performed 3 min (first part of video) and 30 min (second part of video) after i.v. injection of 70 kD Texas Red dextran dye 3.5 days p.t. of TbSYN cells. In the first part of the video focal leakage of dextran is indicated by yellow arrowheads. In the second part of the video leaked dextran is taken up by meningeal phagocytes (yellow circles). The left frame shows the original composite multicolour TPLSM recording. Green: TbSYN cells; red: blood vessels and meningeal macrophages. The right frame depicts the areas of dye leakage using HiLo LUT colour-code. Red: saturated signal; blue: no signal.
Video 9
TbSYN cells in contact and engulfed by a neuron of the cortical GM. 3D-reconstruction of TbSYN cells in contact (green), partially engulfed (orange) or completely engulfed (red) by a DiI-labelled neuron (white). 3D-reconstruction from a confocal image of a brain slice labelled by DiI 4 days p.t. of TbSYN cells.
Rights and permissions
To obtain permission to re-use content from this article visit RightsLink.
About this article
Further reading
-
Multiple sclerosis enters a grey area
Nature (2019)
Comments
By submitting a comment you agree to abide by our Terms and Community Guidelines. If you find something abusive or that does not comply with our terms or guidelines please flag it as inappropriate.
